Missing-mass spectroscopy of the ${}^{12}{\rm C}(p,d)$ reaction near the $\eta^\prime$-meson production threshold
Y. K. Tanaka, K. Itahashi, H. Fujioka, Y. Ayyad, J. Benlliure, K.-T., Brinkmann, S. Friedrich, H. Geissel, J. Gellanki, C. Guo, E. Gutz, E., Haettner, M. N. Harakeh, R. S. Hayano, Y. Higashi, S. Hirenzaki, C. Hornung,, Y. Igarashi, N. Ikeno, M. Iwasaki, D. Jido
TL;DR
This study used missing-mass spectroscopy to search for $ ext{η'}$-mesic states in $^{11}$C nuclei near the production threshold, setting upper limits on their formation cross sections and constraining the $ ext{η'}$-nucleus interaction.
Contribution
First experimental search for $ ext{η'}$-mesic states in $^{11}$C using missing-mass spectroscopy near the production threshold.
Findings
No clear signals of $ ext{η'}$-mesic states observed.
Upper limits on formation cross sections established.
Constraints on $ ext{η'}$-nucleus interaction derived.
Abstract
Excitation-energy spectra of C nuclei near the -meson production threshold have been measured by missing-mass spectroscopy using the C(,) reaction. A carbon target has been irradiated with a 2.5 GeV proton beam supplied by the synchrotron SIS-18 at GSI to produce meson bound states in C nuclei. Deuterons emitted at in the reaction have been momentum-analyzed by the fragment separator (FRS) used as a high-resolution spectrometer. No distinct structure due to the formation of -mesic states is observed although a high statistical sensitivity is achieved in the experimental spectra. Upper limits on the formation cross sections of -mesic states are determined, and thereby a constraint imposed on the -nucleus interaction is discussed.
Click any figure to enlarge with its caption.
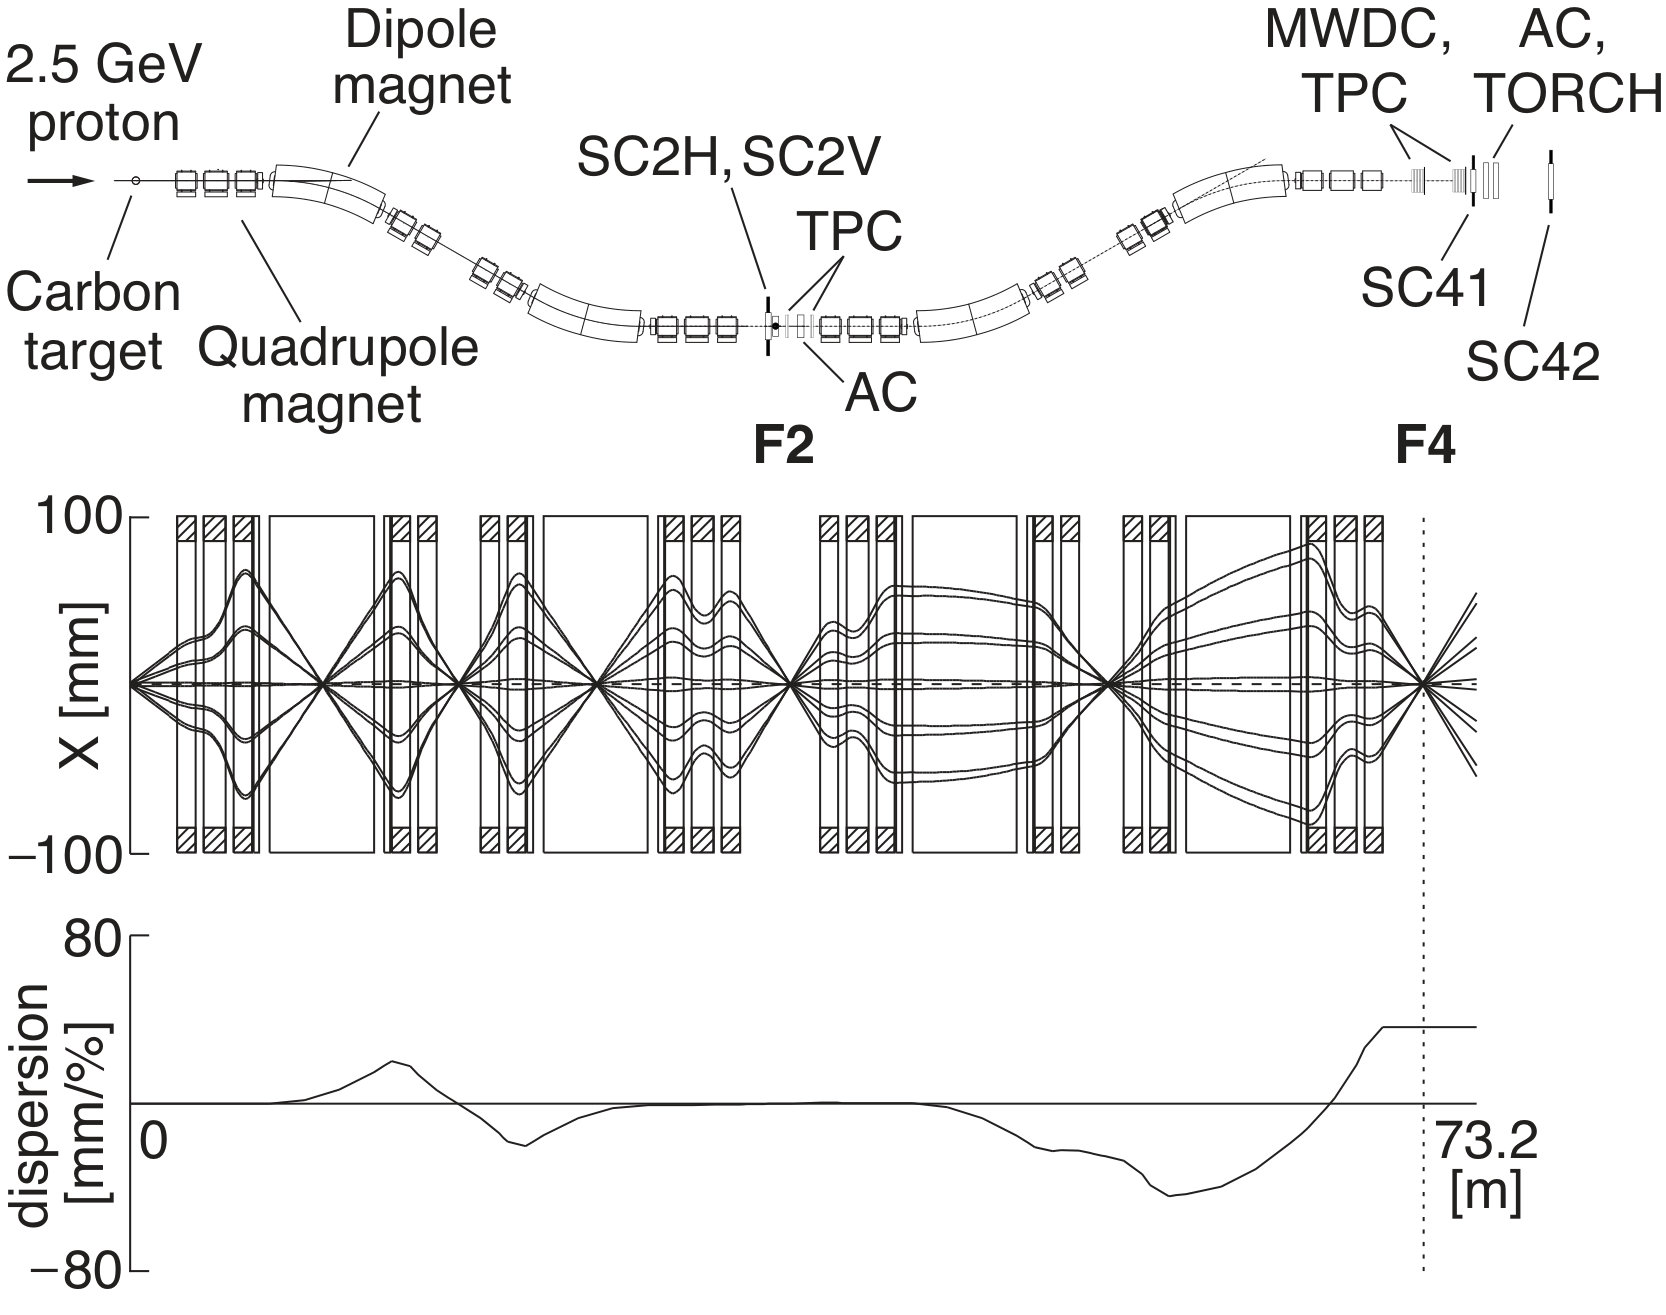 Figure 1
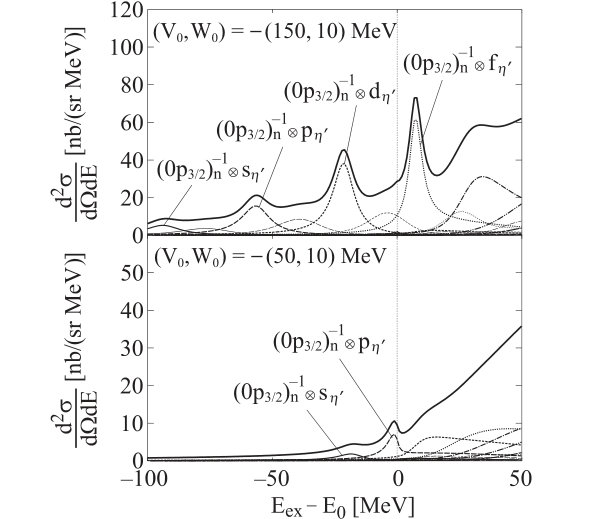 Figure 10
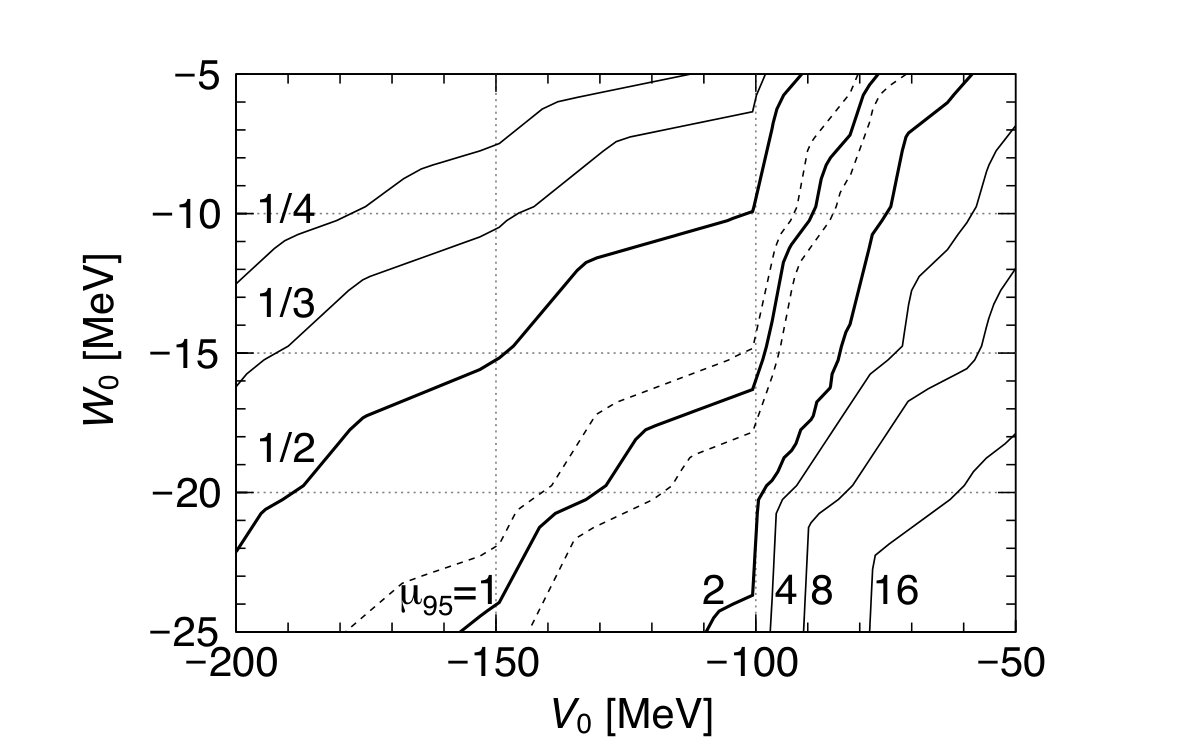 Figure 11
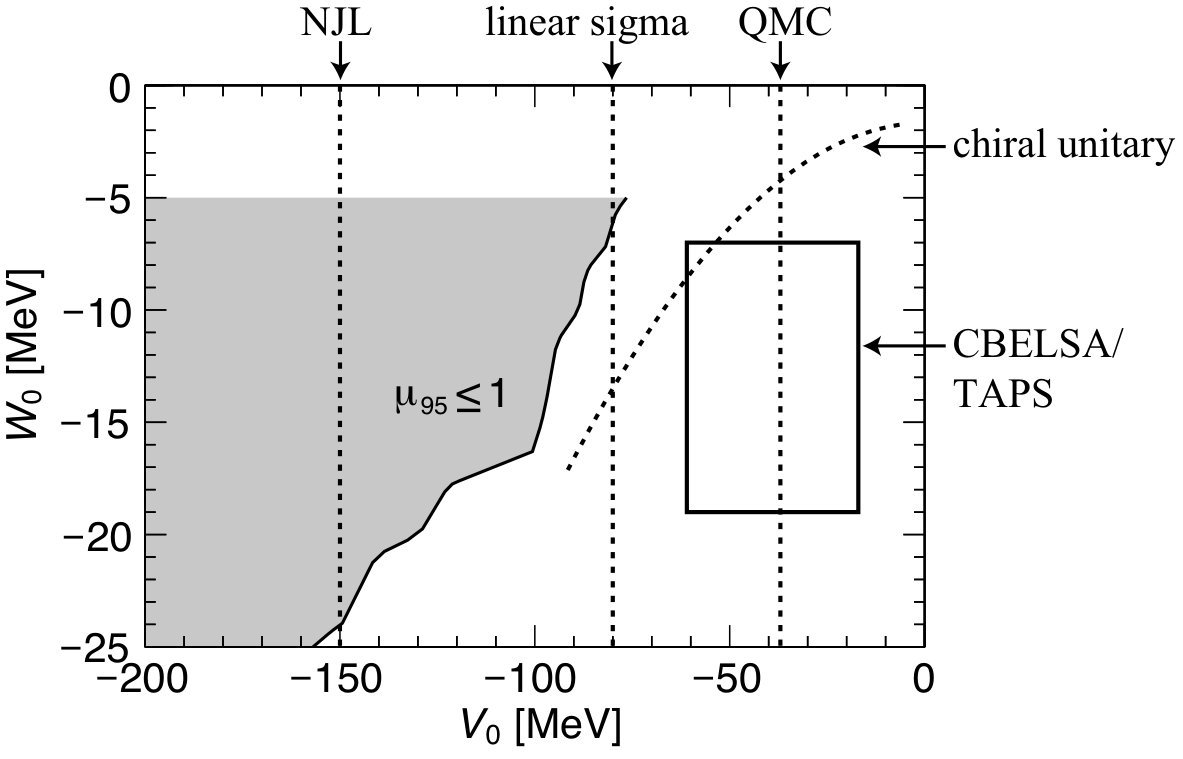 Figure 12
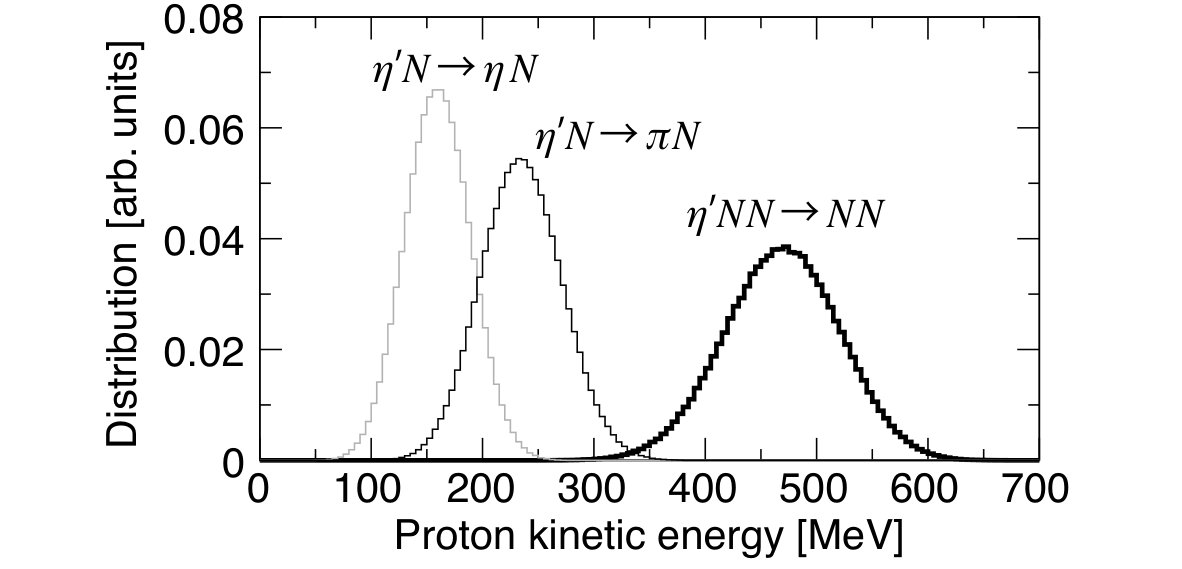 Figure 13
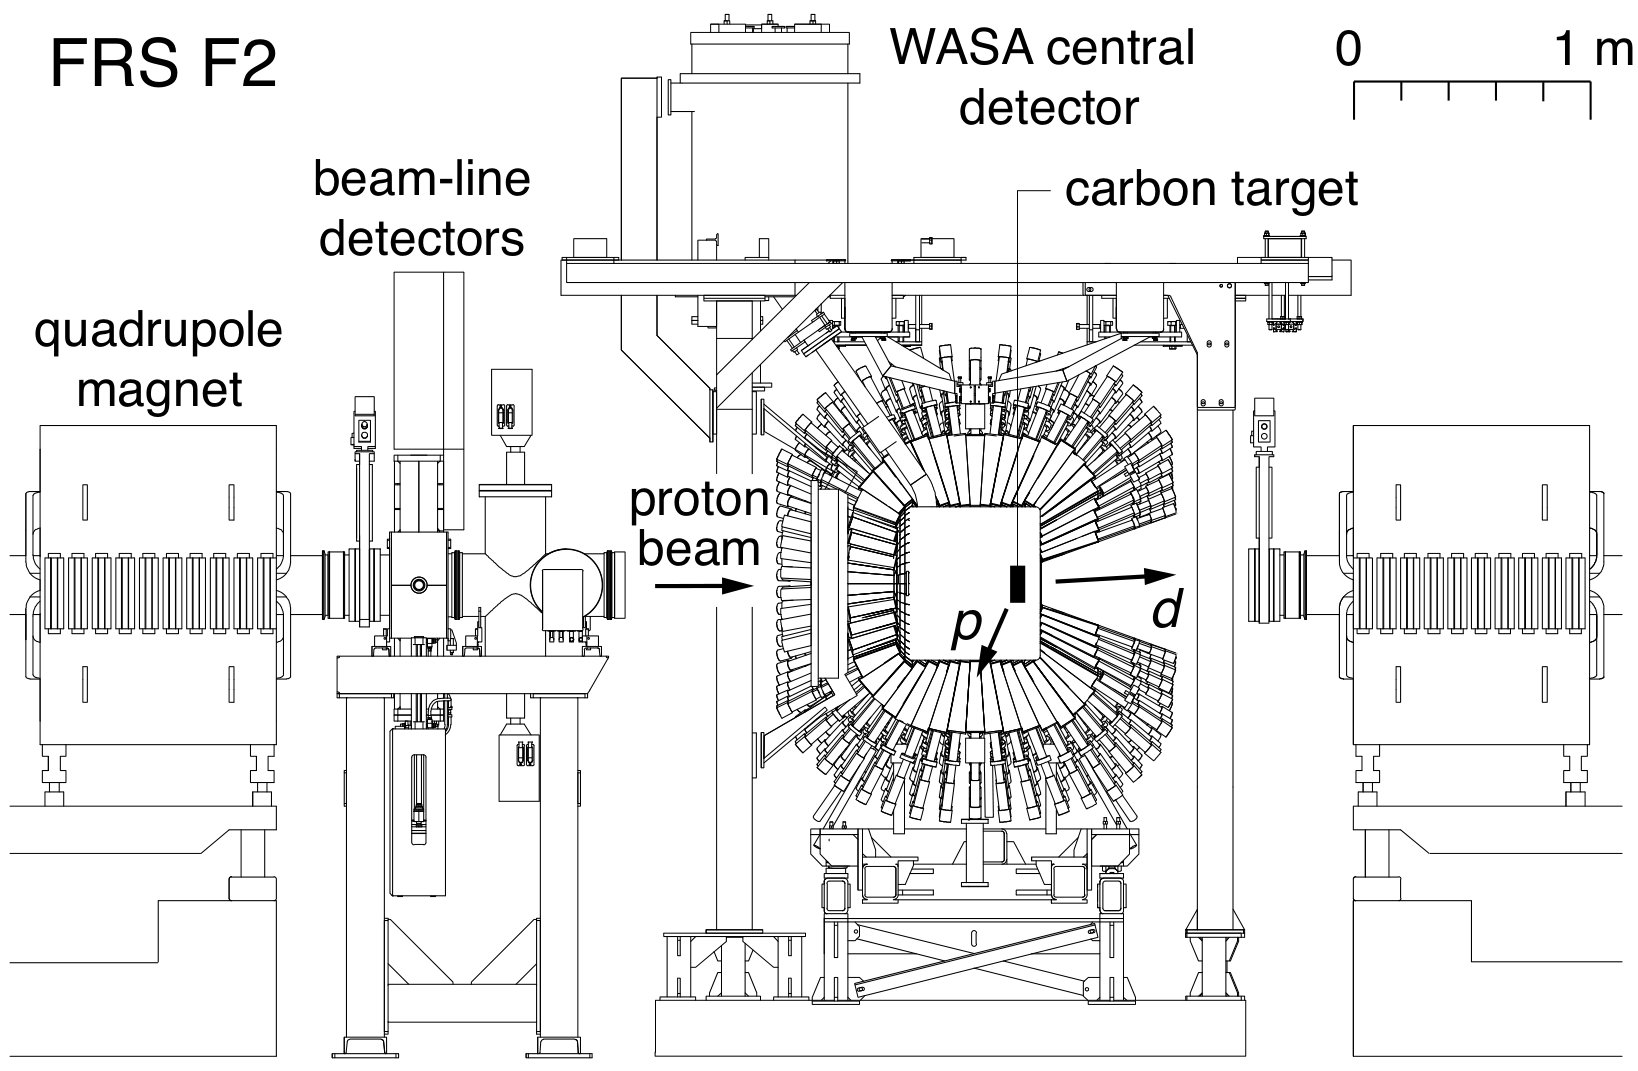 Figure 14
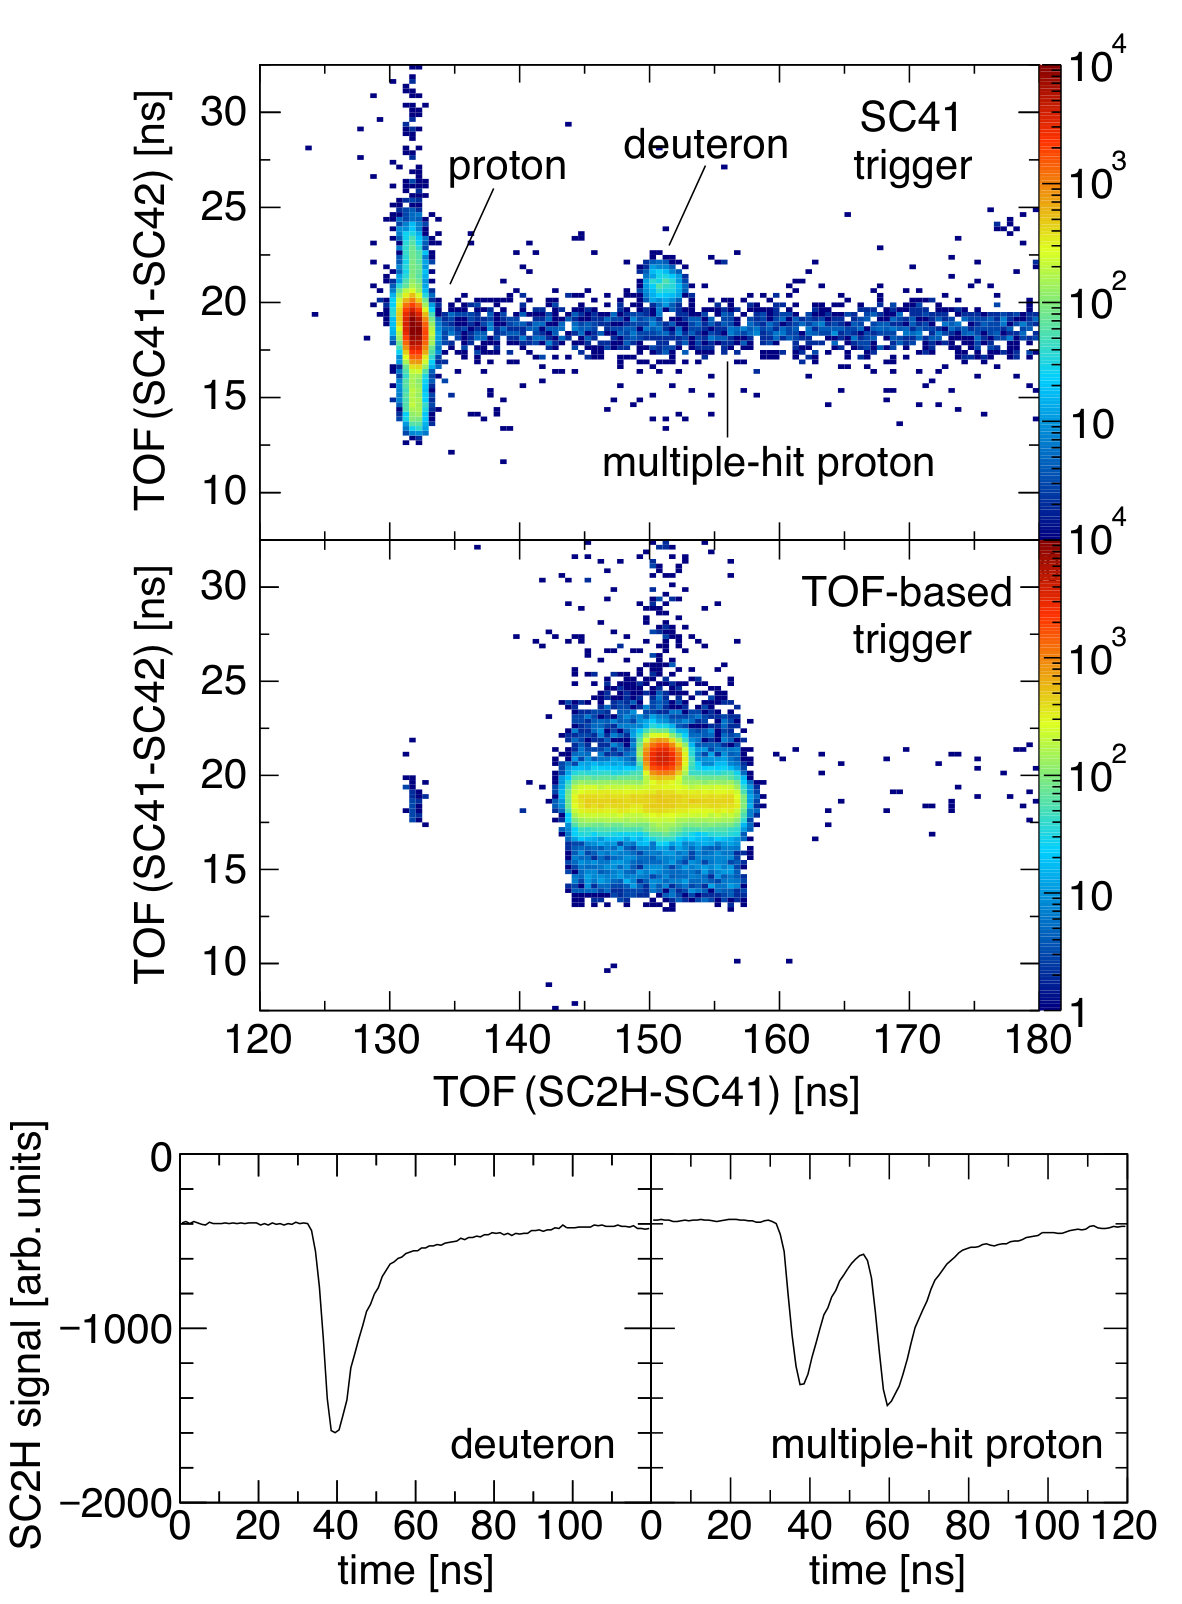 Figure 2
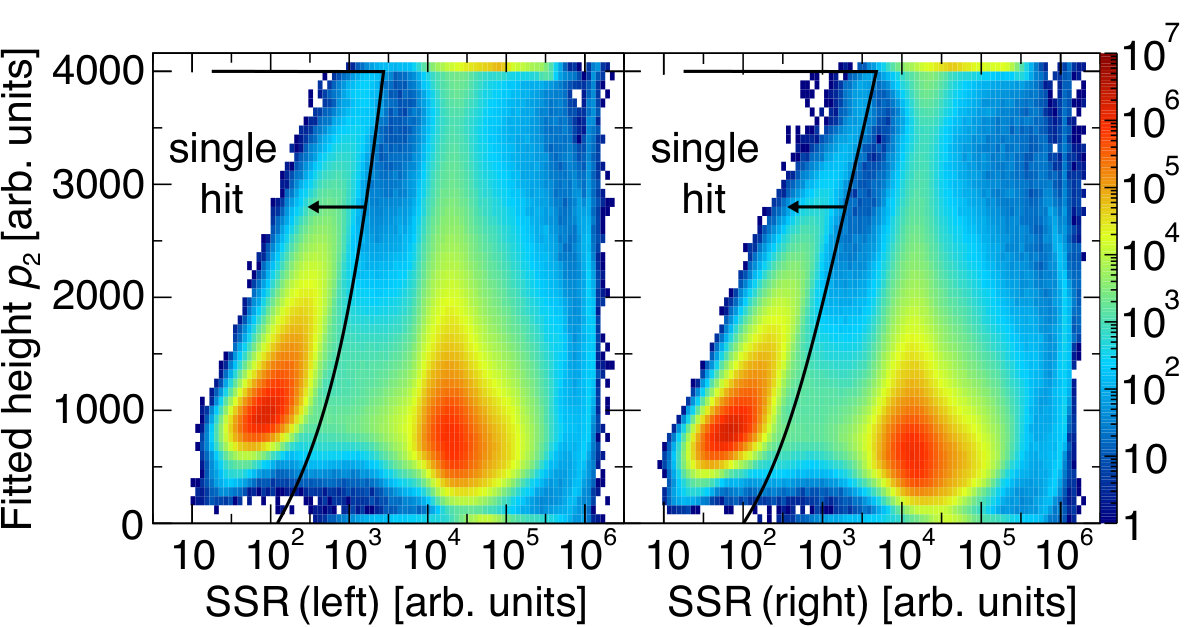 Figure 3
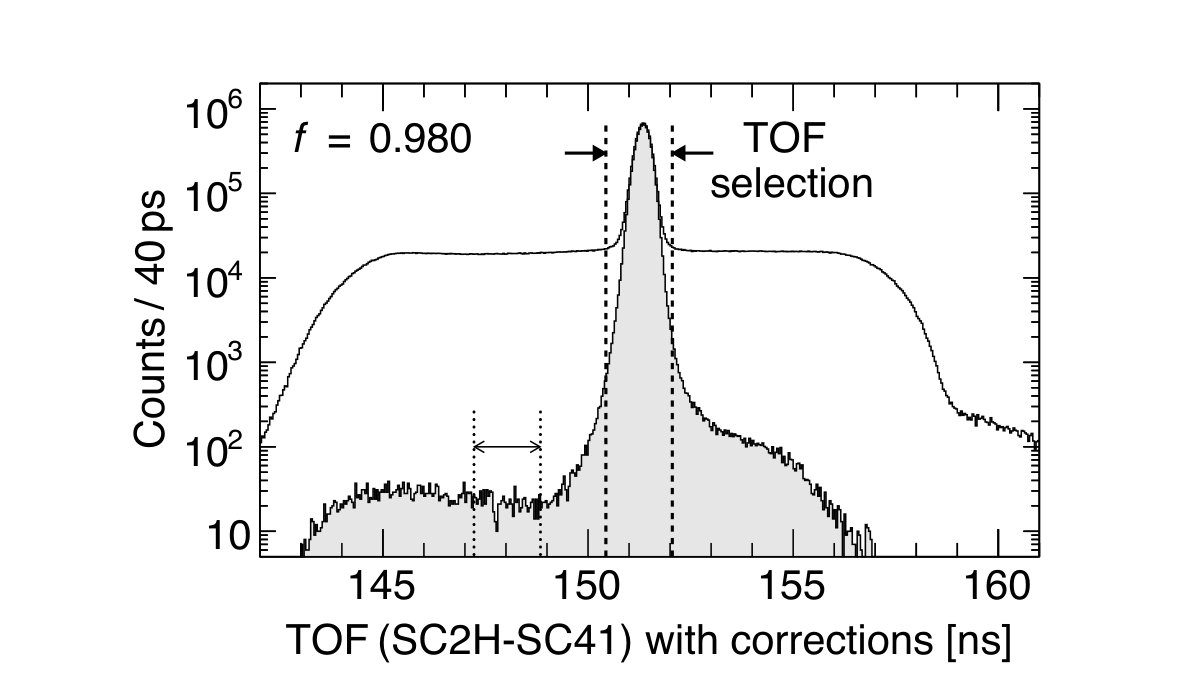 Figure 4
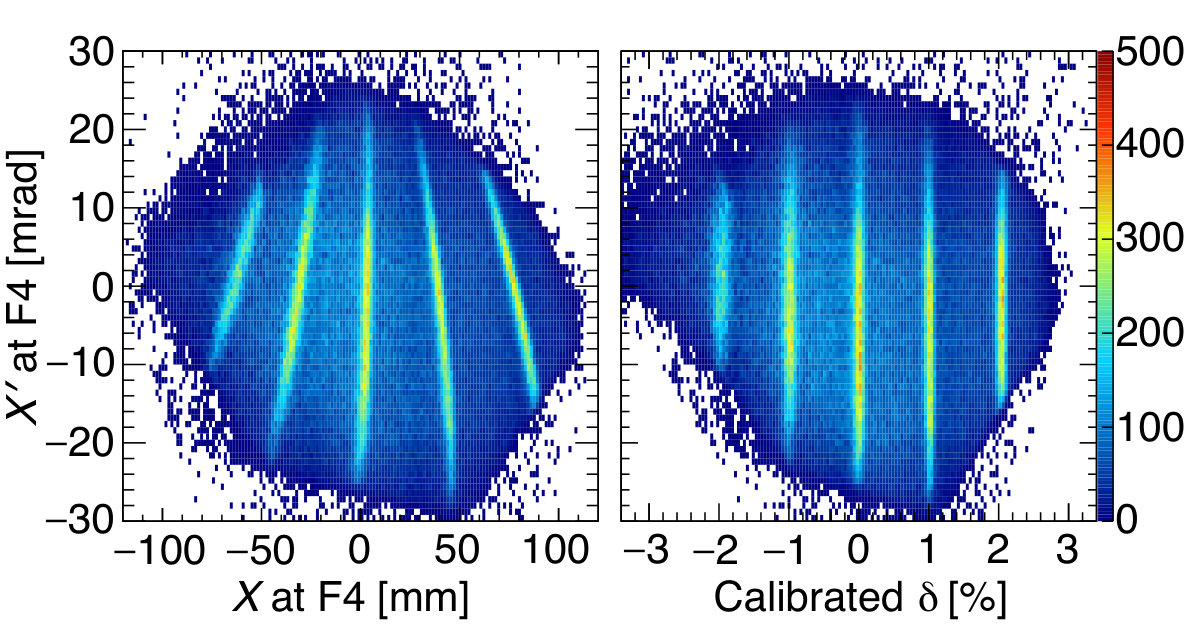 Figure 5
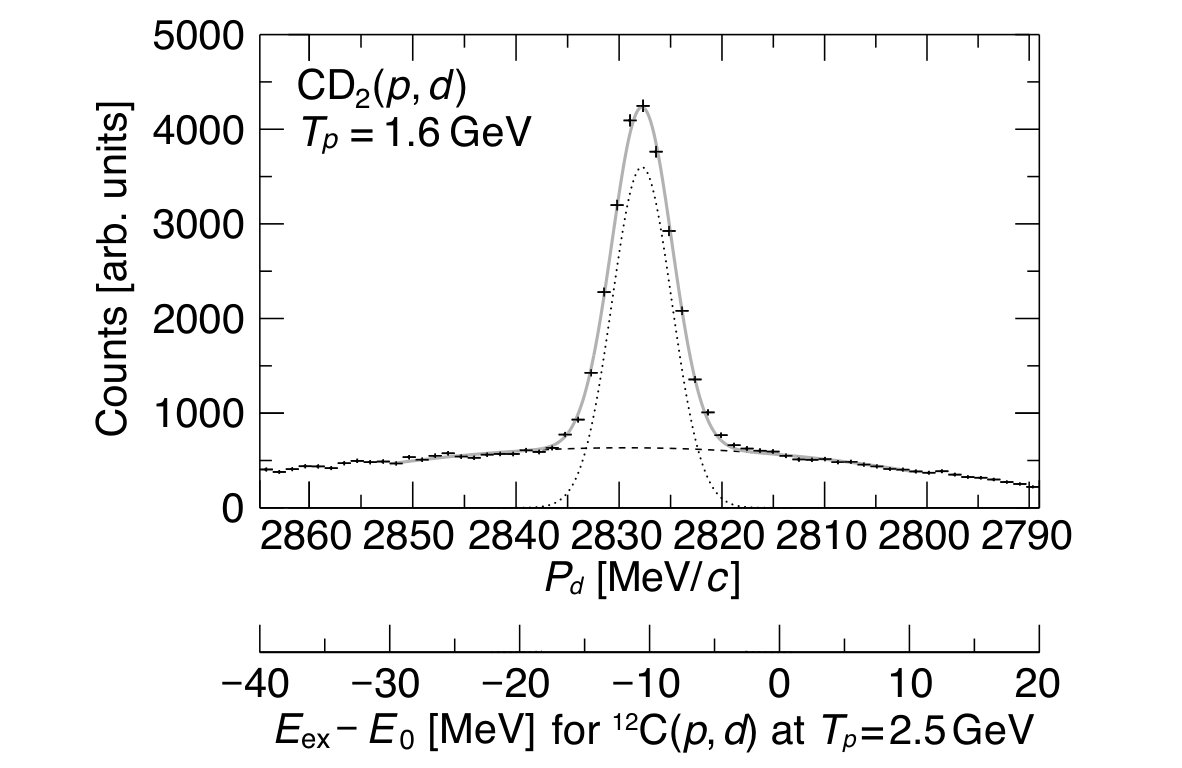 Figure 6
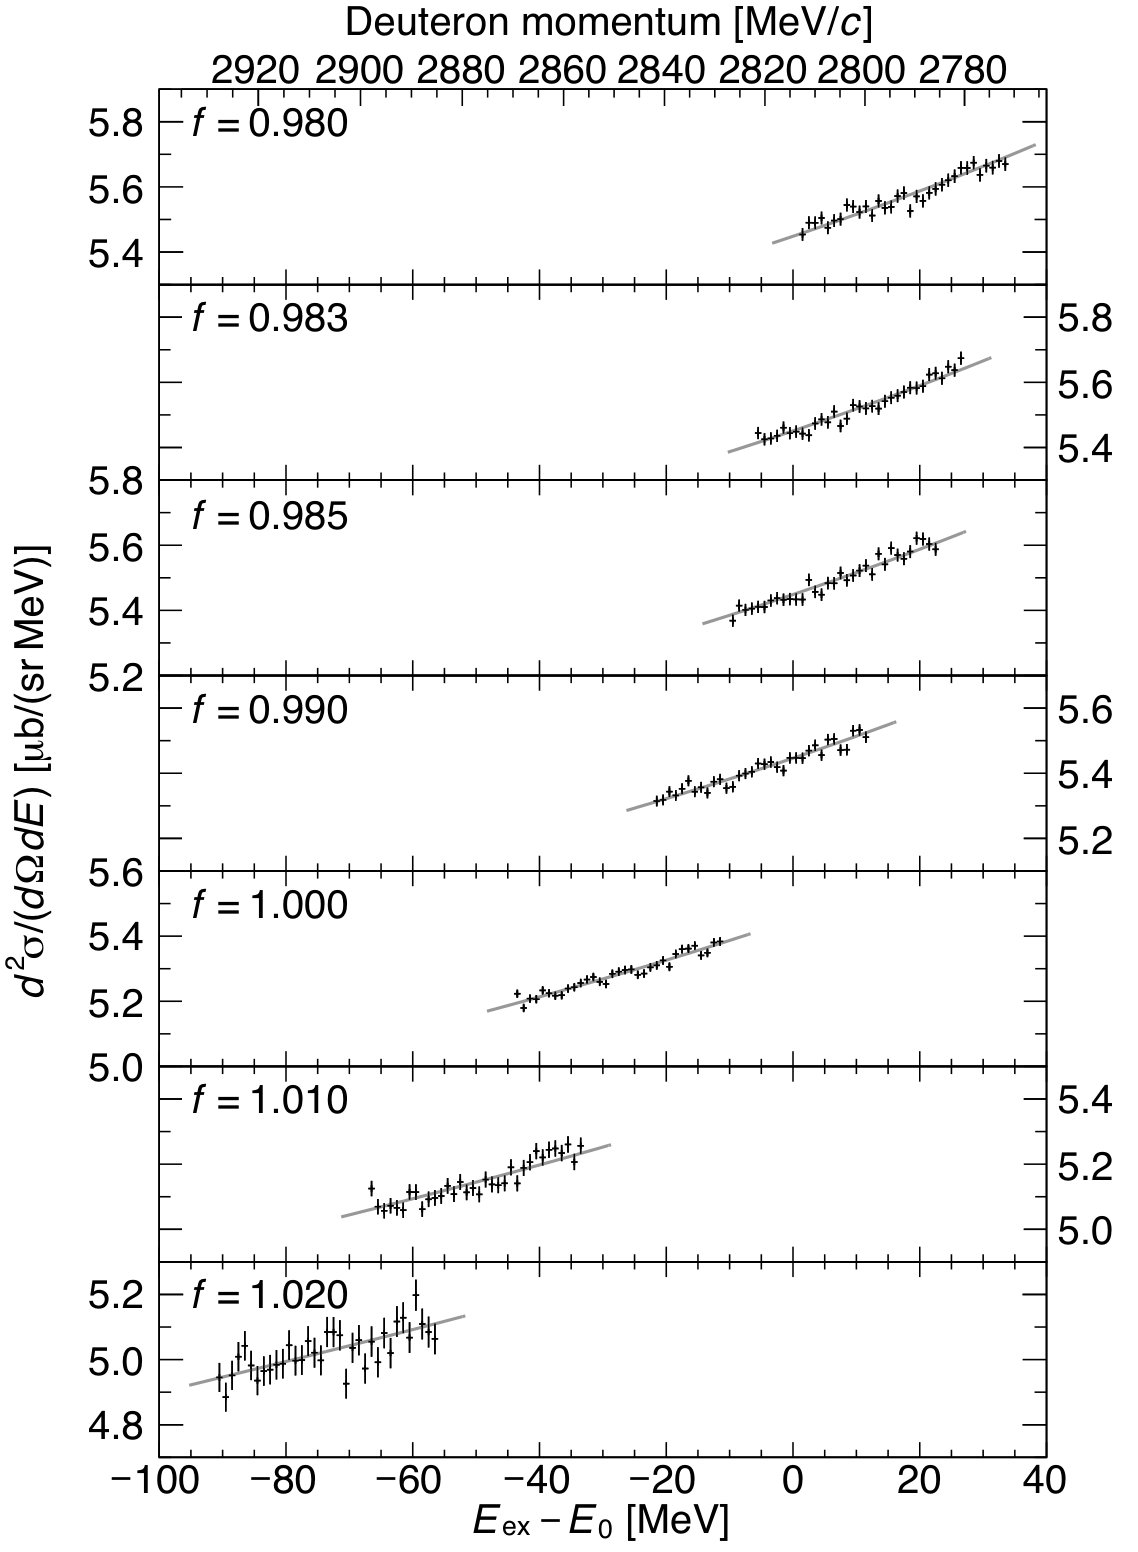 Figure 7
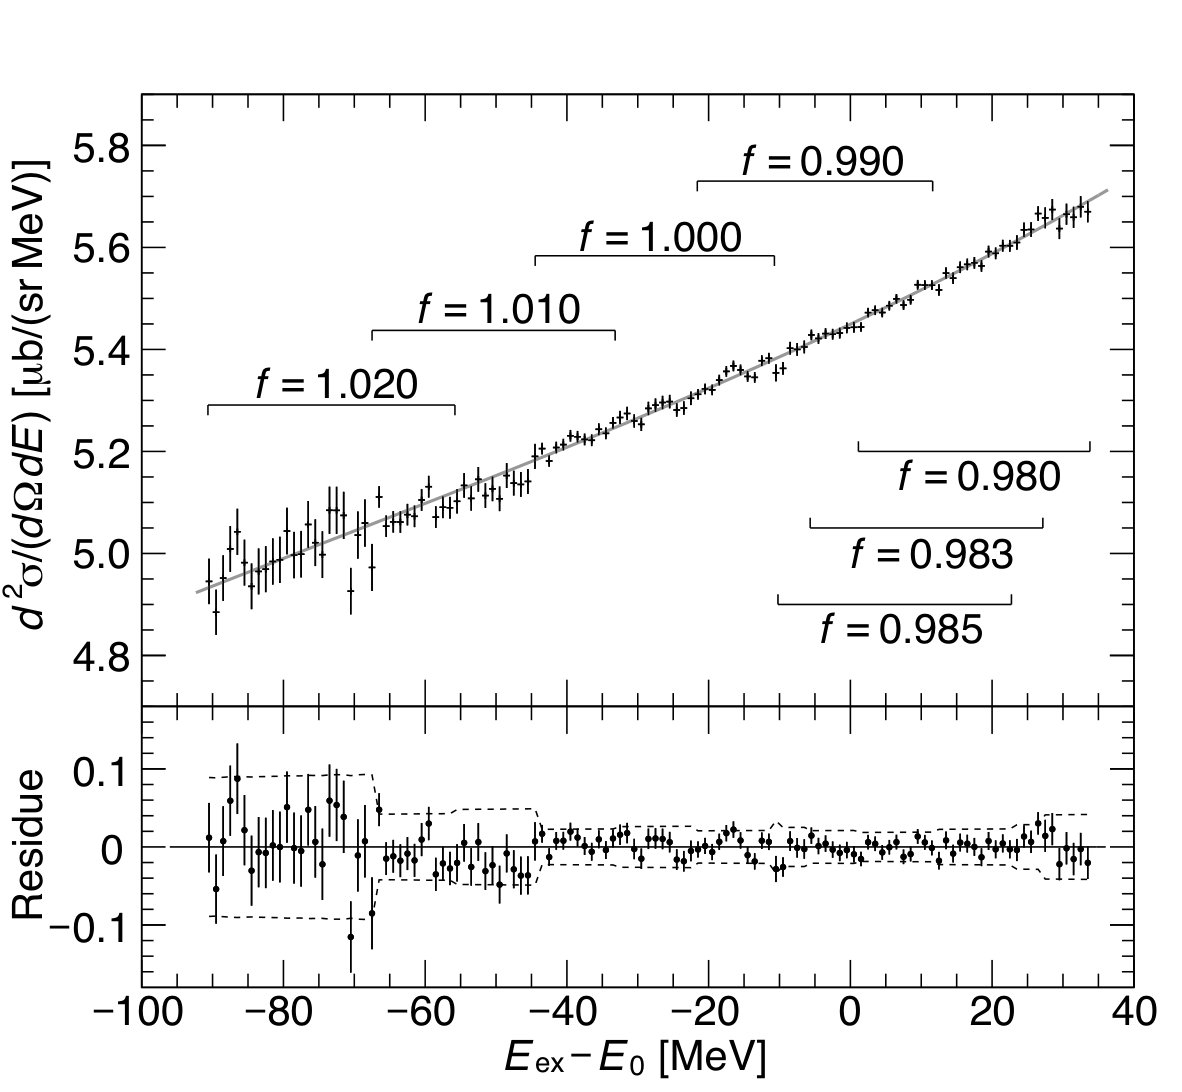 Figure 8
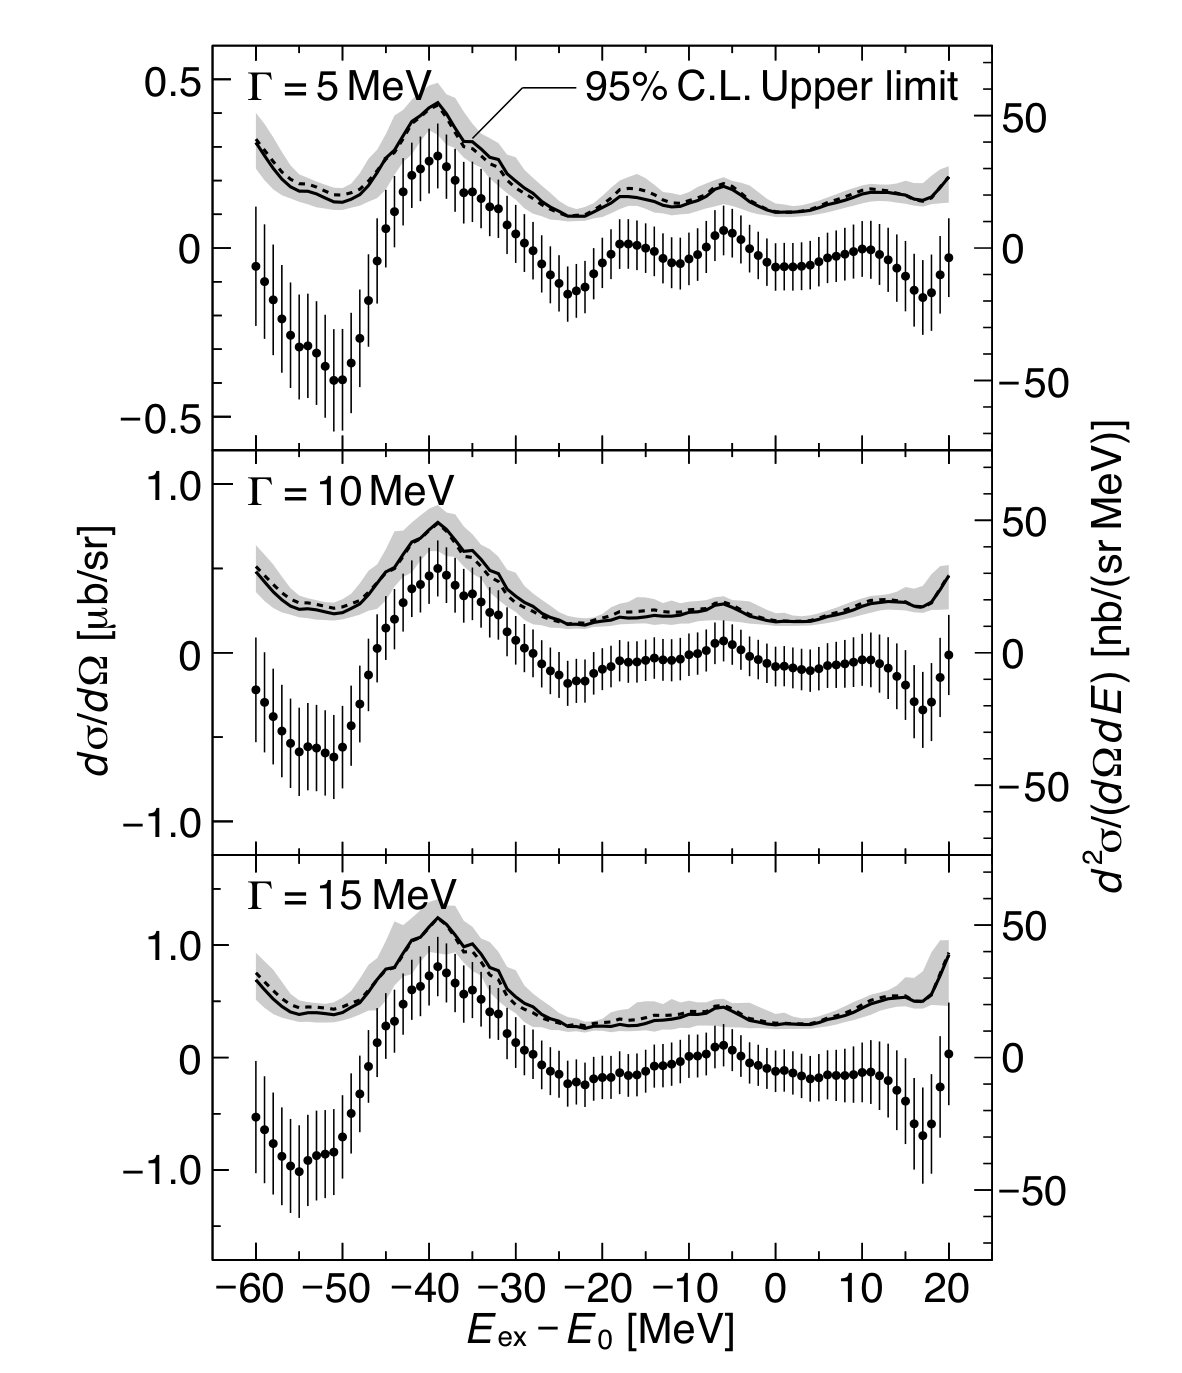 Figure 9
| Reaction | Proton energy | Target | Central momentum | Scaling factor | Duration |
|---|---|---|---|---|---|
| (MeV) | of FRS (MeV/) | for magnets | |||
| 12C(,) | 2499.1 2.0 | C (4115 1 mg/cm2) | 2771.4 | 0.980 | 9.7 hour |
| 2779.9 | 0.983 | 9.3 hour | |||
| 2785.6 | 0.985 | 9.9 hour | |||
| 2799.7 | 0.990 | 10.9 hour | |||
| 2828.0 | 1.000 | 23.0 hour | |||
| 2856.3 | 1.010 | 5.9 hour | |||
| 2884.6 | 1.020 | 2.0 hour | |||
| D(,) | 1621.6 0.8 | CD2 (1027 2 mg/cm2) | 2771.4 | 0.980 | 5 set |
| 2779.9 | 0.983 | 2 set | |||
| 2785.6 | 0.985 | 1 set | |||
| 2799.7 | 0.990 | 5 set | |||
| 2813.9 | 0.995 | 1 set | |||
| 2828.0 | 1.000 | 8 set | |||
| 2842.1 | 1.005 | 1 set | |||
| 2856.3 | 1.010 | 3 set | |||
| 2884.6 | 1.020 | 1 set | |||
| D(,) | 2499.1 2.0 | CD2 (4022 9 mg/cm2) | 3809.3 | 1.347 | 1.2 hour |
| (MeV) | (MeV) | ||
|---|---|---|---|
Peer Reviews
No public reviews on file for this paper yet. If you reviewed it on a platform where reviews are public (OpenReview, ICLR, NeurIPS, ICML), you can paste yours below so the community can read it here.
Videos
No videos yet. Explain this paper in a talk, walkthrough, or lecture? Add one.
Present address: ]GSI Helmholtzzentrum für Schwerionenforschung GmbH, Planckstraße 1, 64291 Darmstadt, Germany
-PRiME/Super-FRS Collaboration
Missing-mass spectroscopy of the reaction
near the -meson production threshold
Y. K. Tanaka
[
The University of Tokyo, 7-3-1 Hongo, Bunkyo, 113-0033 Tokyo, Japan
K. Itahashi
Nishina Center for Accelerator-Based Science, RIKEN, 2-1 Hirosawa, Wako, 351-0198 Saitama, Japan
H. Fujioka
Kyoto University, Kitashirakawa-Oiwakecho, Sakyo-ku, 606-8502 Kyoto, Japan
Y. Ayyad
RCNP, Osaka University, 10-1 Mihogaoka, Ibaraki, 567-0047 Osaka, Japan
J. Benlliure
Universidade de Santiago de Compostela, 15782 Santiago de Compostela, Spain
K.-T. Brinkmann
Universität Giessen, Heinrich-Buff-Ring 16, 35392 Giessen, Germany
S. Friedrich
Universität Giessen, Heinrich-Buff-Ring 16, 35392 Giessen, Germany
H. Geissel
Universität Giessen, Heinrich-Buff-Ring 16, 35392 Giessen, Germany
GSI Helmholtzzentrum für Schwerionenforschung GmbH, Planckstraße 1, 64291 Darmstadt, Germany
J. Gellanki
KVI-CART, University of Groningen, Zernikelaan 25, 9747 AA Groningen, the Netherlands
C. Guo
Beihang University, Xueyuan Road 37, Haidian District, 100191 Beijing, China
E. Gutz
Universität Giessen, Heinrich-Buff-Ring 16, 35392 Giessen, Germany
E. Haettner
GSI Helmholtzzentrum für Schwerionenforschung GmbH, Planckstraße 1, 64291 Darmstadt, Germany
M. N. Harakeh
KVI-CART, University of Groningen, Zernikelaan 25, 9747 AA Groningen, the Netherlands
R. S. Hayano
The University of Tokyo, 7-3-1 Hongo, Bunkyo, 113-0033 Tokyo, Japan
Y. Higashi
Nara Women’s University, Kita-Uoya Nishi-Machi, 630-8506 Nara, Japan
S. Hirenzaki
Nara Women’s University, Kita-Uoya Nishi-Machi, 630-8506 Nara, Japan
C. Hornung
Universität Giessen, Heinrich-Buff-Ring 16, 35392 Giessen, Germany
Y. Igarashi
KEK, 1-1 Oho, Tsukuba, 305-0801 Ibaraki, Japan
N. Ikeno
Tottori University, 4-101 Koyamacho-minami, 680-8551 Tottori, Japan
M. Iwasaki
Nishina Center for Accelerator-Based Science, RIKEN, 2-1 Hirosawa, Wako, 351-0198 Saitama, Japan
D. Jido
Tokyo Metropolitan University, 1-1 Minami-Osawa, Hachioji, 192-0397 Tokyo, Japan
N. Kalantar-Nayestanaki
KVI-CART, University of Groningen, Zernikelaan 25, 9747 AA Groningen, the Netherlands
R. Kanungo
Saint Mary’s University, 923 Robie Street, Halifax, Nova Scotia B3H 3C3, Canada
R. Knoebel
Universität Giessen, Heinrich-Buff-Ring 16, 35392 Giessen, Germany
GSI Helmholtzzentrum für Schwerionenforschung GmbH, Planckstraße 1, 64291 Darmstadt, Germany
N. Kurz
GSI Helmholtzzentrum für Schwerionenforschung GmbH, Planckstraße 1, 64291 Darmstadt, Germany
V. Metag
Universität Giessen, Heinrich-Buff-Ring 16, 35392 Giessen, Germany
I. Mukha
GSI Helmholtzzentrum für Schwerionenforschung GmbH, Planckstraße 1, 64291 Darmstadt, Germany
T. Nagae
Kyoto University, Kitashirakawa-Oiwakecho, Sakyo-ku, 606-8502 Kyoto, Japan
H. Nagahiro
Nara Women’s University, Kita-Uoya Nishi-Machi, 630-8506 Nara, Japan
M. Nanova
Universität Giessen, Heinrich-Buff-Ring 16, 35392 Giessen, Germany
T. Nishi
Nishina Center for Accelerator-Based Science, RIKEN, 2-1 Hirosawa, Wako, 351-0198 Saitama, Japan
H. J. Ong
RCNP, Osaka University, 10-1 Mihogaoka, Ibaraki, 567-0047 Osaka, Japan
S. Pietri
GSI Helmholtzzentrum für Schwerionenforschung GmbH, Planckstraße 1, 64291 Darmstadt, Germany
A. Prochazka
GSI Helmholtzzentrum für Schwerionenforschung GmbH, Planckstraße 1, 64291 Darmstadt, Germany
C. Rappold
GSI Helmholtzzentrum für Schwerionenforschung GmbH, Planckstraße 1, 64291 Darmstadt, Germany
M. P. Reiter
GSI Helmholtzzentrum für Schwerionenforschung GmbH, Planckstraße 1, 64291 Darmstadt, Germany
J. L. Rodríguez-Sánchez
Universidade de Santiago de Compostela, 15782 Santiago de Compostela, Spain
C. Scheidenberger
Universität Giessen, Heinrich-Buff-Ring 16, 35392 Giessen, Germany
GSI Helmholtzzentrum für Schwerionenforschung GmbH, Planckstraße 1, 64291 Darmstadt, Germany
H. Simon
GSI Helmholtzzentrum für Schwerionenforschung GmbH, Planckstraße 1, 64291 Darmstadt, Germany
B. Sitar
Comenius University Bratislava, Mlynská dolina, 842 48 Bratislava, Slovakia
P. Strmen
Comenius University Bratislava, Mlynská dolina, 842 48 Bratislava, Slovakia
B. Sun
Beihang University, Xueyuan Road 37, Haidian District, 100191 Beijing, China
K. Suzuki
Stefan-Meyer-Institut für subatomare Physik, Boltzmangasse 3, 1090 Vienna, Austria
I. Szarka
Comenius University Bratislava, Mlynská dolina, 842 48 Bratislava, Slovakia
M. Takechi
Niigata University, 8050 Ikarashi 2-no-cho, Nishi-ku, 950-2181 Niigata, Japan
I. Tanihata
RCNP, Osaka University, 10-1 Mihogaoka, Ibaraki, 567-0047 Osaka, Japan
Beihang University, Xueyuan Road 37, Haidian District, 100191 Beijing, China
S. Terashima
Beihang University, Xueyuan Road 37, Haidian District, 100191 Beijing, China
Y. N. Watanabe
The University of Tokyo, 7-3-1 Hongo, Bunkyo, 113-0033 Tokyo, Japan
H. Weick
GSI Helmholtzzentrum für Schwerionenforschung GmbH, Planckstraße 1, 64291 Darmstadt, Germany
E. Widmann
Stefan-Meyer-Institut für subatomare Physik, Boltzmangasse 3, 1090 Vienna, Austria
J. S. Winfield
GSI Helmholtzzentrum für Schwerionenforschung GmbH, Planckstraße 1, 64291 Darmstadt, Germany
X. Xu
GSI Helmholtzzentrum für Schwerionenforschung GmbH, Planckstraße 1, 64291 Darmstadt, Germany
H. Yamakami
Kyoto University, Kitashirakawa-Oiwakecho, Sakyo-ku, 606-8502 Kyoto, Japan
J. Zhao
Beihang University, Xueyuan Road 37, Haidian District, 100191 Beijing, China
Abstract
Excitation-energy spectra of 11C nuclei near the -meson production threshold have been measured by missing-mass spectroscopy using the 12C(,) reaction. A carbon target has been irradiated with a 2.5 GeV proton beam supplied by the synchrotron SIS-18 at GSI to produce meson bound states in 11C nuclei. Deuterons emitted at in the reaction have been momentum-analyzed by the fragment separator (FRS) used as a high-resolution spectrometer. No distinct structure due to the formation of -mesic states is observed although a high statistical sensitivity is achieved in the experimental spectra. Upper limits on the formation cross sections of -mesic states are determined, and thereby a constraint imposed on the -nucleus interaction is discussed.
pacs:
13.60.Le, 14.40.Be, 25.40.Ve, 21.85.+d
I Introduction
Understanding hadron masses is one of the major subjects in contemporary hadron physics. Studies of the light pseudoscalar mesons are of particular importance, since they have close relations to fundamental symmetries in quantum chromodynamics (QCD). The flavor-octet mesons are considered to be Nambu-Goldstone bosons associated with spontaneous breaking of chiral symmetry, leading to relatively small masses of the , , and mesons. In contrast, the meson has an exceptionally large mass of MeV/, which has attracted interest known as the “U(1) problem” Weinberg1975 . Theoretically, the large mass can be explained by the explicit breaking of symmetry owing to quantum anomaly effects in QCD Witten1979 ; Veneziano1979 . This anomaly effect on the mass is expected to manifest itself under the presence of chiral symmetry breaking Lee1996 ; Jido2012 .
In finite baryon density, properties of the mesons may be modified from those in the vacuum due to partial restoration of chiral symmetry Hayano2010 ; Leupold2010 ; Metag2017 . For the meson, the reduction of the mass is expected through a weakening of the anomaly effect Jido2012 and also predicted in various theoretical models. For example, about 150 MeV/ reduction at the nuclear saturation density is predicted by the Nambu–Jona-Lasinio (NJL) model Costa2005 ; Nagahiro2006 , 80 MeV/ by the linear sigma model Sakai2013 , and 37 MeV/ by the quark meson coupling (QMC) model Bass2006 . Investigation of such a modification would yield novel insights into the mechanism of the meson mass generation as well as the vacuum structure of QCD.
Meson-nucleus bound states open a unique possibility of directly probing in-medium meson properties. A well-established example of such systems is the deeply-bound states in heavy nuclei, where a meson is bound near the nuclear surface by the superposition of the attractive Coulomb interaction and the repulsive -wave strong interaction. These states have been discovered and studied in missing-mass spectroscopy of the (,3He) reaction Yamazaki1996 ; ItahashiGilg2000 ; Geissel2002 . A large overlap between a meson and a nucleus in well-defined quantum bound states allows the extraction of information on a modification of the isovector part of the -wave pion-nucleus potential, leading to a quantitative evaluation of partial restoration of chiral symmetry at finite nuclear density Suzuki2004 ; Kolomeitsev2003 ; Jido2008 ; Yamazaki2012 .
In the case of neutral mesons Metag2017 , bound states may be formed only via the strong interaction, if the attraction between a meson and a nucleus is strong enough. In-medium meson properties, the mass shift and width at the nuclear saturation density , are incorporated in the meson-nucleus potential as by relations and , where denotes the nuclear density distribution. A small imaginary potential compared with the real part, i.e., , is required for the existence of bound states as discrete levels. This condition may be satisfied for the meson, as described below.
Very limited information on the -nucleus interaction is currently available. On the theoretical side, the predictions for the -mass reduction Costa2005 ; Nagahiro2006 ; Sakai2013 ; Bass2006 suggest the real part of the potential in the range from MeV to MeV. On the experimental side, the CBELSA/TAPS collaboration deduced the real part as MeV from momentum distributions and excitation functions in photo-production on nuclear targets Nanova2013 ; Nanova2016 . They also evaluated the imaginary part of MeV by measuring transparency ratios as a function of the mass number of the target nuclei Nanova2012 and as a function of momentum Friedrich2016 . Such a small imaginary part relative to the real part implies the possibility of observing a bound state as a distinct peak structure. In the meantime, the real part of the scattering length for the -proton interaction has been extracted from measurements of the reaction close to its threshold to be fm Czerwinski2014 , corresponding to an -nucleus potential depth of MeV at the nuclear density of 0.17 fm*-3* within the low-density approximation.
Experimental programs to search for -mesic nuclei have recently been started, aiming at directly studying the in-medium properties of the meson. A one-nucleon pickup reaction, for example () or (), at forward angles is preferable to produce the -nucleus bound states, because the momentum transfer of such a reaction can be rather small. Spectroscopy experiments of the 12C() reaction Nagahiro2005 using high-energy photon beams were proposed by the LEPS2 collaboration at the SPring-8 facility Muramatsu_Baryon2013 and by the BGO-OD collaboration at the ELSA accelerator Metag_BGOOD_Proposal . The results of these experiments are thus far not available.
We proposed an experimental search for -mesic nuclei with missing-mass spectroscopy of the 12C(,) reaction near the production threshold Itahashi2012 . The kinetic energy of the proton beam was chosen to be 2.5 GeV, slightly above the threshold energy for the elementary process of 2.4 GeV. The momentum transfer of this reaction at 0∘ is moderate ( MeV/) at 2.5 GeV. An inclusive measurement of the forward-emitted deuterons allows the analysis of the overall (,) spectrum without any assumption on decay processes of -mesic nuclei.
The formation cross section of the -mesic nuclei via the 12C()11C reaction has been theoretically calculated in Ref. Nagahiro2013 for various sets of , the real and imaginary parts of the -nucleus potential. Population of -mesic states coupling with neutron hole states has been predicted, depending on the assumed potential. Distinct peak structures are expected in the excitation spectra particularly near the production threshold because of the enhanced excited states due to the finite momentum transfer of the reaction Nagahiro2013 .
Physical background such as quasi-free meson production, (), also contributes to the experimental spectrum as a continuum. The cross section of the above background process was estimated to be 2–3 orders of magnitude larger than that of the formation of the -mesic states Itahashi2012 . To overcome such a small signal-to-background ratio, we aimed at achieving an extremely high statistical sensitivity with relative errors of % in the spectrum. An inclusive simulation has shown that observing peak structures near the threshold is feasible under a realistic experimental condition for a strongly attractive potential MeV Itahashi2012 .
We carried out the experiment in 2014. While its results have been briefly reported elsewhere Tanaka2016 , in this paper a full description of the experiment and analysis including discussions based on additional theoretical calculations is presented. First, the experimental method and performed measurements are introduced (Sec. II), and next the data analysis to obtain the excitation-energy spectra is described in detail (Sec. III). The results of a statistical analysis for the obtained spectra are explained (Sec. IV), followed by discussions of the -nucleus interaction and future plans for a follow-up experiment with higher sensitivity (Sec. V). Finally, a conclusion is given in Sec. VI.
II Experiment
A missing-mass spectroscopy experiment using the 12C(,) reaction was performed near the production threshold at GSI, Darmstadt, Germany. A 2.5 GeV proton beam impinged on a carbon target, and the emitted deuterons at were momentum-analyzed to obtain missing masses in the reaction. In addition, elastic proton-deuteron scattering was measured for the calibration of the experimental system.
II.1 Proton beam
Proton beams were supplied by the synchrotron SIS-18. Two kinetic energies were employed: MeV for the measurement of the 12C(,) reaction and MeV for the calibration with proton-deuteron elastic scattering. These energies were determined by measuring precisely the revolution frequencies of the beams in the synchrotron. The accelerated beams were extracted in a slow extraction mode with a spill length of 4 (1) seconds and a cycle of 7 (4) seconds for 2.5 (1.6) GeV. The beams were focused at the experimental target, where a typical spot size was mm (horizontal) mm (vertical).
The beam intensity was /s, measured in front of the target by the SEETRAM detector Jurado2002 inserted on the beam axis. This detector was used only during a short dedicated measurement for an absolute normalization of the cross sections to avoid unnecessary material near the beam axis. Plastic scintillation counters placed off axis around the target continuously monitored relative changes in the luminosity by counting scattered particles from the target.
II.2 Target
Three targets were mounted on a movable ladder at the entrance position of the spectrometer. A natural carbon target with an areal density of 4115 1 mg/cm2 was used for the measurement of the 12C(,) reaction. Deuterated polyethylene (CD2) targets with areal densities of 1027 2 mg/cm2 and 4022 9 mg/cm2 were used for the calibration via the proton-deuteron elastic reaction. These targets had a cylindrical shape with a diameter of 2 cm.
II.3 Spectrometer and detector system
The fragment separator (FRS) Geissel1992 was used as a high-resolution magnetic spectrometer to precisely analyze the momenta of deuterons emitted at 0∘ in the (,) reactions. The FRS has four stages, as schematically depicted in the top panel of Fig. 1. Each stage consists of a 30∘-bending dipole magnet, quadrupole doublet and triplet magnets. Such a configuration provides considerable flexibility to realize various ion-optics modes with high momentum resolving powers.
We developed a special ion-optical mode of the FRS, which is momentum-achromatic at the central focal plane (F2) and dispersive at the final focal plane (F4), as illustrated in the middle and bottom panels of Fig. 1. The achromatic section from the target to F2 was used to select particles originating from reactions in the target. Secondary background produced by the non-interacting primary beam dumped near the exit of the first dipole magnet was thus rejected. The momenta of the deuterons were then analyzed in the dispersive section from F2 to F4, where a designed momentum resolving power was about . The dispersion was kept relatively small throughout the whole spectrometer to have a wide momentum acceptance. At F4 the dispersion was 35.1 mm/%.
The detection system is depicted in the top panel of Fig. 1. Two sets of multi-wire drift chambers (MWDCs) were installed at F4 to reconstruct the deuteron tracks and obtain their momenta. A MWDC had eight layers of detection planes, each consisting of 48 anode wires with a spacing of 5 mm. The active area of each layer was 24 cm (horizontal) 14 cm (vertical). The wires in the first four layers were aligned vertically, while those in the next two and the last two layers were inclined by and , respectively. The wire positions in the neighboring layers with the same wire angle were shifted from each other by a half length of the spacing. These MWDCs were operated with a gas mixture of 76% argon, 20% isobutane, and 4% dimethoxymethane. The signals from the anode wires were processed by preamplifier-shaper-discriminator chips, and the resulting timing information was recorded by time-to-digital convertors.
Plastic scintillation counters (SC2H, SC2V, SC41, and SC42) were installed for time-of-flight (TOF) measurements to distinguish signal deuterons with a velocity from background protons with . SC2H and SC2V had an active area of 6 cm (horizontal) 6 cm (vertical) and a thickness of 5 mm, whereas SC41 had 24 cm (horizontal) 6 cm (vertical) and the same thickness. A plastic scintillator with an area of 50 cm (horizontal) 35 cm (vertical) and a thickness of 2 cm was adopted for SC42, which was located at 5.16 m downstream of SC41. Each of these scintillators was equipped with two photomultipliers. The anode signals were recorded by a 1-GHz sampling digitizer, and the discriminated timing information by a time-to-digital convertor.
In addition, aerogel Čerenkov detectors (ACs) and a total-reflection Čerenkov detector (TORCH) were installed for confirmation of the particle identification. The ACs had silica aerogel with a refractive index of 1.17 Tabata2010 as a radiator, corresponding to a threshold velocity of . TORCH was equipped with an acrylic radiator with a refractive index of 1.5, hence the maximum detection velocity of due to designed insensitivity to totally-reflected photons YoneyamaTORCH . Time projection chambers (TPCs) Janik2011 , the standard beam diagnostics devices of the FRS, were also placed at F2 and F4 for the purpose of the online beam tuning. These Čerenkov detectors and TPCs are not used in the offline analysis described in this paper.
II.4 Trigger condition for data acquisition
In the measurements of the 12C(,) reaction, the total rate of charged particles at F4 was kHz. The top panel of Fig. 2 shows a histogram of TOF between SC2H and SC41 versus one between SC41 and SC42 for all particles reaching F4, obtained with a data-acquisition system triggered by the SC41 signal. Concentration of events corresponding to deuterons and protons are seen at the expected locations and clearly identified. The ratio of the number of deuterons to that of protons is about 1 to 200, indicating that the deuteron and proton rates at F4 were kHz and 250 kHz, respectively.
In order to reject the background protons at the hardware level, we employed a TOF-based trigger for the data-acquisition system by requiring a coincidence of the SC2H and SC41 signals within 15 ns around a relative timing of the deuterons. A TOF histogram with this trigger is shown in the middle panel of Fig. 2, demonstrating efficient rejection of the background protons at the trigger level. The main source of the remaining background events was accidental multiple-hit protons at SC2H, which are randomly distributed in TOF between SC2H and SC41. The multiple-hit protons are actually observed in the recorded signal waveforms of SC2H, as shown in the bottom panels of Fig. 2, and are rejected later in the data analysis (Sec. III.1). The live rate of the acquisition system varied typically between 30%–40%, and the data were recorded with a rate of about 103 events/s.
II.5 Summary of measurements
The experimental conditions are summarized in Table 1. Three types of measurements have been performed, which are explained as follows.
The production measurements of the 12C(,) reaction were carried out by using the 2.5 GeV proton beam impinging on the carbon target. The emitted deuterons had a momentum of MeV/ at the production threshold after the energy loss in the target. To cover a wide excitation-energy region, measurements were conducted at seven central momenta of the FRS by scaling the whole magnetic field with factors from to . In particular, a region near the production threshold was intensively measured, as distinct narrow structures of -mesic states were theoretically predicted most strongly near the threshold Nagahiro2013 .
The momentum calibration of the spectrometer was performed by measuring the elastic D(,) reaction at 1.6 GeV using a CD2 target. Nearly monochromatic deuterons with the momentum of MeV/ were emitted from the target, which defined the central momentum of the FRS at . These deuterons were measured with various scale factors to analyze the ion-optical response of the FRS. One calibration run took about half an hour, and it was repeated every hours to check the stability of the whole spectrometer system.
The elastic D(,) scattering was measured with a CD2 target and a proton beam of 2.5 GeV in order to crosscheck the normalization of the differential cross section. The obtained value was then compared with those reported in Ref. Berthet1982 , as explained in Sec. III.4. During a part of the measurement, solid angles were tightly limited to msr and msr by using slits directly behind the target. A comparison of the yields with and without the slits provided the effective solid angle covered by the FRS.
III Analysis
The goal of the data analysis described in this section is to obtain excitation-energy spectra of 11C near the production threshold. The analysis procedure consists of the following steps. First, the deuteron events are identified (Sec. III.1), and next the deuteron momenta are reconstructed from the measured tracks (Sec. III.2). The excitation energies of 11C are then kinematically calculated (Sec. III.3), and finally the normalization of the cross section is performed (Sec. III.4).
III.1 Selection of deuteron events
Data of the plastic scintillation counters are analyzed in order to identify deuterons at the F4 focal plane. As explained in Fig. 2, major background particles in the recorded data are the accidental multiple-hit protons at F2. Thus, signal waveforms of photomultipliers reading SC2H are firstly analyzed to select single-hit events at F2. TOF between F2 and F4 is analyzed as well to further reject remaining background protons. SC42 is not used in the following analysis to avoid position-dependent transmission from SC41 to SC42 caused by material inhomogeneity found in the Čerenkov detectors behind SC41.
The waveforms of SC2H signals are fitted by an empirical function
[TABLE]
where the first two terms represent a baseline and the third a pulse with a negative polarity. Signals are fitted within a time window of 70 ns around a typical deuteron time, treating as free parameters. The sum of the squared residual (SSR) given by the fit is then used to quantify the multiplicity of the particles. Figure 3 shows SSR against the height parameter obtained for both two photomultipliers (left and right) of SC2H. Single-hit events are clearly identified around SSR . By taking into account the correlation between SSR and , events in the regions indicated by the arrows are selected as single-hit events and used in the following analyses.
Next, TOF between F2 and F4 is analyzed, by introducing corrections for time-walk effects and dependence on ion-optical variables. The corrected TOF spectrum for the data set at the scaling factor is presented in Fig. 4 as an example. The unshaded spectrum shows the total recorded events, where a peak for the deuteron is observed above a constant component due to the multiple-hit proton background. The achieved time resolution for the deuteron peak is ps. The shaded spectrum displays the single-hit events selected by the waveform analysis, demonstrating efficient rejection of the multiple-hit background by 2–3 orders of magnitude. Finally, events within the dashed lines ( region around the peak) are selected as deuteron events to further reject remaining proton background.
The efficiency of the deuteron identification is discussed in three steps as follows. First, properly measured times and pulse heights of the SC2H and SC41 signals and reconstructed tracks at F4 are required for the analysis of the particle identification. This first condition leads to % rejection of the deuteron. Second, rejection of the deuteron by selecting the single-hit waveform is considered using a TOF spectrum for those events rejected in the waveform selection. The spectrum shows a small enhancement at the TOF value for the deuteron, indicating 2–3% rejection. Third, probability of deuteron rejection by the TOF selection is estimated to be 0.2–0.3% from the tail structure of the deuteron peak observed in the TOF spectrum. The longer tail on the right side is due to accidental particles almost coincident with the deuteron at F2 where the timing information measured by a leading-edge discriminator deviated only to the earlier side. Combining the above three contributions, the deuteron identification efficiency is evaluated to be 96–97% for all the data sets of the 12C(,) reaction.
The contamination of background protons in events with identified deuteron is evaluated in the TOF spectrum with the single-hit selection. The spectrum shows an almost constant background on the shorter TOF side of the deuteron peak, where a tail structure of the peak is not significant. The amount of the contamination in the TOF window (dashed lines) can be estimated by integrating the constant region between the dotted lines with the same interval. The contamination fraction thus evaluated is , making only a negligible contribution in the subsequent spectral analysis.
III.2 Momentum analysis
The deuteron momentum is obtained from the reconstructed track by MWDCs at the F4 dispersive focal plane. The momentum can be written as
[TABLE]
where denotes a momentum deviation relative to the FRS central momentum, MeV/. The deviation can be derived from the horizontal track (position and angle ) regardless of the scaling factor , since ion-optical properties remain unchanged by scaling the central momentum in a small range.
In order to obtain a calibration function converting a track (, ) to , the mono-energetic deuteron from the elastic reaction at the proton energy of 1.6 GeV is analyzed. A deuteron emitted in this reaction has a momentum of MeV/, corresponding to a deviation of for the FRS scaling factor . Thus, the ion-optical response for between and can be evaluated from the calibration settings listed in Table 1. Examples of the reconstructed horizontal position and angle are shown in the left panel of Fig. 5, overlaid for . An elastic-scattering locus for each scaling factor is observed above a continuum from reactions with carbon. We fit the position by a polynomial function of both and using all the data sets, and thereby construct a calibration function for , as demonstrated in the right panel.
An uncertainty associated with the calibration of is derived from deviations between the repeated measurements. Thus the estimated systematic error of is in a region of mrad, which is later used in the analysis of the 12C(,) reaction.
III.3 Excitation energy
III.3.1 Calculation
The excitation energy of 11C has been calculated from the proton kinetic energy and the deuteron momentum . First, the relativistic energies of the proton () and the deuteron () are calculated at the center of the reaction target, after correcting the energy losses, as
[TABLE]
and represent the energy losses in half of the target thickness based on a calculation with atima ATIMA . The missing mass in the 12C(,) reaction is then obtained by
[TABLE]
where is the mass of , and and are the proton and deuteron momenta corresponding to and , respectively. Here, the reaction angle is assumed to be 0∘ because of the ion-optical restrictions on angle reconstruction. Finally, the excitation energy is defined relative to the production threshold MeV as
[TABLE]
where and denote the and masses, respectively.
III.3.2 Systematic error
The systematic errors in the excitation-energy calculation have been evaluated by considering the following three sources.
(a) Beam energy. Uncertainties in the absolute beam energies ( MeV and MeV) cause systematic errors of 1.9 MeV and 0.8 MeV in the excitation energy, respectively. Note here that the lower beam energy also affects the excitation energy, as the deuteron momentum in the calibration at 1.6 GeV is used to define the FRS central momentum. Considering that the two errors are mostly correlated because of their common source in the circumference of the SIS-18 synchrotron, we obtain the combined systematic error of 1.4 MeV in the excitation energy.
(b) Reaction angle. A systematic error originating in the uncertainty of the reaction angle, which is assumed to be in the kinematical calculation of the production and calibration reactions, is evaluated to be 0.8 MeV in the excitation energy. The possible maximum systematic error caused by neglecting the finite reaction-angle distribution () in the acceptance of the FRS is adopted.
(c) Optics calibration. The systematic error of the relative momentum deviation has been evaluated to be . This corresponds to an error of 0.5 MeV in the scale of the excitation energy.
By taking a square root of the quadratic sum of all the above contributions, a total systematic error in the excitation energy is estimated to be 1.7 MeV.
III.3.3 Experimental resolution
The experimental resolution is evaluated using the mono-energetic deuterons in the calibration at 1.6 GeV. Figure 6 shows a spectrum of the deuteron momentum at the FRS scaling factor of analyzed in the same procedure as the production runs. The spectrum is fitted well with a function given by the gray solid line, summing a Gaussian function for the elastic peak (dotted line) and a second-order polynomial for the carbon contribution (dashed line). The Gaussian component yields the overall momentum resolution of MeV/ (), where the uncertainty includes deviations between the different data sets. This resolution corresponds to an energy resolution of MeV in the scale of shown in the lower axis.
In order to evaluate the experimental resolution in the production runs from the above estimate for the calibration runs, two corrections for the different target and beam energy in the calibration measurements are necessary. First, a Monte-Carlo simulation based on atima ATIMA shows that the energy straggling in the targets makes contributions of MeV and MeV in the production and calibration runs, respectively, in the scale of . Second, an estimated relative momentum spread of the beams of accounts for resolutions of MeV in the production runs and MeV in the calibration in the scale of . By introducing the corrections quadratically i.e., , the excitation-energy resolution in the production measurements is obtained as 2.4–2.6 MeV.
III.4 Normalization of spectra
Excitation-energy spectra need to be corrected for the acceptance of the spectrometer, which can be expressed as a function of the momentum parameter . For spectral analysis, events with the horizontal angle at F4 in mrad and in are selected, where the acceptance curve is assumed to be linear. The slope of the acceptance function is then deduced by two methods: (i) measuring the -dependence of deuteron yields at one fixed absolute momentum by scaling the FRS magnetic fields, and (ii) a Monte Carlo simulation of the ion-optical transport in the FRS using the code mocadi Iwasa1997 . These two estimations result in a consistent acceptance curve of , and the excitation spectra at the seven FRS settings are thus corrected with this function.
To normalize the absolute scale of the double differential cross section, we analyze a short production run with the SEETRAM detector directly monitoring the beam intensity. The double differential cross section is calculated by
[TABLE]
at one reference energy , where the solid angle covered by the FRS is separately evaluated as msr. is the measured yield density per unit excitation energy at the reference, is the number of the incident protons obtained by SEETRAM, and is the number density of the target. denotes the overall efficiency estimated to be %, taking into account the trigger efficiency (%), the deuteron identification efficiency (–%), and the tracking efficiency (–%). As a result, the double differential cross section of b/(sr MeV) is obtained at the reference energy.
Spectral normalization is then performed as follows. First, the acceptance-corrected excitation spectrum at the FRS scale factor of is normalized, according to the analyzed cross section at the reference energy . Next, the spectra at the neighboring FRS settings ( and ) are scaled so that they have consistent overlap in the common energy region with the spectrum. Spectra at the other settings are sequentially normalized in the same manner.
The differential cross section of the elastic reaction at 2.5 GeV is analyzed as well in a similar way in order to confirm the analyses on the beam intensity at this energy and on the normalization of the cross section. The obtained value is b/sr in the center-of-mass frame, which is consistent with known cross sections around this energy, b/sr at 2.4 GeV and b/sr at 2.55 GeV Berthet1982 , within the experimental errors.
IV Results
Excitation-energy spectra of 11C obtained with the 12C(,) reaction are presented in Fig. 7 for the seven momentum settings of the spectrometer. The excitation energy relative to the production threshold MeV is shown in the lower horizontal axis, while the scale of the corresponding deuteron momentum is given in the upper one. The systematic error associated with the excitation energy has been estimated to be 1.7 MeV. The ordinate gives the double differential cross section, with an uncertainty of on the absolute scale.
These seven spectra are combined into one spectrum by averaging the data points of different FRS settings at each excitation energy. The resulting excitation spectrum is shown in Fig. 8 (top panel). Note that this averaging reduces the degrees of freedom originating in the relative spectral normalization between the neighboring settings. Therefore, the following analyses are performed for both the individual spectra (Fig. 7) and the combined one (Fig. 8), where only minor differences are found as shown later.
The obtained spectra show no distinct narrow structure, although a good statistical sensitivity at a level of is achieved together with a sufficiently good experimental resolution of 2.4–2.6 MeV. The spectra exhibit a smooth increase from about 4.9 to 5.7 b/(sr MeV) in the measured region of the excitation energy. This continuous component can be understood within an order of magnitude by quasi-free meson production processes (), where denotes a nucleon in the target nucleus, as simulated in Ref. Itahashi2012 .
The spectra are fitted by a third-order polynomial function over the whole measured energy region. The seven spectra in Fig. 7 are simultaneously fitted, by sharing the polynomial parameters between the settings. In addition, a multiplying factor is introduced as a free parameter to each spectrum except for the one at in order to take into account a possible error correlation with the relative normalization of the spectra. The fit results are shown by the gray solid curves in both Figs. 7 and 8. is 221/225 in Fig. 7 and 125/121 in Fig. 8, where n.d.f. denotes the number of degrees of freedom. Residues of the fit are also displayed in Fig. 8 (bottom panel) with envelopes of 2 standard deviations.
We determine upper limits for the formation cross section of -mesic nuclei. Here, a Lorentzian function at an excitation energy with a width (FWHM) is tested as a signal shape. The measured spectrum is assumed to be described by the following function:
[TABLE]
The first term includes a Voigt function, which is the Lorentzian function folded by a Gaussian function accounting for the experimental resolution (). The signal cross section to be tested is represented by (). The second term is the third-order polynomial accounting for the continuous component. The combined spectrum (Fig. 8) is fitted by this function within a region of MeV around the Lorentzian center, by treating both the signal cross section and the polynomial coefficients as free parameters. The upper limit of the cross section at the 95% confidence level is then determined by assuming a Gaussian probability density function based on the fit result and normalizing it in the physical non-negative region ().
In order to obtain the upper limit as a function of the Lorentzian position and width , the above analysis has been repeated for each set of (, ) in MeV. In Fig. 9, the fitted values and errors of the Lorentzian cross section are shown by the solid dots, and the resulting upper limits are summarized by the solid curves. These values are given in the differential cross section by the left ordinate and in the Lorentzian peak height by the right one. Moreover, analysis based on simultaneous fitting of the seven spectra (Fig. 7) is conducted in order to check effects of possible error correlations with the relative normalization of the spectra. Thus evaluated limits are given by the dashed curves, exhibiting no significant difference between the two analysis methods.
To evaluate systematic errors on the upper limits, the following contributions are considered: (1) the systematic error on the absolute scale of the measured cross section (), (2) the systematic error in the excitation-energy calculation ( MeV), (3) the uncertainty in the slope of the momentum acceptance, (4) the uncertainty in the experimental resolution, (5) different fit regions (10 MeV wider or narrower), and (6) a choice of fitting of the combined spectrum (Fig. 8) or simultaneous fitting of the seven spectra (Fig. 7). The upper limit is analyzed by changing each of these conditions, and then the total systematic error on the limit is evaluated by taking the square root of the sum of the squared deviations. In Fig. 9, the thus-evaluated systematic errors are displayed by the shaded areas.
V Discussion
The 95% C.L. upper limits for the formation cross section of -mesic nuclei have been obtained as a function of the position and width of the assumed Lorentzian peak. The upper limits are particularly stringent near the production threshold: 0.1–0.2 b/sr for MeV, 0.2–0.4 b/sr for MeV, and 0.3–0.6 b/sr for MeV. These are as small as nb/(sr MeV) in the Lorentzian peak height, and therefore exclude the existence of prominent peak structures theoretically expected near the threshold for strongly attractive potentials, like a peak with nb/(sr MeV) for MeV shown in Fig. 10 (top) Nagahiro2013 . On the other hand, the obtained limits are not in conflict with small peak structures predicted for shallow potentials, as in Fig. 10 (bottom) for MeV where a peak height is nb/(sr MeV).
In order to make further quantitative comparisons with the theoretical predictions, we evaluate constraints on the scales for the theoretically-calculated formation spectra. Here, the following function is assumed to describe the measured excitation spectrum,
[TABLE]
where denotes the theoretical formation spectrum (e.g., Fig. 10) Nagahiro2013 ; Nagahiro2017 for the real and imaginary potentials of (,) folded by the Gaussian function for the experimental resolution (). The parameter is introduced to test an allowed scale for . The remaining term is a third-order polynomial for the continuous part of the spectrum. A 95% C.L. upper limit of for given (,) is analyzed in the similar procedure, by fitting the measured spectrum with this function within the region of MeV MeV and assuming a Gaussian probability density function of in the physical region ().
The analysis has been repeated for the potential parameter sets listed in Table 2, including MeV where theoretical spectra were newly calculated Nagahiro2017 . Fitted values and resultant 95% C.L. upper limits of the scale parameter are given by and , respectively. For each (,), the existence of the theoretically-calculated peak structure with the strength multiplied by is excluded at the 95% C.L. The upper limits are then linearly interpolated between the calculated potentials, and presented as a contour plot on the real and imaginary potential plane (,) in Fig. 11. Smaller is deduced for larger and smaller . Systematic errors on are estimated by taking into account the same six sources as for the Lorentzian upper limits. A band of the systematic error on the contour is shown by the dashed curves.
In Fig. 11, one can exclude a region of the potential-parameter set giving at the 95% C.L. within the present comparison with the theoretical calculations. Note here that the magnitude of the theoretically-calculated spectra has an estimated uncertainty of a factor Grishina2000 ; Tanaka2016 , originating in the assumed cross section of 30 b/sr for the elementary reaction Itahashi2012 . Thus, if the theoretical cross sections were overestimated by a factor of 2, for example, one can reject a potential region with at the 95% C.L.
Figure 12 summarizes the obtained constraint and currently known information on the -nucleus potential. The shaded region shows the excluded region () in the present analysis. The rectangular box displays an evaluated region by the photoproduction experiments: the real part of MeV from the excitation function and the momentum distribution Nanova2013 ; Nanova2016 , and the imaginary part of MeV from the transparency ratios Nanova2012 ; Friedrich2016 . Theoretical expectations with the NJL model ( MeV) Costa2005 ; Nagahiro2006 , the linear sigma model ( MeV) Sakai2013 , the QMC model ( MeV) Bass2006 , and the chiral unitary approach Nagahiro2012 are shown by the dashed lines.
Here, a strongly attractive potential of the order of MeV, as predicted by the NJL model, is rejected within the present analysis for the region of the imaginary potential of MeV. The current experiment has very limited sensitivity in a shallower potential region where some small peak structures are predicted in the theoretical formation spectra Nagahiro2013 , as shown in Fig. 10 (bottom), for example. Therefore, an improvement of the experimental sensitivity is necessary for further investigating the existence of -mesic nuclei.
One of the possible approaches for the next step is a semi-exclusive measurement by simultaneously detecting the forward deuteron in the 12C() reaction for missing-mass spectrometry and decay particles from -mesic nuclei for event selection. A large amount of the continuous background dominating the present spectrum in Fig. 8, which is understood as quasi-free multi-pion production, will be suppressed by tagging the decay particles. As discussed in Ref. Nagahiro_NPA2013 , major decay modes of the -mesic nuclei are expected to be one- and two-nucleon absorption: , , and . Among them the two-nucleon absorption process has a distinguishing feature in the emitted proton (or neutron) energy of 300–600 MeV, as simulated in Fig. 13 assuming the Fermi motion of nucleons in the nucleus Moniz1971 . A simulation based on an intra-nuclear cascade model Nara2000 has shown that the signal-to-background ratio will be increased by two orders of magnitude compared to the present experiment by selecting energetic protons in the backward angular range () in the laboratory HigashiThesis .
The semi-exclusive measurement will be performed in the near future. This experiment is feasible with the FRS at GSI and the next-generation Super-FRS Geissel2003 at FAIR, as the excellent performance of the FRS for the forward spectroscopy has been demonstrated in the present experiment. A large-acceptance detector, such as the WASA central detector WASA_CELSIUS ; WASA_COSY , will be additionally installed surrounding the reaction target. An experimental setup combining the FRS and the WASA systems is illustrated in Fig. 14. We will also consider possibilities of using other reaction channels such as the () reaction.
VI Conclusion
A missing-mass spectroscopy experiment of the 12C(,) reaction was performed at a proton energy of 2.5 GeV aiming at the search for -mesic nuclei. The excitation-energy spectra of 11C nuclei were successfully obtained around the -meson production threshold with high statistical sensitivity and sufficient experimental resolution. As no distinct peak structure has been observed in the excitation-energy spectra, upper limits on the formation cross sections of the -mesic nuclei have been determined. A comparison with theoretically-predicted formation spectra sets a stringent constraint on the -nucleus potential.
The present work has established the applicability of the missing-mass spectroscopy of the (,) reaction for studying in-medium properties of the meson. The application to other mesons will be considered. The experimental search for -mesic nuclei will further proceed with the semi-exclusive measurement by simultaneously detecting the decay particles.
Acknowledgements.
The authors would like to acknowledge the support from the GSI staffs, particularly the accelerator group, the FRS engineering group, and the target laboratory. We are grateful to staffs of Institut für Kernphysik, Forschungszentrum Jülich for their support in a detector test at COSY. We also thank Dr. M. Tabata for specially developed aerogel. Y.K.T. acknowledges financial support from Grant-in-Aid for JSPS Fellows (No. 258155) and H.F. from Kyoto University Young Scholars Overseas Visit Program. This work is partly supported by a MEXT Grants-in-Aid for Scientific Research on Innovative Areas (Nos. JP24105705 and JP24105712), JSPS Grants-in-Aid for Scientific Research (S) (No. JP23224008) and for Young Scientists (A) (No. JP25707018), by the National Natural Science Foundation of China (No. 11235002) and by the Bundesministerium für Bildung und Forschung.
The reference list from the paper itself. Each links out to its DOI / PubMed record.
- 1(1) S. Weinberg, Phys. Rev. D 11 , 3583 (1975).
- 2(2) E. Witten, Nucl. Phys. B 156 , 269 (1979).
- 3(3) G. Veneziano, Nucl. Phys. B 159 , 213 (1979).
- 4(4) Su H. Lee and T. Hatsuda, Phys. Rev. D 54 , R 1871(R) (1996).
- 5(5) D. Jido, H. Nagahiro, and S. Hirenzaki, Phys. Rev. C 85 , 032201(R) (2012).
- 6(6) R. S. Hayano and T. Hatsuda, Rev. Mod. Phys. 82 , 2949 (2010).
- 7(7) S. Leupold, V. Metag, and U. Mosel, Int. J. Mod. Phys. E 19 , 147 (2010).
- 8(8) V. Metag, M. Nanova, E. Ya Paryev, Prog. Part. Nucl. Phys. 97 , 199 (2017).