High pressure Raman study of the quantum magnet (C$_4$H$_{12}$N$_2$)Cu$_2$Cl$_6$
Simon Bettler, Gediminas Simutis, G\'erard Perren, Dominic Blosser,, Severian Gvasaliya, and Andrey Zheludev

TL;DR
This study investigates magnetic and lattice excitations in the quantum antiferromagnet (C$_4$H$_{12}$N$_2$)Cu$_2$Cl$_6$ under high pressure using Raman spectroscopy, revealing pressure-dependent magnetic changes and strong magnetoelastic coupling.
Contribution
It provides new insights into pressure-induced phase transitions in PHCC, showing significant magnetic and phononic changes not observed in previous neutron studies.
Findings
Magnetic scattering varies significantly with pressure.
Phonons exhibit anomalous shifts linked to magnetoelastic effects.
Transitions are not due to structural changes.
Abstract
Magnetic and lattice excitations in the quantum antiferromagnet (CHN)CuCl (PHCC) are studied across two pressure-induced phase transition at and using Raman spectroscopy. It is confirmed that neither transition is a result of a structural transformation. Magnetic scattering is detected. It shows a pronounced pressure dependence and undergoes substantial changes at both transitions. The results are in clear contradiction with previous neutron studies, which detected only minor changes of the magnon spectrum at . A number of phonons show anomalous frequency shifts at low temperatures. This effect is pressure dependent and for two of the observed phonons dramatically reverses sign at around . The anomalous behavior is attributed to strong magnetoelastic coupling in PHCC.
Click any figure to enlarge with its caption.
 Figure 1
 Figure 2
 Figure 3
 Figure 4
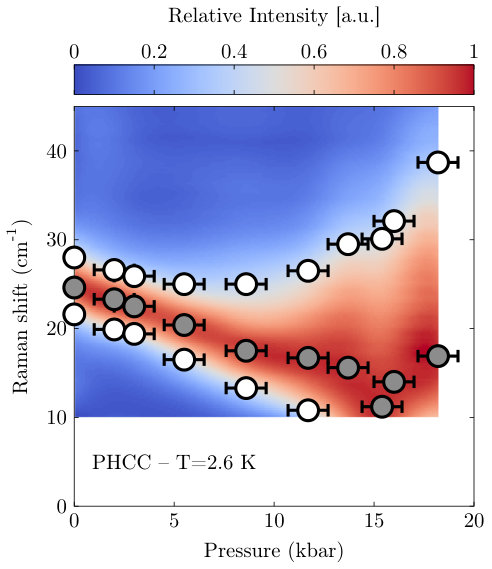 Figure 5
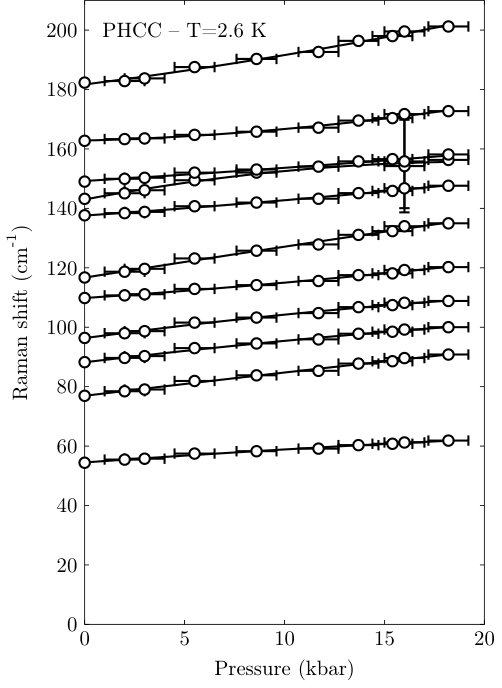 Figure 6
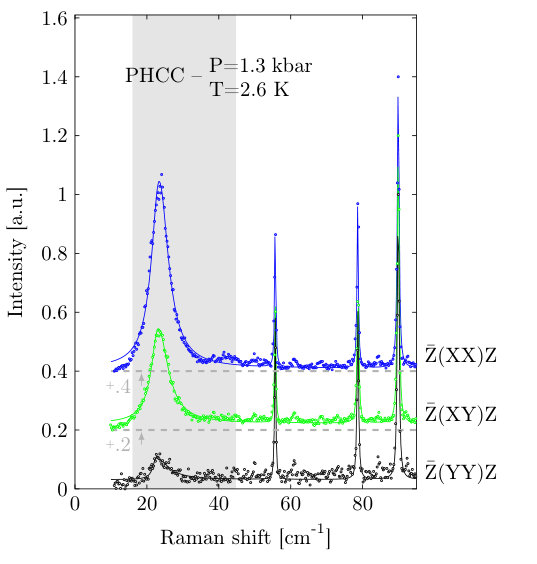 Figure 7
| (C4D12N2)Cu2Cl6 | (C4H12N2)Cu2Cl6 | |||
|---|---|---|---|---|
| Expt.(cm-1) | DFT(cm-1) | Expt.(cm-1) | DFT(cm-1) | |
| 54.4 | 49 | 57.0 | 52 | |
| 76.9 | 74 | 77.1 | 75 | |
| 88.3 | 76 | 91.5 | 78 | |
| 96.4 | 85 | 103.9 | 88 | |
| 109.8 | 93 | 112.5 | 99 | |
| 116.7 | 105 | 124.6 | 113 | |
| 137.7 | 117 | 139.4 | 120 | |
| 143.2 | 126 | 149.5 | 130 | |
| 149.0 | 137 | 152.8 | 140 | |
| 162.7 | 148 | 164.8 | 151 | |
| 182.3 | 160 | 184.7 | 160 | |
| 206.1 | 181 | 207.0 | 184 | |
| 278.2 | 258 | 278.3 | 258 | |
| 290(2) | 275 | 290(2) | 275 | |
| 305.3 | 302 | 304.7 | 303 | |
| 319.9 | 305 | 406.1 | 387 | |
Peer Reviews
No public reviews on file for this paper yet. If you reviewed it on a platform where reviews are public (OpenReview, ICLR, NeurIPS, ICML), you can paste yours below so the community can read it here.
Videos
No videos yet. Explain this paper in a talk, walkthrough, or lecture? Add one.
High-pressure Raman study of the quantum magnet (C4H12N2)Cu2Cl6.
S. Bettler
G. Simutis
Present address: Laboratory for Muon Spin Spectroscopy, Paul Scherrer Institut, 5232 Villigen PSI, Switzerland.
G. Perren
D. Blosser
S. Gvasaliya
A. Zheludev
[email protected] http://www.neutron.ethz.ch/ Laboratory for Solid State Physics, ETH Zürich, 8093 Zürich, Switzerland.
Abstract
Magnetic and lattice excitations in the quantum antiferromagnet (C4H12N2)Cu2Cl6 (PHCC) are studied across two pressure-induced phase transition at kbar and kbar using Raman spectroscopy. It is confirmed that neither transition is a result of a structural transformation. Magnetic scattering is detected. It shows a pronounced pressure dependence and undergoes substantial changes at both transitions. The results are in clear contradiction with previous neutron studies, which detected only minor changes of the magnon spectrum at . A number of phonons show anomalous frequency shifts at low temperatures. This effect is pressure dependent and for two of the observed phonons dramatically reverses sign at around . The anomalous behavior is attributed to strong magnetoelastic coupling in PHCC.
pacs:
I Introduction
Quantum magnets are models of choice for studying the complex physics of quantum phase transitions.Sachdev (2008) In such materials, quantum criticality can often be induced by an external magnetic field, as for example in the so-called Bose-Einstein condensation (BEC) of magnons Batyev and Braginski (1984); Giamarchi and Tsvelik (1999); Giamarchi et al. (2008) Another way to potentially drive these systems towards criticality is by applying external pressure and thereby tweaking the strength of magnetic interactions. In quantum paramagnets, i.e., spin systems with a quantum disordered spin-singlet ground state and a gap in the magnetic excitation spectrum, this type of perturbation may in rare cases lead to a complete softening of the spin gap. The result is a unique magnetic soft-mode quantum phase transition to a long range-ordered state that breaks the symmetry of the underlying Heisenberg Hamiltonian.Sachdev (2008) The dynamical critical exponent of such a transition is , in contrast to in field-induced BEC .
Only a handful of real materials undergo pressure-induced magnetic quantum phase transitions of the described type. To date, only three examples are known: TlCuCl3 Tanaka et al. (2003); Rüegg et al. (2004), KCuCl3 Goto et al. (2006) and (C4H12N2)Cu2Cl6 (PHCC). In the latter, pressure-induced ordering was first detected by -SR at kbar.Thede et al. (2014) Inelastic neutron scattering studies confirmed the transition to be of a soft-mode nature.Hong et al. (2010); Perren et al. (2015) A second transition was detected in PHCC by -SR at a higher pressure of kbar.Thede et al. (2014) It clearly corresponds to a rather drastic change in the magnetic structure, and is possibly a Lifshitz (commensurate to incommensurate) transition. Surprisingly though, inelastic neutron scattering experiments Perren et al. (2015) did not detect any drastic changes in the excitation spectrum of PHCC upon crossing . Also unknown is to what extent the crystal lattice and phonons are involved, if at all, in either of the two transitions. The very limited high pressure neutron diffraction data availablePerren et al. (2015) are a by-product of dedicated spectroscopy studies, and are not conclusive on whether the transitions are accompanied by any crystallographic transformations. All these issues we address in the present study by means of high pressure Raman spectroscopy.
PHCC is an extensively studied and well understood quantum paramagnet with a spin gap meV.Stone et al. (2001, 2006a, 2006b) The crystal structure is triclinic, space group P, with lattice parameters , , Å, , , and . Battaglia et al. (1988) The magnon dispersion relation is known from neutron experiments,Stone et al. (2001) with the magnon band extending between and 2.7 meV. The topology of magnetic interactions between the Cu2+ ions is believed to be rather complicated. The exchange constants are not known, but some conclusions can be drawn from an analysis of magnetic bond energies. Stone et al. (2001) According to the latter, the three most important interactions roughly lie in the crystallographic plane and are schematically shown in Fig.1. To some degree the system can be viewed as composed of antiferromagnetic dimers defined by the nearest neighbor exchange . However, bond energies associated with a frustrated second-nearest-neighbor coupling and the sixth-nearest-neighbor antiferromagnetic bond are only slightly, if at all, smaller. There is evidence that it is the bond that is most affected by the application of hydrostatic pressure.Perren et al. (2015) With increasing pressure this coupling becomes progressively weaker, more than halving at 9 kbar.
II Experimental details
In the present study, we utilized fully deuterated PHCC single crystals from the same growth batch as in Ref. Hüvonen et al., 2012. The samples were typically 0.2 0.1 0.1 mm3 in size. In all cases the studied surface contained a well-defined -axis, as verified by single crystal X-ray diffraction. Note that the strongest dimer bond is almost parallel to that direction. The Raman experiments were performed using a Trivista 557 triple-grating spectrometer and a liquid-nitrogen-cooled charge-coupled device (CCD) detector. A 660-nm solid state laser at a low power of 3 mW was used in order to limit sample heating. To achieve high stray light rejection as well as resolution, 1800/1800/1800 l/mm gratings were used. Sample environment was a He-flow cryostat with a base temperature of 2.6 K. Measurements were carried out in a backscattering geometry using a focusing microscope. The data were taken in several acquisitions which allowed increasing the signal to noise ratio and excluding spurious events primarily due to cosmic muons. For each spectrum, the total counting time was of the order of 1 h. The polarization of incident light could be rotated using a plate. The polarization of scattered light was analyzed with a linear polarizer used in combination with a plate.
We define the polarization directions as X=, Y= with the momentum along Z=. With respect to the dominant magnetic couplings, these axes form following angles: : X–23∘, Y–67∘; : X–24∘, Y–67∘; and : X–90∘, Y–45∘, respectively. A configuration in which both incident and outgoing polarization are aligned along the crystallographic -axis is thus denoted in the Porto notation as . indicates that both polarizations are transverse to the direction of the -axis and denotes a cross-polarization geometry.
High-pressure measurements were done in a miniature opposing plates diamond anvil cell with a BeCu gasket and backing plates based on the design of Ref. Sterer et al., 1990. The cell utilized diamonds with a culet diameter of 1 mm and a gasket hole with diameter 0.6 mm. The pressure-transmitting medium was Daphne Oil 7373. The maximum pressure attained at base temperature was 18.2 kbar. The applied pressure was measured in situ with a precision of 0.1 kbar, using the shift of the ruby R1 fluorescence line.Feng et al. (2010) The pressure homogeneity across the cell was about 1 kbar, as estimated from measurements on several ruby spheres at different positions within the cell.
III Results
III.1 Ambient pressure
III.1.1 Magnetic scattering
At elevated temperatures, the measured Raman spectra are dominated by phonons. Below about 25 K, a broad continuum of excitations develops at low energies as shown in Fig. 2. This continuum is well separated from any phonons, which allows for a clean observation of its pressure-dependence without the necessity to subtract any lattice contributions. At K the continuum is peaked at 24.6 cm*-1* and has a full width at half maximum of 6 cm*-1* as extracted from empirical Lorentzian fits. It is almost symmetric with a very slight tail extending towards higher energies. Its intensity increases with decreasing temperature, although its position remains largely unchanged. This is a strong indication that the low-energy feature is due to magnetic scattering.Lemmens et al. (2000); Choi et al. (2003); Simutis et al. (2016)
Another confirmation comes from analyzing its energy range. Magnetic Raman scattering in quantum paramagnets is expected to originate primarily from two-magnon processes. Choi et al. (2003); Fleury and Loudon (1968) A broad continuum is indicative of a substantial magnon bandwidth. For gapped quantum antiferromagnets such a continuum is confined in the energy range between and twice the maximum magnon energy. For PHCC, using the single magnon dispersion known from neutron studies,Stone et al. (2001) we can etimate the domain of this 2-magnon continuum to be between 16 cm*-1* and 45 cm*-1*. This range is indicated by the shading in Figs. 2 and 3, and indeed coincides with the domain of the observed continuum.
The magnetic nature of the continuum is also consistent with the observed polarization dependence of scattering. As shown in Fig. 3, the shape and position of the continuum is the same in all experimental configurations. However, its intensity is strongest in the geometry and much suppressed in the geometry. Thus, the signal is strongest for polarization along the two strongest magnetic bonds, similar to two-magnon scattering in other known dimer systems.Choi et al. (2003, 2005)
III.1.2 Anomalous phonons
In the energy range 10-205 that was studied in detail in our experiments, 11 strong phonon peaks were observed. Since the crystal is triclinic with space group P, point group , all Raman active phonons have trivial Ag symmetry. From the measured spectra, the phonon frequencies were obtained in Lorentzian fits. As shown in Fig. 4, several of them exhibit anomalous temperature dependencies. Rather significant frequency shifts occur at very low temperatures, below 20 K. In this regime, two of the observed modes actually harden with increasing temperature.
In a bid to identify the eigenvectors of the anomalous phonons we performed density functional theory (DFT) ab initio calculations using the Quantum Espresso software package Giannozzi et al. (2009). The non-local rVV10 functional Sabatini et al. (2013) was used to incorporate Van der Waals and hydrogen bonding effects which are certainly important in this organomatallic compound. For all calculations the projector augmented wave method was used. Pseudopotentials for the density functional suggested in Ref. Vydrov and Voorhis, 2010 were generated using input parameters from the PSLibrary project (pslibrary.0.3.1).Corso (2014) In all calculations the kinetic energy cutoff was 120 Ry and the charge density cutoff 600 Ry. Brillouin zone integration was performed using a 3x3x3 k-point grid.
For the 16 lowest-energy Raman-active modes the observed and calculated frequencies are listed in incremental order in the first two columns of Table 1. Additionally, measured and calculated phonon frequencies of a protonated sample are shown in the last two columms. The first 15 modes listed correspond to displacement patterns involving both the [Cu2Cl6]2- bitetrahedra as well as the organic ions. By contrast, the last mode listed in Table 1 – as well as all higher-energy modes – correspond to internal molecular modes of the piperazinium ion. Consequently this last mode shows a much larger shift in frequency upon H/D exchange.
A conclusive result of our DFT simulations is that the 10- to 205- low-energy lines that were studied in detail, all correspond to vibrations of the [Cu2Cl6]2- bitetrahedra with admixtures of low-energy vibrations of the piperazinium ions. This explains why almost all low-frequency vibrations are subject to substantial H/D isotope effect. At the same time, it greatly complicates the vibrational landscape and makes the frequencies very sensitive to the difficult to account for Van-der-Waals interactions. Therefore, it appears impossible to unambiguously match the observed anomalous phonon lines to particular calculated ones. Few studies of [Cu2Cl6]2- vibrations in other materials have been reported to date. In a recent work,Oueslati et al. (2013) the authors also met considerable difficulties in assigning the low-frequency peaks to particular modes, as in our case.
III.2 Results under applied pressure
III.2.1 Magnetic excitations
As could be expected, magnetic Raman excitations in PHCC are strongly affected by hydrostatic pressure. As shown in Fig. 5, we observe a shift of the magnetic continuum to lower energies already at rather modest pressures. This is fully consistent with the previously observed softening of the spin gap.Hong et al. (2010) Below kbar, the spectral function retains its symmetric shape with a slight tail towards higher energies. Throughout this pressure range the continuum width and shape remain constant, while it shifts to lower energies as a whole (Fig. 5). In the intermediate-pressure range between and kbar, we additionally observe a progressive change in the shape of the scattering. Whereas in the low-pressure range the asymmetry of the magnetic peak was subtle, the high-energy tail becomes considerably more pronounced at higher pressure. Increasing the pressure above results in a further significant change in the shape of the spectrum. The magnetic scattering peak becomes rounded and overdamped, with no clear maximum. Increasing the pressure further the spectrum continues to be broadened and develops a long high-energy tail.
Unlike in simple spin systems such as spin ladders,Brenig and Becker (2001); Schmidt et al. (2001) in a material with magnetic interactions as complex as they are in PHCC a quantitative analysis of the Raman spectrum does not appear feasible. To date there exist no model calculations of even the single-magnon dispersion in PHCC, let alone the Raman spectrum. As previously mentioned, even describing the ground state in terms of -dimers is only approximate, since interdimer coupling is almost as strong. Instead, we chose a model-independent way to quantify the measured spectra. In Figure 6 we plot the positions of the maximum of magnetic scattering, and frequencies where the intensity reaches half of its maximum value. The color map in the background represents the measured Raman intensity relative to its maximum value at each pressure.
III.2.2 Phonons
Tracking the measured phonon frequencies vs. pressure confirms that the two transitions at and are not associated with any crystallographic transformations. Indeed, as shown in Fig. 7, all phonons observed at base temperature show a smooth and almost linear pressure dependence (hardening). None of disappearing, splitting, or an appearance of new phonon lines was detected up to 18.2 kbar applied pressure.
Despite the monotonic pressure dependence at a fixed low temperature, most of the observed phonons show a remarkable pressure-induced evolution of their temperature dependencies. As shown in Fig. 4, the magnitude of the low-temperature frequency shifts is highly pressure dependent. For the two phonons that harden with increasing temperature at ambient pressure, even the sign of the temperature shift reverses under pressure. This reversal occurs between 11.7 and 15 kbar, and thus seemingly coincides with .
IV Discussion
As argued above, the magnetic scattering continuum can be ascribed to scattering from two-magnon processes that span between twice the energy gap and twice the maximum of magnon dispersion. Within this interpretation, the observed evolution of the spectrum below implies a progressive softening of the gap without much change in the magnon bandwidth, in agreement with the neutron results. The only other comparable high pressure Raman study of a quantum paramagnet that we are aware of is that on KCuCl3.Kuroe et al. (2012) The much broader resolution, stronger elastic line and lower signal-to-noise ratio of the spectra reported in that work make a direct comparison to our data difficult.
What in our optical measurements on PHCC is clearly in contradiction with the previous neutron experiments of Ref. Perren et al., 2015 are the observed steady increase of the magnon bandwidth above about 10 kbar, as deduced from the behavior of the upper continuum half-height frequency, and the clear changes of the shape of the scattering across the transition at . In contrast, inelastic neutron scattering detected only insignificant changes in spin dynamics between 9 kbar and 18 kbar. Even those were only revealed in a quantitative fit to the measured neutron spectra, particularly to neutron intensities. The most likely reason for this discrepancy is an incorrect pressure calibration in the neutron study. As only became apparent through recent experience with the pressure cell used in the neutron experiment,Podleznyak (2017) the actual pressure can drop by as much as a third, compared to nominal, upon cooling the cell down to base temperature. This effect was not taken into account in Ref. Perren et al., 2015. Its magnitude for that particular experiment can not be assessed without additional in situ pressure measurements using the same sample as in the original study. It appears likely though, that the nominally 18 kbar neutron data set actually corresponds to a pressure just below . Note that in the present optical study the pressure is known reliably, as it is measured in situ at the experimental temperature. We thus confirm that the transition at is, indeed, accompanied by a substantial change in spin excitations and a rapid increase of the excitation bandwidth.
We can expect a direct connection between the evolution of the magnetic ground state and the behavior of anomalous phonons. First, note that the anomalous phonon behavior occurs below about 20 K. In most conventional materials, phonon frequencies remain constant at such low temperatures. The only energy scale in PHCC that would be consistent with the low temperature range is that of magnetic exchange interactions. Below 20 K is precisely where short-range spin correlations set in. For the strongest bonds, the typical exchange energy in PHCC is about 1 meV,Stone et al. (2001) which is larger but comparable to the observed anomalous frequency shifts (about 0.15 meV for the cm*-1* mode). With a high degree of certainty the anomalous behaviour can therefore be attributed to magnetoelastic coupling. The pressure dependence of anomalous frequency shifts signifies a strong pressure dependence of the local spin correlations in the system. A phase transition to a qualitatively different magnetic structure that we expect to occur at will thus have a particularly strong effect. We can speculate that it may be responsible for the observed sign reversals of two anomalous frequency shifts. A more concrete discussion of the microscopic mechanism would require an unambiguous identification of the the eigenvectors for the anomalous modes, which is presently lacking.
V Conclusion
Neither of the pressure-induced magnetic transitions in PHCC involve crystallographic transformations. The transition at is associated with a progressive softening of the magnon gap with little change of bandwidth. Contrary to previous indications, the transition at leads to a substantial reorganization of the spin excitation spectrum. The corresponding change of the magnetic ground state has a dramatic impact on the temperature dependencies of certain phonon modes. It appears that a further neutron scattering study of the high pressure phase may bring further insight into its origin.
Acknowledgements.
We thank Dan Huevonen for his involvement in the early stages of the present project. We are grateful to Leonid Dubrovinsky for sharing his expertise on diamond anvil cells. We thank Gábor Csúcs, Victoria Elisabeth Blair, Peter John Beltramo, and Jan Vermant for technical assistance. Numerical simulations were performed on the Euler cluster (ETH Zurich).
The reference list from the paper itself. Each links out to its DOI / PubMed record.
- 1Sachdev (2008) S. Sachdev, Nature Physics 4 , 173 (2008).
- 2Batyev and Braginski (1984) E. G. Batyev and L. S. Braginski, Zh. Eksp. Teor. Fiz. 87 , 1361 (1984), [Sov. Phys. JETP 60 , 781 (1984)].
- 3Giamarchi and Tsvelik (1999) T. Giamarchi and A. M. Tsvelik, Phys. Rev. B 59 , 11398 (1999).
- 4Giamarchi et al. (2008) T. Giamarchi, C. Ruegg, and O. Tchernyshev, Nature Physics 4 , 198 (2008).
- 5Tanaka et al. (2003) H. Tanaka, K. Goto, M. Fujisawa, T. Ono, and Y. Uwatoko, Physica B: Condensed Matter 329-333, Part 2 , 697698 (2003).
- 6Rüegg et al. (2004) C. Rüegg, A. Furrer, D. Sheptyakov, T. Strässle, K. W. Krämer, H.-U. Güdel, and L. Mélési, Phys. Rev. Lett. 93 , 257201 (2004) . · doi ↗
- 7Goto et al. (2006) K. Goto, M. Fujisawa, H. Tanaka, Y. Uwatoko, A. Oosawa, T. Osakabe, and K. Kakurai, Journal of the Physical Society of Japan 75 , 064703 (2006) . · doi ↗
- 8Thede et al. (2014) M. Thede, A. Mannig, M. Månsson, D. Hüvonen, R. Khasanov, E. Morenzoni, and A. Zheludev, Phys. Rev. Lett. 112 , 087204 (2014) . · doi ↗