Inverse sensitivity of plasmonic nanosensors at the single-molecule limit
Boris Barbour

TL;DR
This paper critically examines the concept of inverse sensitivity in plasmonic nanosensors, questioning its consistency with established chemical principles and suggesting alternative explanations for observed phenomena.
Contribution
It provides a detailed critique of recent claims about inverse sensitivity, highlighting inconsistencies with known chemistry and proposing the need for alternative explanations.
Findings
Reported spectral changes likely require vastly more silver atoms than produced
The assay's mechanism appears incompatible with the law of mass action
Alternative explanations for the observed sensitivity are necessary
Abstract
Recent work using plasmonic nanosensors in a clinically relevant detection assay reports extreme sensitivity based upon a mechanism termed 'inverse sensitivity', whereby reduction of substrate concentration increases reaction rate, even at the single-molecule limit. This near-homoeopathic mechanism contradicts the law of mass action. The assay involves deposition of silver atoms upon gold nanostars, changing their absorption spectrum. Multiple additional aspects of the assay appear to be incompatible with settled chemical knowledge, in particular the detection of tiny numbers of silver atoms on a background of the classic 'silver mirror reaction'. Finally, it is estimated here that the reported spectral changes require some 2.5E11 times more silver atoms than are likely to be produced. It is suggested that alternative explanations must be sought for the original observations.
Click any figure to enlarge with its caption.
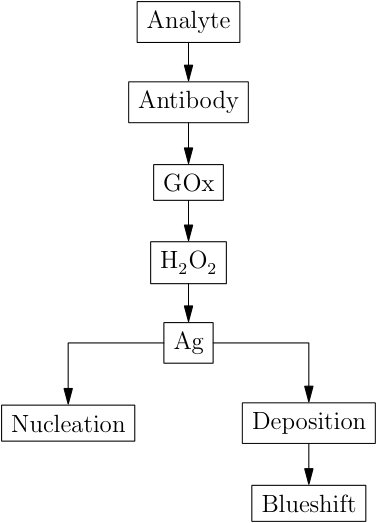 Figure 1
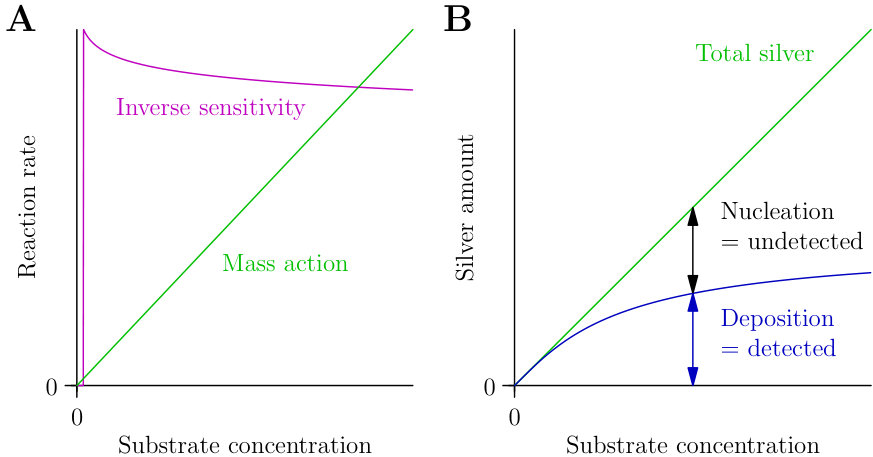 Figure 2
Peer Reviews
No public reviews on file for this paper yet. If you reviewed it on a platform where reviews are public (OpenReview, ICLR, NeurIPS, ICML), you can paste yours below so the community can read it here.
Videos
No videos yet. Explain this paper in a talk, walkthrough, or lecture? Add one.
Taxonomy
TopicsGold and Silver Nanoparticles Synthesis and Applications · Advanced biosensing and bioanalysis techniques · Electrochemical Analysis and Applications
Inverse sensitivity of plasmonic nanosensors at the single-molecule limit
Boris Barbour
Institut de Biologie de l’Ecole Normale Supérieure
CNRS UMR 8197
INSERM U1024
PSL Research University
75005 Paris
France
Email: [email protected]
Abstract
Recent work using plasmonic nanosensors in a clinically relevant detection assay reports extreme sensitivity based upon a mechanism termed inverse sensitivity, whereby reduction of substrate concentration increases reaction rate, even at the single-molecule limit. This near-homœopathic mechanism contradicts the law of mass action. The assay involves deposition of silver atoms upon gold nanostars, changing their absorption spectrum. Multiple additional aspects of the assay appear to be incompatible with settled chemical knowledge, in particular the detection of tiny numbers of silver atoms on a background of the classic ‘silver mirror reaction’. Finally, it is estimated here that the reported spectral changes require some imes more silver atoms than are likely to be produced. It is suggested that alternative explanations must be sought for the original observations.
1 Introduction
Rodriguez-Lorenzo et al. [1] report an ultra-sensitive method for detecting analytes that can be recognised by an antibody. The PSA protein is used to demonstrate the technique. The basis of the assay is for the antigen to be recognised by antibodies conjugated with the glucose oxidase enzyme (GOx), which then produces hydrogen peroxide. The \ceH_2O_2 in turn reduces silver ions, the resulting silver atoms being deposited on gold nanoparticles (‘nanostars’). The deposition is detected by a blueshift of the absorption spectrum of the solution of gold nanoparticles. The reactions are summarised in Fig. 1 of this analysis.
2 Inverse sensitivity
Rodriguez-Lorenzo et al. [1] report bizarre, less-is-more reaction kinetics, according to which the reaction proceeds more quickly as the substrate concentration is reduced close to zero. In their own words (from the abstract of their paper):
However, because conventional transducers generate a signal that is directly proportional to the concentration of the target molecule, ultralow concentrations of the molecule result in variations in the physical properties of the sensor that are tiny, and therefore difficult to detect with confidence. Here we present a signal-generation mechanism that redefines the limit of detection of nanoparticle sensors by inducing a signal that is larger when the target molecule is less concentrated.
The approximate form of the kinetics is sketched in Fig. 2A. As the substrate concentration is increased, the reaction rate rises abruptly from zero and then declines logarithmically (the authors’ plots are semi-logarithmic) from a peak at extraordinarily low concentrations. In the GOx-detection experiment of their Fig. 1c, that peak occurs at a concentration where less than one molecule of GOx is expected to be present in the reaction volume (this is calculated in the next section). In contrast, the law of mass action states that the reaction rate is proportional to the product of the substrate concentrations (more accurately activities). Since only the analyte concentration is varied in the present experiments and it only appears with first-order kinetics, the reaction rate should simply be proportional to the analyte concentration at low concentrations111There is maybe some uncertainty regarding the dependence of the blueshift of the absorbance peak on the amount of silver deposited, but the former can be assumed to be an increasing function of the latter, so the conclusions reached here would be unaffected by the details of the relation.. ‘Inverse sensitivity’ appears to be spectacularly incompatible with the law of mass action.
The ‘explanation’ offered by Rodriguez-Lorenzo et al. [1] for this discrepancy is that spontaneous nucleation of pure silver nanoparticles at high concentrations bypasses the deposition of silver on the gold nanostars. Inspection of the assay reactions (Fig. 1 of this analysis) shows that only the right-hand branch, in which silver ions are deposited on the gold nanostars, leads to the blueshift used to detect the analyte. Thus, the presence of a competing nucleation reaction can only reduce reaction sensitivity (Fig. 2B of this analysis), irrespective of the dependence of silver production, nucleation and deposition on analyte concentration. Nucleation cannot increase assay sensitivity222It is possible that in their conceptual argument the authors have confused the slope of the analyte-blueshift curve, which could conceivably become negative at high silver concentrations, with the absolute blueshift. In any case, what matters is the sensitivity at low analyte concentrations, where the nucleation reaction is unlikely to proceed..
3 Sensitivity and noise
The assay is reported to have extraordinary sensitivity and exceptionally low noise levels.
Fig. 2c of the paper (note that this and all figure references below are to those in ref [1]) reports the detection of the difference between zero glucose oxidase and glucose oxidase, which represents an average of 0.04 molecules of GOx (MW = ) per ml. The precise reaction volume is not reported in the paper, but would need to have been about to have had a chance of containing a single molecule of GOx. A reaction volume of was used elsewhere in the paper. As no statistics are given for this figure, this observation may have been a lucky event whose replication was never attempted.
Fig. 4 shows a quantification of the variability of the assay. In both panels a and b, we see that PSA in the reaction volume of is detected with fantastic precision compared to the amount of . At both concentrations, the standard deviation of the assay signal is in most cases smaller than the symbol and in all cases smaller than a few percent of the maximum signal. But of PSA represents an average of just 23 molecules in the reaction volume of 1 ml. Such small quantities would necessarily exhibit stochastic variation in the number of molecules present. By Poisson statistics, 23 molecules should be associated with a standard deviation of , equivalent to . This moreover represents a minimum. The signal amplification required to detect such small quantities would certainly contribute additional (high levels of) noise. Yet the authors consistently report improbably low standard deviations.
This amazing sensitivity is at odds with a publication that predated Rodriguez-Lorenzo et al. Li et al. [2], who used a variation of the present assay to detect glucose (of which more below) with an excess of GOx (as opposed to detecting GOx with excess glucose). Li et al. report a detection threshold of 10 nM (although their Fig. 1 suggests that values in the micromolar range might be more realistic). Even if a GOx molecule will obviously produce more silver than a glucose molecule (estimated below), the difference between the claimed detection thresholds for Li et al. and Rodriguez-Lorenzo et al. is extreme: vs. , a factor of .
That single-molecule sensitivity is rendered even more unexpected by another result in Li et al. [2]. In their Fig. S7, they compare the abilities of glucose and \ceH_2O_2 to reduce silver ions. They report that \ceH_2O_2 is much less effective. From this we deduce that each molecule of \ceH_2O_2 is by no means guaranteed to reduce a silver ion. A poor yield at this stage of the assay would reduce its sensitivity even further, making single-molecule detection even more implausible.
4 Silver mirror reaction
Another problem is that the deposition of silver is triggered using a mixture of \ceAgNO_3 and \ceNH_3. The authors describe silver being deposited on the gold nanoparticles (or aggregating via nucleation and growth) as a result of reduction by the \ceH_2O_2 produced by glucose oxidase. In order for this to allow detection of single molecules, a strict requirement is that absolutely no silver at all be deposited in the absence of GOx and the \ceH_2O_2 it produces. However, it turns out that the assay reaction probably contained two sources of reductants that were neither acknowledged nor apparent in the results. Either of these sources would generate background reductant concentration in excess of that arising during the claimed detection of single analyte molecules.
The authors seem to have been unaware that they were using a classic classroom reaction called the ‘silver mirror reaction’. The mixture of \ceAgNO_3 and \ceNH_3 is called Tollen’s reagent and is used to detect aldehydes, whose presence triggers the deposition of a visually impressive silver layer on any available surface. A nice description of the reaction for motivating secondary school chemistry classes can be found on the Royal Chemistry Society web site [3]. As demonstrated in that example, the reaction will produce a positive in the presence of glucose, which has an aldehyde form in solution. The problem is that in the assay of Rodriguez-Lorenzo et al., glucose is present as the substrate for glucose oxidase. It seems inconceivable that it would not produce much more silver deposition than the tiny amounts of \ceH_2O_2 produced by a few glucose oxidase molecules.
The paper by Li et al. [2] provides direct support for our assertion that glucose would reduce silver and generate a signal, because they apply this assay precisely for the detection of glucose! The glucose present in all experiments of Rodriguez-Lorenzo et al. would therefore generate a saturating reduction of silver, against which background it would presumably be impossible to detect single-molecule signals. In any case, these expected and demonstrated background signals are simply absent from the results reported by Rodriguez-Lorenzo et al.
The assay potentially contains a second source of reductant able to swamp single-molecule signals. Luo et al. [4] report that gold nanoparticles can catalyse the oxidation of glucose, producing \ceH_2O_2. This catalysis is quite efficient for bare nanoparticles. Some coatings of the gold can prevent the catalysis and this may pertain in the experiments of Rodriguez-Lorenzo et al. However, the covering would have to be perfect to allow single-molecule detection.
5 Nanoparticle numbers
There are two further issues with quantitative aspects of the assay as reported by the authors. I give a brief overview before expounding the detailed arguments.
The first problem is that the quantities of enzyme involved will produce absolutely tiny amounts of \ceH_2O_2 and correspondingly tiny amounts of silver—enough to deposit only a single atom on each of a very small fraction of the gold nanoparticles present. It is extremely unlikely that addition of a single atom will detectably change the absorbance spectrum of the nanoparticle.
The second and related problem is that the expected large fraction of unmodified nanoparticles appears not to contribute to the reported spectrum. Because the assay signal is the absorbance of a dilute solution of nanoparticles, each nanoparticle will contribute approximately independently to that absorbance. In the absence of silver deposition, a control spectrum is obtained. Modified nanoparticles would have a different spectrum depending on the degree of modification. If a solution contains modified and unmodified nanoparticles, a simple mixture of the two spectra should be obtained. However, even under conditions where a very large fraction of nanoparticles must have been unmodified, their dominant contribution to the mixture spectrum was apparently absent.
The more detailed explanations follow below and in the next section.
The assay is in two stages. \ceH_2O_2 is produced by the action of GOx attached to the nanostars for 1 hour, then the silver ions are added to trigger the silver deposition and/or nucleation, which are allowed to proceed for another 2 hours. The precise reaction mixture for the second stage is \ceAgNO_3 + \ceNH_3 added to the MES buffer (pH 5.9) already present.
A first remark is that GOx is presumably totally inactivated by the basic pH 10 of the second stage after addition of \ceNH_3 (see Fig. 5 of ref [5]). It also seems that GOx is strongly inhibited by silver ions [6]. So it is unnecessary to consider \ceH_2O_2 and silver produced next to the nanostars, just the \ceH_2O_2 concentration existing in the bulk solution at the end of the first stage and the silver it produces during the second stage. There is therefore no kinetic advantage in attaching the GOx to the nanostars.
What is the concentration of \ceH_2O_2? The authors have omitted details about the GOx used, so we’ll assume it is the most active one available from Sigma: G7141, with an activity of 100000–250000 units/g [7]. The unit definition is:
One unit will oxidize 1.0 mole of -D-glucose to D-gluconolactone and \ceH_2O_2 per min at pH 5.1 at equivalent to an \ceO_2 uptake of 22.4 l/min. If the reaction mixture is saturated with oxygen, the activity may increase by up to .
Another Sigma page [8] indicates that the final glucose concentration under the conditions for the unit definition is or —similar to the used by the authors.
Consider Fig. 2 and in particular the spectra in panel b for zero glucose oxidase (black, blue) and GOx (red). Using the enzyme activity values just given, it can be calculated that this low concentration of GOx would produce an \ceH_2O_2 concentration of after 1 hour. Generously assuming the production of one silver atom per \ceH_2O_2 molecule, silver atoms would be produced. (Above, we mentioned results that suggest that this conversion is far from complete, which would result in many fewer silver atoms.)
We now calculate the number of nanostars. The concentration of nanostars is presumably the same as in the assays: [Au] = (Methods). We’ll also need the following values: nanostar diameter (Fig. 2a; Methods), so radius ; density of gold ; atomic weight of gold 197. The volume of a nanostar (assumed spherical) would be . This would contain of gold or . So of [Au] should contain anostars.
There would therefore only be enough silver to deposit just one atom on each of (about 1 in 260000) of the nanostars. The rest would have no deposited silver. As mentioned above, such a minimal modification as deposition of a single silver atom is very unlikely to produce a detectable change of absorbance of a nanostar; we estimate in the next section the amount of silver deposition necessary to create the spectral changes reported.
Furthermore, at least of the nanostars must be unaltered. They would necessarily have the same spectrum as those in the zero GOx control. The small admixture of the nanostars each modified by a single silver atom will presumably make very little difference. Yet hugely different spectra are reported. Please compare again the black and red spectra, and consider that the difference is supposed to result from of nanostars having a single silver ion deposited on them. In reality, a spectrum dominated by the majority unmodified nanostars and therefore almost identical to the control spectrum would be expected.
A similar, if slightly less extreme, problem exists for the PSA assays of Fig. 4, which show very strong signal at PSA and for which the exact gold concentration is specified (i.e. [Au] = ). If we make the very generous assumption that each PSA molecule has attached to it 100 GOx molecules, still only about 1 in 4 nanostars will receive a solitary silver ion, with the rest being unaltered.
6 Expected blueshift
I now estimate the amount of silver deposition required to produce the reported spectral shifts of nanostar absorbance.
In general, unadorned gold nanoparticles are associated with a (relatively) red absorbance peak, while those with silver shells display a peak that is closer to the blue. The spectral peaks in Rodriguez-Lorenzo et al. are rather red-shifted compared to most of the spectra in the literature; presumably because of the relatively large size of the present nanoparticles.
The key observation is that under conditions where silver is supposed to have been deposited on the nanostars, there is no sign of the spectral peak attributable to the unmodified gold nanostars. In particular, the spectrum for GOx of Fig. 2b (red) shows no sign of the peak seen in the control spectra (black and blue). This suggests that the majority of nanostars have been coated with a silver layer sufficient to obscure the gold peak. I’ll try to estimate this thickness with reference to work in the literature.
This simple calculation will assume spherical nanoparticles. Conveniently, the densities and atomic weights of silver ( and 108) are such that metallic gold ( and 197) and silver contain very similar numbers of atoms per unit volume.
Kim et al. [9] measure spectra before and after silver deposition. They report the spectra of gold-core nanoparticles with silver shells for different mole fractions of the two metals. By a little elementary geometry, we can obtain the thickness of the silver shell from the radius of the gold core () and the silver mole fraction ():
[TABLE]
The volume of silver per nanoparticle is
[TABLE]
and if the volume is in cubic metres, the number of silver atoms is then
[TABLE]
Fig. 2 of ref [9] shows the growth of a blueshifted peak that eventually obscures the red peak from the gold core. Two particle sizes of diameters 13 nm and 25 nm were tested. With the smaller one, none of the silver mole fractions tested obscured the gold peak in the way seen in Fig. 2b of Rodriguez-Lorenzo et al. Such an effect is, however, observed with the larger particles. The largest silver mole fraction for which the gold peak is still larger than the silver one (and therefore still definitely detectable) is 0.25. This corresponds to an average silver layer thickness of about 1.3 nm. Even on such small nanoparticles this would imply ilver atoms per nanoparticle. (Note that the nanostars are larger and have an increased surface area because of their shape, but my aim here is to avoid overestimating the number of silver atoms.)
If there are nanostars (see previous section), that would imply that 1 ml of solution would require deposition of at least ilver atoms to achieve the observed spectral shift. The discrepancy with the maximum number of hat could be produced by GOx (calculated above) is a mere factor of . Beside this large number, the various imprecisions in my calculation (size of the nanostars, any specific plasmonic effects associated with the vertices of the nanostars) are probably irrelevant.
7 Summary
The premise of inverse sensitivity in Rodriguez-Lorenzo et al. [1], that a competing reaction can increase the sensitivity of an assay at the single-molecule limit, seems to be kinetic nonsense. They report detection of GOx when the reaction volume would only rarely have contained a single molecule. The detection of small numbers of analyte molecules does not display the stochastic variability expected. The detection of tiny numbers of silver atoms is implicitly claimed, but the assay conditions contain a textbook reaction for producing silver atoms in large quantities independently of the analyte detection mechanism. The complete disappearance of the spectral peak of gold nanostars unmodified by silver atoms is hard to reconcile with the estimate that only a tiny fraction of stars will receive even a single silver atom. The apparent discrepancy between the amount of silver likely to be produced by analyte detection and that estimated to be required to produce the changes of the absorbance spectrum is a factor of at least . The authors should provide a more plausible explanation for their observations.
8 Acknowledgements
This analysis is based upon comments I posted on the PubPeer platform as Peer 2:
https://pubpeer.com/publications/3E8208F0654769A44C22D4E78DA2B8.
My attention was drawn to the article by the initial comments on the paper by Peer 1.
The reference list from the paper itself. Each links out to its DOI / PubMed record.
- 1Rodríguez-Lorenzo et al. [2012] Laura Rodríguez-Lorenzo, Roberto de la Rica, Ramón A. Álvarez-Puebla, Luis M. Liz-Marzán, and Molly M. Stevens. Plasmonic nanosensors with inverse sensitivity by means of enzyme-guided crystal growth. Nat Mater , 11:604–607, 2012. URL http://dx.doi.org/10.1038/nmat 3337 . · doi ↗
- 2Li et al. [2011] Tangsong Li, Kui Zhu, Sha He, Xi Xia, Shaoqin Liu, Zhuo Wang, and Xingyu Jiang. Sensitive detection of glucose based on gold nanoparticles assisted silver mirror reaction. Analyst , 136:2893–2896, 2011. URL http://dx.doi.org/10.1039/c 1an 15256 d . · doi ↗
- 3[3] RSC web site. URL http://www.rsc.org/Education/Ei C/issues/2007 Jan/Exhibition Chemistry.asp .
- 4Luo et al. [2010] Weijie Luo, Changfeng Zhu, Shao Su, Di Li, Yao He, Qing Huang, and Chunhai Fan. Self-catalyzed, self-limiting growth of glucose oxidase-mimicking gold nanoparticles. ACS Nano , 4:7451–7458, 2010. URL http://dx.doi.org/10.1021/nn 102592 h . · doi ↗
- 5Wilson and Turner [1992] R. Wilson and A. P. F. Turner. Glucose oxidase: an ideal enzyme. Biosensors and Bioelectronics , 7:165–185, 1992. doi: 10.1016/0956-5663(92)87013-F .
- 6Nakamura and Ogura [1968] S. Nakamura and Y. Ogura. Mode of inhibition of glucose oxidase by metal ions. Journal of Biochemistry , 64:439–447, 1968.
- 7sig [a] Sigma G Ox page., a. URL http://www.sigmaaldrich.com/catalog/product/sigma/g 7141 .
- 8sig [b] Sigma G Ox assay conditions., b. URL http://www.sigmaaldrich.com/technical-documents/protocols/biology/enzymatic-assay-of-glucose-oxidase.html .