Reactor antineutrino shoulder explained by energy scale nonlinearities?
G. Mention, M. Vivier, J. Gaffiot, T. Lasserre, A. Letourneau, T., Materna

TL;DR
This paper investigates whether nonlinearities in the energy scale calibration of reactor antineutrino detectors can explain the observed spectral distortions, suggesting calibration issues as an alternative to new physics or spectrum models.
Contribution
The study demonstrates that a small, about 1%, nonlinear energy scale deviation can account for the spectral shoulder observed in reactor antineutrino experiments, within calibration uncertainties.
Findings
A 1% energy scale deviation reproduces the spectral distortion.
The deviation remains consistent with calibration data and Boron 12 spectrum.
Calibration uncertainties could explain the observed anomaly.
Abstract
The Daya Bay, Double Chooz and RENO experiments recently observed a significant distortion in their detected reactor antineutrino spectra, being at odds with the current predictions. Although such a result suggests to revisit the current reactor antineutrino spectra modeling, an alternative scenario, which could potentially explain this anomaly, is explored in this letter. Using an appropriate statistical method, a study of the Daya Bay experiment energy scale is performed. While still being in agreement with the {\gamma} calibration data and Boron 12 measured spectrum, it is shown that a O(1%) deviation of the energy scale reproduces the distortion observed in the Daya Bay spectrum, remaining within the quoted calibration uncertainties. Potential origins of such a deviation, which challenge the energy calibration of these detectors, are finally discussed.
Click any figure to enlarge with its caption.
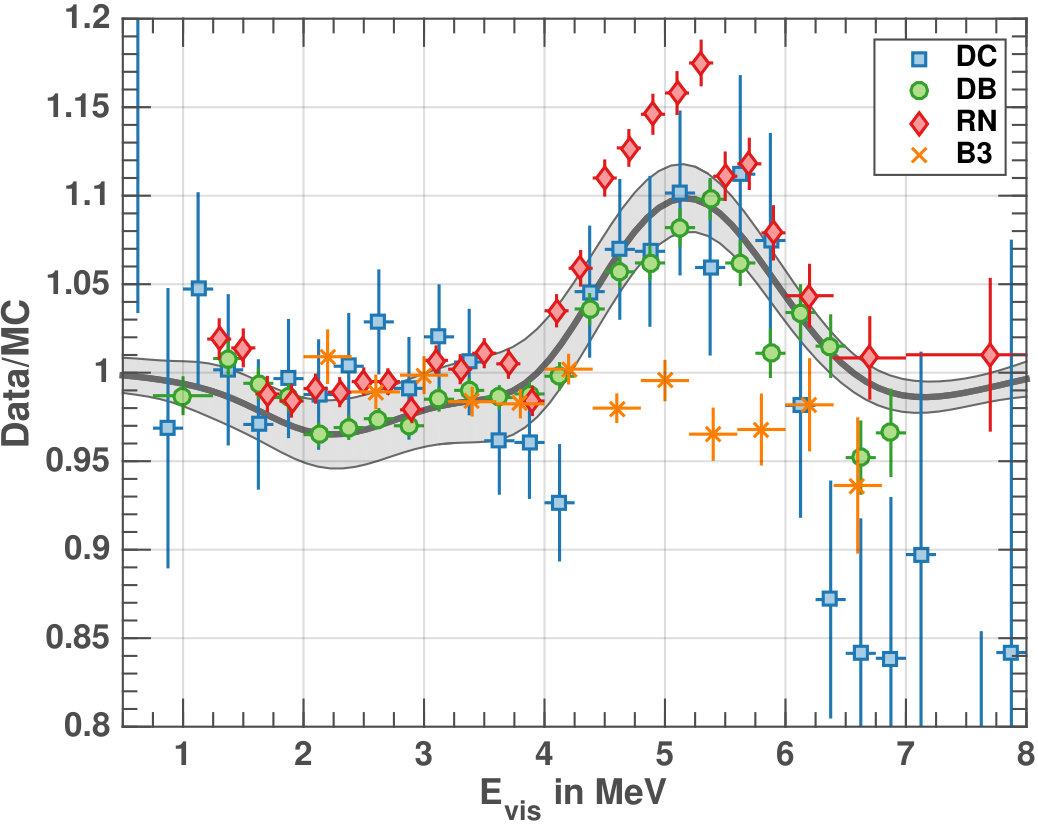 Figure 1
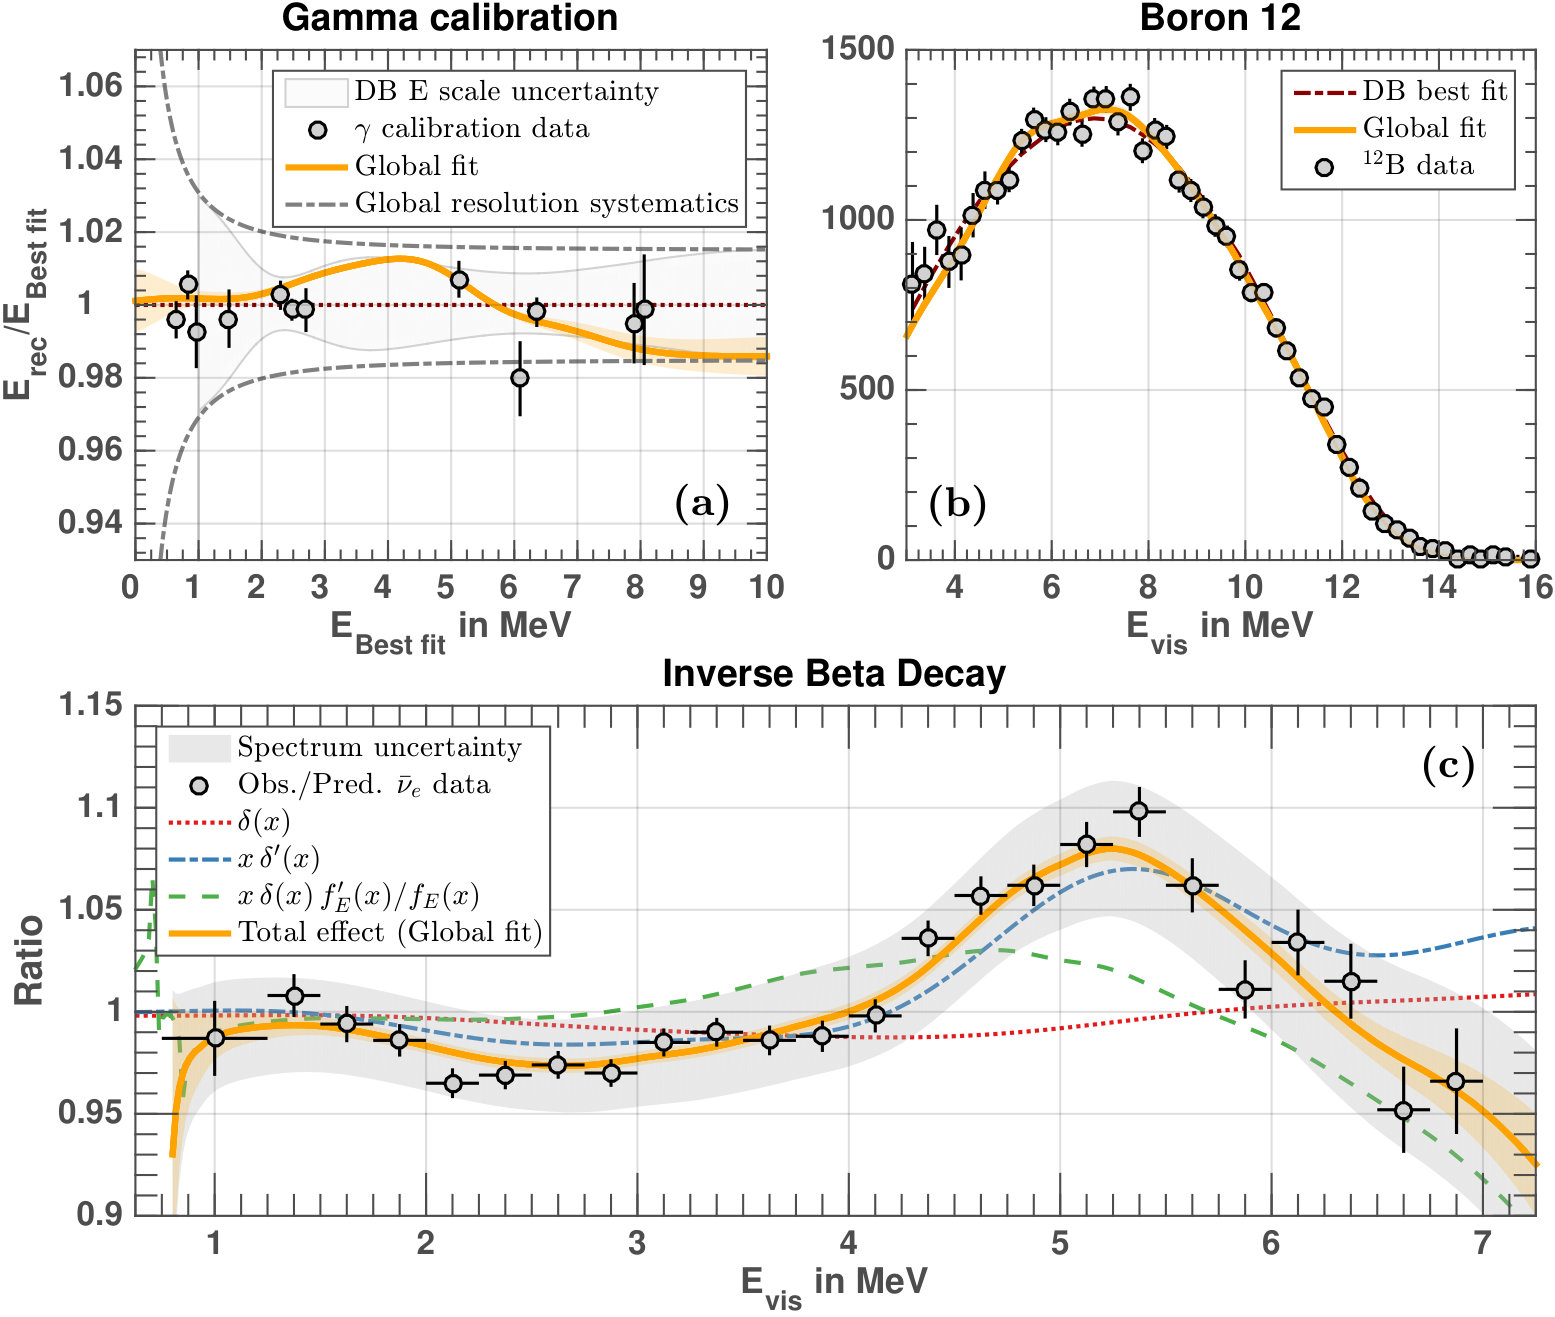 Figure 2
| Bugey 3 | 53.8 | 32.8 | 7.8 | 5.6 |
|---|---|---|---|---|
| Double Chooz | 49.6 | 35.1 | 8.7 | 6.6 |
| Daya Bay | 58.6 | 28.8 | 7.6 | 5.0 |
| RENO | 56.9 | 30.1 | 7.3 | 5.6 |
Peer Reviews
No public reviews on file for this paper yet. If you reviewed it on a platform where reviews are public (OpenReview, ICLR, NeurIPS, ICML), you can paste yours below so the community can read it here.
Videos
No videos yet. Explain this paper in a talk, walkthrough, or lecture? Add one.
Reactor antineutrino shoulder explained by energy scale nonlinearities?
G. Mention*(a), M. Vivier(a), J. Gaffiot(a), T. Lasserre(a,b), A. Letourneau(a), T. Materna(a)*
*(a)*IRFU, CEA, Universit Paris-Saclay, F-91191 Gif-sur-Yvette, France
*(b)*AstroParticule et Cosmologie, Universit Paris Diderot, CNRS/IN2P3, CEA/DRF/IRFU, Observatoire de Paris, Sorbonne Paris Cit , 75205 Paris Cedex 13, France.
Abstract
The Daya Bay, Double Chooz and RENO experiments recently observed a significant distortion in their detected reactor antineutrino spectra, being at odds with the current predictions. Although such a result suggests to revisit the current reactor antineutrino spectra modeling, an alternative scenario, which could potentially explain this anomaly, is explored in this letter. Using an appropriate statistical method, a study of the Daya Bay experiment energy scale is performed. While still being in agreement with the calibration data and measured spectrum, it is shown that a deviation of the energy scale reproduces the distortion observed in the Daya Bay spectrum, remaining within the quoted calibration uncertainties. Potential origins of such a deviation, which challenge the energy calibration of these detectors, are finally discussed.
keywords:
Reactor , antineutrino , spectra , energy nonlinearity , statistical analysis.
1 Introduction
Reactor antineutrino experiments have played a leading role in neutrino physics starting with the discovery of the electron antineutrino in 1956 [1, 2], through the first observed oscillation pattern in KamLAND [11], up to recent high precision measurements on the mixing angle [3, 4, 5]. Future projects JUNO [13] and RENO50 [14] even aim at reaching sub-percent accuracy on on top of solving the neutrino mass hierarchy puzzle. However, two anomalies in the measured antineutrino spectra are being observed. The first is an overall rate deficit around 6% known as “The reactor antineutrino anomaly” [8]. The second one is a shape distortion in the 4–6 MeV region, often quoted as a “bump” or “shoulder” in the spectra. It should be particularly stressed out that the relation between these two anomalies is not straightforward since shape distortion does not necessarily imply a change in the total rate.
This letter focuses on the second anomaly. In Section 2, a quantitative comparison of four reactor antineutrino experiments (Bugey 3 [9], Daya Bay [4], Double Chooz [3] and RENO [5]) is performed to demonstrate their incompatibility, thus questioning nuclear effects as a common origin, as proposed in [10]. The next sections are dedicated to the study of an alternative scenario accounting for the observed distortion. Section 3 reviews the energy scale determination in such reactor antineutrino experiments. Section 4 introduces a combined analysis of the Daya Bay calibration and reactor antineutrino data. Results are presented in section 5 and show that a 1% unaccounted break at 4 MeV in the energy scale can reproduce the observed antineutrino spectrum and still comply with calibration data within uncertainties. Section 6 discusses possible origins of such an energy nonlinearity and especially questions calibration of such detectors.
2 Reactor spectra comparison
2.1 On statistical compatibility of reactor spectra
Among all existing reactor antineutrino experiments, four of them gives precise reactor spectra shape information. The Bugey 3 experiment (B3) [9] has until recently provided the finest reactor antineutrino spectrum. The B3 measurement was in very good agreement with previous predictions [15, 16, 17]. The comparison is here updated to the most recent predictions [6, 7]. As indicated on Figure 1, the net effect is an additional 1%/MeV decrease through the full energy range. This update is still compatible with prediction within the 2% linear spectral uncertainty envelop quoted in [9]. New measurements have been provided by three experiments: Double Chooz (DC) [3], Daya Bay (DB) [4] and RENO (RN) [5]. Their ratios to the state of the art prediction [6, 7] are depicted on Figure 1 and exhibit a significant deviation from unity around 5 MeV. At first glance they clearly show a common feature which is described as a bump in the 4 to 6 MeV region. Nevertheless, to our knowledge, no quantitative comparison is available in the literature.
To gain quantitative insights on their compatibility, each spectrum having different bin centers and widths, a direct comparison is not possible. A bespoke statistical test was constructed to assess if all the observed spectra could come from a common unique distribution. This shared distribution was estimated thanks to a approach using a Gaussian mixture model [22]. Such an approach offers the advantages of being reactor modeling independent and flexible enough to accurately fit each single data set. To do so, a large number (K=42) of knots were used, evenly distributed between 0 and 10 MeV. The spectral density, , with weight parameters , a bandwidth fixed to the inter-knot distance , being the standard normal probability distribution function, was then integrated over each bin width to properly model their content. On top of statistical uncertainties, normalization and linear energy scale uncertainties were included in covariance matrices. For DC a 1% in normalization and scale was used, for DB a 2.1% and 1%, for RN a 1.5% and 1% and for B3 a 4% and 1.4% as published by the collaborations [3, 4, 5, 9]. The was expanded with a quadratic term penalizing higher local curvatures for smoothness: . The amplitude of the positive parameter controls the regularization strength or equivalently the smoothness of the fitting function. It was automatically determined from data through the generalized cross validation method [21]. This procedure is nearly equivalent to minimizing the model predictive error. The optimization of the global was iteratively performed until reaching convergence, each step alternating between the function minimization with respect to the parameters and the generalized cross validation criterion minimization with respect to . The model was fitted to all possible subset of experiments. While our method was able to individually reproduce each spectrum accurately adjusting differently the and coefficients, it prominently stressed out their inconsistency when combined. A parametric bootstrap procedure was used to estimate the distribution. For each experiment, the combined best fit model (gray curve on Figure 1) was used to draw Monte Carlo simulations using their respective covariance matrix. Each of these four experiment data set was fitted with the same global framework and the residual sum of squares was computed. Their distribution was found to follow with a good accuracy a Gamma probability density function with a shape parameter of and a scale parameter of . The associated p-value was estimated using another Monte Carlo simulations, because of the uncertainties on the Gamma PDF fitted parameters. The percentile of the p-value distribution was found below while the median was located around . As a prominent conclusion, the observed spectra cannot come from a unique distribution with a high statistical significance (more than at CL). This result is mostly driven by the mismatch between the DB, RN and B3 spectra since they have by far the highest statistics. Any combination of two of these three experiments is also not consistent. Note that DB and RN chose a different ad hoc normalization. A quick integration of their respective spectra seems to indicate a 2.9% offset in their respective normalization. Our aforementioned procedure outputs respectively a median 3.4 (4 ) incompatibility with (without) this normalization adjustment. A normalization free fit (increasing normalization uncertainties to infinity in both DB and RN covariance matrices), yields a consistent result with a 3.4 incompatibility (p-value below . Except for DC whose tests are compatible with all other experiments within 1.6 , the lowest rejection significance between pairs of experiments was found for DB and B3, with a 2.5 significance. A free norm fit still yielded a 2.3 significance rejection of compatibility hypothesis.
2.2 On isotopic compatibility of reactor spectra
On the antineutrino production side, all reactors are similar pressurized water reactors. Seeking for differences among experiments, the core isotopic composition is the main differing component which could play a major role in the antineutrino spectral shape. For a complete fuel burning (a 60-70 GWd/t burnup), the reactor antineutrino rates are known to roughly decrease by and the spectra to tilt by approximately between the fresh beginning and the far end of nuclear fuel burning. This effect is reduced by a factor 3 to 4 taking into account reactor operations where fuel assemblies are refreshed by thirds or quarters of the whole core. As indicated in Table 1, the average isotopic compositions over the data taking periods are very close from each other [3, 4, 5, 9]. On the one hand, DB and RN have isotopic compositions which differ upmost by (mixture of 6 cores with comparable fuels), but disagree on the distortion amplitude by 60%. On the other hand DC has the most burnt makeup among the four experiments and displays a distortion amplitude comparable to DB, while B3 reactor composition is half-way between DC and DB but does not observe any distortion in the spectrum. There is no simple coherent pattern explaining these variations with isotopic compositions. In a more complex scenario if the antineutrino spectra were extremely sensitive to fission fractions from each reactor, the near/far relative measurement strategy for the quest would have failed. With many cores and the disparity of solid angle exposures among each detector, the near/far ratios of DB and alike experiments would also be distorted from one another to a large extent.
As a conclusion, the differences in the published DC, DB, RN and B3 data-to-prediction ratios cannot be explained by core isotopic compositions and therefore, must have another origin. Considering these distortions are proportional to reactor powers [3], a remaining possibility is to investigate at potential detector effects. While not being a definitive argument, it seems more likely to distort an energy scale and produce warped observed spectra to explain DC, DB and RN [3, 4, 5] than to wipe out a suspected spectral distortion with the exact required compensation from the energy scale to explain the flatness of spectra ratio in B3 [9]. In the next sections unassessed residual nonlinearities in energy scales are studied as a potential scenario to explain not only the difference between experiments but also the mismatches in the data-to-prediction ratios.
3 Energy determination
The four aforementioned experiments detect antineutrinos in liquid scintillators through the inverse decay reaction: . In this process, most of the antineutrino energy is directly conveyed to the positron with nuclear recoil effects totalizing an uppermost 0.1%/MeV correction on positron/antineutrino energy. Antineutrino spectra are therefore well acquired through counting and energy determination of the detected positron. Such positrons deposit their energy in the scintillator, with subsequent light emission through energy transfers between solvent, primary and secondary fluors. The light yield scales nonlinearly with the deposited energy (with a characteristic energy distortion below and above 1 MeV [4]). Dedicated and careful laboratory measurements are required for every liquid scintillator to achieve an energy determination accuracy at [18, 19]. The faint scintillation light is converted using photomultipliers tube (PMTs) to measurable pC charge signals to estimate the energy of the incident particle. Because of the data acquisition systems, digitization process, detection threshold effects, width of time window for charge acquisition, the typical nonlinearity in charge collection amounts to [4]. These effects are peculiar to each acquisition system [3, 4] and special LED and calibration runs are used to characterize the full electronic acquisition chain.
To study the robustness and flexibility of the energy scale calibration, the most stringent Daya Bay results along with their recent reactor antineutrino spectrum deconvolution [4], corrected from oscillation effect, have been considered. The same studies could however be directly applied to the other reactor experiments. The Daya Bay experiment used dedicated calibration sources as well as spectrum to estimate and constrain the energy scale nonlinearities with an empirical model [4]. This model is a twofold factor, with a first term accounting for scintillation physics, and a second one accounting for electronic nonlinearities. Such an arbitrary function was designed to fit well the available data points, as illustrated on Figures 2 (a) ( sources) and (b) ( spectrum). The data points correspond to the ratios between reconstructed energies and those estimated from the best fitted empirical model [4]. A gray shaded area indicates the uncertainty envelope estimated from the comparison of 5 empirical models describing the energy scale nonlinearities [4]. However, a fit to the relative energy resolution was also provided:
[TABLE]
with , and [20] as the fitted parameters. While is governed by photostatistics, and are related to systematic effects. Parameter is driven by spatial and temporal variations throughout the detector while arises from intrinsic PMT and electronic noise. They both assess that the energy scale uncertainty is rather above 1.5% than below 1% [4]. Double Chooz obtained a comparable larger value [3]. Taking into account these two systematic effect evaluations from and a more conservative systematic uncertainty corridor was also displayed on Figure 2 (a).
Because the scintillation quenching depends on the particle type, from radioactive sources and neutron captures, from spectrum, from antineutrino inverse decay reaction do not produce the same amount of light for a given deposited energy. Tackling further associated nonlinearities would require to have a complete Monte Carlo simulation with scintillator content and Cherenkov radiation modeling, which is not within the scope of this article. As opposed to scintillation light emission, electronic charge collection nonlinearity is identical whatever the particle type is, and will be our focus in what follows.
4 Residual nonlinearity matching
The aim of the present study is to assess if a small residual nonlinearity (RNL) in the energy scale can both explain the observed reactor antineutrino spectra and calibration data. For this purpose, an RNL function , which adds more flexibility to the empirical model used by DB, was introduced. As such, the probability density functions (PDF) of the DB nominal reconstructed energies, , and of the transformed energies, , are related through: . A more straightforward expression of the transformed energy PDF is:
[TABLE]
where is the cumulative distribution function (CDF) of the original energy variable. The RNL function may also be expressed through the relative energy scale distortion :
[TABLE]
The transformation relationship between the PDFs allows to simultaneously determine (or equivalently ) on calibration, and data. The function was estimated using a global fitting framework on the 3 independent data sets and an additional regularization term as in section 2:
[TABLE]
The associated to calibration data was defined as
[TABLE]
where correspond to the data points with associated uncertainties , as illustrated on Figure 2 (a). The associated to data was included as
[TABLE]
where are the ratios of the observed to predicted antineutrino spectra ( effect already removed) displayed on Figure 2 (c), the associated uncertainties, an additional detector normalization uncertainty of 2.1% [4] and the corresponding nuisance parameter. Eventually, the associated to spectrum was constructed as follows:
[TABLE]
where are the experimental spectrum bin values with uncertainties . The data were freely fitted with both and components as in [4], as no further prior rate information was available. Using Equation (2), the (), () and () count rates are given by:
[TABLE]
where and are the bin center and width respectively, is the associated CDF in the original energy variable, . is a nominal normalization factor given in [4]. was determined from interpolation of Monte Carlo spectra from [4]. The target data set is indicated in the superscript parentheses (⋅) as in Equations (6) and (7). The data-to-prediction ratio was then estimated using the quotient between the above expression and the nominal DB prediction [4]. For small RNL (), can be expressed as . A Gaussian mixture model [22] was chosen for modeling with evenly spaced knots, , between 0 and 16 MeV, a bandwidth, , equal to the inter-knot distance: , where, is the standard normal probability distribution function. The relative distortion just defined is rather flexible. To avoid data overfitting, the last term in our global Definition (4) is a quadratic regularization term penalizing higher local curvatures in as described in section 2: . The regularization level, , was self-determined from data through the generalized cross validation method [21]. The optimization was found to be still slightly sensitive to the number and the position of the knots. To further prevent this, an extra regularization procedure was used to complement the global penalization term. While the bandwidth was kept fixed to the inter-knot distance, the number of knots, , was chosen with respect to the quality of the standardized fit output residuals. It had to be large enough to correctly model the distortions (more than knots) but small enough to avoid overfitting (less than knots). An optimum of knots was selected, corresponding to a standardized residual distribution the closest to a standard normal distribution among our investigations.
5 Results
Figure 2 presents the output of the global function (4) optimization. The RNL best fit appears in orange thick solid line with a shaded orange area indicating the uncertainty. The best fit result gives (p-value of ) with a standardized residual distribution following the standard normal distribution. The fitted distortion correctly reproduces the calibrations, the constraint and the observed antineutrino spectrum warping. The best fit RNL agrees within with the calibration data points. The and around 2.5 MeV as well as the at 6 MeV are slightly off by less than from the best fit. It is worth noting that the obtained RNL is still compatible with the uncertainties originally quoted by the DB collaboration (gray shaded area on Figure 2(a)). Furthermore, the frequently mentioned constraint of the spectrum is validated, with a fit comparable to the nominal DB one [4]. The ratio of observed to predicted antineutrino spectra is well reproduced with such a fitted RNL. As shown by Figure 2(c), all data points fall within the gray shaded area representing the reactor spectrum prediction uncertainty [7, 6] from DB [4]. This study demonstrates that a 1% energy scale distortion could result in a 10% spectrum deformation.
This result can be explained by a closer look at the PDF ratio of the reconstructed energies using the best fit RNL and the DB nominal one. To a good accuracy, such a ratio can be computed from a Taylor expansion of Equation (2):
[TABLE]
The first term corresponds to the case of no residual distortion, where and . The next term, , expresses the relative change of shape in the PDF due to . As illustrated by the dashed green curve on Figure 2(c), it gives a maximum positive deviation around 4.5 MeV where , along with a major negative contribution after 6 MeV where . The red dotted curve on Figure 2(c) shows the small contribution of the third term, , to the ratio (9). Although the maximal 1.2% distortion from occurs around 4 MeV, the fourth term, , introduces a 6% positive deviation which is de facto shifted to the 5 MeV region. It dominates by far the PDF ratio as defined by Equation (9) in the shoulder region. It is also worth noting that this term explains as well a large fraction of the deficit in the 2–3 MeV energy region (already corrected from effect [4]). The notable feature of this overall RNL is a amplitude kink around 4 MeV. No calibration point constrains the nonlinearity in this region. The nearest one, from , shows a slight excess around 5 MeV, which is perfectly reproduced by our best fit nonlinearity. As shown by Figure 2(b), the Boron 12 spectrum is mostly unaffected by this additional RNL.
6 Discussion
The fit from previous section is the required RNL to best match the observed antineutrino spectrum from the predicted one. It should be understood as a residual artifact, or bias, after all calibration works have already been performed. Our study shows that a small 1% mismatch in energy scale model in a localized energy range around 4 MeV, where no calibration cross-checks are available, can be responsible of the large 10% distortion in the observed to predicted antineutrino spectra. This effect is thus a small one, within calibration uncertainties, which might have been overlooked, and the consequences in reactor spectra prediction are sizable. Bringing definitive statements about absolute reactor spectra measurements requires extremely careful work on energy scale to ensure its robustness. This indicates that shape systematics in observed antineutrino spectra might have been underestimated.
Such a large distortion amplification process is rooted in two phenomena. First, the energy scale uncertainties are relative. The higher the energy, the higher the absolute uncertainty. A fixed relative energy scale error hence induces a bigger impact at higher energies. A distortion around 4 MeV in energy scale might thus be shifted above 5 MeV in spectra ratio. Second, histograms are representative of a probability density function. Under a change/distortion of the histogrammed variable, they behave as a density function. Consequently an extra “infinitesimal volume conservation factor” arises with the change of shape of the density function. From these two characteristic effects, a localized change of slope in energy scale around 4 MeV of less than 1%/MeV alters significantly the antineutrino counting distribution around 5 MeV, as extensively demonstrated in previous section.
The origin of such an artifact in energy calibration models should be investigated and tested. It could be of statistical nature, such as a bias coming from an average of nonlinearly biased charges. All the current energy reconstruction strategies in DC, DB, RN use the total charge, received by all PMTs, as a proxy of the true deposited energy. This work hypothesis, while fully legitimate when energy and charge are proportional, starts to break down in scenarii accumulating nonlinearities. Especially, if raw charge nonlinearities are not corrected on each channel (a correction known as “flat-fielding” in digital imaging), a complex position/energy nonlinear mapping arises and simple calibration scheme, decoupling energy and position variables, might be ineffective to simultaneously correct these dependences. As soon as the raw charge distortion is not a linear mapping, the average of the distorted charges is different from the distorted average charge, whatever the distribution of (, where stands for the average over charge distribution). In DC and DB, the electronics nonlinearity correction function is a convex function of the reconstructed charge/energy. Therefore for a given distortion , the calibrations are overestimating the true distortions since they use distorted charge averages to estimate this distortion in E scale: . The fitted distortion from calibration data is thus overestimating, by construction, the true raw charge distortion. The amount of overestimated distortion depends on the peculiar charge distribution involved in the average estimate, therefore on the energy and position inside the detector. A part of this effect is canceled through the current calibration procedures, especially below 3 MeV and by the fact that in essence reconstructed energies are also to some extent average of charges. However, because of the lack of calibration points around 4 MeV, a residual nonlinearity might still be present as we investigated in this work.
This residual nonlinearity can be experimentally tested with dedicated calibrations around 4 MeV and further works on raw charge corrections. With the high statistics of the DB experiment it is also possible to build up local antineutrino spectra inside the detectors. If charge reconstructions are biased, the comparison of these local spectra should exhibit enlarged variances, especially in the 4-5 MeV range. The DB and DC fits to the energy resolution already support such a point, with an energy scale systematics evaluated in DB around 1.5% and 1.8% in DC, nearly two times bigger than the quoted precision of the energy scale models. A systematic of such an amplitude is by far sufficient to make observed and predicted antineutrino spectra consistent with each other.
As a conclusion, current observed antineutrino spectra of DC, DB, RN and B3 are not compatible with each other. This study suggests that reactor spectral distortions might have their origin in detector calibration artifacts. Taking into account this systematic effect, reactor spectra predictions become fully compatible with all the observations. Our work is, to our knowledge, the single one able to reconcile current generation of reactor antineutrino experiments with older ones such as Bugey 3, to recover consistency with BILL experiments and their converted spectra. Because an energy scale nonlinearity induces a migration of events across bins, it induces mostly no impact on the reactor rate anomaly. Thus, if this interpretation is correct, the current observed distortions in reactor antineutrino spectra might have no relation with the 6% reactor rate anomaly. Regarding currently observed antineutrino spectra, as opposed to [10], spectra prediction uncertainties would remain unchanged, but observed reactor spectra uncertainties of Double Chooz [3], Daya Bay [4] and RENO [5] should be enlarged. As demonstrated in this article, the 10% spectral distortion around 5 MeV is well within the 1 calibration uncertainty of the energy scale. The uncertainties of Bugey 3 [9] being already consistent with our fit (the slope on spectra ratio might be induced by an energy scale bias within the quoted uncertainties), no extra calibration error is justified for this experiment. Decisive tests have to be planned. Until then a diligent work on studying the energy response of detectors in the 3–5 MeV region is clearly indicated.
The reference list from the paper itself. Each links out to its DOI / PubMed record.
- 1[1] F. Reines and C. L. Cowan, Jr. Phys. Rev. 92:830 (1953)
- 2[2] F. Reines and C. L. Cowan, Jr. 1959, Phys. Rev. 113:273 (1959)
- 3[3] Y. Abe et al. , Double Chooz collaboration, JHEP 1410 (2014) 086.
- 4[4] F. P. An et al. , Daya Bay collaboration, Phys.Rev.Lett. 115 (2015) no.11, 111802
- 5[5] J. H. Choi et al. , RENO collaboration, ar Xiv:1610.04326 [hep-ex], 2016.
- 6[6] T. A. Mueller et al. , Phys. Rev. C 83, 054615 (2011).
- 7[7] P. Huber, Phys. Rev. C 84, 024617 (2011).
- 8[8] G. Mention et al. , Phys. Rev. D 83 (2011) 073006.