Right-side-stretched multifractal spectra indicate small-worldness in networks
Pawe{\l} O\'swi\c{e}cimka, Lorenzo Livi, Stanis{\l}aw Dro\.zd\.z

TL;DR
This paper links the right-sided asymmetry of multifractal spectra derived from network-generated time series to the small-world properties of networks, providing a new method to identify small-worldness in complex systems.
Contribution
It introduces a novel approach using multifractal analysis of time series to detect small-world features in various network models and real-world networks.
Findings
Right-sided asymmetry correlates with small-world properties.
Low edge density and high clustering are associated with asymmetry.
Method successfully distinguishes small-world networks from others.
Abstract
Complex network formalism allows to explain the behavior of systems composed by interacting units. Several prototypical network models have been proposed thus far. The small-world model has been introduced to mimic two important features observed in real-world systems: i) local clustering and ii) the possibility to move across a network by means of long-range links that significantly reduce the characteristic path length. A natural question would be whether there exist several "types" of small-world architectures, giving rise to a continuum of models with properties (partially) shared with other models belonging to different network families. Here, we take advantage of the interplay between network theory and time series analysis and propose to investigate small-world signatures in complex networks by analyzing multifractal characteristics of time series generated from such networks. In…
Click any figure to enlarge with its caption.
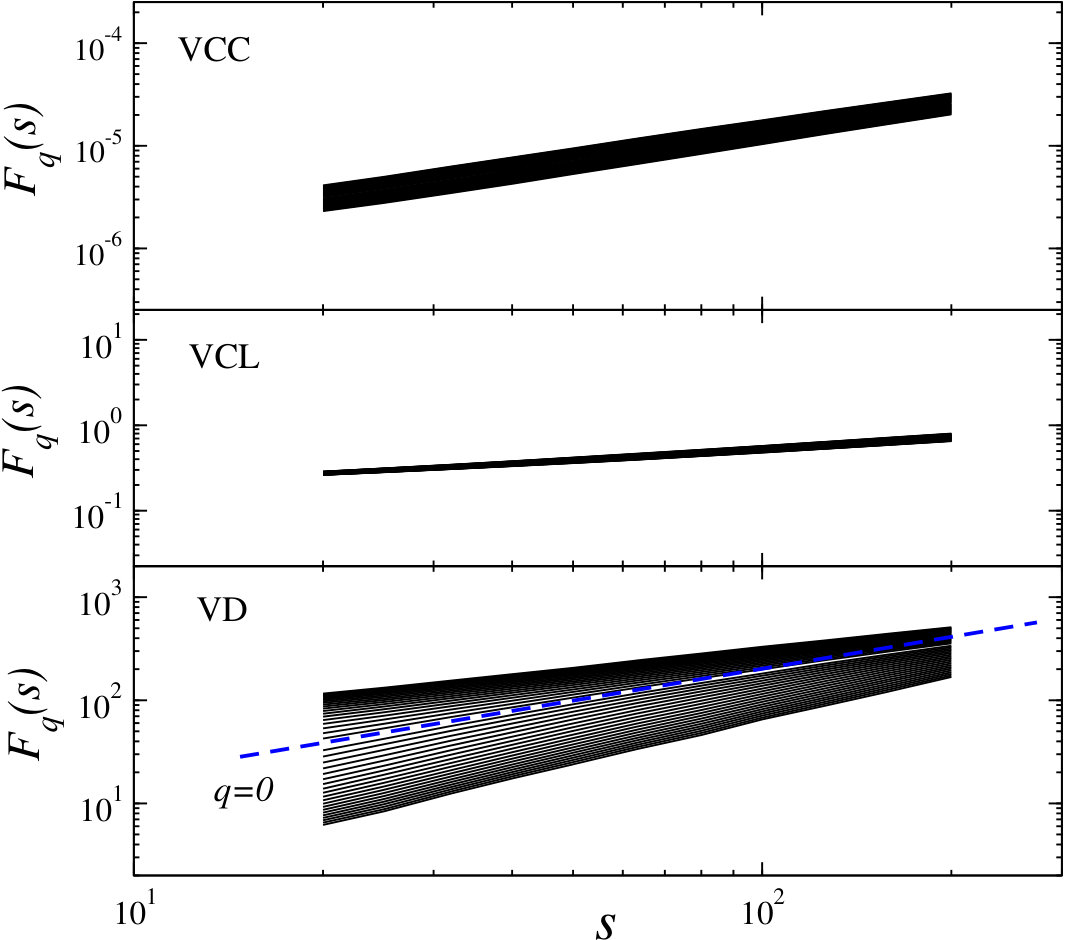 Figure 1
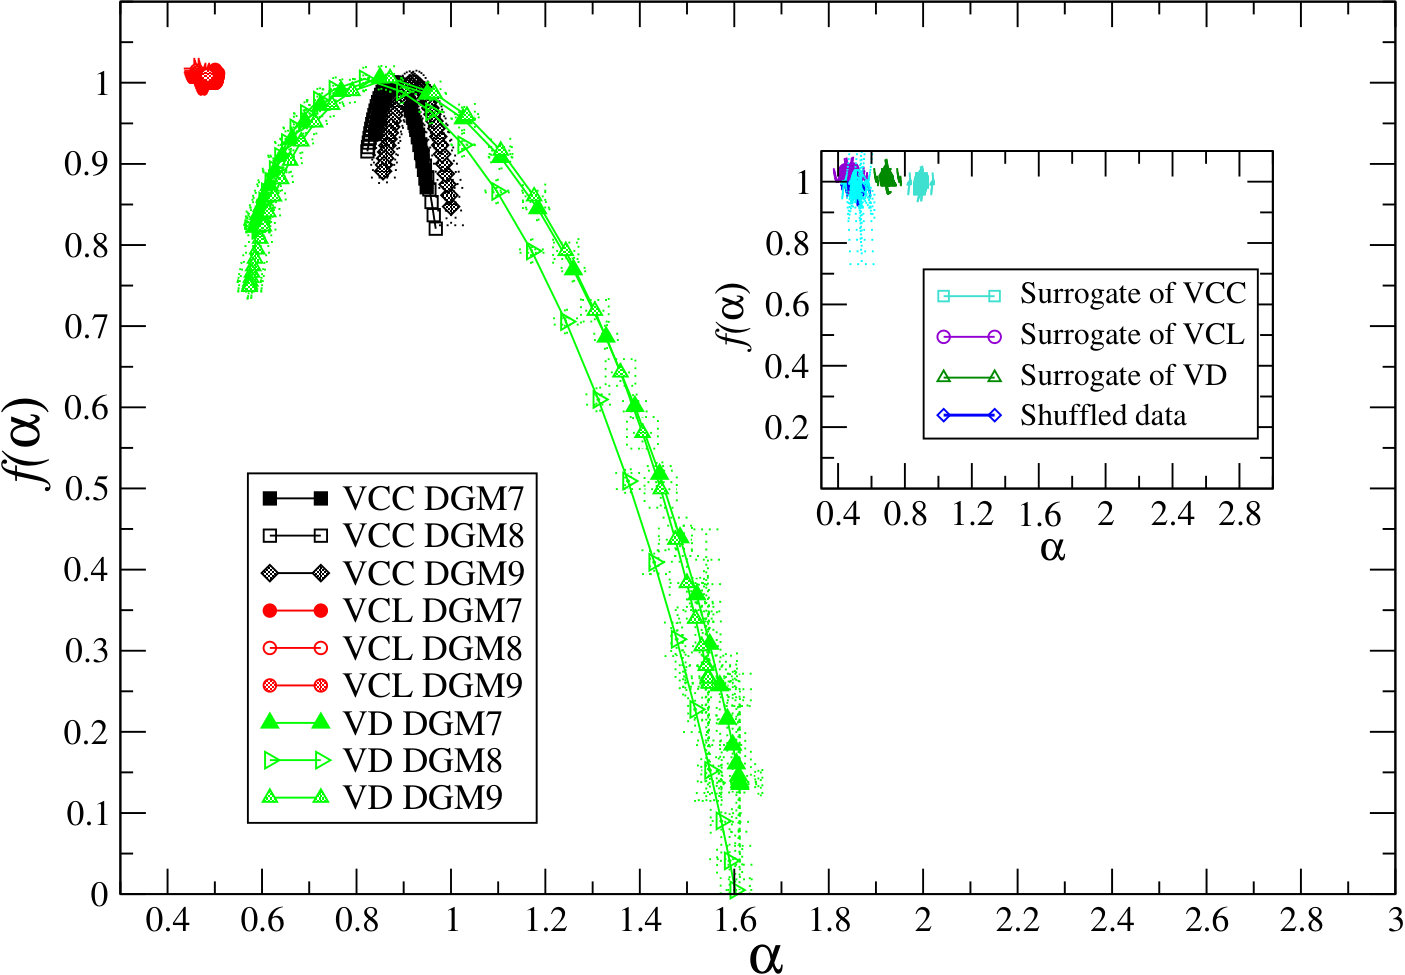 Figure 2
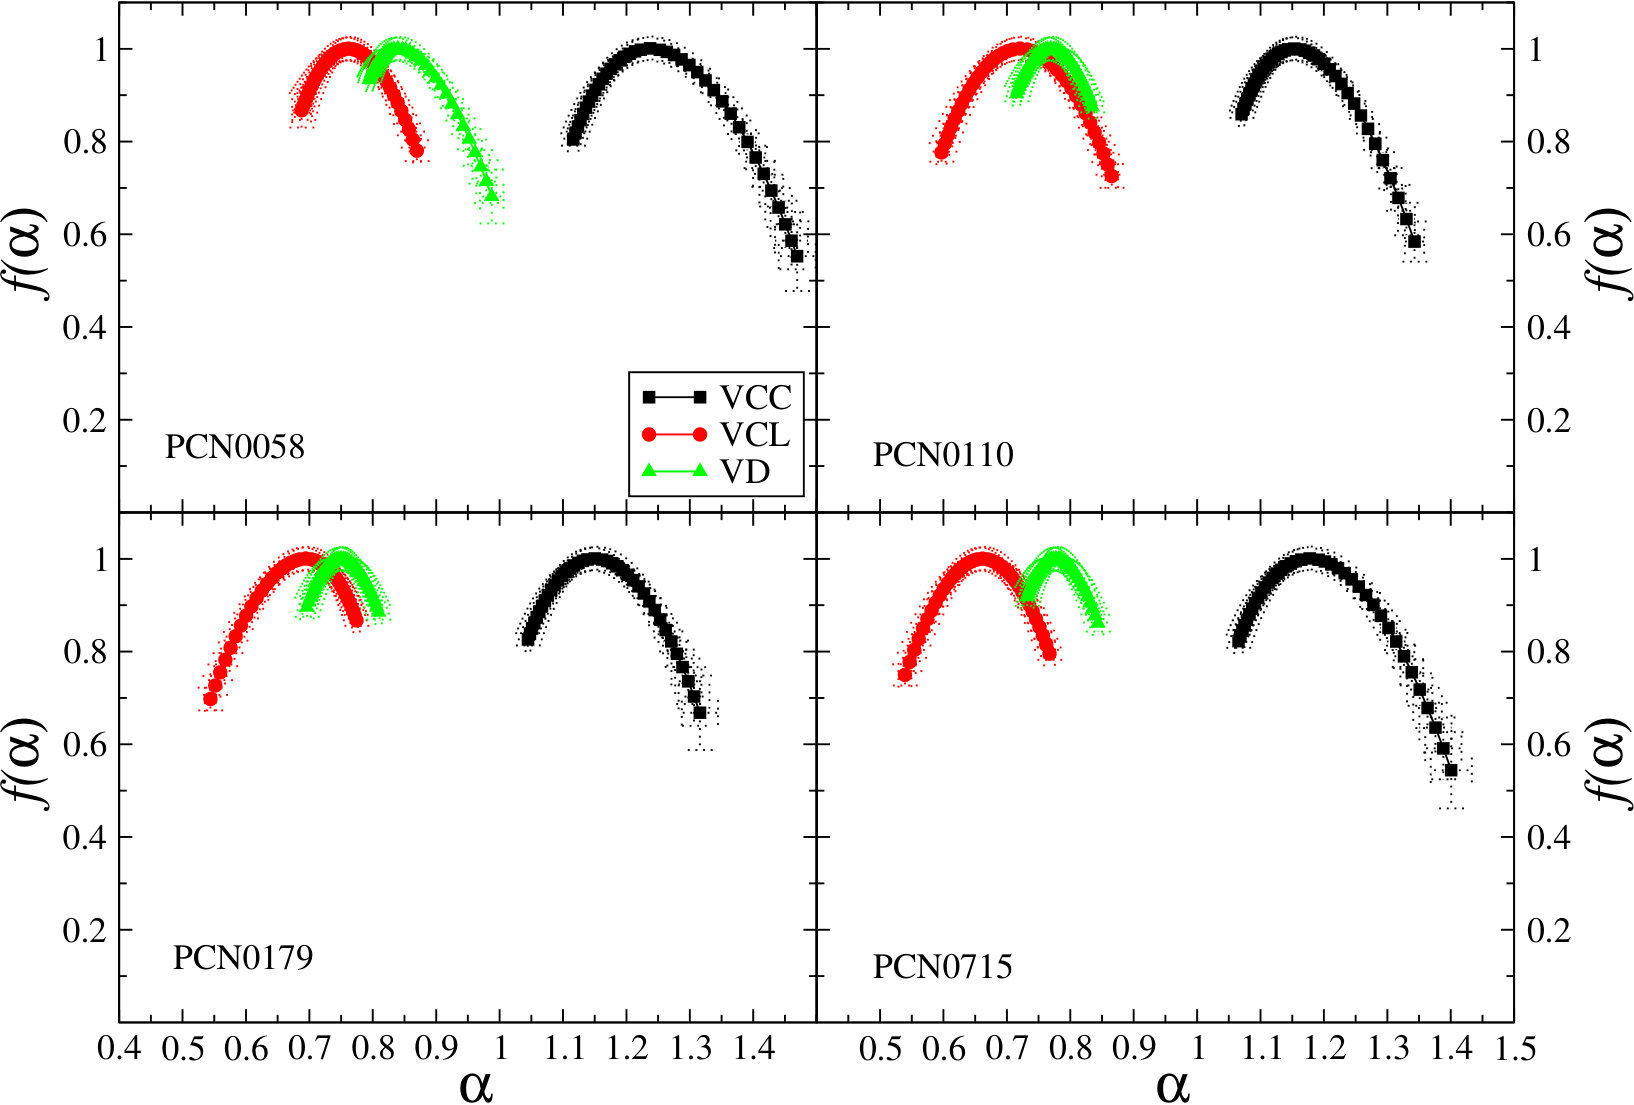 Figure 3
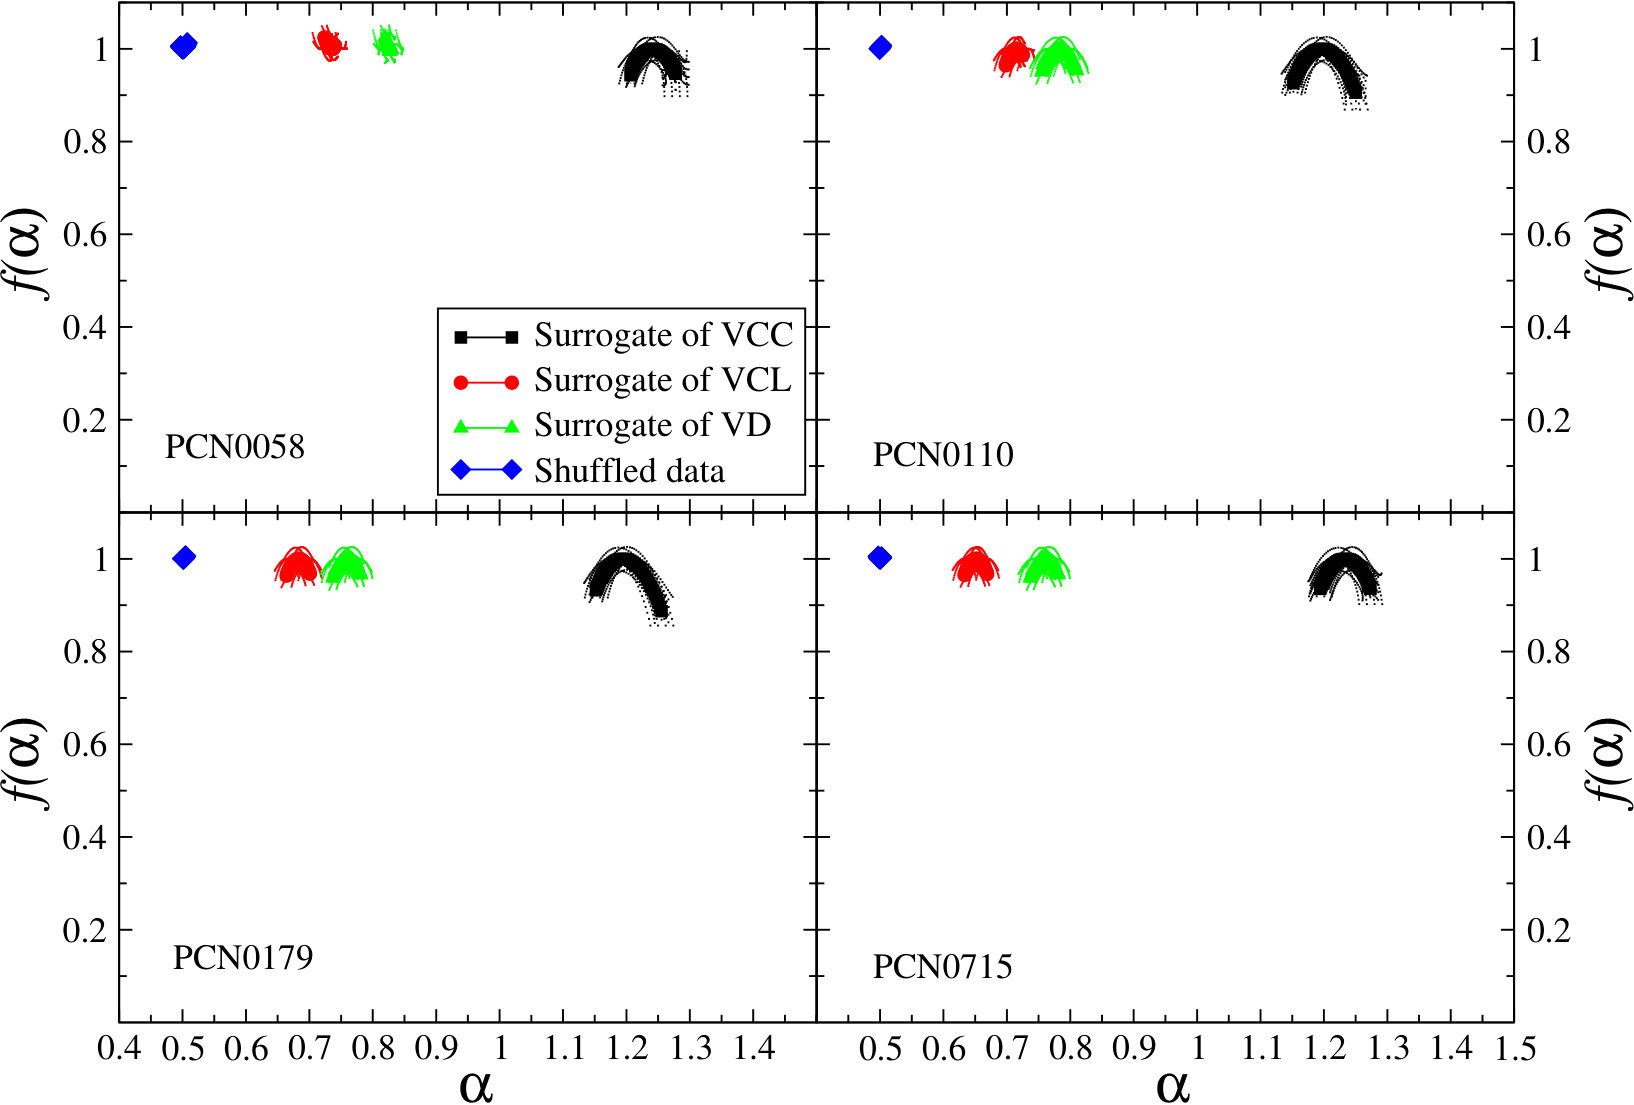 Figure 4
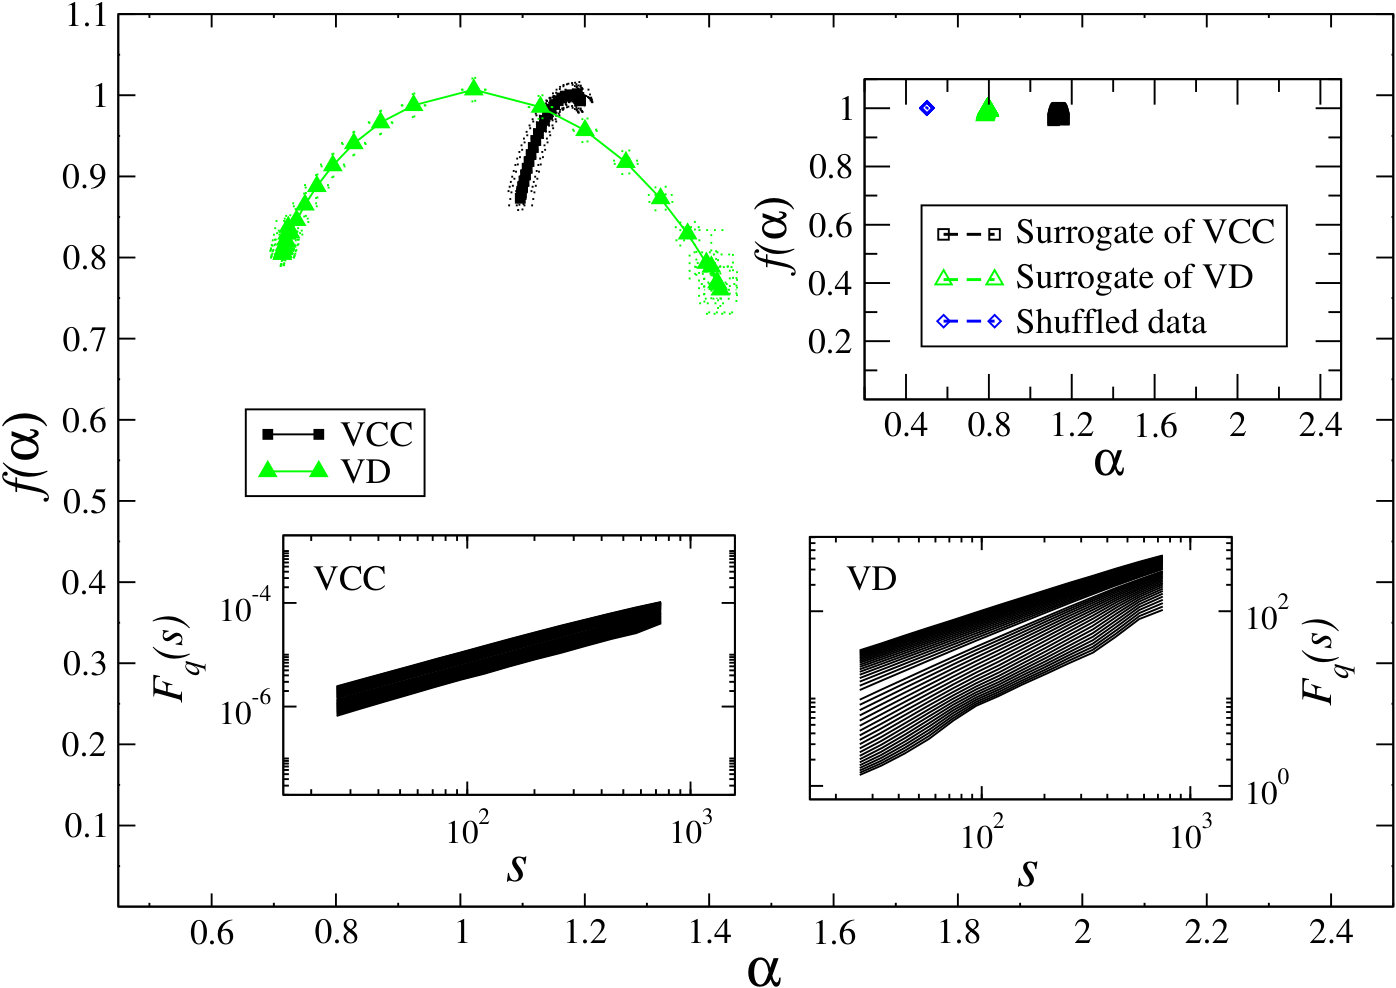 Figure 5
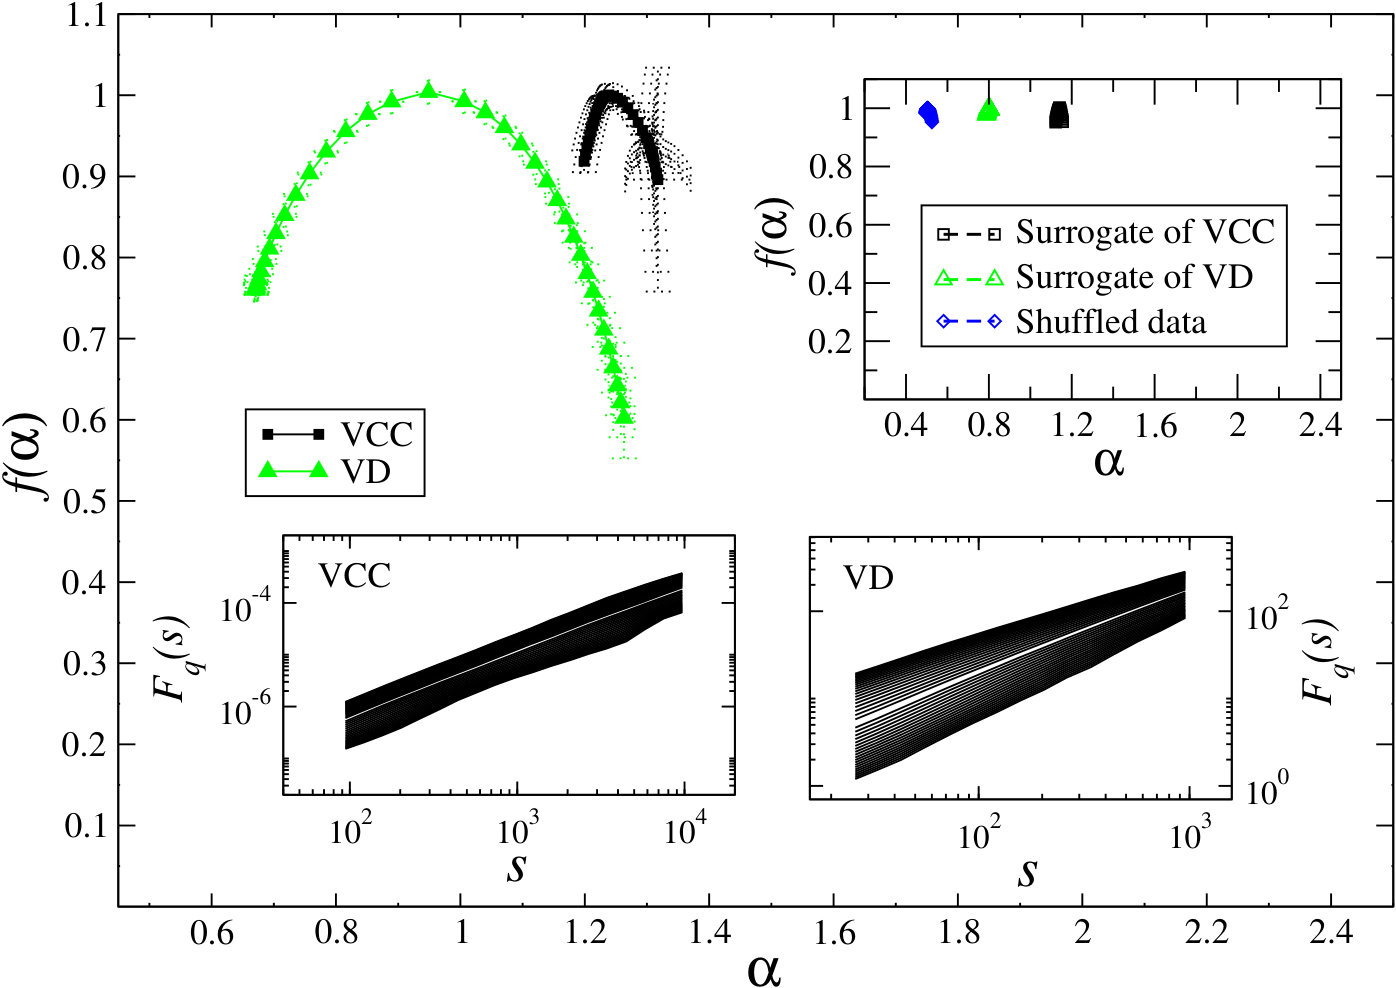 Figure 6
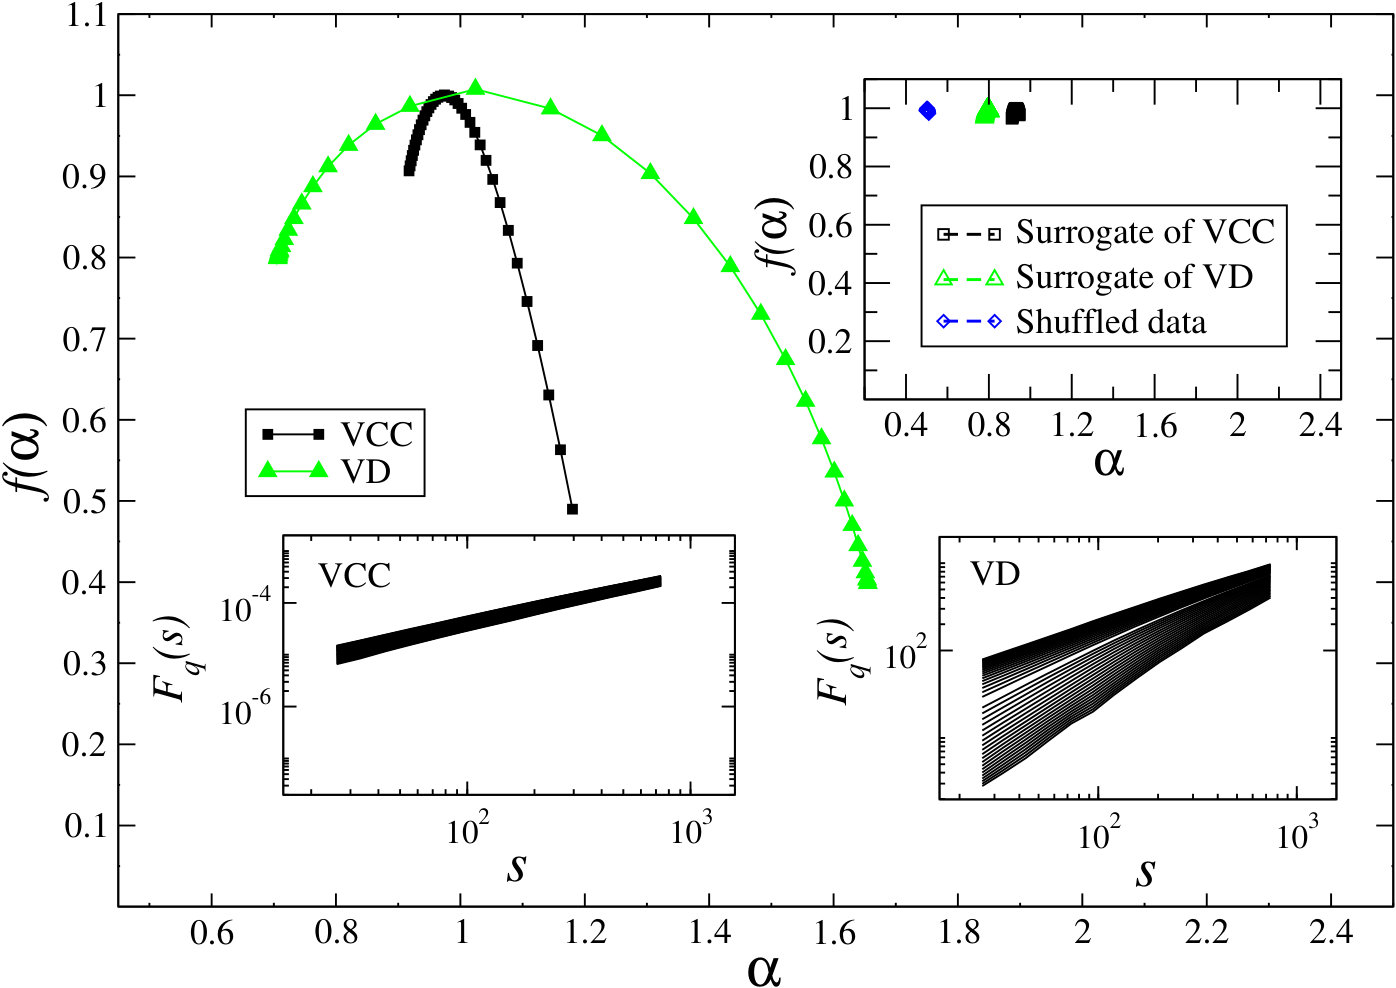 Figure 7
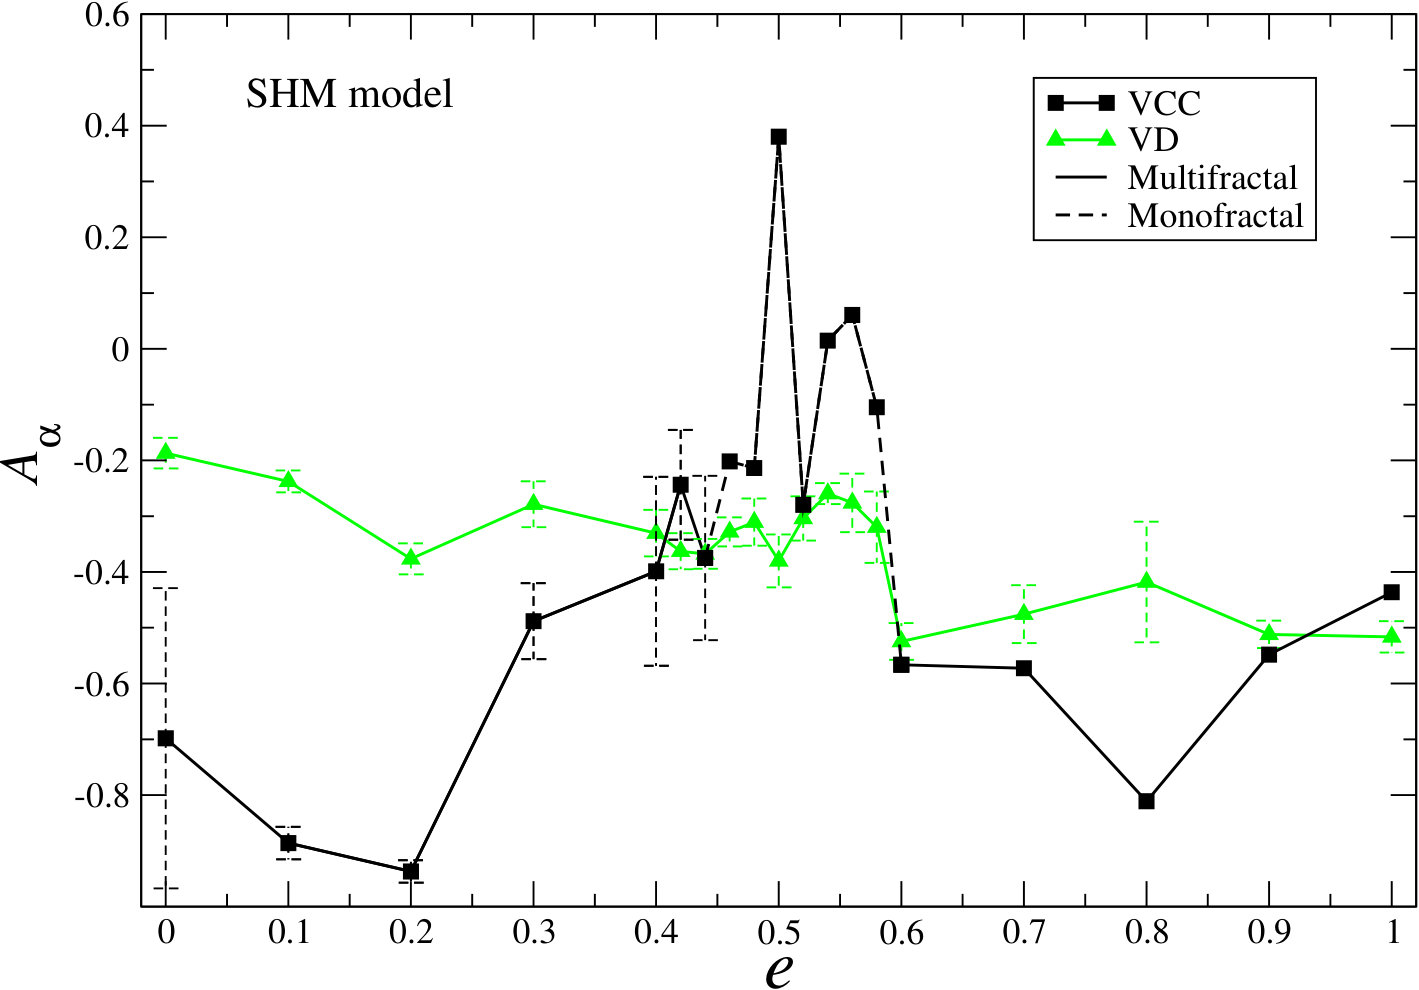 Figure 8
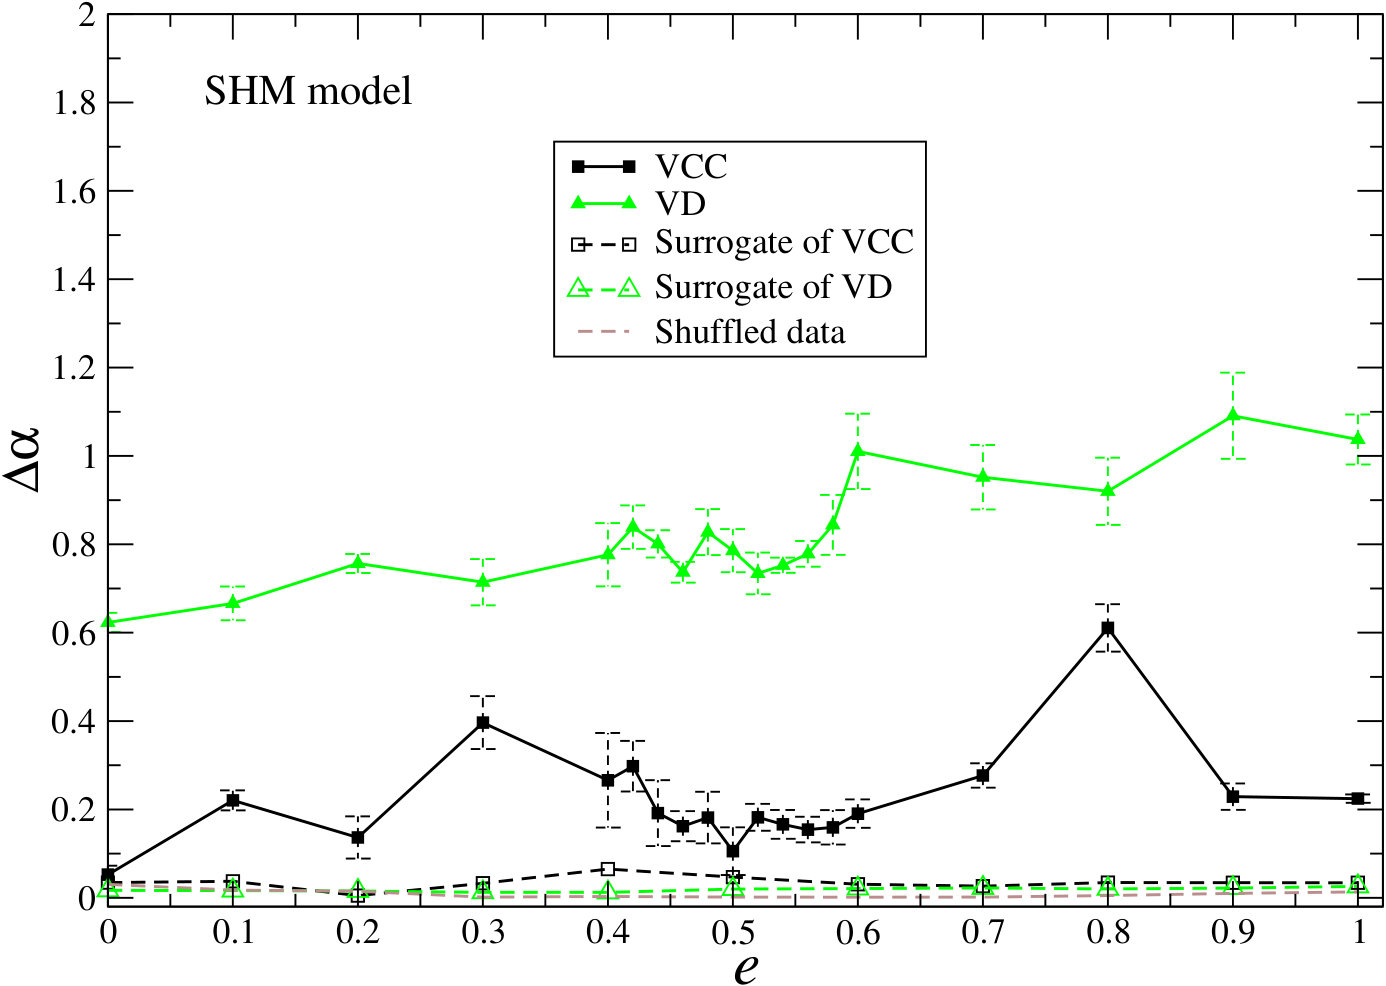 Figure 9
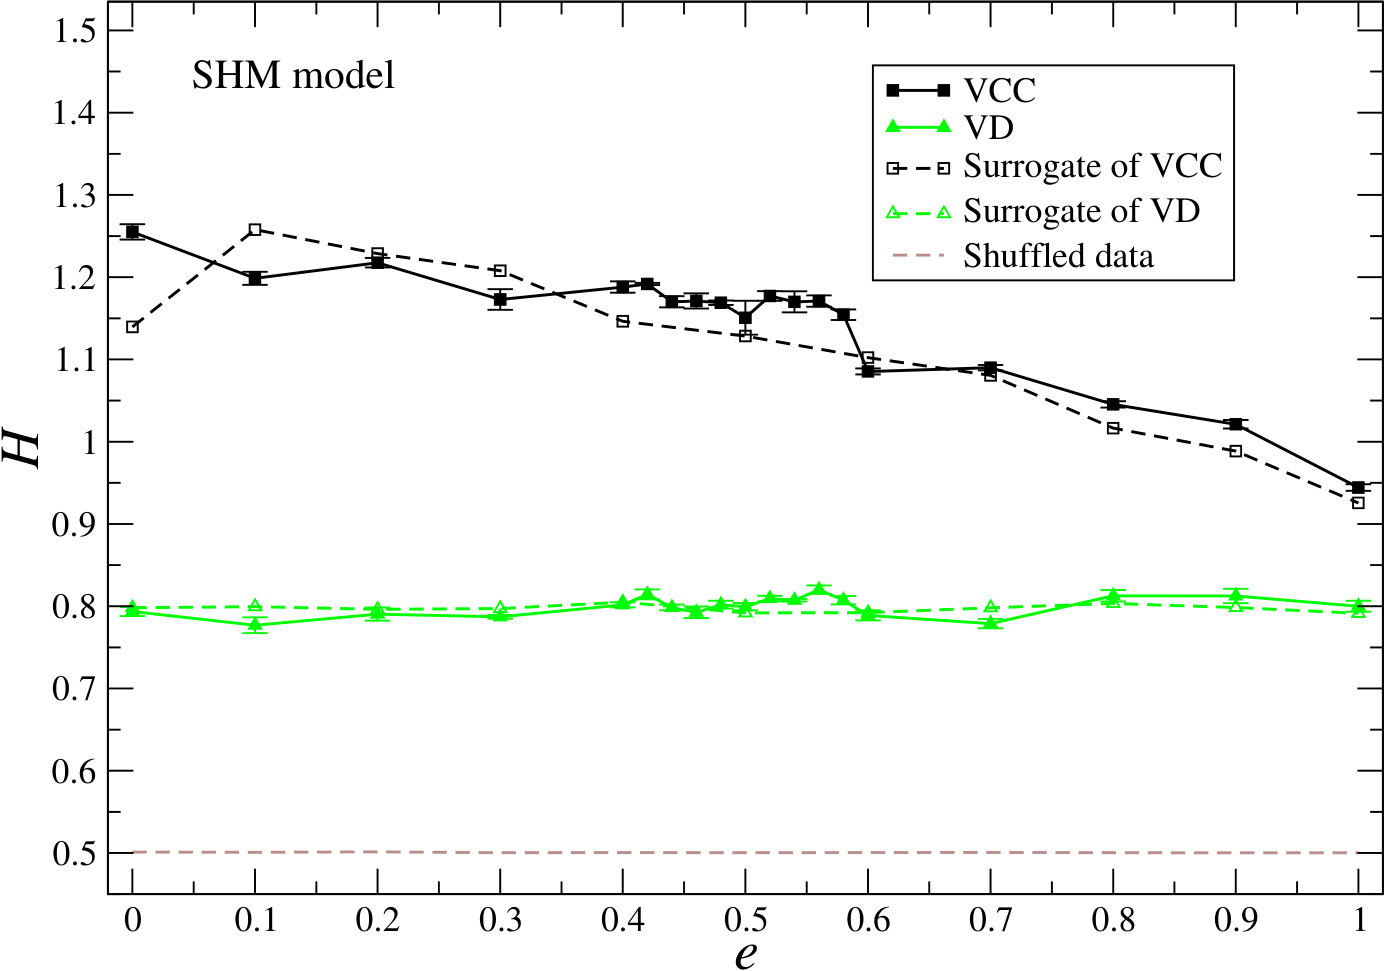 Figure 10
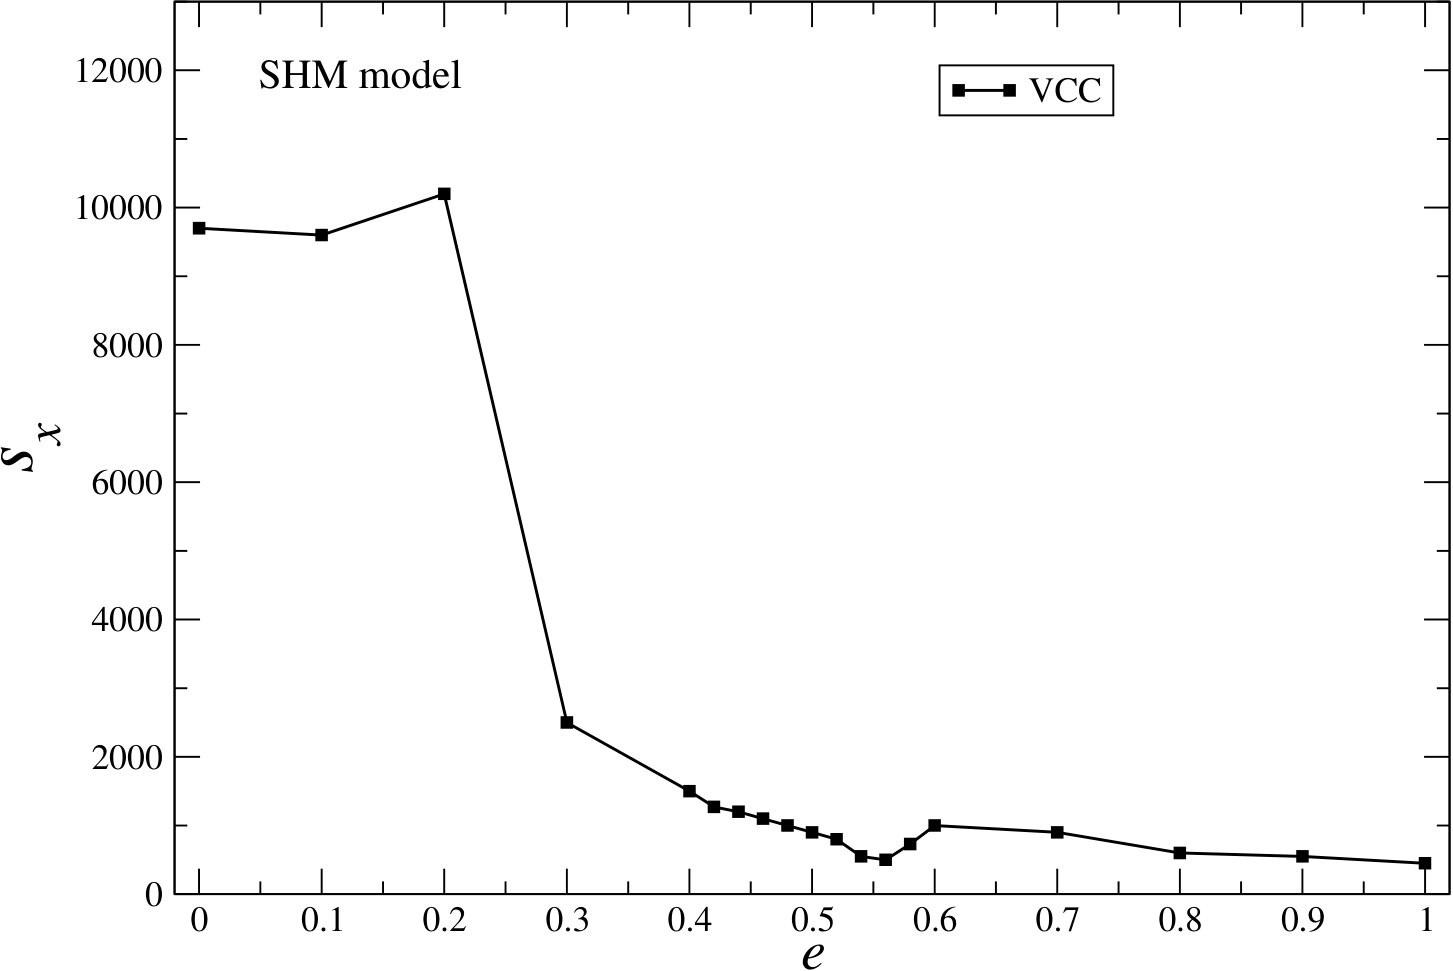 Figure 11
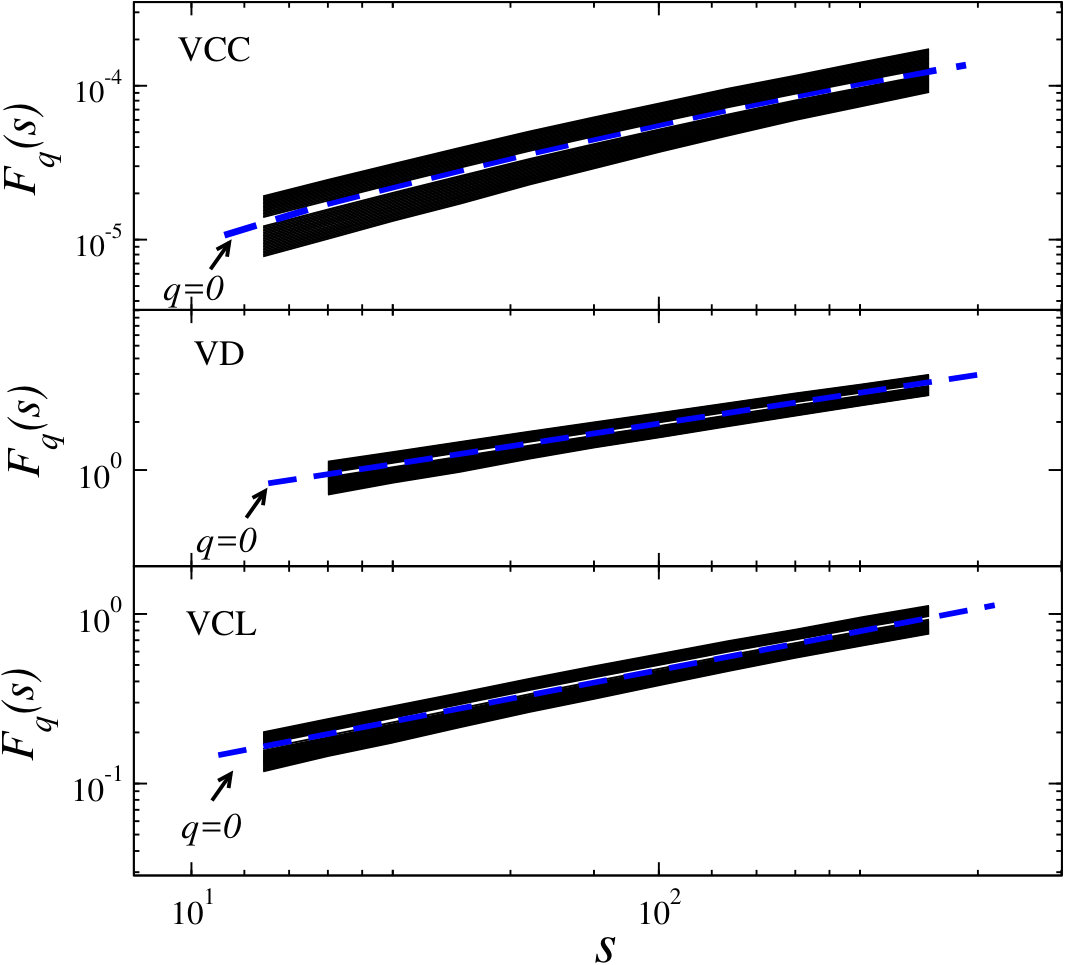 Figure 12
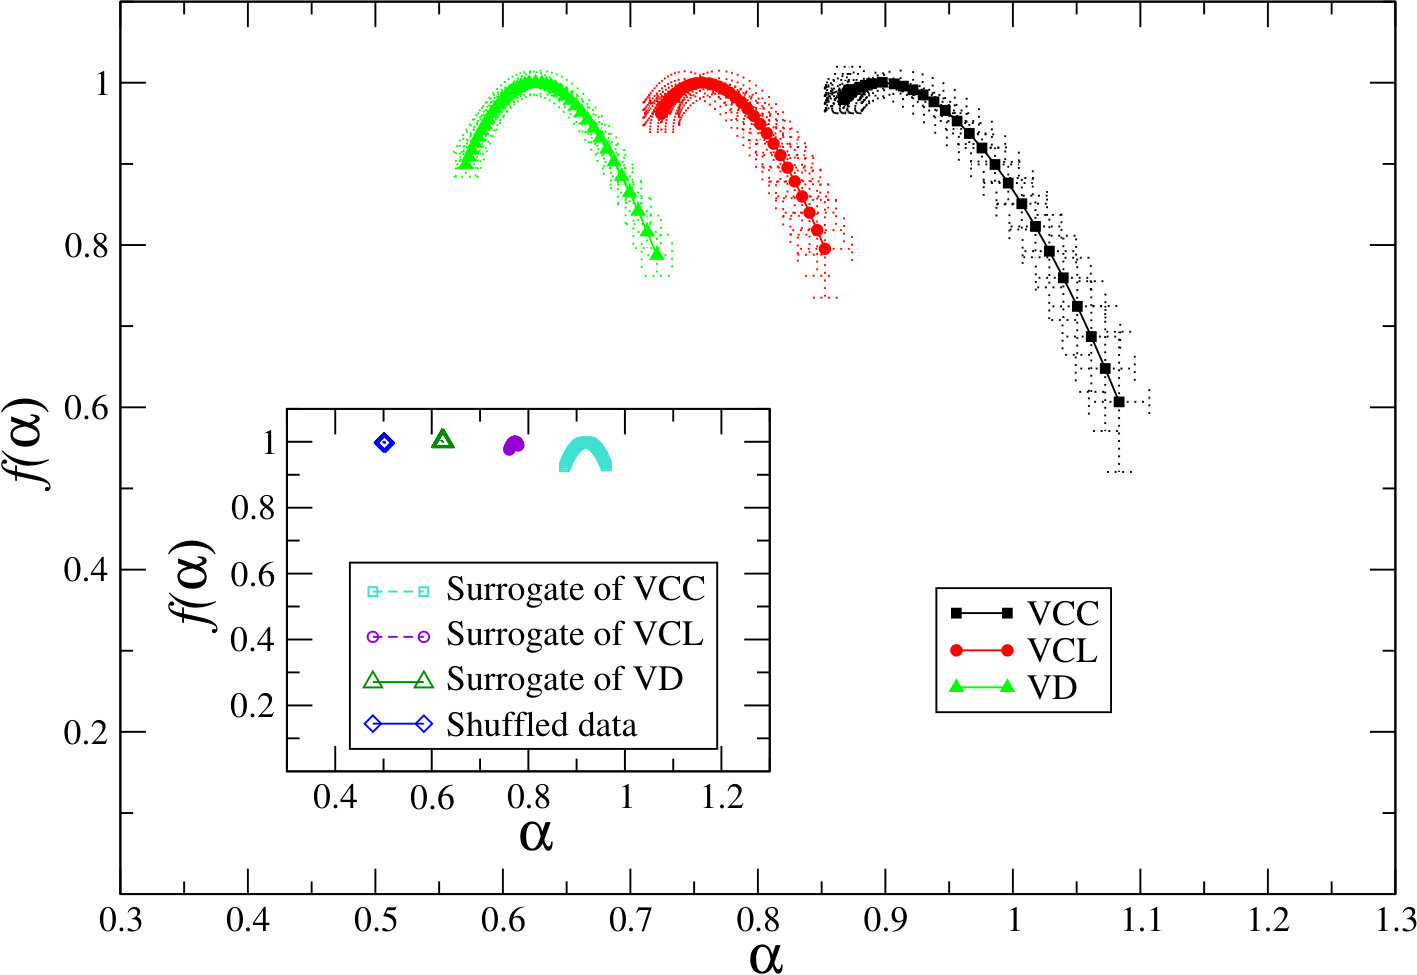 Figure 13
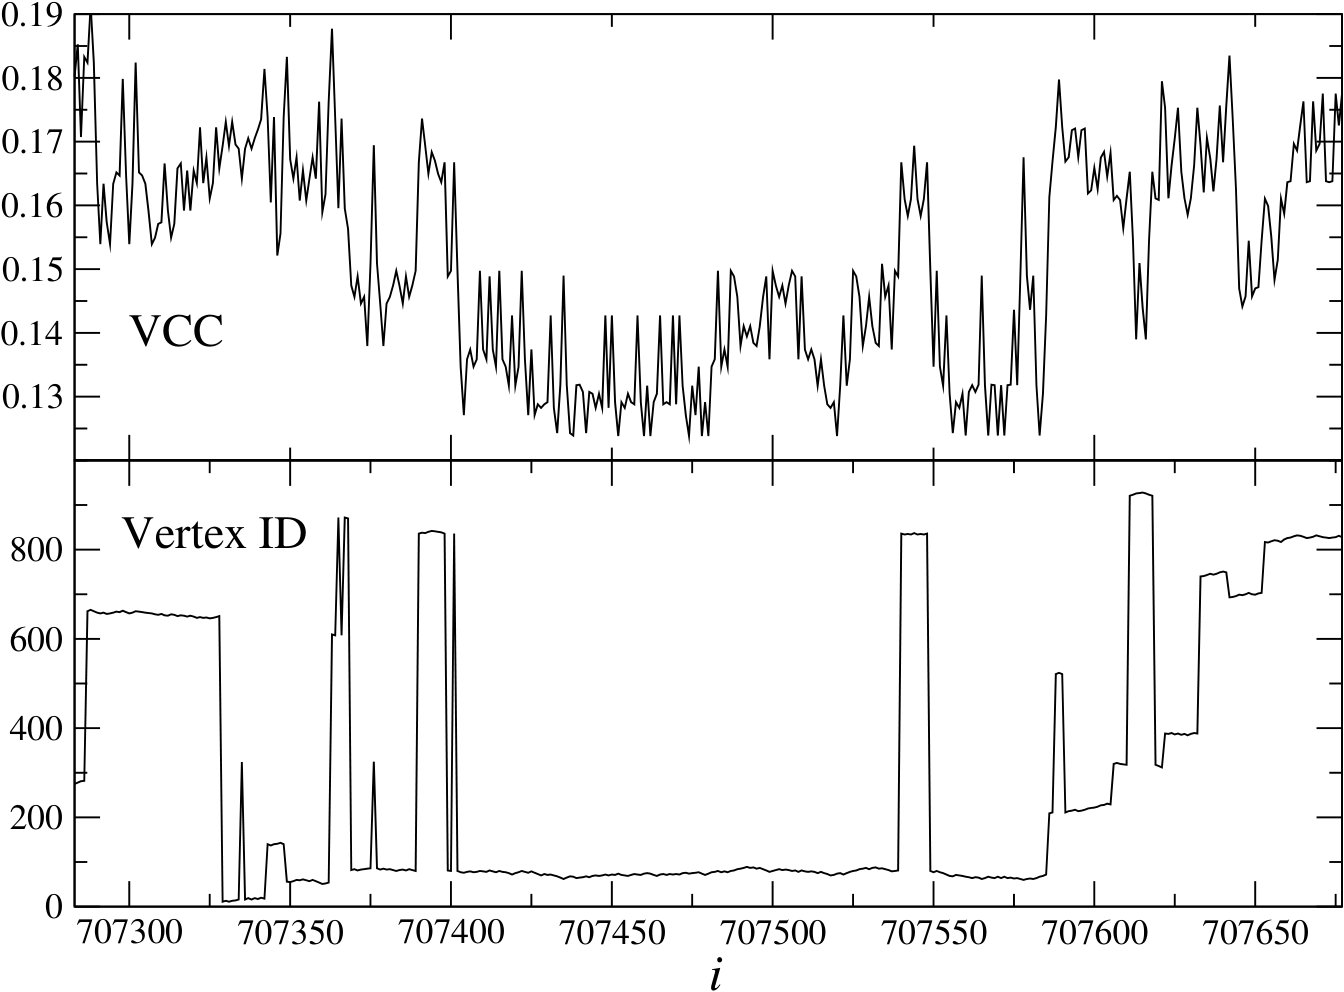 Figure 14
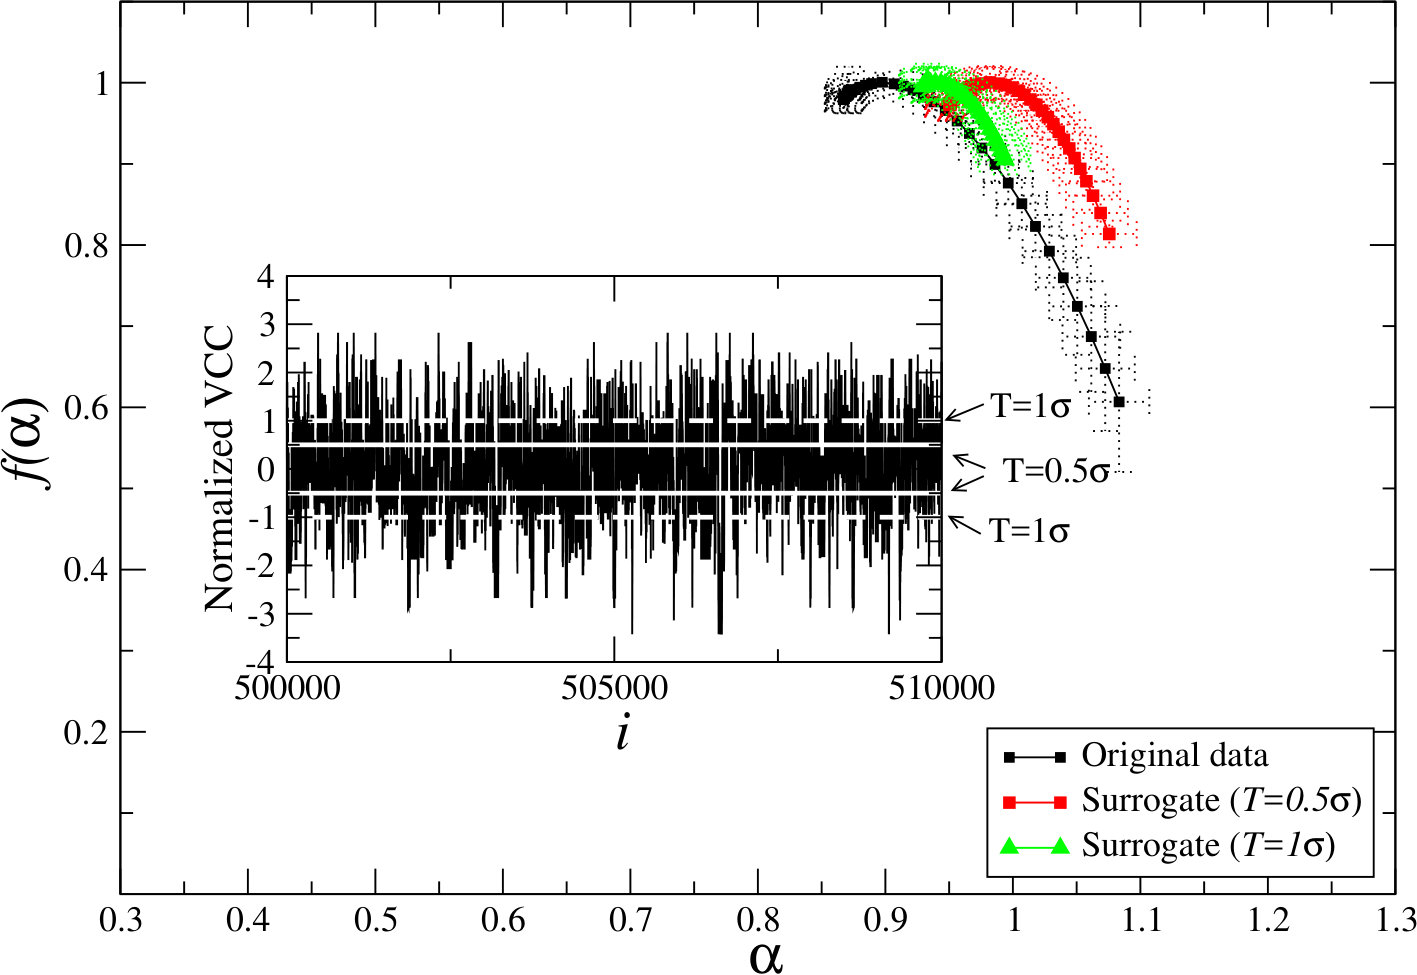 Figure 15
 Figure 16
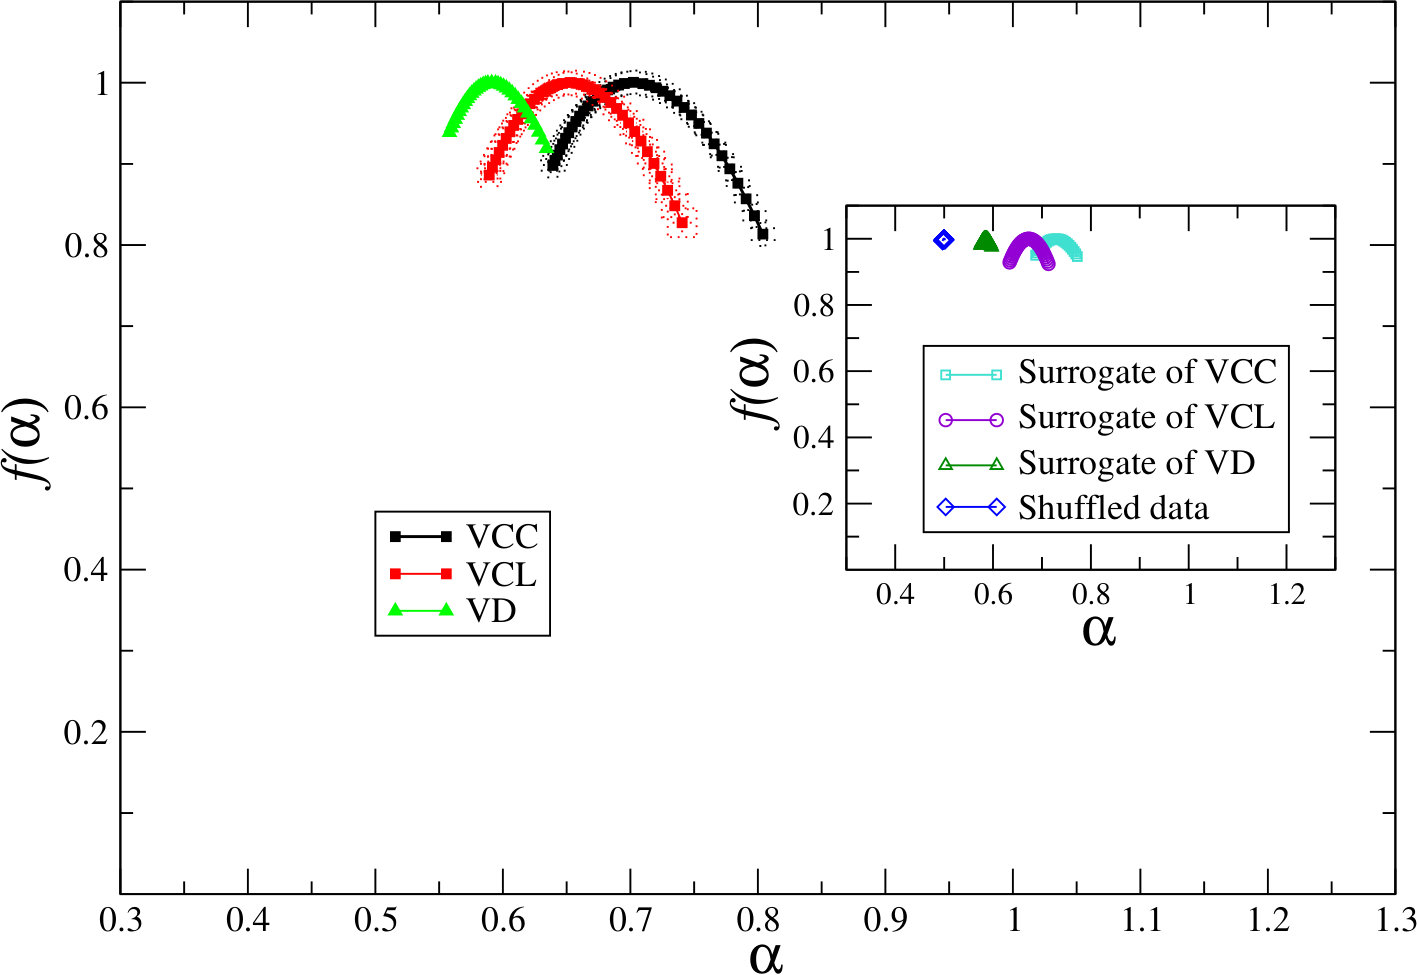 Figure 17
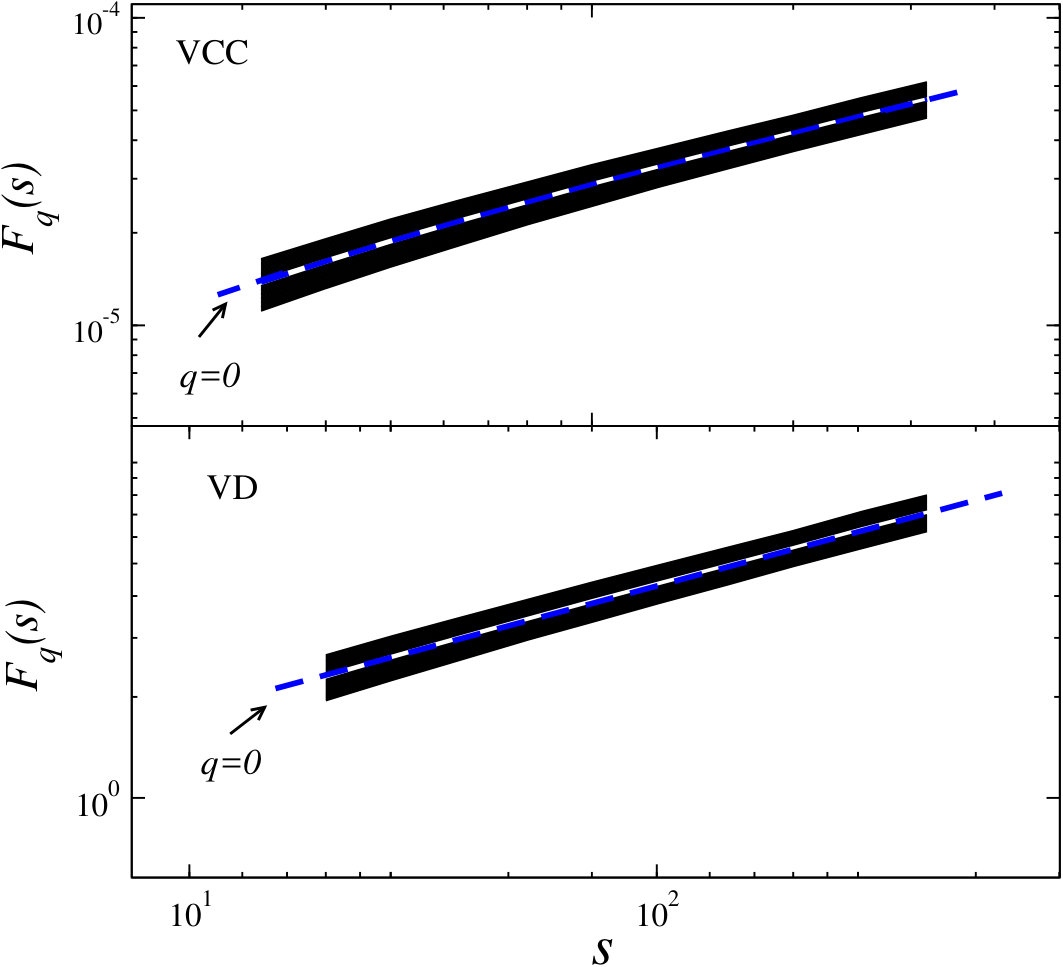 Figure 18
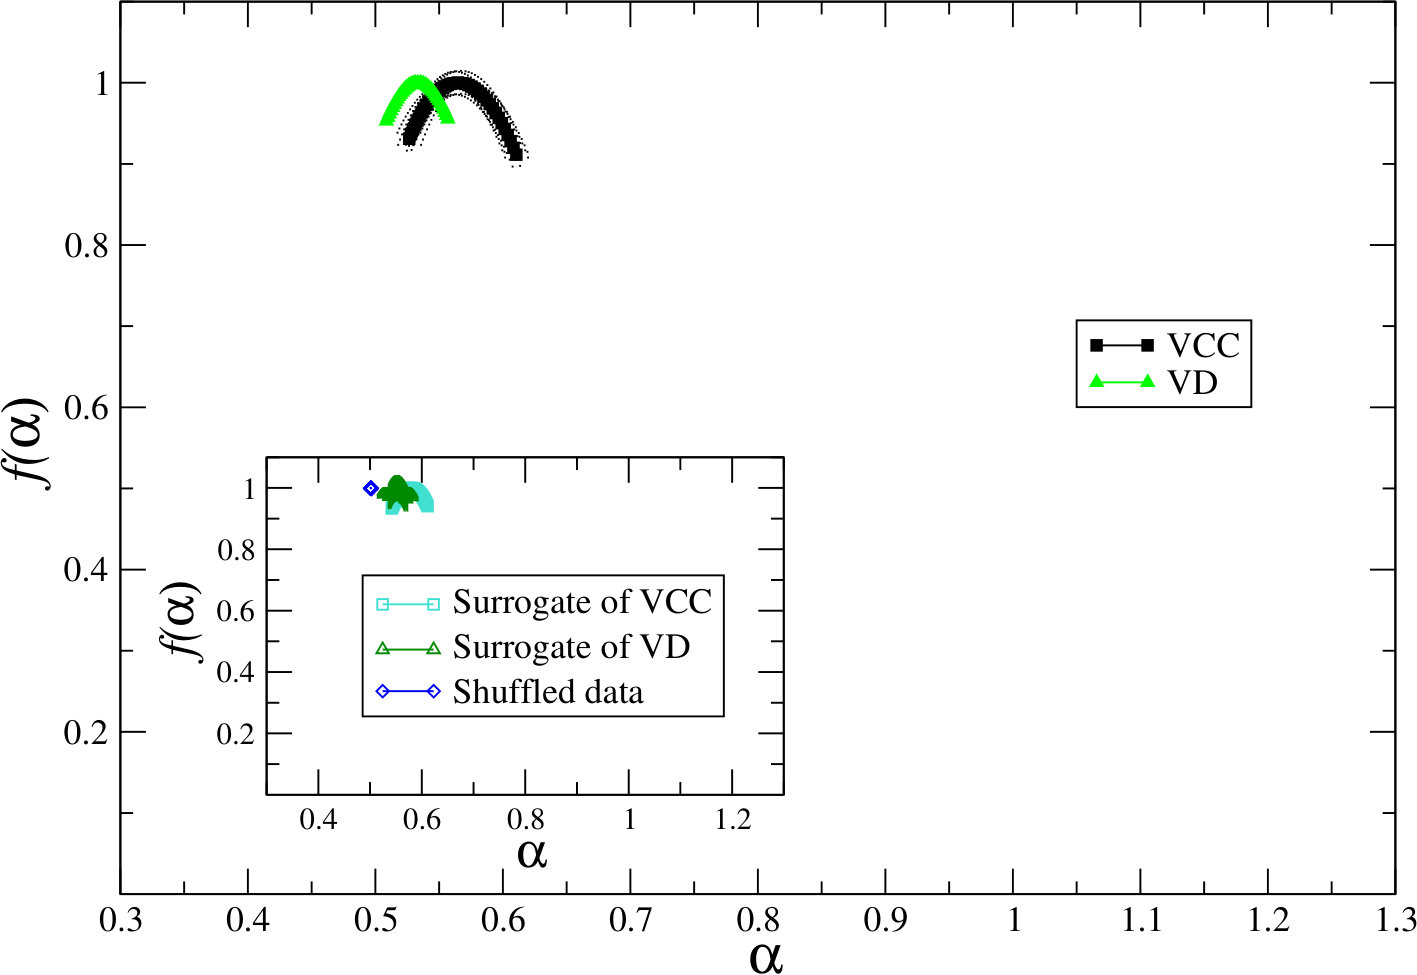 Figure 19
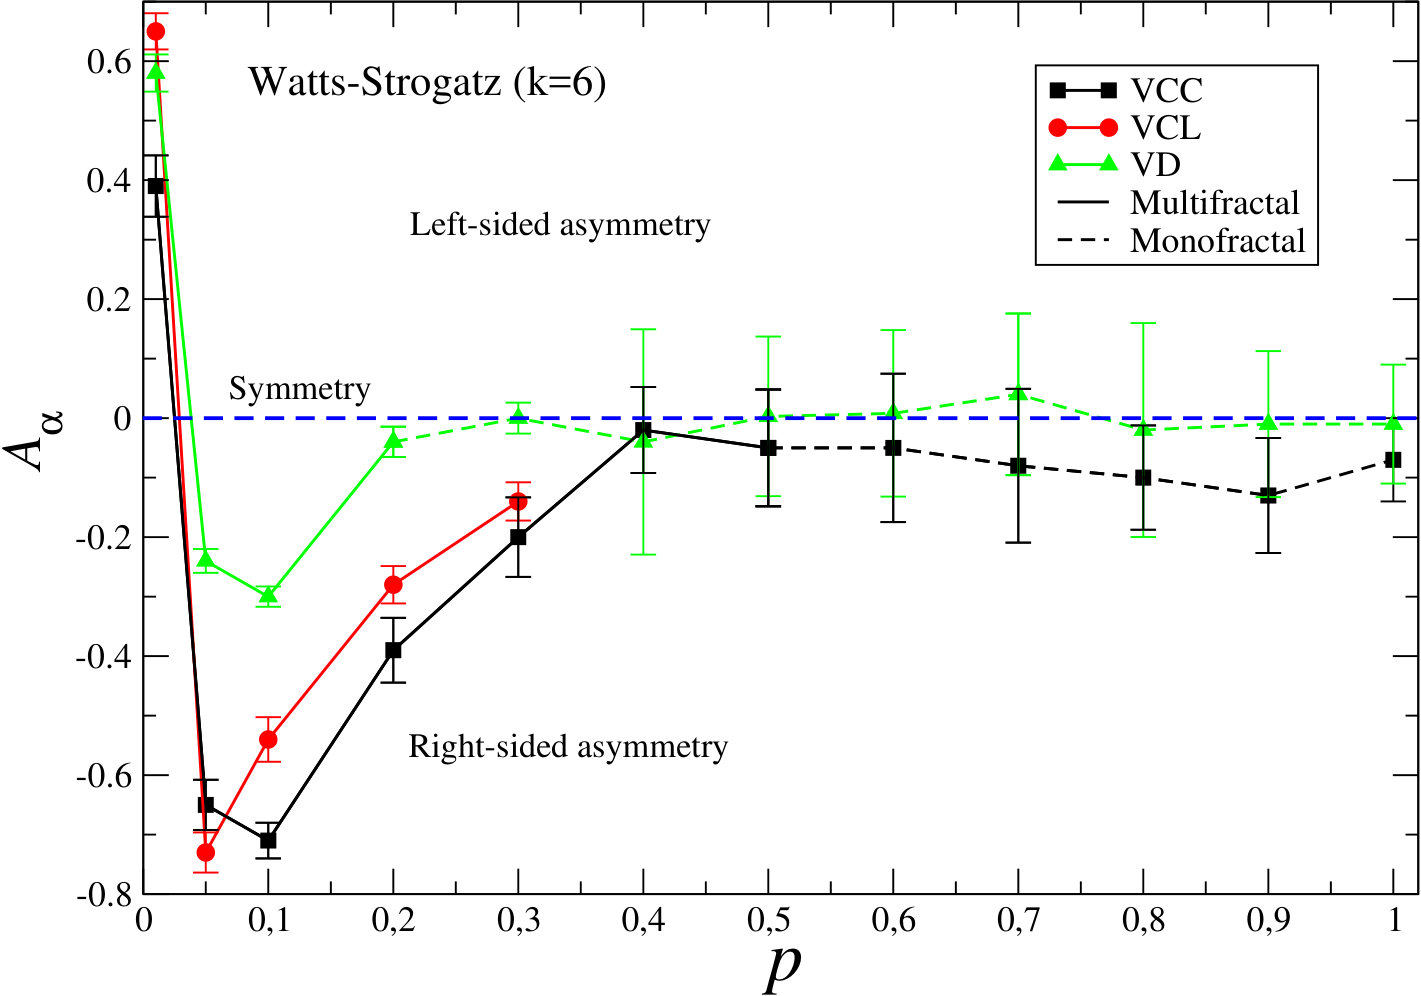 Figure 20
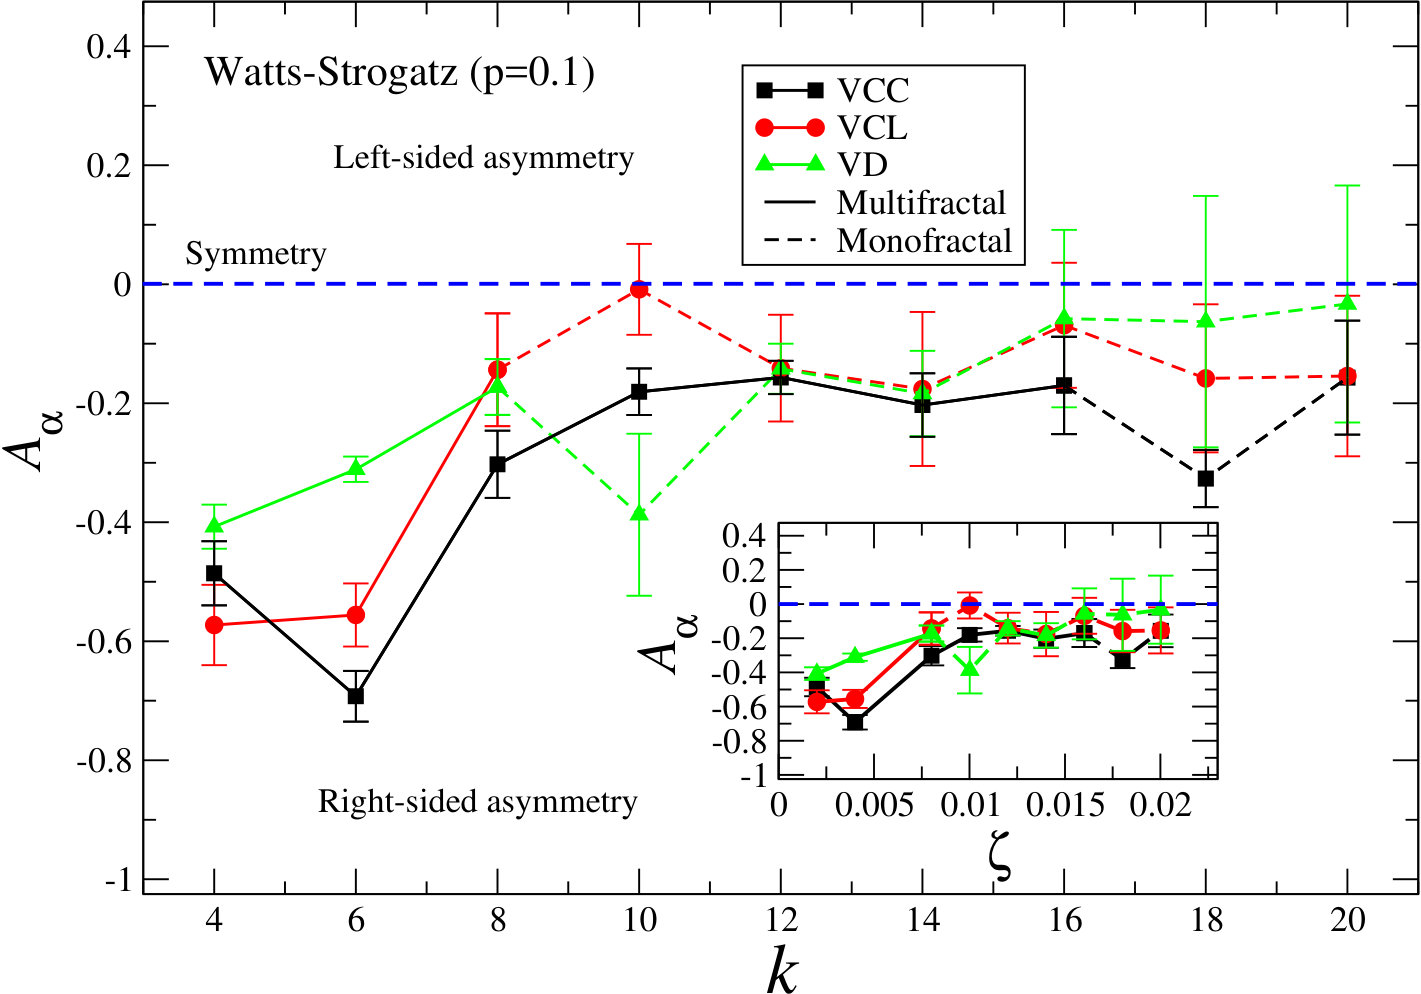 Figure 21
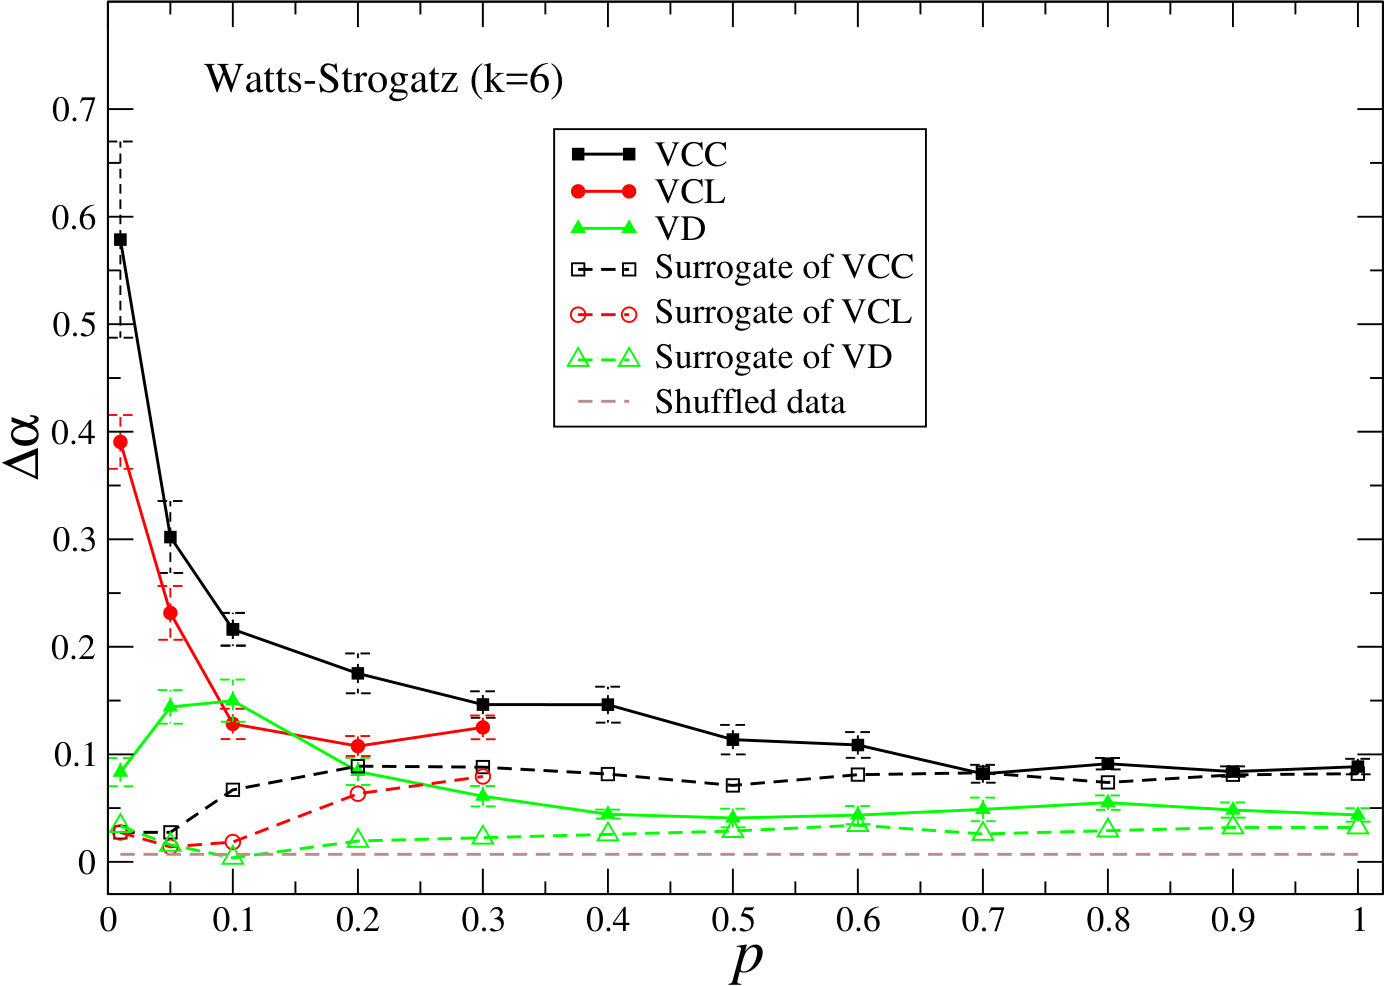 Figure 22
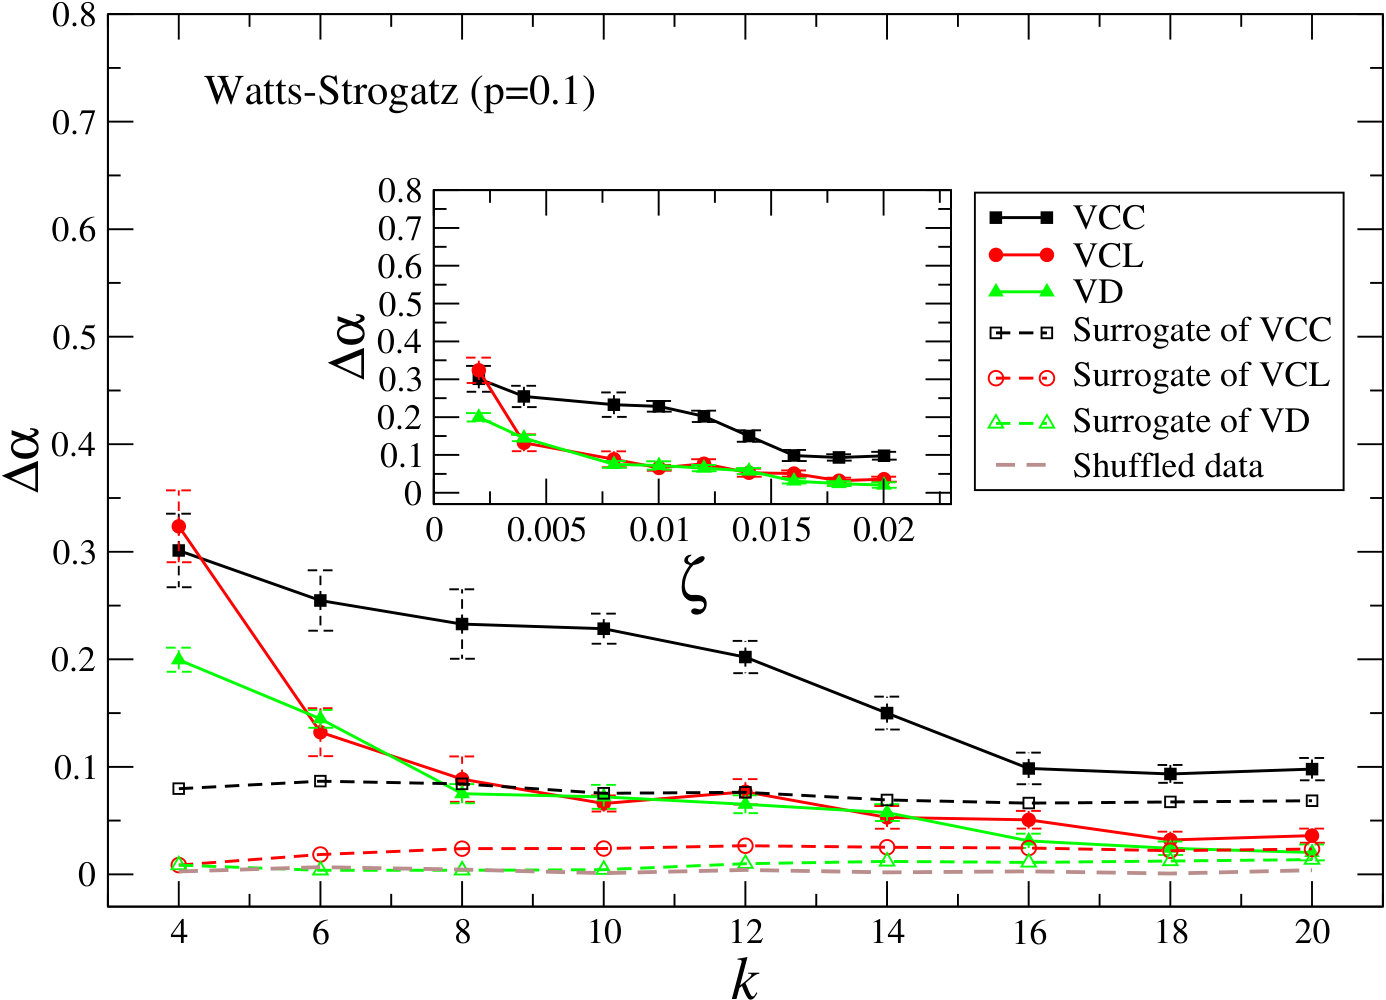 Figure 23
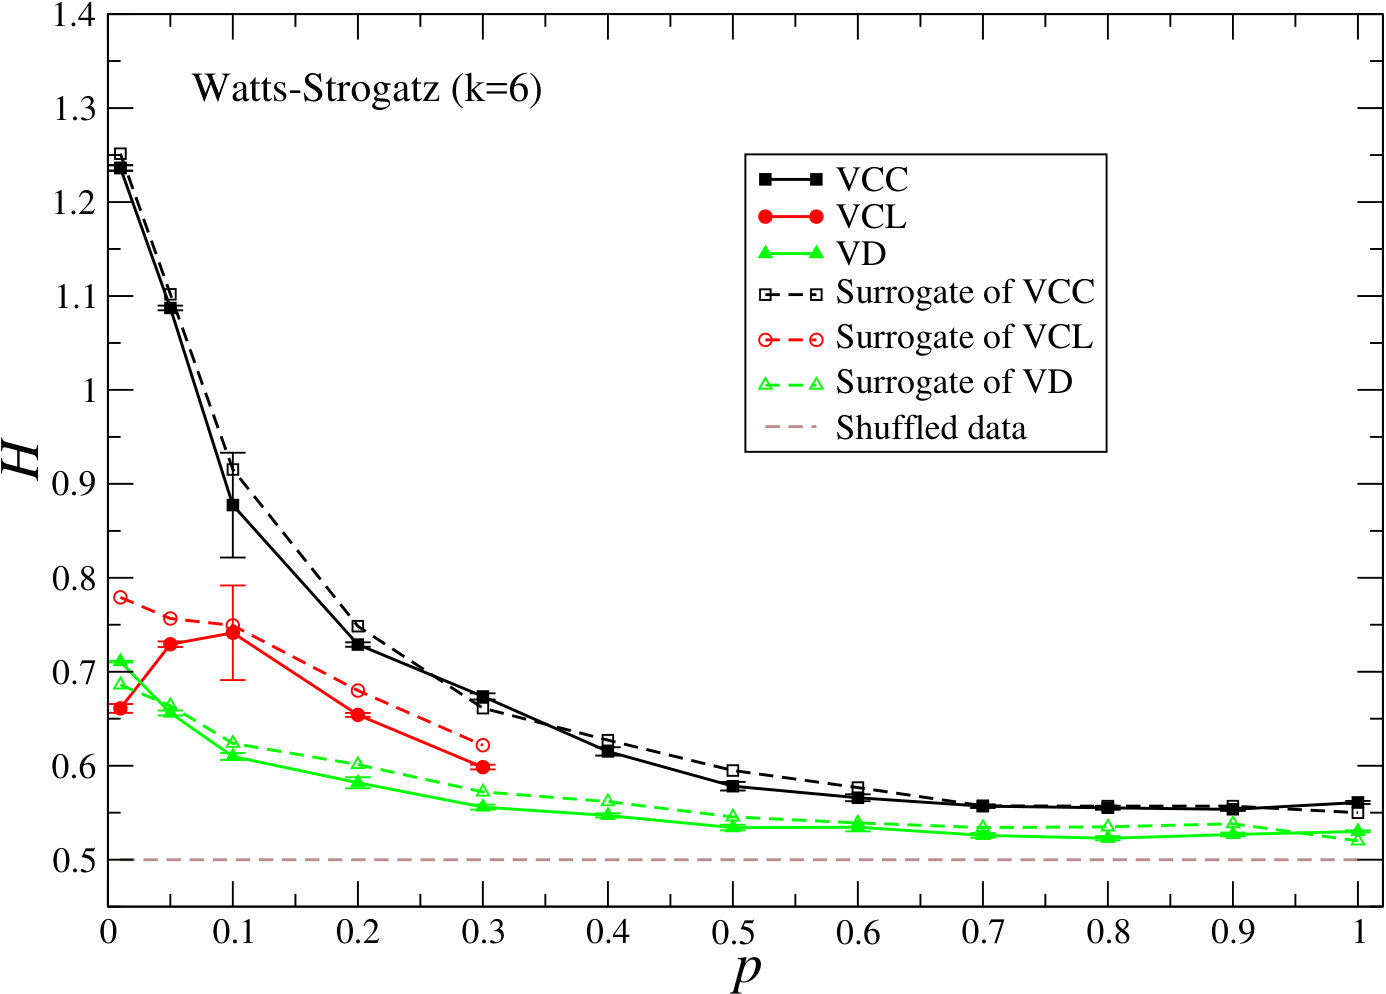 Figure 24
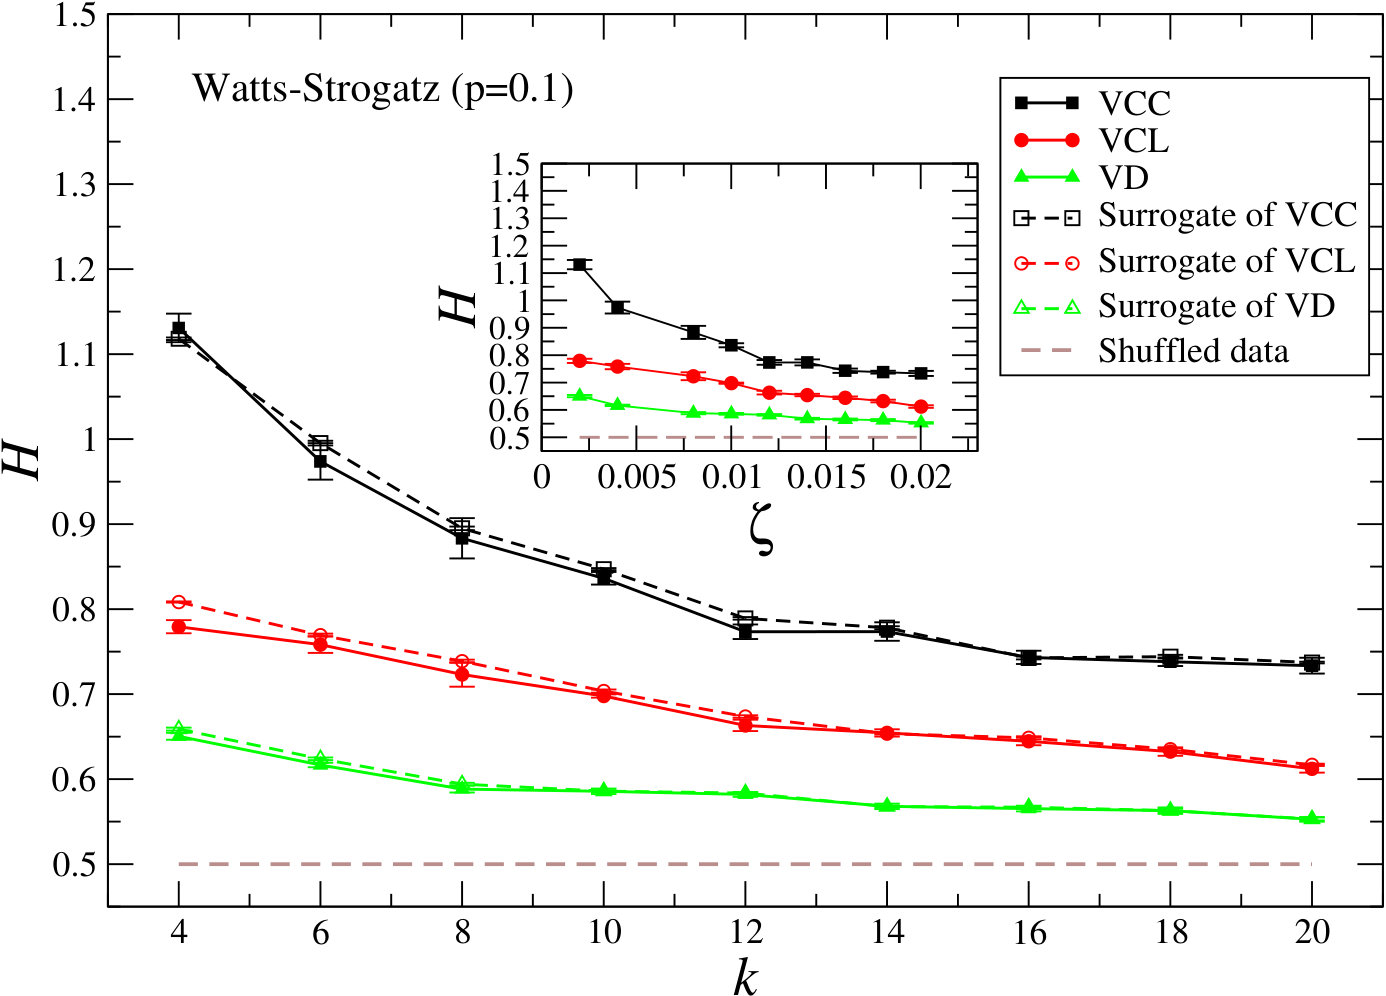 Figure 25
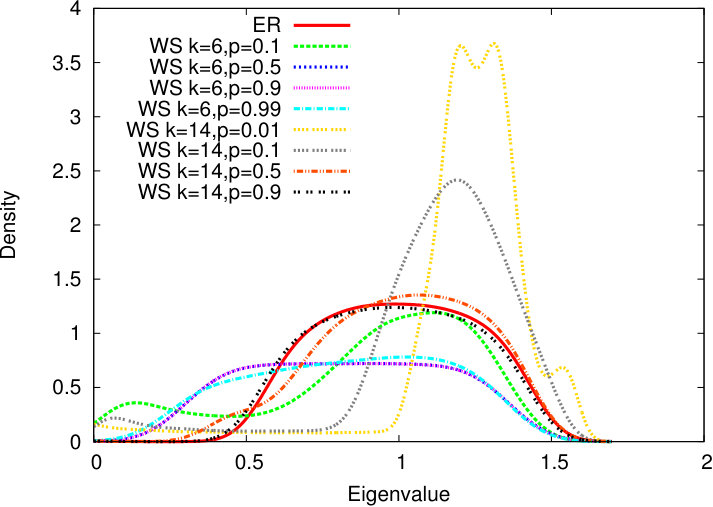 Figure 26
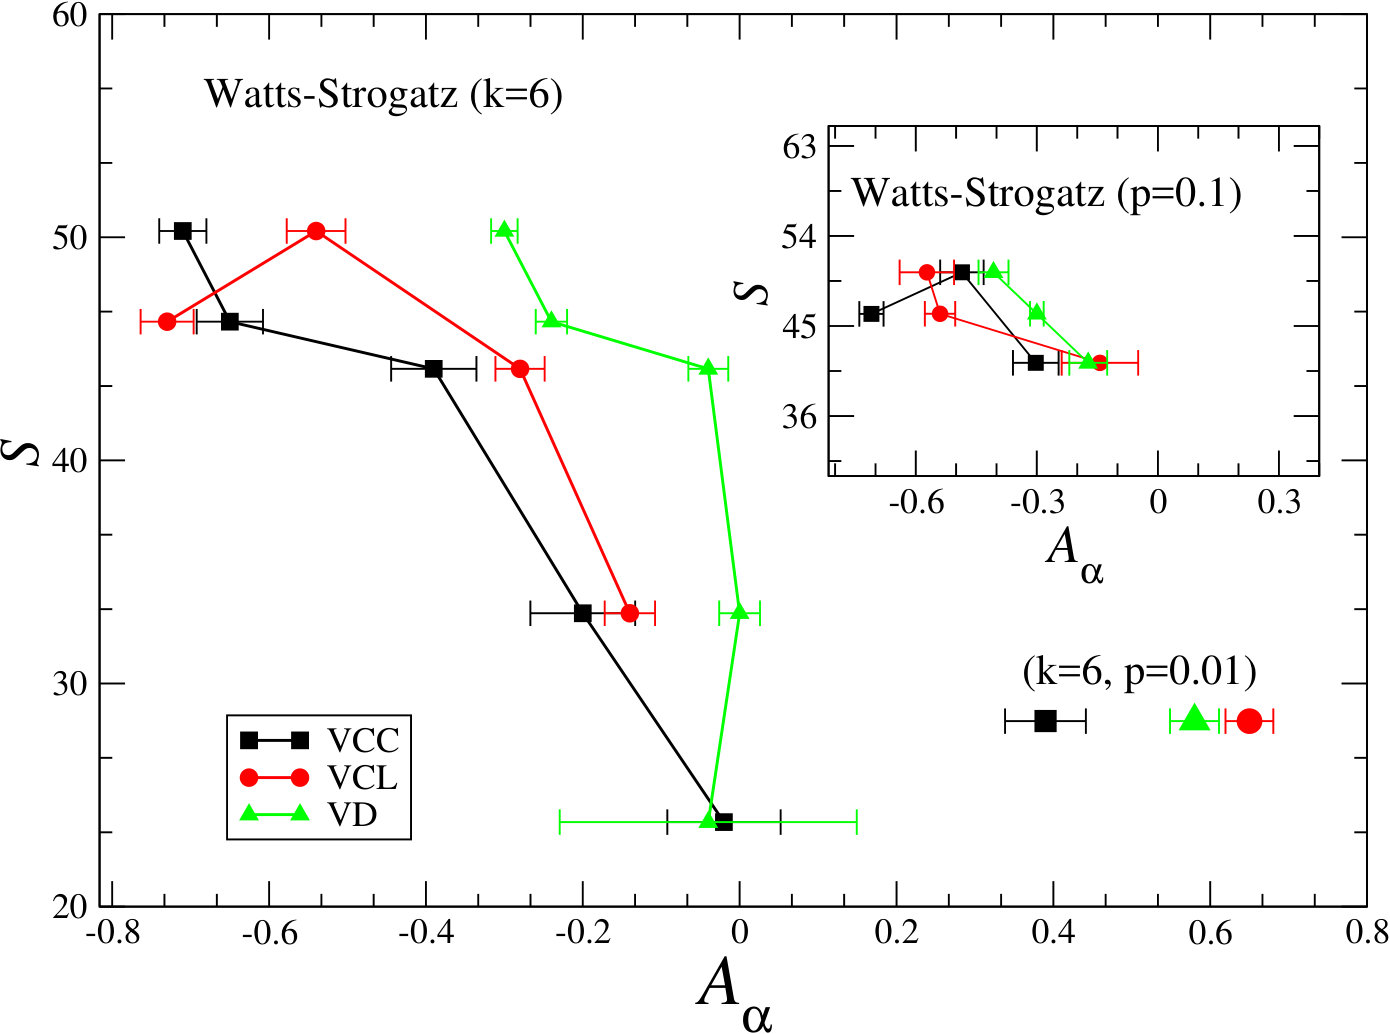 Figure 27
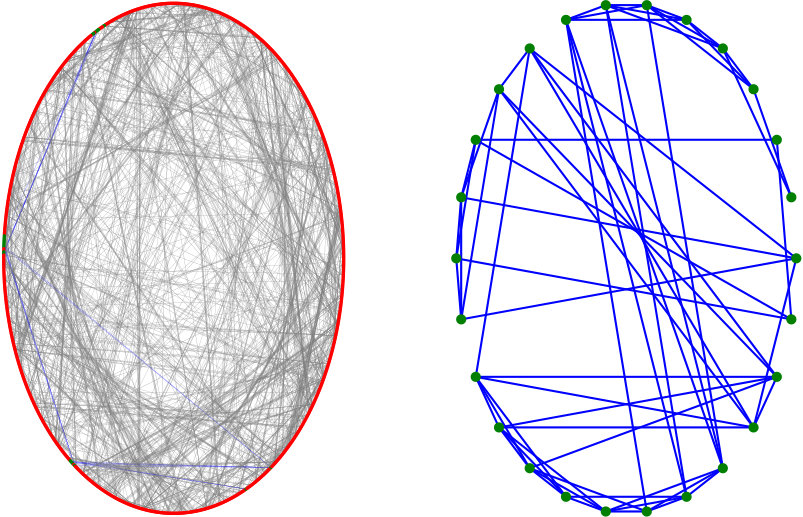 Figure 28
| Model | VCC | VD | VCL | (5) - degree of | |||
| network | small-worldness | ||||||
| WS () | 0.57 | +0.39 | - | - | 0.39 | +0.65 | 28.3 |
| WS () | 0.30 | -0.65 | 0.14 | -0.24 | 0.23 | -0.73 | 46.2 |
| WS () | 0.21 | -0.71 | 0.15 | -0.30 | 0.12 | -0.54 | 50.3 |
| WS () | 0.17 | -0.39 | - | - | 0.10 | -0.28 | 44.1 |
| WS () | 0.15 | -0.20 | - | - | 0.13 | -0.14 | 33.14 |
| WS () | 0.15 | -0.02 | - | - | - | - | 23.8 |
| WS () | 0.30 | -0.48 | 0.19 | -0.40 | 0.32 | -0.57 | 50.3 |
| WS () | 0.23 | -0.30 | - | - | - | - | 41.3 |
| WS () | 0.22 | -0.18 | - | - | - | - | 33.3 |
| WS () | 0.20 | -0.15 | - | - | - | - | 26.4 |
| WS () | 0.15 | -0.20 | - | - | - | - | 28.3 |
| DGM (7,8,9) | - | - | 1.03 | -0.47 | - | - | 244.1 - 1153.88 |
| SHM () | - | - | 0.62 | -0.19 | - | - | - |
| SHM () | 0.22 | -0.88 | 0.66 | -0.24 | - | - | - |
| SHM () | 0.13 | -0.93 | 0.75 | -0.37 | - | - | - |
| SHM () | 0.39 | -0.48 | 0.71 | -0.28 | - | - | - |
| SHM () | 0.26 | -0.40 | 0.77 | -0.33 | - | - | - |
| SHM () | - | - | 0.78 | -0.38 | - | - | - |
| SHM () | 0.19 | -0.57 | 1.00 | -0.52 | - | - | - |
| SHM () | 0.27 | -0.57 | 0.95 | -0.47 | - | - | - |
| SHM () | 0.61 | -0.81 | 0.92 | -0.41 | - | - | - |
| SHM () | 0.22 | -0.54 | 1.01 | -0.51 | - | - | - |
| SHM () | 0.22 | -0.43 | 1.03 | -0.51 | - | - | - |
Peer Reviews
No public reviews on file for this paper yet. If you reviewed it on a platform where reviews are public (OpenReview, ICLR, NeurIPS, ICML), you can paste yours below so the community can read it here.
Videos
No videos yet. Explain this paper in a talk, walkthrough, or lecture? Add one.
Right-side-stretched multifractal spectra indicate small-worldness in networks
Paweł Oświȩcimka
Lorenzo Livi
Stanisław Drożdż
Complex Systems Theory Department, Institute of Nuclear Physics, Polish Academy of Sciences, PL-31-342 Kraków, Poland
Department of Computer Science, College of Engineering, Mathematics and Physical Sciences, University of Exeter, Exeter EX4 4QF, UK
Faculty of Physics, Mathematics and Computer Science, Cracow University of Technology, PL-31-155 Kraków, Poland
Abstract
Complex network formalism allows to explain the behavior of systems composed by interacting units. Several prototypical network models have been proposed thus far. The small-world model has been introduced to mimic two important features observed in real-world systems: i) local clustering and ii) the possibility to move across a network by means of long-range links that significantly reduce the characteristic path length. A natural question would be whether there exist several “types” of small-world architectures, giving rise to a continuum of models with properties (partially) shared with other models belonging to different network families. Here, we take advantage of the interplay between network theory and time series analysis and propose to investigate small-world signatures in complex networks by analyzing multifractal characteristics of time series generated from such networks. In particular, we suggest that the degree of right-sided asymmetry of multifractal spectra is linked with the degree of small-worldness present in networks. This claim is supported by numerical simulations performed on several parametric models, including prototypical small-world networks, scale-free, fractal and also real-world networks describing protein molecules. Our results also indicate that right-sided asymmetry emerges with the presence of the following topological properties: low edge density, low average shortest path, and high clustering coefficient.
keywords:
Multifractal spectrum; Spectrum asymmetry; Time series; Complex network; Small-world.
††journal: Comm. in Nonlinear Science and Numerical Sim
url]https://sites.google.com/site/lorenzlivi/
1 Introduction
Nonlinear time series analysis [5] and network theory [4] have become standard frameworks for analyzing complex systems. Interesting hybridizations of the two frameworks are becoming popular as well, providing the possibility to study system dynamics observed as time series but analyzed in terms of topological features of associated complex network [6, 16, 42, 46]; analogously, complex networks can be studied in terms of time series analysis. For instance, recent works indicate the possibility to characterize network structures in terms of scaling and related (multi)fractal properties of suitably generated time series [34, 29, 45, 36].
A number of complex network models have been proposed in the literature [33, 26]. Among the many, the so-called “small-world” networks have had substantial impact on the understanding of a wide range of complex natural and technological systems [1], such as brain [3] and metabolic networks [13], and smart electrical grids [17]. An interesting practical issue with theoretical implications is whether real-world complex systems can be completely associated with prototypical networks within, for instance, the small-world family or they are actually better described as hybrids of different models. The idea of a “network morphology” [2] comes handy here, conceptualizing parametric network models on a configuration space, where different regions of such a space are occupied by networks with different theoretical/practical properties. Efforts in this direction include two recent works of particular interest. The first one [15] studies the necessary architectural trade-off needed to obtain modular networks (having fractal intra-module topology) with small-world features found in brain networks; the second one provides a theoretical model describing phase transitions between small-world and fractal network models [38], properties that cannot otherwise co-exist in a single complex network.
Considering the recent data deluge and relaxing the assumption of a general clear-cut between network models, it seems reasonable to design methods that can provide a quantitative measure expressing the membership of a given experimental network to a network family, e.g., the small-world one. To this end, Humphries and Gurney [22] suggested a measure of “small-worldness”, hence providing a way to quantify how much a given network is actually a small-world network.
In this paper, we elaborate over the dualism between complex networks and time series analysis and show that fractal analysis of time series can be used to judge over the degree of small-worldness present in networks. Specifically, we frame our contribution between random walks [7, 40] and multifractal analysis of time series [31, 18, 25]. Random walks are used to generate time series of suitable vertex properties, which are successively analyzed within the multifractal analysis framework. The novelty of our contribution can be summarized as follows:
We propose to use the degree of right-sided asymmetry of multifractal spectra [10], i.e., the degree to which spectra are stretched on the right-hand side, estimated for time series generated from complex networks as a signature of small-worldness in the corresponding networks. This claim is supported by experimental results on Watts-Strogatz [43], Dorogovtsev-Goltsev-Mendes [9], Song-Havlin-Makse [41] network models and on real data describing protein contact networks [27];
- 2.
The proposed criterion based on right-sided spectrum asymmetry can be applied also to networks where local clustering coefficient cannot be defined (e.g., in tree-like networks). For instance, on Song-Havlin-Makse networks clustering coefficient cannot be computed. Hence, conventional measures of small-worldness cannot be used. On the other hand, we show that the degree of right-sided asymmetry can be used also in these cases as a reliable indicator of network small-worldness;
- 3.
We argue that low edge density, low average shortest path, and high clustering coefficient are topological properties linked with the emergence of right-sided spectrum asymmetry of at least one of the three vertex observables taken into account. This finding is connected with the results shown in Ref. [22], where the authors suggest a measure of small-worldness and show that when edge density is increased, Watts-Strogatz networks become indistinguishable from Erdös-Rényi graphs, hence losing their characteristic small-world signature.
The remainder of the paper is structured as follows. Section 2 introduces the methods used for the analysis. In Section 3, we present and discuss the results of our analysis performed on various networks. Conclusions and future directions follow in Section 4
2 Methods
2.1 Random walks on graphs and related time series of vertex properties
Let be an undirected graph, with and denoting the sets of vertices and edges, respectively. A Markovian random walk in a graph [30] is a first-order Markov chain on the graph vertices. Transitions among vertices are dictated by the transition matrix,
[TABLE]
where is the adjacency matrix of and is a diagonal matrix of vertex degrees, i.e., .
Let be an initial distribution for the chain. The probability of the states at time can be computed by the following recursion: . The stationary distribution of the chain, , is a probability vector satisfying . If the graph is undirected and non-bipartite, then it always possesses a (unique) stationary distribution that can be easily computed from the degree distribution, . A stationary random walk is hence completely described by .
Let us define a time-homogeneous vertex property map as , where is the domain of vertex property , such as degree, closeness centrality or other, user-defined vertex properties. By performing a (stationary) random walk on , we generate a sequence of vertices, , which are visited over a finite yet sufficiently large time span . It is possible to associate to such a random walk a sequence of observables by emitting at each time instant the corresponding vertex property given by , where is the i vertex of that is visited at time . This process generates a sequence of vertex properties, . It is worth noting that a first-order Markov process is by definition a memory-less process. Nonetheless, as first observed in [29, 34, 45], time series of vertex properties emitted by such a process might posses a complex organization characterized by a non-trivial correlation structure, which can be quantified by means of the multifractal analysis framework. As in [36], here we consider the following properties: vertex degree (VD), clustering coefficient (VCL), and closeness centrality (VCC).
2.2 Scaling of fluctuations and multifractal analysis
Self-similarity of time series can be investigated by focusing on the scaling properties of the fluctuations, , expressed as a function of the length-scale [20]. Self-similar signals posses power-law scaling of the fluctuations, i.e. , where is called Hurst exponent. When only short-term correlations are present in the signal; indicates persistency of the underlying process, i.e., the presence of long-term correlations, while points out the presence of anti-correlations [21]. Several different methods have been proposed to analyze the fluctuations of the stationary component of a time series [37, 14, 44]. The Detrended Fluctuation Analysis (DFA) procedure is a state-of-the-art method conceived for this purpose [24]. Its generalization, called Multifractal Detrended Fluctuation Analysis (MF-DFA) [23, 35], accounts also for multi-scaling, allowing a multi-level characterization of time series.
MF-DFA operates by analyzing the profile of a time series, which is then divided in non-overlapping segments of equal length . In order to account for non-stationarities due to trends, a polynomial function is fitted on (and then removed from) each of the segments. The procedure then computes the local variance, denoted as , for each segment . The th-order moment of the local variance is given by , where operates as a magnification factor (to analyze the time series at different resolutions). In order to check if the scaling of the variance follows a power law, i.e., , the last steps are repeated for several scales of increasing length. The generalized Hurst exponent, denoted as , characterizes the -dependency of the fluctuation scaling. A time series is called monofractal if does not depend on . On the other hand, when the dependency is strong enough, the time series is said multifractal.
The multifractal spectrum (MFS), denote as , describes the multifractal properties of a time series and is given by
[TABLE]
where is called Hölder exponent. It is worth noting that corresponds to the Hausdorff dimension of a subset of the input data where the Hölder exponent is equal to . The multifractal spectrum (2) encodes important information regarding the sensitivity to fluctuations with high/low magnitudes, analyzed by using positive/negative values. The width of the support of is defined as
[TABLE]
where and denote the lower and upper end points of , respectively. The width of the spectrum offers an important quantitative complexity measure: the larger the width, the higher the complexity of the time series. In addition, the degree of asymmetry of MFS (2) is another important feature to be taken into account [10],
[TABLE]
where and denote the width of the left and right part of , respectively. A negative value for implies right-sided asymmetry (i.e., spectra are stretched on the right-hand side), highlighting a stronger multifractality on smaller fluctuations. Conversely, left-sided spectra denote a higher heterogeneity for large fluctuations [10].
2.3 Quantitative measures of small-worldness
A quantitative measure of small-worldness is defined in [22] as follows:
[TABLE]
where
[TABLE]
In Eq. 6, is the average clustering coefficient of a given WS network ,
[TABLE]
where is the clustering coefficient of th vertex, and denote, respectively, the number of edges between the direct neighbors of vertex and its degree. Analogously, denotes the average clustering coefficient of the corresponding Erdös-Rényi (ER) network with the same edge density, which is defined as:
[TABLE]
where and are the number of edges and vertices, respectively. Eq. 7 is defined in a similar way but using average shortest path (ASP) instead of clustering coefficient.
As discussed in [22], the categorical definition of small-world network given above implies and . This fact imposes for small-world networks: the larger the value of , the higher the degree of small-worldness.
3 Results
The experimental results presented in this paper have been obtained by generating random walks with time-steps; results are always intended as averages of ten different random realizations of such random walks. A recent study [34] points to the differences between short- and long-term correlations in the considered vertex observables. In particular, the data are strongly autocorrelated on short time-scales, whereas they can be considered as independent on large time-scale hence giving rise to a pronounced cross-over in the fluctuation functions. Therefore, in this paper we concentrate mainly on short-range correlations (i.e., scales ) as more important from the perspective of the network structure here taken into account.
3.1 Watts-Strogatz model
Here we discuss the outcome of the analysis conducted on Watts-Strogatz (WS) models [43]. There are two main parameters affecting the topology of WS networks: the number of nearest neighbors in the initial ring-like topology and the probability of rewiring an edge to a uniformly chosen pair of vertices. In our experiments, assumes values in and in . Notably, for each value of , we select ten network configurations by increasing with a step of 0.1. When , all edges are randomly rewired, hence heavily affecting the resulting WS network topology. WS networks are always composed by vertices.
Fig. 1 shows results obtained with and three representative settings for , namely low (), medium (), and high () rewiring probability. In this case, WS networks are sparse, in the sense that edge density (10) is low. We note that when , Fig. 1(b), all three vertex observables denote right-sided asymmetry for the corresponding MFS. As expected, multifractal characteristics are lost and in addition the spectra get shifted towards smaller values as soon as the rewiring probability is increased. In fact, for (Fig. 1(f)) we obtain spectra indicating monofractal character of the time series. These results have been confirmed by means of the MFDMA method [19] (results not shown).
A peculiar behaviour is observed for VCL time series. For and , these time series contain many zeros (data not shown) which result in spurious detection of multifractal features. Thus, even for MFS estimated for VCL time series do not resemble monofractal spectra with Hurst exponent , as obtained for ER graphs with corresponding edge density (and equal number of vertices). In order to further elaborate on this issue, we estimated the distribution of eigenvalues of the normalized Laplacian matrices of ER graphs, as well as of different WS graphs; see Fig. 2. Our results indicate that, to obtain a normalized Laplacian spectrum of a WS network that resembles the one of a typical ER graph, such WS graphs have to be generated with large rewiring probability and also with large edge density (large considering the number of vertices).
Fig. 3 shows how the multifractal characteristics are affected by the degree of randomness introduced in WS models by increasing . In particular, we note that VD time series become monofractal when . On the other hand, VCC time series become monofractal when . Moreover, multifractality of the time series is mainly accompanied by a strong right-sided asymmetry of the MFS (Fig. 3(c)). The only exceptions are spectra obtained for WS networks with a very small (the structure of such graphs is similar to the initial ring) for which we identify left-sided asymmetry of the spectrum. The spectra shift systematically towards when increasing , suggesting that the temporal organization of the related time series weakens progressively when increasing degree of graph randomness. Results for VCL time series and are not shown due to the computational artefact mentioned above. Also the neighborhood size, here controlled by , plays a particularly important role in determining the multifractal properties of vertex observables; see Fig. 4. Our results show that edge density is a key ingredient for obtaining MFS with right-sided asymmetry. In fact, regardless of the values assigned to , when edge density is too high, MFS become narrow, i.e., monofractal. Fig. 5 shows the relationship between MFS asymmetry and the small-worldness measure discussed in Sec. 2.3. We note that for , the asymmetry degree becomes negative, indicating an asymmetric spectrum stretched on the right-hand side. The value for in Eq. 5 are in agreement with this behavior. In fact, in the case, we have , while in the case, we have a higher value, i.e., .
These results, taken altogether, suggest that right-sided asymmetry of MFS could be interpreted also as a signature of network small-worldness. Notably, WS models producing time series with right-sided spectra are more small-world than WS models denoting either monofractal or left-sided MFS asymmetry in the corresponding time series. Finally, it is worth mentioning that differences between values calculated for different network configurations (hence yielding different values for ) are all statistically significant (details not shown).
The qualitative explanation of the MFS asymmetry can be inferred from Fig. 6, where we show a sample time series (Fig. 6(a)) obtained for WS network with as well as a visualization of the network (Fig. 6(b)). It can be easily noticed that large fluctuations of the closeness centrality coefficient, VCC, are accompanied with long-range network links. Moreover, long-range links are randomly distributed and constitute a small fraction of all connections in the graph. Hence, the random walker visits mainly short-range connected vertices for which centrality coefficient fluctuates in a complex way, yet without abrupt changes. This, in turn, results in VCC time series having a more complex temporal organization for small fluctuations rather than for the large ones, which is manifested by right-sided asymmetry of the related MF spectrum.
Robustness of our analysis is demonstrated by reporting results for surrogate time series [39]. For this purpose, we considered two kinds of tests commonly used in the statistical analysis of time series. The former relies on analysis of artificial time series generated by means of phase-randomized Fourier transform algorithm applied to the original data. Hence, by means of this procedure one can destroy potential non-linear autocorrelations existing in the time series but still preserve the linear ones. The latter test is based on shuffling the original time series. This procedure is a simple and efficient way for destroying all temporal correlations yet preserving the probability density function of the data. Results on surrogates confirm statistical significance of our analysis. In the case of surrogates based on Fourier transform, only monofractal behaviour () [12] is identified, whereas linear dependencies related to Hurst exponent remain unchanged. Similarly, randomly shuffled data are characterized by homogeneous scaling properties being quantified by a single exponent and extremely narrow spectrum MFS ().
We also perform additional tests to illustrate the contribution of the temporal organization of the small and medium fluctuations in the right-sided asymmetry of MFS. To this end, data points of original time series with amplitude smaller than a threshold are randomized, whereas larger ones remain unchanged. This procedure is equivalent to removing correlations between small fluctuations, leaving the larger ones intact. We apply this procedure to the VCC time series related to the WS model with , which are characterized by strong MFS right-sided asymmetry. For normalized time series (zero mean and unit variance), we consider two values for the threshold . The results are depicted in Figure 7. It is evident that random shuffling of the small and medium fluctuations destroys multifractality in the time series. For we obtain monofractal spectrum (), confirming that complexity of the VCC time series is related to temporal organization of the small fluctuations.
3.2 Dorogovtsev-Goltsev-Mendes model
In this section, we analyze results obtained by means of a scale-free network model introduced by Dorogovtsev, Goltsev, Mendes (DGM) [9]. The DGM model is deterministic and generates scale-free networks whose average shortest path grows logarithmically with the number of vertices. Hence, DGM models are also small-world. We consider three DGM model instances that differ by the number of iterations (7, 8, and 9) used during the growth process: resulting networks are denoted with DGM7, DGM8, and DGM9, respectively. Results are shown in Fig. 8. It is possible to note that multifractality is observed only for VD time series, where MFS are wide and strongly right-sided. The asymmetry is the same for all DGM networks taken into account, . However, in Eq. 5 changes and increases significantly: for DGM7 is 244.41; for DGM8 is 1153.88; and for DGM9 is 2709.81. This fact indicates that the signature of small-worldness (5) should increase in DGM networks with the size of the graphs. However, this should not happen as the average shortest path scaling law remains the same regardless of the graph size. This might suggest that is sensitive to the network size and related edge density (DGM7 contains 1095 vertices and 2187 edges, which gives ; for DGM8; for DGM9).
Nonlinear dependence between data constitute the main factors responsible for multifractal organization of time series [11]. However, the fat-tailed distribution of data can also be a significant ingredient of multifractality when nonlinear correlations are present [47]. A transformation applied to a given time series preserves the hierarchical organization of data but changes the underlying distribution. This, in turn, might result in changes of the correlation structure of data that, in turn, depend on the change of the distribution. In the DGM case, VD and VCL are linked by a precise relation: . The distribution of the VD time series (variance ) is much more dispersed than VCL ones (variance ). Thus, heterogeneity of correlation organization between fluctuation of different amplitudes reflected in multifractal characteristics is much more evident for VD data than for VCL time series.
3.3 Song-Havlin-Makse fractal model
The Song-Havlin-Makse (SHM) model [41] allows to generate networks with modular topologies ranging from fractal to non-fractal networks having small ASP. The SHM model comprises of four main parameters: (i) number of generations, (ii) number of offspring per vertex, (iii) number of connections between offsprings, (iv) and , the probability that hubs stay connected during the growth process. Here we keep fixed the first three parameters with values 4, 3, and 2, respectively, and vary within the range in order to study the effects on the related time series of vertex observables in terms of MFS features. When , hubs grow by preferentially linking with low-degree vertices (anticorrelated attachment mechanism), giving rise to a robust fractal topology. Attraction between hubs obtained with large values of , instead, leads to non-fractal topologies with low ASP – a key ingredient in small-world networks. In all SHM models, VCL is always zero.
In Fig. 9(a), we show the results for Hurst exponent. The VD time series denote a nearly constant Hurst exponent as we vary . The Hurst exponents of VCC time series are characterized by a decreasing trend, remaining strongly persistent for the entire parameter range. Fig. 9(b) shows the MFS width for the two vertex observables. As it is possible to notice, for VD time series the width increases as we generate networks possessing a stronger small-world signature (i.e., by increasing ). Accordingly, it is possible to claim that VD time series exhibit multifractal characteristics by varying in the entire range. In the VCC case, instead, we note a much stronger irregularity in terms of multifractal characteristics. A clear multifractal signature is observed when is roughly 0.3 and 0.8, whereas in the other cases MFS width suggest monofractal behavior.
Fig. 9(c) shows the results for MFS asymmetry. For VD time series, we observe an increase in the degree of right-sided asymmetry as the networks become more small-world. Therefore, in this case the degree of right-sided asymmetry is a good predictor of the related network small-worldness. On the other hand, for the VCC time series we observe a significant change of asymmetry when . Notably, MFS become strongly left-sided. However, the related MFS are narrow in that parameter range, denoting monofractal characteristics. Hence, we conclude that asymmetry of VCC time series does not seem to be useful to predict the small-worldness of the related SHM networks.
Finally, it is worth noting that, as shown in Fig. 9(d), the position of the cross-over for VCC time series changes as we vary the model parameter . In particular, when SHM networks are mostly fractals, i.e., when , it is possible to analyze also larger scales (i.e., ) in the related time series. In fact, in all other network models taken into account in our study, we always detected a cross-over roughly at , leading to uncorrelated behavior. We hypothesize that this fact is linked with the self-similarity of the SHM network topology and leave further investigations as future work.
In Fig. 10, we show the details for three network configurations giving rise to pure fractal (a), hybrid (b), and small-world (c) topologies. Let us first discuss the results for VCC time series. For pure fractal models, shown Fig. 10(a), time series are homogeneous fractal with narrow and symmetric MFS (). Moreover, VCC time series are strongly persistent (large Hurst exponent), which we hypothesize to be related to the “forest” structure of networks giving rise to strong assortativity [32] of closeness centrality (. In the case of hybrid networks, shown in Fig. 10(b), we note left-sided asymmetry of MFS (although ). In this case, Hurst exponent is and assortativity of VCC is high (0.88). Finally, Fig. 10(c) shows results for pure small-world networks, where we observe strong right-sided asymmetry of multifractal spectrum with large Hurst exponent .
The MFS denote different characteristics for the three configurations also in the case of VD time series. In general, becomes systematically wider (and more right-sided asymmetrical) as the networks become more small-world (i.e., by increasing ). However, it is worth noting that the MFS shown in Fig. 10(c) are different from those shown in Fig. 1(b). In fact, SHM models with large posses wider MFS with a more pronounced right-sided asymmetry than WS networks.
Overall, these results strengthen the hypothesis that small-world topologies with low edge density lead to right-sided asymmetry in MFS of related time series. Results are supported by the analysis of suitable surrogates shown in the corresponding figures. Table 1 summarizes the main characteristics of the multifractal time series computed on all network models taken into account in our study.
3.4 Protein contact networks
In this last experimental section, we analyze real-world data describing E. coli protein molecules [28, 27]. We consider network representations of folded proteins (i.e., native structures) called protein contact networks (PCNs) [8]. Such networks are formed by considering amino acids as vertices (alpha-carbon are taken as representatives of amino acids), which are linked by edges that depend on their proximity (between 4 and 8 Å) as given by their three-dimensional coordinates. PCNs posses mixed topological features proper of several different prototypical models, including small-world, scale-free, fractal, and modular networks. In particular, PCNs posses low ASP and high (average) clustering coefficient, typical of small-world networks, although it is not possible to claim that PCNs are pure small-world networks (see [27] and references therein for details). Here, we take into account four sample proteins with PDB codes 3DMQ (PCN0058), 4JOM (PCN0179), 2JGD (PCN0715), and 2QTA (PCN0110).
Results of multifractal analysis are shown in Fig. 11, where we show MFS computed for the four PCNs taken into account (Fig. 11(a)) and related validation on surrogate time series (Fig. 11(b)). Results change depending on the vertex observable taken into account. VD time series denote a clear multifractal, right-sided spectrum only in the PCN0058 case. VCC time series consistently denote right-sided MFS for all four PCNs. Finally, VCL time series posses some multifractal features, although the MFS are fairly narrow; right-sided asymmetry is never observed in this case. Table 2 provides relevant details regarding PCN topological features and calculations for the degree of small-worldness as given by Eq. 5 and MFS asymmetry (4) for VCC time series. It is possible to notice that the degree of right-sided asymmetry is consistent with other topological features typically observed in small-world networks.
4 Discussion and final remarks
Networks possessing small-world features are ubiquitous in Nature and society. Several parametric models allow to obtain networks with hybrid features, often spanning across different network types with orthogonal characteristics (e.g., fractal and small-world features, in principle, cannot co-exist within the same network). However, considering the availability of large volume of data, it is important to design methods that allow to measure the presence of said features also in experimental networks. Here, we addressed the important issue of assessing the degree of small-worldness in complex networks. The proposed approach is based on fractal analysis of time series generated from networks. Our results suggest the possibility to consider the degree of right-sided asymmetry of multifractal spectra, indicated as in the paper, as a predictor of the degree of small-worldness present in the corresponding networks. We validated this claim on several models, including prototypical small-world networks, scale-free, fractal and also real-world networks describing protein native structures. The relation between the degree of small-worldness proposed in [22] and the degree of right-sided asymmetry is consistent for Watts-Strogatz and Dorogovtsev-Goltsev-Mendes models. However, for Song-Havlin-Makse fractal models, cannot be computed, while the criterion based on still produces consistent outcomes. Our main result indicates that (i) provides a reliable criterion to assess small-worldness in networks and (ii) right-sided asymmetry of multifractal spectra emerges with the presence of the following topological properties: low edge density, low average shortest path, and high clustering coefficient. The last claim is in agreements with the findings of Humphries and Gurney [22], which showed that Watts-Strogatz small-world networks become indistinguishable from Erdös-Rényi graphs if, in the former, edge density is significantly increased.
The reference list from the paper itself. Each links out to its DOI / PubMed record.
- 1Amaral et al. [2000] L. A. N. Amaral, A. Scala, M. Barthelemy, and H. E. Stanley. Classes of small-world networks. Proceedings of the National Academy of Sciences , 97(21):11149–11152, 2000. doi: 10.1073/pnas.200327197 .
- 2Avena-Koenigsberger et al. [2015] A. Avena-Koenigsberger, J. Goñi, R. Solé, and O. Sporns. Network morphospace. Journal of The Royal Society Interface , 12(103):20140881, 2015. doi: 10.1098/rsif.2014.0881 .
- 3Bassett and Bullmore [2016] D. S. Bassett and E. T. Bullmore. Small-world brain networks revisited. The Neuroscientist , pages 1–18, 2016. doi: 10.1177/1073858416667720 .
- 4Bianconi [2015] G. Bianconi. Interdisciplinary and physics challenges of network theory. EPL (Europhysics Letters) , 111(5):56001, 2015. doi: 10.1209/0295-5075/111/56001 .
- 5Bradley and Kantz [2015] E. Bradley and H. Kantz. Nonlinear time-series analysis revisited. Chaos: An Interdisciplinary Journal of Nonlinear Science , 25(9):097610, 2015. doi: 10.1063/1.4917289 .
- 6Budroni et al. [2017] M. A. Budroni, A. Baronchelli, and R. Pastor-Satorras. Scale-free networks emerging from multifractal time series. Physical Review E , 95:052311, May 2017. doi: 10.1103/Phys Rev E.95.052311 .
- 7Burioni and Cassi [2005] R. Burioni and D. Cassi. Random walks on graphs: ideas, techniques and results. Journal of Physics A: Mathematical and General , 38(8):R 45, 2005. doi: 10.1088/0305-4470/38/8/R 01 .
- 8Di Paola et al. [2012] L. Di Paola, P. Paci, D. Santoni, M. De Ruvo, and A. Giuliani. Proteins as sponges: a statistical journey along protein structure organization principles. Journal of Chemical Information and Modeling , 52(2):474–482, 2012. doi: 10.1021/ci 2005127 .