High Resolution Observations of the Massive Protostar in IRAS18566+0408
P. Hofner, R. Cesaroni, S. Kurtz, V. Rosero, C. Anderson, R. S., Furuya, E. D. Araya, S. Molinari

TL;DR
This study presents high-resolution multi-wavelength observations of the massive protostar IRAS18566+0408, revealing an ionized jet, hot dense molecular gas, and a compact energy source, supporting star formation mechanisms similar to lower-mass stars.
Contribution
First detailed high-resolution multi-wavelength analysis of IRAS18566+0408, demonstrating the presence of an ionized jet and hot core, and linking outflow features to star formation processes.
Findings
Detection of an ionized jet aligned E-W.
Identification of hot, dense molecular gas near the protostar.
Evidence of a compact energy source within 2400 AU.
Abstract
We report 3 mm continuum, CH3CN(5-4) and 13CS(2-1) line observations with CARMA, in conjunction with 6 and 1.3 cm continuum VLA data, and 12 and 25 micron broadband data from the Subaru Telescope toward the massive proto-star IRAS18566+0408. The VLA data resolve the ionized jet into 4 components aligned in the E-W direction. Radio components A, C, and D have flat cm SEDs indicative of optically thin emission from ionized gas, and component B has a spectral index alpha = 1.0, and a decreasing size with frequency proportional to frequency to the -0.5 power. Emission from the CARMA 3 mm continuum, and from the 13CS(2-1), and CH3CN(5-4) spectral lines is compact (i.e. < 6700 AU), and peaks near the position of VLA cm source, component B. Analysis of these lines indicates hot, and dense molecular gas, typical for HMCs. Our Subaru telescope observations detect a single compact source,…
Click any figure to enlarge with its caption.
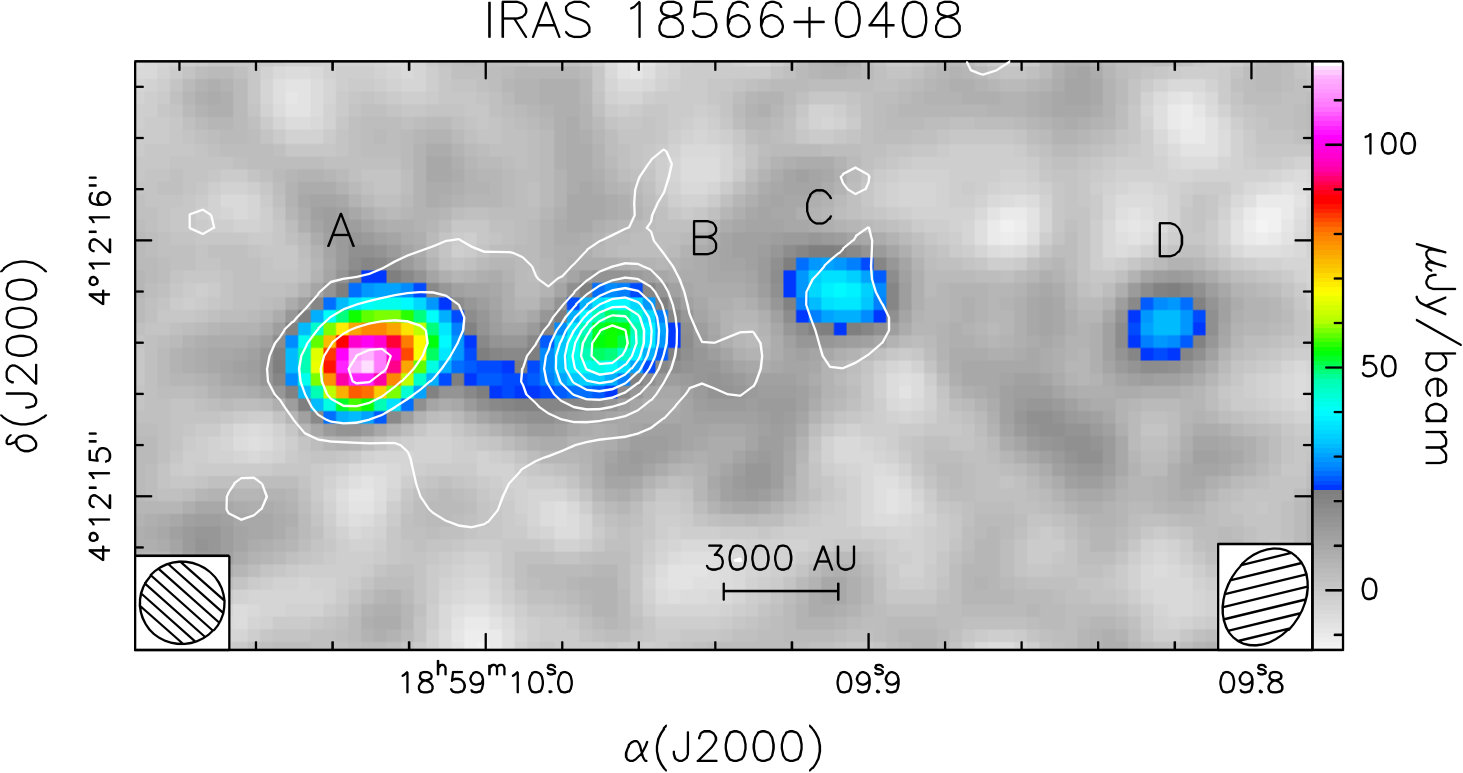 Figure 1
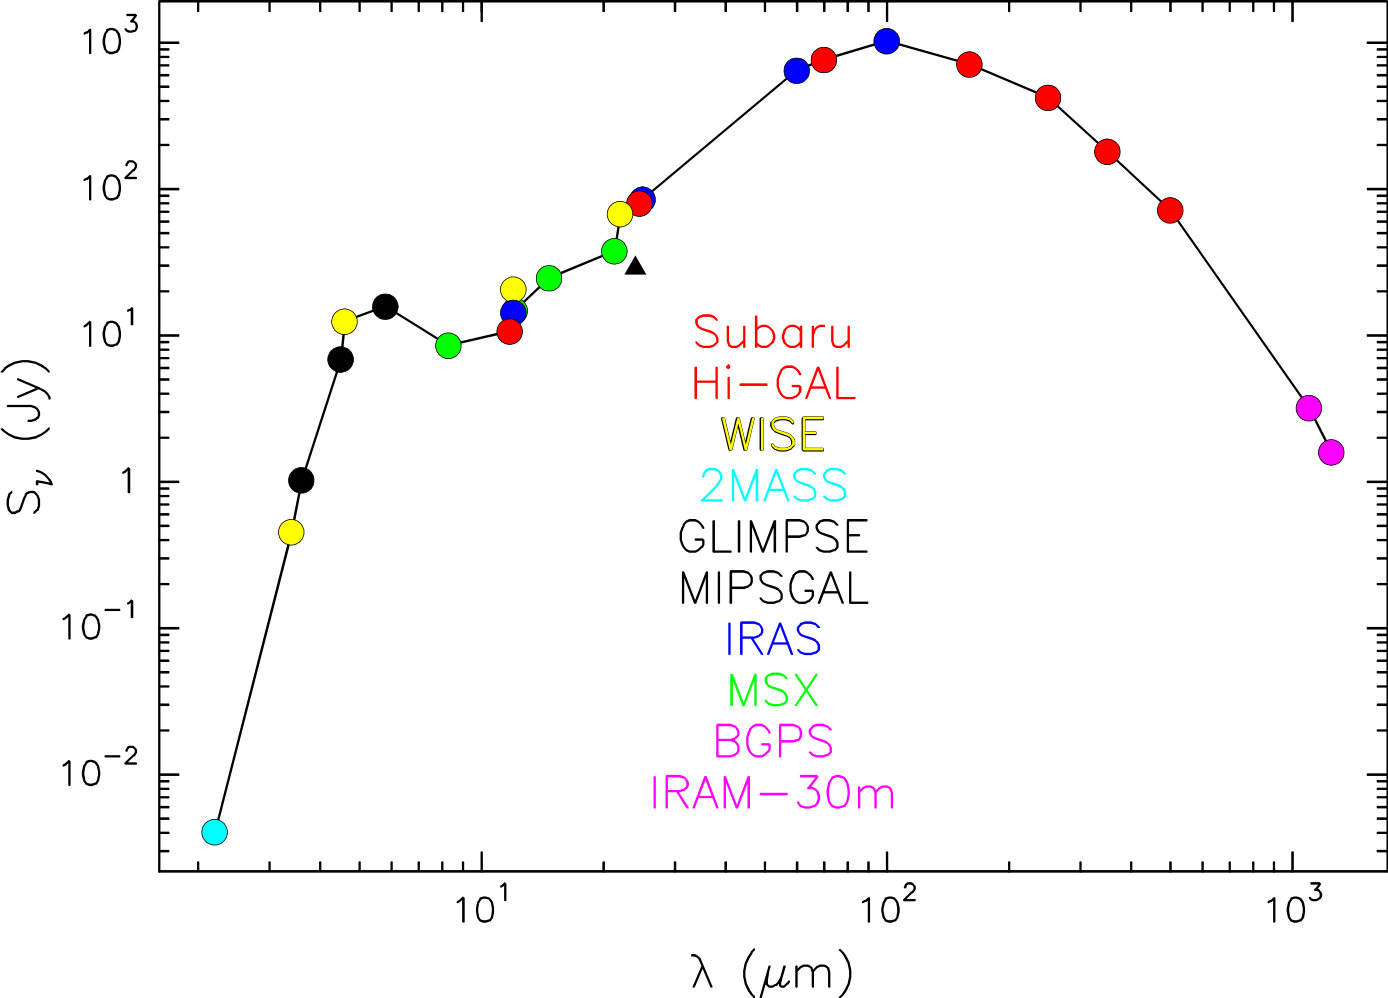 Figure 10
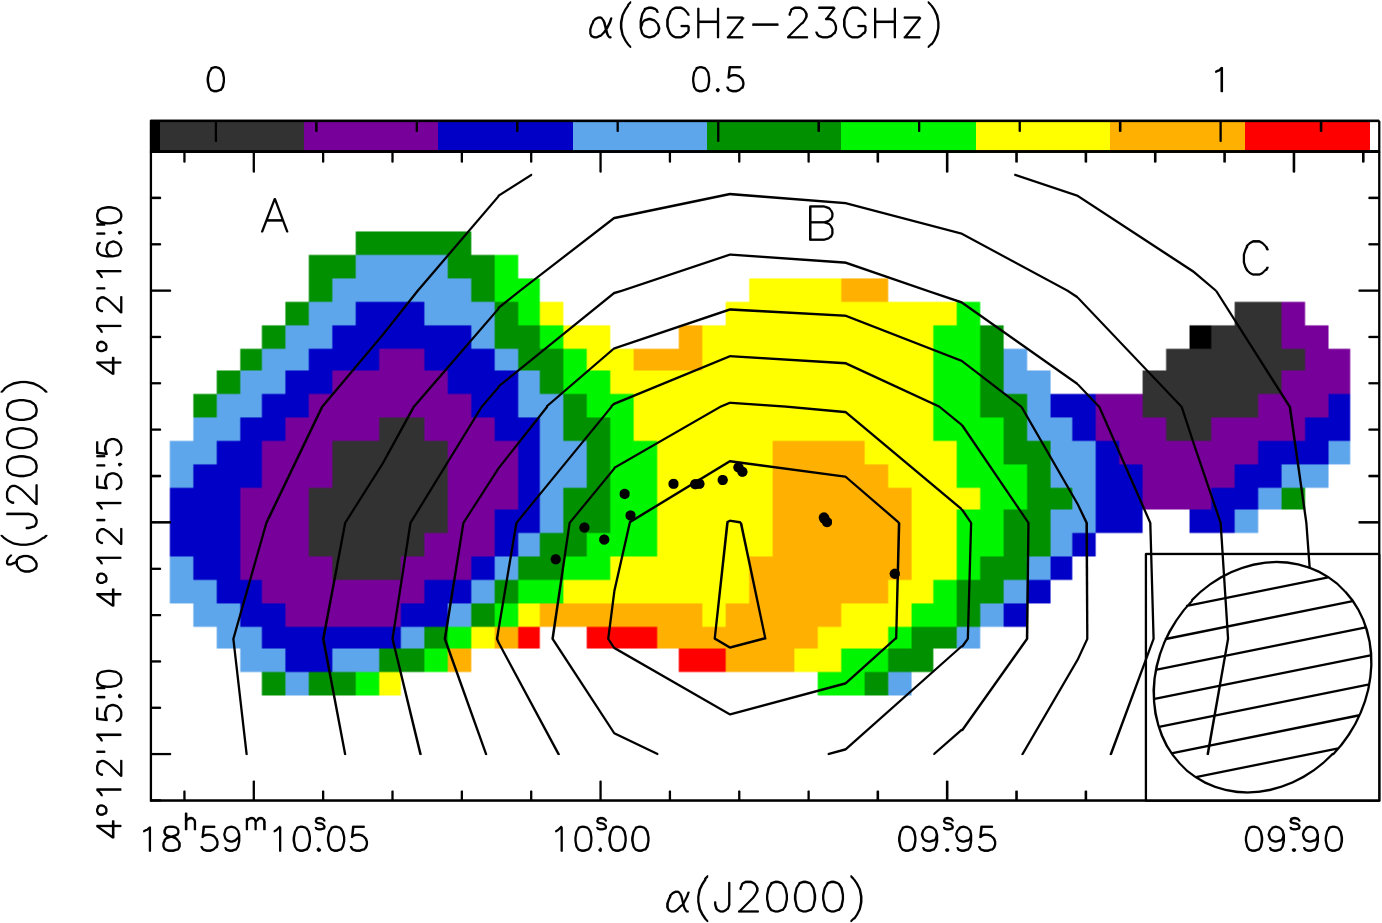 Figure 2
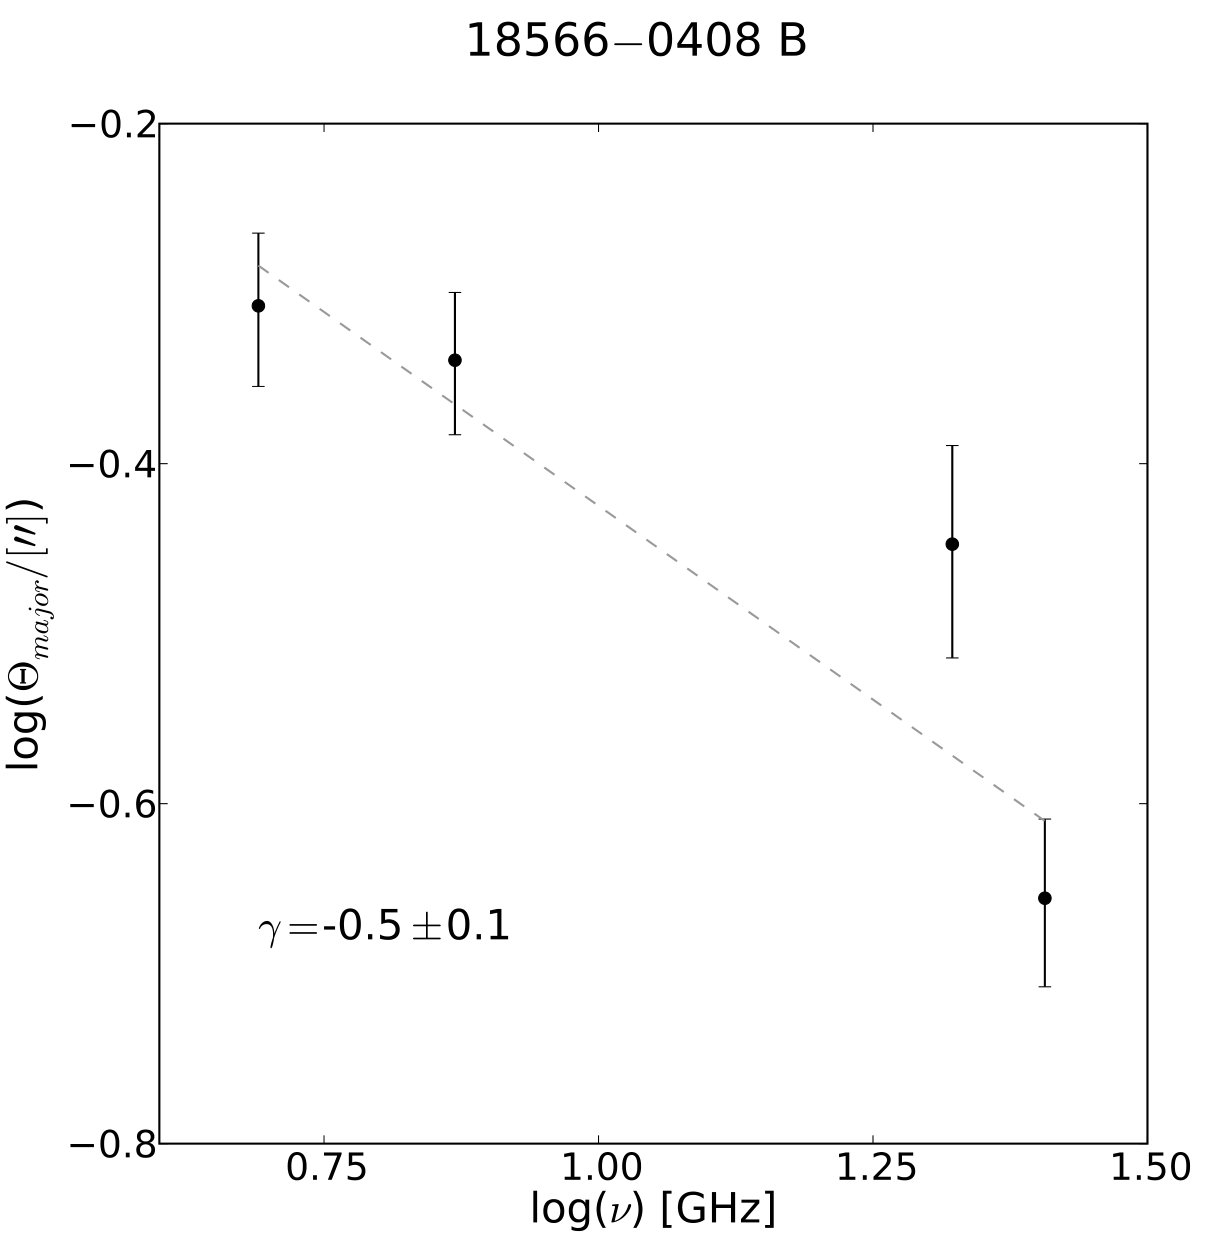 Figure 3
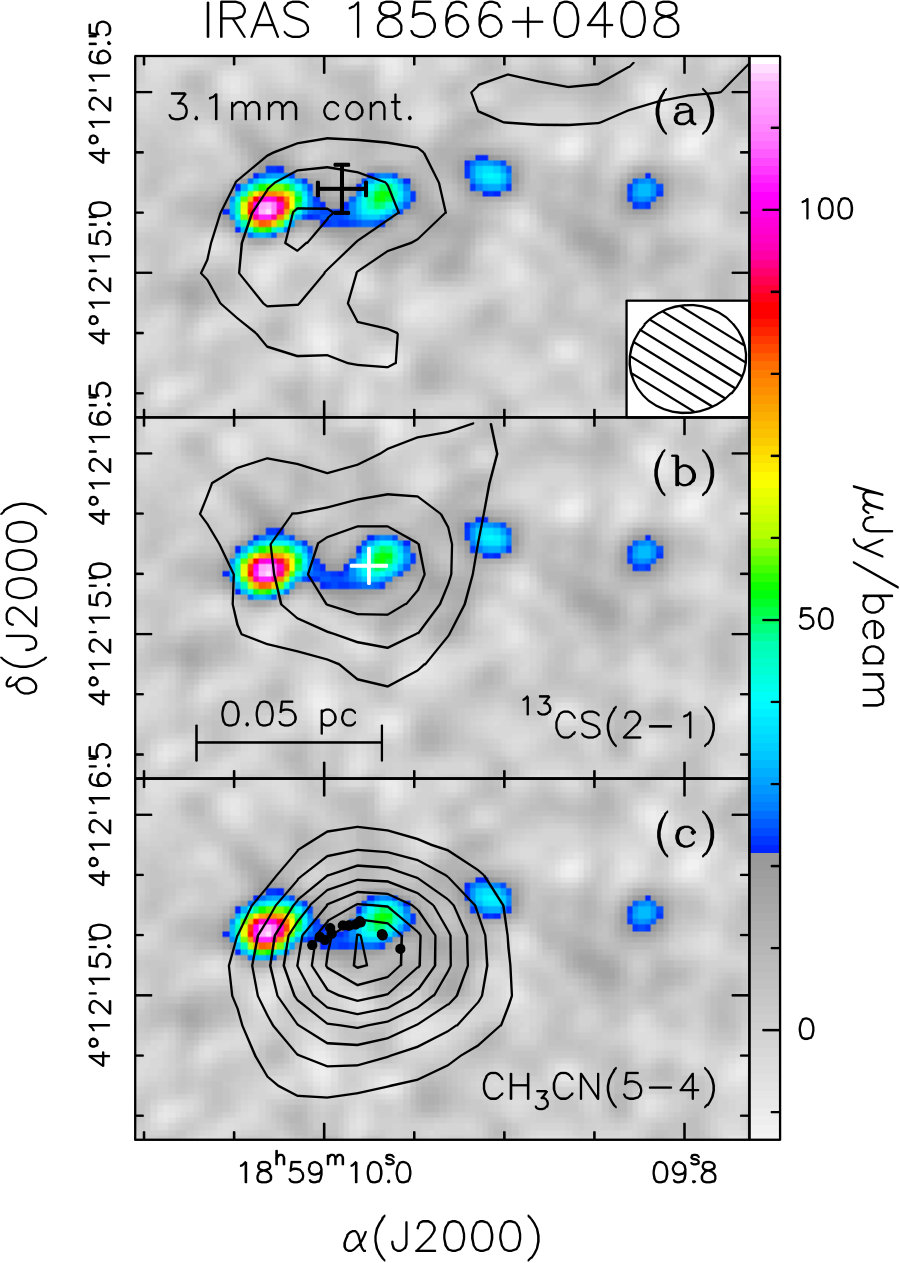 Figure 4
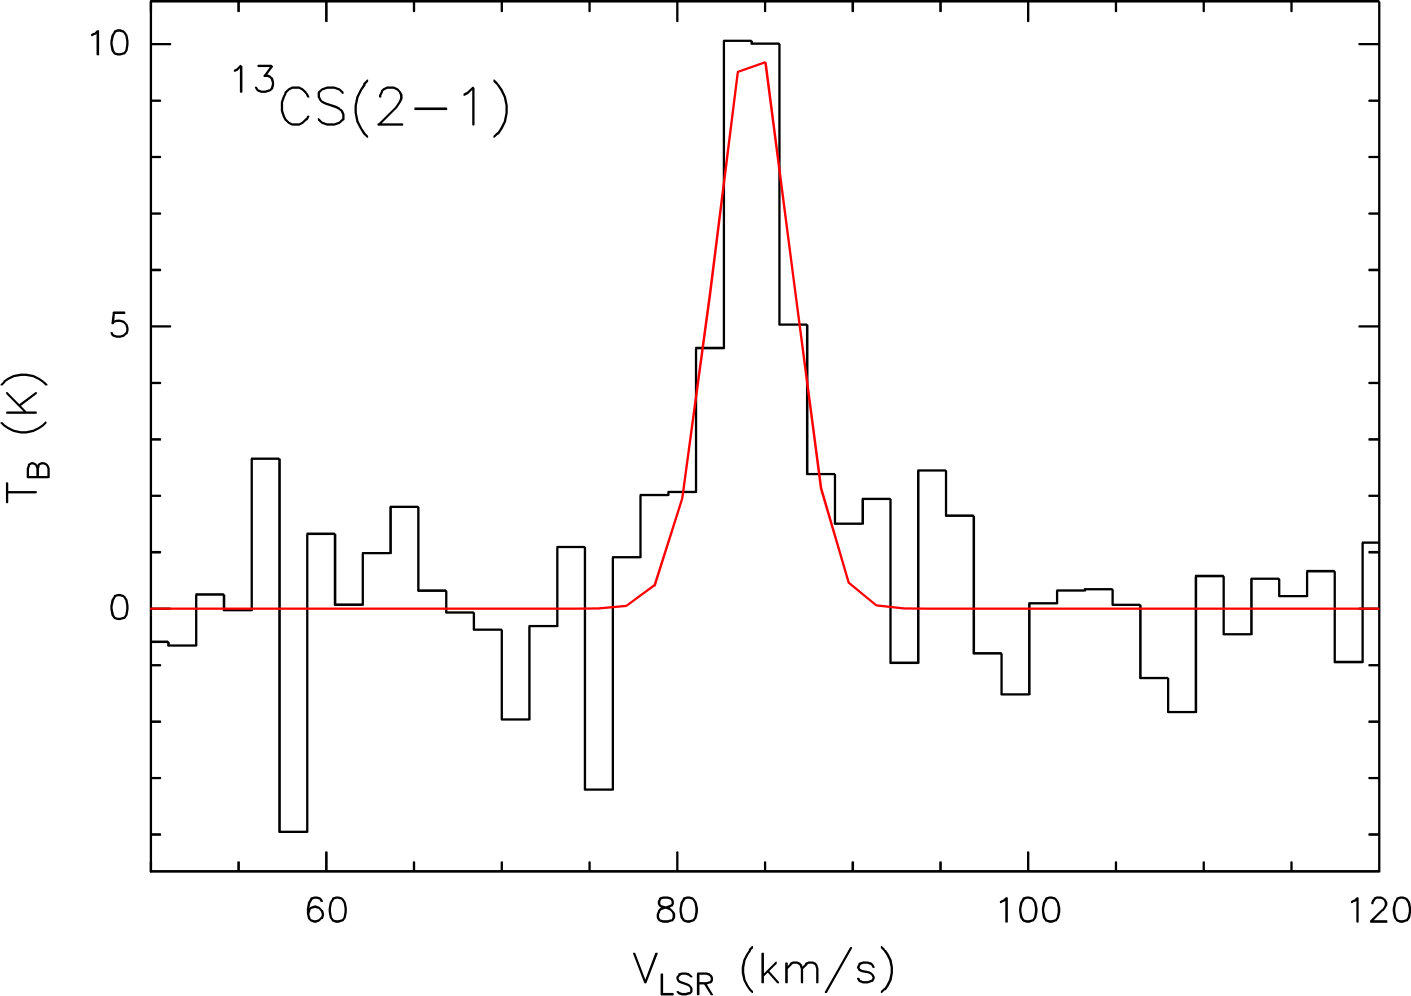 Figure 5
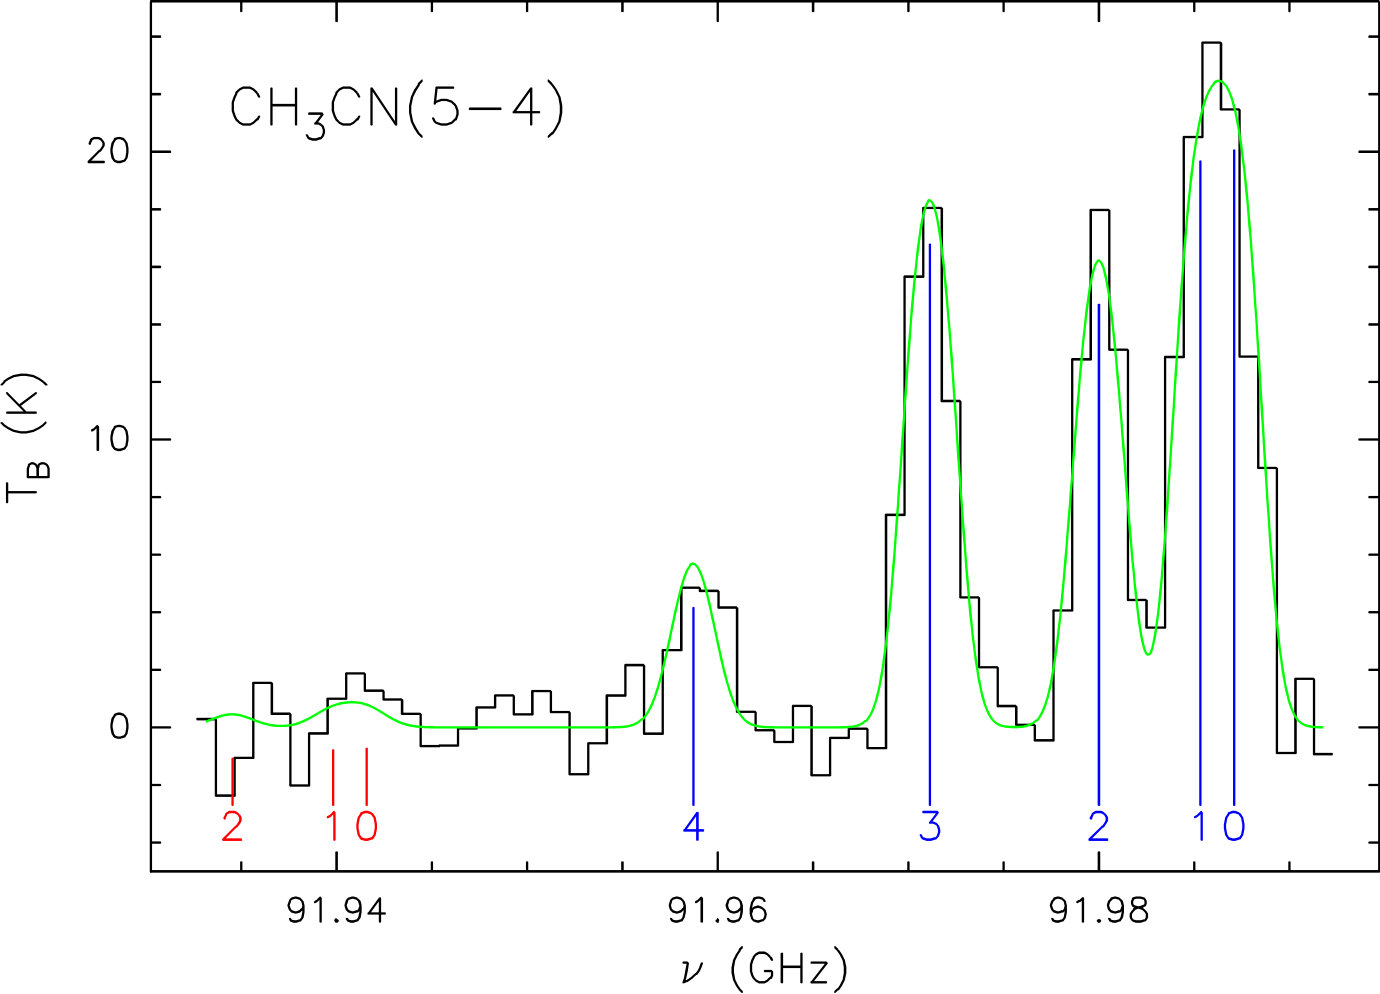 Figure 6
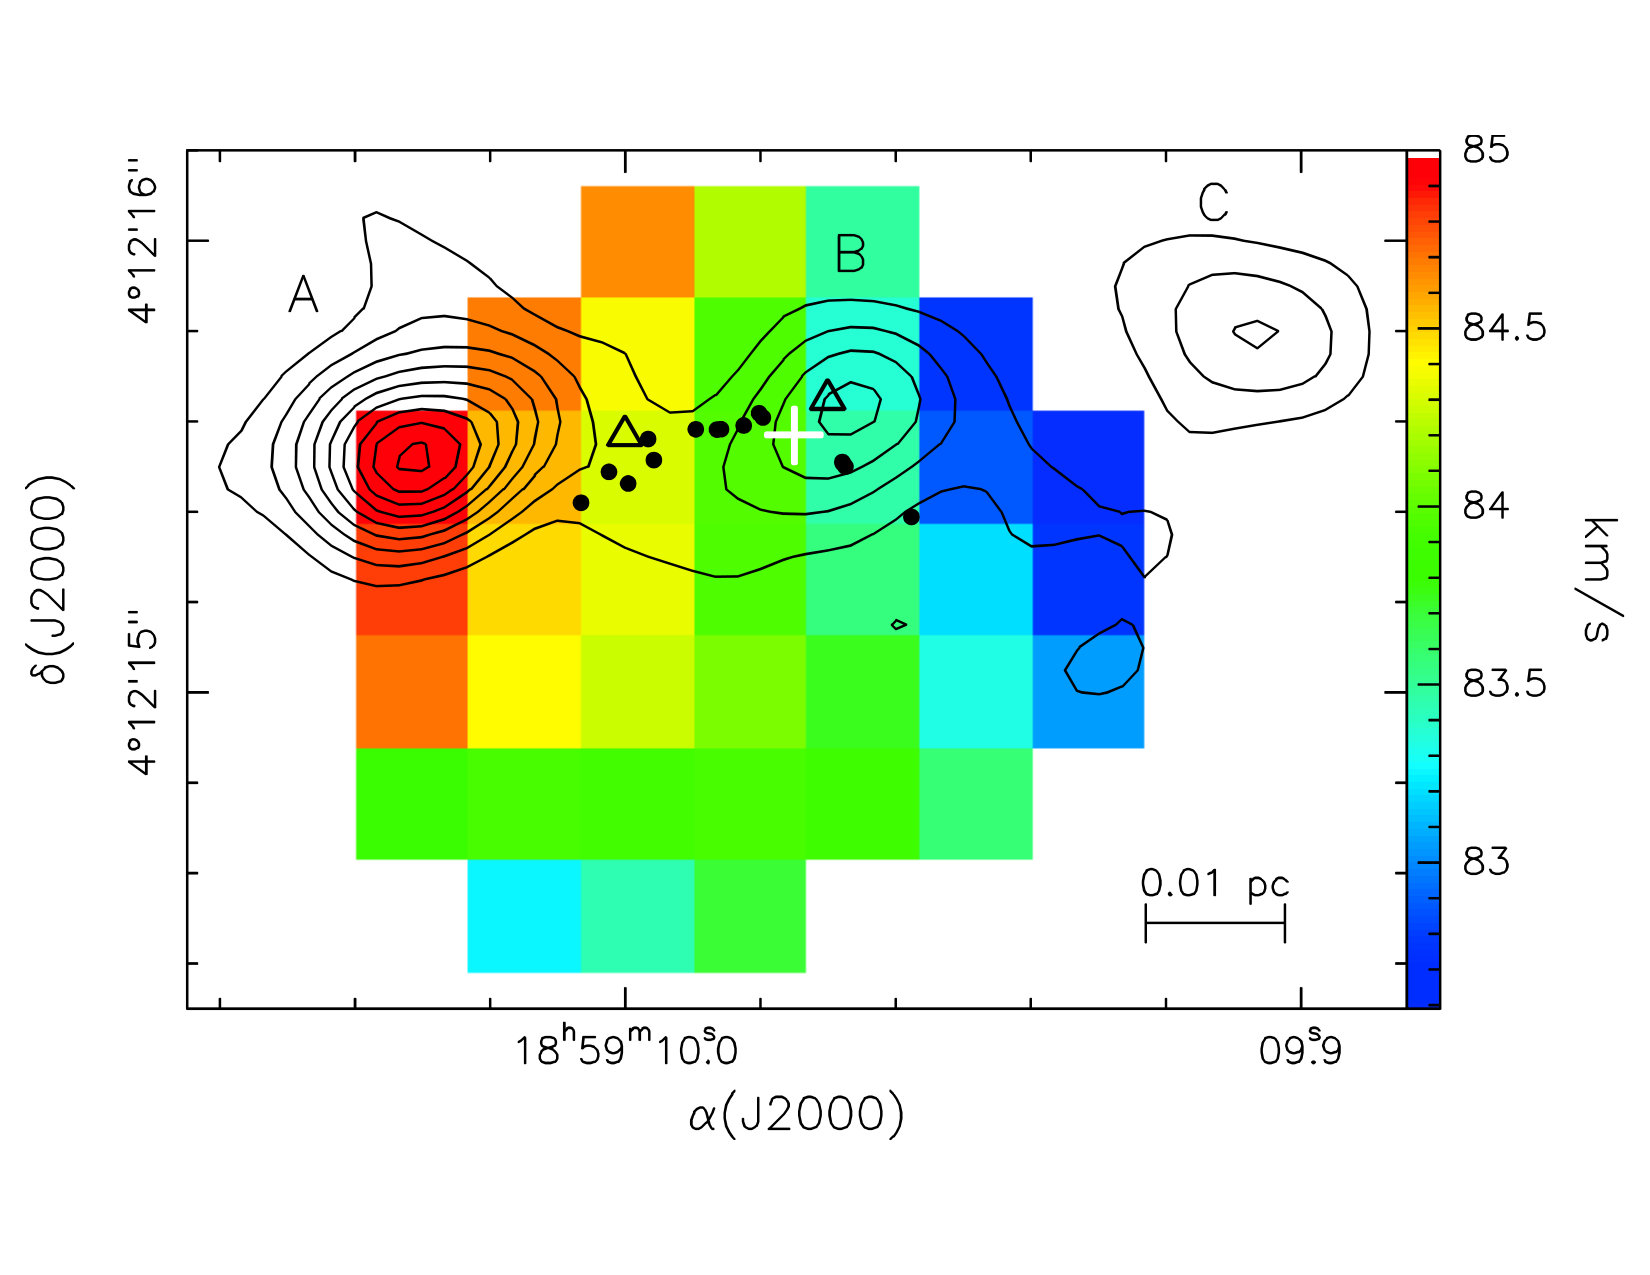 Figure 7
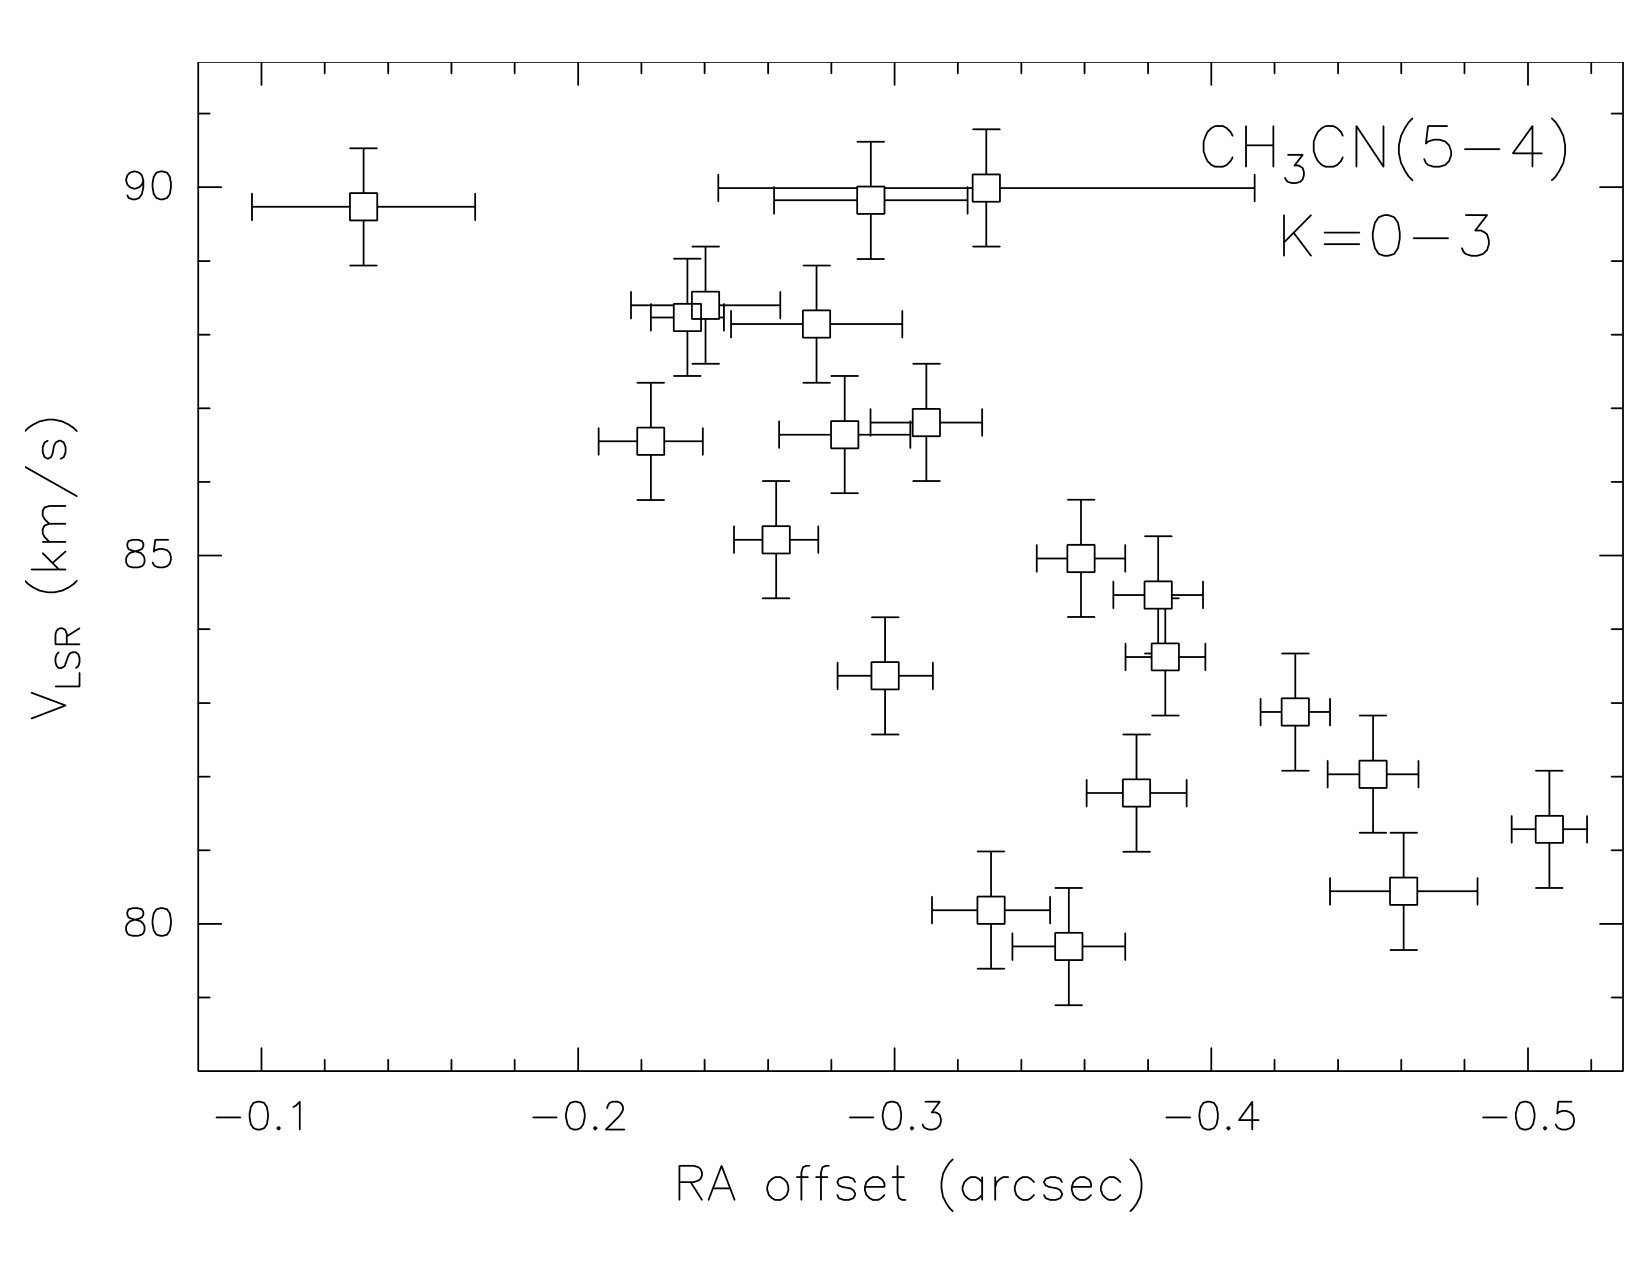 Figure 8
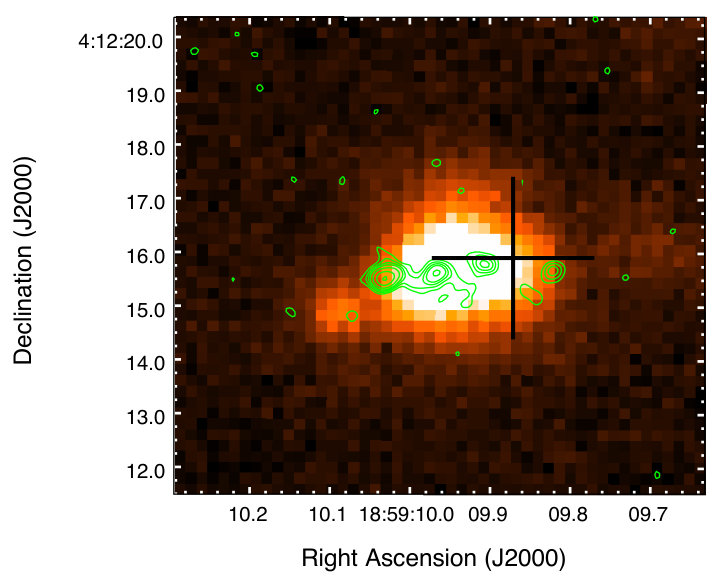 Figure 9
Peer Reviews
No public reviews on file for this paper yet. If you reviewed it on a platform where reviews are public (OpenReview, ICLR, NeurIPS, ICML), you can paste yours below so the community can read it here.
Videos
No videos yet. Explain this paper in a talk, walkthrough, or lecture? Add one.
High Resolution Observations of the Massive Protostar in IRAS 18566+0408
P. Hofner
Adjunct Astronomer at the National Radio Astronomy Observatory, 1003 Lopezville Road, Socorro, NM 87801, USA
Physics Department, New Mexico Tech, 801 Leroy Place, Socorro, NM 87801, USA
R. Cesaroni
INAF, Osservatorio Astrofisico di Arcetri, Largo E. Fermi 5, 50125 Firenze, Italy
S. Kurtz
Instituto de Radioastronomía y Astrofísica, P.O. Box 3-72 Universidad Nacional Autónoma de México, Morelia 58090, Mexico
V. Rosero
Physics Department, New Mexico Tech, 801 Leroy Place, Socorro, NM 87801, USA
National Radio Astronomy Observatory, 1003 Lopezville Road, Socorro, NM 87801, USA
C. Anderson
Physics Department, New Mexico Tech, 801 Leroy Place, Socorro, NM 87801, USA
National Radio Astronomy Observatory, 1003 Lopezville Road, Socorro, NM 87801, USA
R. S. Furuya
Institute of Liberal Arts and Sciences, Tokushima University, 1-1 Minami Jousanjima-machi, Tokushima 770-8502, Japan
E. D. Araya
Physics Department, Western Illinois University, 1 University Circle, Macomb, IL 61455, USA
S. Molinari
INAF-Istituto di Astrofisica e Planetologia Spaziale, via Fosso del Cavaliere 100, 00133 Roma, Italy
Abstract
We report mm continuum, CH3CN(5-4) and 13CS(2-1) line observations with CARMA, in conjunction with and cm continuum VLA data, and and m broadband data from the Subaru Telescope toward the massive proto-star IRAS. The VLA data resolve the ionized jet into 4 components aligned in the E-W direction. Radio components A, C, and D have flat cm SEDs indicative of optically thin emission from ionized gas, and component B has a spectral index , and a decreasing size with frequency . Emission from the CARMA mm continuum, and from the 13CS(2-1), and CH3CN(5-4) spectral lines is compact (i.e. AU), and peaks near the position of VLA cm source, component B. Analysis of these lines indicates hot, and dense molecular gas, typical for HMCs. Our Subaru telescope observations detect a single compact source, coincident with radio component B, demonstrating that most of the energy in IRAS 18566+0408 originates from a region of size AU. We also present UKIRT near-infrared archival data for IRAS 18566+0408 which show extended K-band emission along the jet direction. We detect an E-W velocity shift of about km s*-1* over the HMC in the CH3CN lines possibly tracing the interface of the ionized jet with the surrounding core gas. Our data demonstrate the presence of an ionized jet at the base of the molecular outflow, and support the hypothesis that massive protostars with O-type luminosity form with a mechanism similar to lower mass stars.
ISM, individual objects (IRAS 18566+0408, G37.55+0.20, Mol83) — ISM, jets and outflows — stars, formation
1 Introduction
The study of massive star formation throughout the Galaxy began with radio continuum surveys (e.g. Downes & Rinehart 1966) which detected many compact, thermal sources, later identified as Ultracompact HII (UCHII) regions (e.g. Harris 1973). Observations of these dense, and small ionized regions culminated in several interferometric surveys (e.g. Wood & Churchwell 1989, RMS Survey by Urquhart et al. 2009, CORNISH Survey by Hoare et al. 2012), where hundreds of UCHIIs were imaged at sub-arcsecond resolution. While UCHII regions are manifestations of recently formed massive stars, because of their bright radio continuum emission, it is thought that their central stars are fully formed, and located on, or near the main sequence.
To understand how massive stars form, i.e. how they assemble most of their mass, earlier evolutionary stages must be studied. With this goal, a number of surveys were carried out during the last two decades (e.g. Molinari et al. 1996, Shridharan et al. 2002), selecting massive proto-stellar candidates with the criteria of dense molecular cores with large FIR luminosity, in the absence of strong radio continuum emission. A large number of such objects were catalogued and further studied in a variety of observational probes, such as masers (e.g. Hofner & Churchwell 1996, Kurtz, Hofner & Vargas-Alvarez 2004, Araya et al. 2007a), highly excited molecular lines (e.g. Olmi et al. 1996, Araya et al. 2005, Rosero et al. 2013), as well as low critical density molecular transitions to search for molecular flows (e.g. Zhang et al. 2001, Beuther et al. 2002). One particularly important result of these latter two studies was the extremely high detection rate of molecular flows toward massive protostars, which indicated that outflows are an essential ingredient in the formation of massive stars.
In this paper, we present a multi-wavelength, high angular resolution study of a massive proto-stellar candidate which we have observed in the mm continuum, CH3CN(5-4) and 13CS(2-1) spectral lines with CARMA, and at and m with the Subaru Telescope. These data are discussed in conjunction with 6 and 1.3 cm VLA continuum data (Rosero et al. 2016), as well as archival NIR data.
The high-mass proto-stellar candidate IRAS 18566+0408 (also known as G37.55+0.20, or Mol83) is located at a distance of kpc, and has a reported FIR luminosity of L⊙, equivalent to an O8 ZAMS star (Shridharan et al. 2002). The radio continuum emission at 6, 3.6 and cm was studied by Araya et al. (2007b) at an angular scale of one arcsecond and rms noise levels of Jy/beam. Considering the large luminosity, the cm continuum emission of about 0.7 mJy is much weaker than what is expected from an UCHII region, and is best explained by an optically thin thermal jet oriented in the East-West direction. At mm the emission is stronger and shows an elongation approximately perpendicular to the jet, which was interpreted by Araya et al. (2007b) as a circumstellar torus, possibly containing an accretion disk at smaller scales (see their Figure 4).
IRAS 18566+0408 is associated with maser emission from the H2O, OH, CH3OH, H2CO molecules (Araya et al. 2010, and references therein, Al-Marzouk et al. 2012). Araya et al. (2010) found that the H2CO maser undergoes periodic flares with a period of about 240 days, and the flares are correlated with similar features in the 6.7 GHz CH3OH and 6.035 GHz OH masers (Al-Marzouk et al. 2012). A possible explanation for this behavior is maser gain changes due to the infrared radiation of periodic accretion from a binary within a circumbinary disk (Araya et al. 2010; see van der Walt 2014, Inayoshi et al. 2013 for other possible models).
Zhang et al. (2007) studied IRAS 18566+0408 in several NH3 transitions with the VLA, as well as in the SiO(2-1) and HCN (1-0) transitions with OVRO. They discovered a well collimated molecular flow centered on a compact GHz continuum source, MM-1. The direction of the flow is in the SE-NW direction and approximately in the same direction as the CO-flow measured at resolution by Beuther et al. (2002). Furthermore, a strong increase of line-width was observed at the position of MM1, which Zhang et al. (2007) interpreted either as rotation/infall, or relative motion of unresolved proto-stellar cores.
In the following section we describe our observations, and we present the data in section 3. Section 4 contains a discussion of the obtained results. The paper concludes with a brief summary in Section 5.
2 Observations
2.1 CARMA Observation
Continuum and spectral line observations in the mm window toward the IRAS region were carried out with CARMA (Combined Array for Research in Millimeter-wave Astronomy111Support for CARMA construction was derived from the states of California, Illinois, and Maryland, the James S. McDonnell Foundation, the Gordon and Betty Moore Foundation, the Kenneth T. and Eileen L. Norris Foundation, the University of Chicago, the Associates of the California Institute of Technology, and the National Science Foundation. Ongoing CARMA development and operations are supported by the National Science Foundation under a cooperative agreement, and by the CARMA partner universities.). At the time of observations, CARMA was a 15 element interferometer with nine m antennas and six m antennas. For details of the instrument see the CARMA webpage222http://mmarray.org/.
Data were taken in CARMA’s B configuration with antenna baselines ranging from m to m between January and February 2008. The field of view of our observations, given by the half-power beam width of the m antennas, was 73″, and our maps have a 1″ FWHM synthesized beam. The CARMA correlator recorded signals in three separate bands, each with an upper and lower sideband. Two bands were configured with a MHz bandwidth (km s*-1*) and 63 channels (km s*-1* per channel), and were used to observe the 13CS(2–1) (GHz) and CH3CN(5–4) (GHz for K=3) rotational lines in the lower sideband. One additional band was configured with MHz bandwidth across 63 channels, which was also used to observe the CH3CN (5-4) transition in the lower sideband, with a total velocity coverage of km s*-1* and a channel width of km s*-1*. The corresponding three bands in the upper sideband at a mean frequency of GHz were used to detect the mm continuum emission. Care was taken that the continuum bands were free of any strong line emission.
In each source-calibrator cycle, data were obtained in ten seconds records with 8 minutes spent on IRAS 18566+0408 and 3 minutes on each of two calibrator sources. One of the calibrators (1751+096) was used as the gain and bandpass calibrator for both IRAS 18566+0408, and the second calibrator (1827+062) was used as a test source to verify the quality of the phase transfer and other calibration steps. Radio pointing was done at the beginning of each track and every two hours thereafter. Absolute flux calibration was accomplished using the flux of 1751+096 (1.2 Jy) as determined from monitoring observations during the same time period as our target observations. Based on the repeatability of the quasar fluxes, we estimate that the random error in our source fluxes is 5%, and the systematic error from the planet calibration models is also on that order. We applied a line-length correction to account for changes in the delays of the optical fibers as they heat and cool during the day/night cycle. Calibration and imaging were done using the MIRIAD data reduction package (Sault et al. 1995). The rms noise in the resulting continuum map was 1 mJy beam*-1*, and the rms noise in a channel map of the narrow and wide spectral line data was 12, and 8 mJy beam*-1*, respectively.
2.2 VLA Observations
Observations toward IRAS 18566+0408 were carried out with the Karl G. Jansky Very Large Array (VLA)333The National Radio Astronomy Observatory is a facility of the National Science Foundation operated under cooperative agreement by Associated Universities, Inc. at cm in the B-configuration on March 20, 2011, and at cm in the A-configuration on July 27, 2011, as part of the survey reported by Rosero et al. (2016). For further details on the observations and data reduction we refer the reader to the above paper. The VLA maps used in this work have a synthesized beam of , position angle PA , rms noise of Jy beam*-1* at 6 cm, and , position angle PA , rms noise is Jy beam*-1* at 1.3 cm.
2.3 Subaru Telescope Observations
IRAS 18566+0408 was observed with the COMICS camera on the m Subaru Telescope on 2011 August 26, in the 12 and continuum bands. For more details on these observations and data reduction we refer the reader to Beltrán et al. (2014).
3 Results
3.1 VLA 6 cm and 1.3 cm Continuum Data
We show the VLA continuum maps in Fig. 1, with the cm emission in white contours, overlaid on the cm map in color. The jet previously observed by Araya et al. (2007b) at angular resolutions of is now resolved into 4 and 3 individual components at cm and cm, respectively. These components are labeled with letters A – D from East to West (Rosero et al. 2016). At the angular resolution of the VLA data, corresponding to AU, the sources have a compact core surrounded by low level extended emission. In particular, in both wavelength bands there is an extended structure connecting the two brighter components A and B, which is fairly narrow at cm, but much more extended at cm. The length of the East-West structure is about (AU). Measured peak positions, fluxes and peak intensities for each component are given in Table 4 of Rosero et al. (2016). If the emission is integrated over the entire structure we find that the total flux is consistent with the lower angular resolution measurements of Araya et al. (2007), i.e. our high resolution maps do not miss any flux.
Rosero et al. (2016) show the spectral behavior of the continuum components in their Figure 4. Components A and C have a fairly flat spectrum, which is indicative of an optically thin thermal spectrum, and for component D a limit of is reported. Component B, on the other hand, has a distinctly different behavior. The emission strongly increases at higher frequencies and the fitted spectral index has a value of 1.0, i.e. in between the values of for optically thin, and for optically thick ionized gas.
A more detailed view of the run of the spectral index can be seen in Fig. 2. For this map we have smoothed the combined cm and cm sub-band maps to the same resolution and determined at each pixel. We also overlay on this figure a map of the average CH3CN J = 5–4 K= 0,1 emission in contours and the positions of the GHz CH3OH masers from Araya et al. (2010) as filled circles. From this figure we see that the largest spectral index occurs close to the CH3CN maximum which is also near the symmetry axis defined by the CH3OH masers. The spectral index drops along the East-West jet axis, indicating also a drop in optical depth of the ionized gas.
We have fitted 2-D gaussians to the VLA continuum components A - D using the CASA task imfit. While components A and B are marginally resolved, components C and D are unresolved. Component B appears to be slightly extended in the East-West direction, and we find that the deconvolved source FWHM decreases as as a function of frequency as where . This is shown in Fig. 3. No variation of size as a function of frequency was detected for component A.
3.2 CARMA Data
3.2.1 3 mm Continuum
In Figure 4a we show our mm map in contours overlaid on the cm radio jet in color. We measure a peak intensity of mJy beam*-1*, and a total flux density of mJy. The peak position of the mm emission is at R.A. = , and Decl. = . In Figure 4a we also show the position of the mm peak position from Araya et al. (2007b), which is identical to the position of MM-1 of Zhang et al. (2007). Considering the positional accuracy of these measurements we conclude that the mm emission peaks are consistent. The mm emission in our map is slightly resolved and has a cometary shape pointing toward the East, in the direction of the jet.
Zhang et al. (2007) reported mm observations toward this source with OVRO. Within a beam these authors measure a peak intensity of mJy beam*-1*, and a total flux density of mJy integrated over a source size of about . These data indicate an extended structure which becomes brighter toward the center. Our observations do not have sufficient sensitivity to detect the extended emission and only trace the central core. Using the formulas given in Mezger et al. (1990) with , solar metallicity, and a temperature of K (Zhang et al. 2007), the mm emission in the central synthesized beam corresponds to a total mass of about M⊙. This is consistent with the estimates based on the NH3 observations of Zhang et al. (2007). These authors also reported a secondary peak, MM-2, located to the north-west of MM-1, with a peak brightness of mJy beam*-1* at GHz. This source is not detected in our GHz observations with a limit of mJy beam*-1*.
3.2.2 13CS(2–1)
In Fig. 4b we show the average emission of the 13CS(2–1) line in contours. The mm continuum emission has been subtracted. The maximum of the line emission is located at R.A. = , and Decl. = , very close to the position of the H2CO maser (Araya et al. 2005), which is shown as a white cross. A spectrum taken at the peak pixel is shown in Fig. 5. The line is fitted well by a gaussian with an integrated line flux of K km s*-1*, a velocity of vkm s*-1*, and a line width (FWHM) of km s*-1*.
Using the formulas by Mehringer (1995) which assume optically thin emission under LTE conditions, and using an excitation temperature of K, the integrated line flux at the peak position corresponds to a 13CS column density of cm*-2*. To estimate the H2 column density one needs to know the CS abundance, as well as the 12C/13C isotope ratio. While the latter is fairly well known (we assume a value of 50 here), the CS abundance in hot molecular cores is highly variable due to the active chemistry in these regions. The models of Nomura & Millar (2004) predict values between and for the CS abundance. If we adopt a value of , the hydrogen column density and total mass are consistent with what is derived from the mm emission (see above) and implies values of Ncm*-2*, and ncm*-3* within the central pc.
3.2.3 CH3CN(5-4)
In Fig. 4c we show the average of the CH3CN J = 5–4 K = 0,1 emission from the higher spectral resolution data. The black dots show the position of the CH3OH GHz masers from Araya et al. (2010). The CH3CN J = 5–4 K= 0,1 emission has its peak at a position R.A. = , and Decl. = . In Figure 6 we show a spectrum of the low resolution data taken at the peak position. We have detected all K-components of the J = 5–4 transition, as well as marginal emission of the J = 5–4 K= 0,1 transition of the CHCN isotopologue.
We fitted the expression simultaneously to all detected K-components in the following fashion: First, a gaussian fit was carried out for the K = 0 – 4 components with the line separations fixed to their theoretical values. From this fit we obtained the source velocity vkm s*-1*. Then the expression for the brightness temperature was fit varying the 4 input parameters, beam filling factor , line width FWHM, rotational temperature Trot, and source averaged CH3CN column density . The best physical fit is shown in Figure 6 as a green line. The best fit values are: , km s*-1*, K, cm*-2*. The 1 errors have been estimated using the method of Lampton et al. (1976).
Although the CH3CN emission is only marginally resolved we can check for velocity gradients by fitting the CH3CN(5–4) profiles (from K = 0 to K = 3) pixel by pixel in the map. The result of this procedure is shown in Fig. 7. The typical error on the velocity is km s*-1*. We detect an East-West velocity gradient.
An alternative view of the velocity gradient can be obtained by fitting the peak position in each channel map and plotting the velocities versus the RA-offsets of the corresponding peak positions. This is shown in Fig. 8. A velocity shift of about km s*-1* over a distance of (AU) is detected, with redshifted velocities in the East, and blueshifted velocities in the West.
3.3 Infrared Data
In the Subaru images a single point source is detected at both and m, with fluxes of Jy, and Jy, respectively. Since this was the only source detected in the field of view of the camera, we registered the position of this source with respect to the SPITZER/GLIMPSE m image. The estimated accuracy of the position of the Mid-IR source is . The source is unresolved with the Subaru diffraction limit of at m, which corresponds to a linear size of pc or AU at the distance to IRAS 18566+0408 of kpc.
We also retrieved data from the UKIRT Infrared Deep Sky Survey (UKIDSS) GPS for IRAS 18566+0408. The UKIDSS project is defined in Lawrence et al. (2007). UKIDSS uses the UKIRT Wide Field Camera (WFCAM; Casali et al. 2007). The photometric system is described in Hewett et al. (2006), and the calibration is described in Hodgkin et al. (2009). The pipeline processing and science archive are described in Irwin et al. (2009) and Hambly et al. (2008). The UKIDSS images are three magnitudes deeper and have higher angular resolution () compared to 2MASS data. The astrometric accuracy of the UKIDSS data is about 50 mas.
In Fig. 9 we show an overlay of the UKIDSS K-band (m) image with the VLA cm contours. The position of the Mid-IR source is also shown. In the infrared K-band there is a bright source coincident with the ionized jet. It is not detected at the infrared H or J band, which suggests that it is deeply embedded. The source is very extended with respect to the UKIDSS resolution and hence the most likely explanation for the K-band emission is scattered light.
We have also revisited the question of the total luminosity of IRAS 18566+0408. For this we collected all available flux density measurements in the literature and plotted the spectral energy distribution in Fig. 10. We obtain a value for the total luminosity of this source of L⊙ confirming the results of Zhang et al. (2007). Inspecting the available maps in the wavelength bands between m (SPITZER MIPSGAL) and m (Herschel Hi-GAL) we found that the emission is compact and centered on the position of the massive protostellar candidate. Furthermore, there are no additional mid-IR sources within 10*′′* from the central source, demonstrating that the compact mid-IR source dominates the energetics of the region.
4 Discussion
4.1 The Nature of the cm Continuum Emission
Our VLA data show a linear structure oriented East-West of length approximately pc which consists of weak extended emission and 4 compact components. One might ask whether these sources could be explained as individual UCHII regions, and although we favor an ionized jet explanation, we will briefly comment on this hypothesis. First, calculating the required spectral types from the measured fluxes, assuming optically thin conditions, we obtain ZAMS spectral types of B2 for components A and B, and B3 for components C and D. The total luminosity of 4 such stars would be below L⊙, whereas the measured luminosity of IRAS 18566+0408 is L⊙, thus, the regions appear highly under-luminous. However, while absorption of UV photons by dust within the ionized gas could in principle explain this discrepancy (e.g. Wood & Churchwell 1989), in this case one would expect a closer morphological correspondence in the mid-IR. As mentioned above, components A, C, and D have flat spectral indices, indicating optically thin emission, and the data are consistent with emission measures pc cm*-6* and electron densities of cm*-3*, as one would expect for small ionized regions around B2–3 type stars. For component B the spectral index of 1.0 could be explained with a constant density HII region where the optical depth is approximately unity, i.e. between optically thick and thin emission. With this assumption we obtain an emission measure of pc cm*-6*, and a lower limit on the electron density of cm*-3*, similar to values often derived for UCHII regions (e.g. Kurtz, Churchwell & Wood 1994). We have also calculated sizes for the hypothetical HII regions assuming that they are initial Strömgren spheres, or ionized gas clouds in pressure equilibrium with the surrounding gas using the theory of Xie et al. (1996), and the data of Zhang et al. (2007). In all cases the sources are predicted to be smaller than our resolution, in agreement with our observations. In summary then, our VLA data do not completely rule out that the 4 continuum sources are individual HII regions. However, due to the association with outflowing molecular gas (Beuther et al. 2002, Zhang 2007), as well as shocked gas seen as Spitzer green-band excess (Araya et al. 2007b) in approximately the same direction, we consider an ionized jet a more likely explanation. Our result that component B shows a decreasing size with frequency (Fig. 4) is also an expected feature of varying electron density in the source (e.g. Panagia & Felli 1975, Reynolds 1986), and hence supportive of the ionized jet assumption. We will hence adopt this hypothesis for the rest of this paper.
There are several models that can be used to calculate the expected flux from ionized jets. The work of Reynolds (1986) predicts the cm emission from partly ionized collimated winds without specifying the source of ionization, and the work of Curiel et al. (1987, 1989) discusses the case of cm emission from an ionized plasma where a neutral wind shocks molecular matter surrounding the proto-star. Most researchers have favored the model of Curiel et al. (1989) to explain observed jet sources (e.g. Hofner et al. 2007, Johnston et al. 2013). Both models depend on many physical parameters which are generally not known, but adopting a number of assumptions we can obtain estimates for the mass loss () and momentum rate () for the jets. Thus, adopting the usual set of assumptions (e.g. Rosero et al. 2014), we can apply equation (19) of Reynolds (1986) to our radio component B, to estimate a mass loss rate of Myr*-1*, and a momentum rate of Myrkm s*-1*. It is interesting to note that Beuther et al. (2002) obtain a similar number for , based on their IRAM 30m CO(2–1) maps, which would indicate sufficient force in the jet to drive the larger scale molecular flow.
For the case of shock ionization, Anglada et al. (1992) has shown that for low-mass objects the relation between momentum rate and cm luminosity follows a powerlaw described by (where is in units of yrkm s*-1*, and in units of mJy kpc2), and Rodriguez et al. (2008) have shown that three high luminosity objects with ionized jets also follow this relationship. For component B at GHz we have a cm luminosity of mJy kpc2, which results in a predicted momentum rate of Myrkm s*-1*, i.e. virtually identical to the value measured by Beuther et al. (2002), and what is implied by the formula of Reynolds (1986). We hence add an additional data point to the vs relation, which further strengthens the hypothesis that the ionized jets observed from massive young objects are operating with the same physical mechanism as those from low mass stars.
4.2 The Nature of the CH3CN Velocity Gradient
The molecular line data observed with CARMA allow an interesting view on the kinematics in the IRAS 18566+0408 core. Zhang et al. (2007) detected an increase of FWHM in the NH3 lines from km s*-1* at an angular resolution of , to km s*-1* at an angular resolution of . They discuss this increase of linewidth in terms of outflow, infall, rotation or relative motion of multiple objects in the synthesized beam. These authors also mapped a collimated flow in the SiO(2-1) line centered on the mm peak position which is oriented in the SE–NW direction, with blue-shifted emission extended mostly toward the NW, and a smaller emission region at red-shifted velocities toward the SE. A similarly oriented flow was also observed by Beuther et al. (2002) in the CO(2–1) line with the IRAM 30m telescope.
We have detected a change of velocity in the CH3CN lines along the jet of about km s*-1* along the East-West direction. This confirms the broadening of the spectral lines toward smaller scales observed by Zhang et al. (2007). The alignment of the velocity gradient with the ionized jet strongly suggests that the gas traced by the CH3CN(5–4) line represents outflowing matter at the base of the flow. We note that the CH3OH and H2O masers are also distributed along an East-West direction, with a velocity gradient consistent with that of CH3CN. Since the CH3CN emission is only marginally resolved at an angular scale of , and our fitting technique is essentially sub-resolution, the outflowing gas is mostly arising from distances AU from the massive protostar. Our line fitting results indicate a low beam filling factor of , suggesting that most of the emission occurs on scales of . We have derived temperatures and column densities of K, and cm*-2*. We compare these values with the results which were recently reported by Hernández-Hernández et al. (2014) based on lower resolution SMA CH3CN(12-11) data of this region. These authors used a two component model consisting of a lower density cooler region, plus a compact higher density and hotter region to fit their spatially unresolved spectrum. Due to the relatively large error in our temperature determination, our value for the temperature is consistent with either of these components. Our relatively high column density is also consistent with what Hernández-Hernández et al. (2014) derive from fitting their compact component if we account for the difference in assumed size for the emitting region. As discussed in Comito et al. (2005), the fits to the spectrum are generally not unique, hence we caution the reader that the size of the emitting region remains uncertain. Higher angular resolution observations which fully resolve the CH3CN emission will be necessary to clarify this point.
Adopting then for the remainder of this discussion the physical values derived in our analysis, we can ask what is the likely astrophysical scenario responsible for the CH3CN emission. The detected E – W velocity gradient, and the spatial coincidence with the jet, suggests that the CH3CN emission traces an outflow associated with the ionized jet very near the central protostar. As discussed above, the momentum rate of the ionized jet appears sufficient to drive the large scale molecular flow. One possible interpretation of the velocity gradient of the CH3CN lines is that we have detected the high pressure neutral gas adjacent to the jet, i.e. the region where the jet imparts momentum and accelerates the molecular gas. Two physical mechanisms for momentum transport have been discussed in the literature: the formation of a turbulent mixing layer via the Kelvin-Helmholtz instability, or alternatively via bow shocks (e.g. Chernin et al. 1994, Cantó & Raga 1991). Most jets from young stellar objects are highly supersonic (e.g. Guzmán et al. 2016) and in this case momentum transfer via bow shocks is predicted to dominate (Chernin et al. 1994). Since the IRAS 18566+0408 jet appears to lie very close to the plane of the sky, the detected velocity shift along the jet axis of about km s*-1* indicates that the 3D space velocities are much higher, and also highly supersonic. We note that while emission in the CH3CN lines has often been assigned to a rotating disk perpendicular to the outflowing gas (e.g. Cesaroni et al. 2014), CH3CN emission has been also reported as tracer of outflows (Leurini et al. 2011 in IRAS 17233-3606, Palau et al. 2017 in IRAS 20126+4104), and of bow shocks (Codella et al. 2009 for L1157-B1).
Our data allow us to compare the thermal pressure of the ionized jet near its base with the thermal pressure of the surrounding molecular gas, to investigate whether the molecular gas will inhibit the sideways expansion of the jet and contribute to its collimation. The ionized gas has a lower limit on the electron density of cm*-3* (see above) and assuming an electron temperature of K we have P/kK cm*-3* (where k is the Boltzmann constant). To estimate the pressure in the surrounding molecular gas we need to assume an abundance for CH3CN relative to H2, which can vary between and in chemically active Hot Core regions (e.g. Nomura & Millar 2004, Calcutt et al. 2014). Using a common assumption for the abundance ratio of and a temperature of K, the resulting thermal pressure is P/kK cm*-3*, which is an order of magnitude lower than the limit on the thermal pressure in the jet. It is thus likely that the neutral gas will not inhibit sideways expansion of the jet material, and a different collimation mechanism is needed.
4.3 Comparison with IRAS 16562-3959
Finally, it is interesting to compare IRAS 18566+0408 with a source which, while located at a much closer distance of kpc, appears strikingly similar, namely the jet source IRAS 16562-3959. While many studies of protostars with bolometric luminosities corresponding to early B-type stars exist, these two sources are rare examples of massive protostars with an O-type luminosity. Both sources have a linear string of radio sources which are best interpreted as ionized gas due to shocks from fast jets. IRAS 16562-3959 shows radio lobes at distances out to 0.4 pc from the central object, and both sources have inner radio lobes at distances of order AU. In the case of IRAS 16562-3959 proper motion of the radio lobes with approximately km s*-1* was recently measured by Guzmán et al. (2016), proving without doubt their jet origin. For both sources the radio spectra for the lobes are flat whereas the central object has a rising spectral index of about 1. Also, for both sources, the central source shows a decreasing size with frequency, which is suggestive of an ionized jet. However, based on RRL data, Guzmán et al. (2014) model the radio emission from the central source in IRAS 16562-3959 as an HCHII region with a slow ionized wind. Clearly, both sources are very rare examples of massive protostars that are still in an accretion phase during their formation. One might speculate that IRAS 18566+0408 is perhaps in a somewhat earlier evolutionary state due to its more compact nature, high level of maser emission, and due to the presence of high pressure molecular gas at the base of the jet. The presence of jets in both sources strongly supports the hypothesis that the disk accretion model also applies to massive protostars with O-type luminosity.
5 Summary
In this paper we presented high angular resolution observation at cm, mm, and mid-IR wavelengths toward the massive protostellar candidate IRAS 18566+0408. The main results are as follows:
-
Our VLA data in the 6 and cm wavelength band resolve the ionized jet into 4 components. These are aligned in the E-W direction consistent with other outflow tracers in this source. Radio components A, C, and D have flat cm SEDs indicative of optically thin emission from ionized gas, and component B has a spectral index , and shows a decreasing size with frequency with as expected from an ionized jet.
-
We have detected compact (i.e. AU) emission in the mm continuum, and in the 13CS(2-1), and CH3CN(5-4) spectral lines, which peak near the position of continuum component B. Physical analysis of these lines indicates hot, and dense molecular gas with values typical for HMCs.
-
Our Subaru telescope observations detect a single compact source at and which is coincident with radio component B. This demonstrates that most of the luminosity in IRAS 18566+0408 originates from a region of size AU.
-
We also present UKIRT near-infrared archival data for IRAS 18566+0408. The source is only detected at the infrared K-band, and the extended nature of the emission elongated along the jet direction, most likely indicates scattered light.
-
We detect an E-W velocity shift of about km s*-1* over the HMC in the CH3CN lines. It is possible that the dense and hot molecular gas traces the interface of the ionized jet with the surrounding molecular core gas. If the CH3CN abundance is assumed to have the typical HMC value of , the thermal pressure in the ionized jet exceeds the thermal pressure in the molecular gas, and the sideways expansion of the ionized gas is not sufficiently inhibited, hence an additional collimation mechanism may be needed.
PH acknowledges support from NSF grant AST-0908901 for this work. Support for this work was provided by the NSF through the Grote Reber Fellowship Program administered by Associated Universities, Inc./National Radio Astronomy Observatory (CA and VR). We thank S. Schnee for help with CARMA data reduction. Some of the data reported here were obtained as part of the UKIRT Service Program. The United Kingdom Infrared Telescope is operated by the Joint Astronomy Centre on behalf of the UK Particle Physics and Astronomy Research Council. We thank H. Beuther for providing accurate H2O maser positions. Further thanks are due to the anonymous referee, whose comments improved this manuscript.
The reference list from the paper itself. Each links out to its DOI / PubMed record.
- 1Al-Marzouk et al. (2012) Al-Marzouk, A.A., Araya, E., Hofner, P., et al., 2012, Ap J, 750, 170
- 2Anglada et al. (1992) Anglada, G., Rodriguez, L.F., Canto, J., Estalella, R. & Torrellles, J.M. 1992, Ap J, 395, 494
- 3Araya et al. (2007 a) Araya, E., Hofner, P., Goss, W.M., et al., 2007 a, Ap JS, 170, 152
- 4Araya et al. (2005 a) Araya, E., Hofner, P., Kurtz, S., Bronfman, L., & De Deo, S. 2005 a, Ap JS, 157, 279
- 5Araya et al. (2007 b) Araya, E., Hofner, P., Sewilo, M., et al., 2007 b, Ap J, 669, 1050
- 6Araya et al. (2005 b) Araya, E., Hofner, P., Kurtz, S., et al. 2005 b, Ap J, 618, 339
- 7Araya et al. (2010) Araya, E., Hofner, P., Goss, W.M., et al., 2010, Ap J, 717, L 133
- 8Beltran et al. (2014) Beltrán, M.T., Sánchez-Monge, Á., Cesaroni, R., et al., 2014, A&A, 571, 52