Are we seeing accretion flows in a 250kpc-sized Ly-alpha halo at z=3?
J. Vernet (1), M. D. Lehnert (2), C. De Breuck (1), M. Villar-Martin, (3), D. Wylezalek (4), T. Falkendal (1,2), G. Drouart (5), S. Kolwa (1), A., Humphrey (6), B. P. Venemans (7), F. Boulanger (8,9) ((1) ESO, (2) IAP, (3), Centro de Astrobiologia, (4) Johns Hopkins University

TL;DR
This study uses deep MUSE observations to reveal a vast Ly-alpha halo around a z=3.12 radio galaxy, showing arc-like structures and filamentary gas flows that may indicate accretion shocks and gas inflows into the halo.
Contribution
First detailed analysis of a 250 kpc Ly-alpha halo at z=3, linking observed structures to accretion shocks and gas inflows, supported by comparison with simulations.
Findings
Ly-alpha emission extends to ~250 kpc from the AGN.
Arc-like structures are observed at 150-250 kpc, possibly indicating accretion shocks.
Filamentary structures suggest gas inflows into the halo.
Abstract
Using MUSE on the ESO-VLT, we obtained a 4 hour exposure of the z=3.12 radio galaxy MRC0316-257. We detect features down to ~10^-19 erg/s/cm^2/arcsec^2 with the highest surface brightness regions reaching more than a factor of 100 higher. We find Ly-alpha emission out to ~250 kpc in projection from the active galactic nucleus (AGN). The emission shows arc-like morphologies arising at 150-250 kpc from the nucleus in projection with the connected filamentary structures reaching down into the circum-nuclear region. The most distant arc is offset by 700 km/s relative to circum-nuclear HeII 1640 emission, which we assume to be at the systemic velocity. As we probe emission closer to the nucleus, the filamentary emission narrows in projection on the sky, the relative velocity decreases to ~250 km/s, and line full-width at half maximum range from 300-700 km/s. From UV line ratios, the emission…
Click any figure to enlarge with its caption.
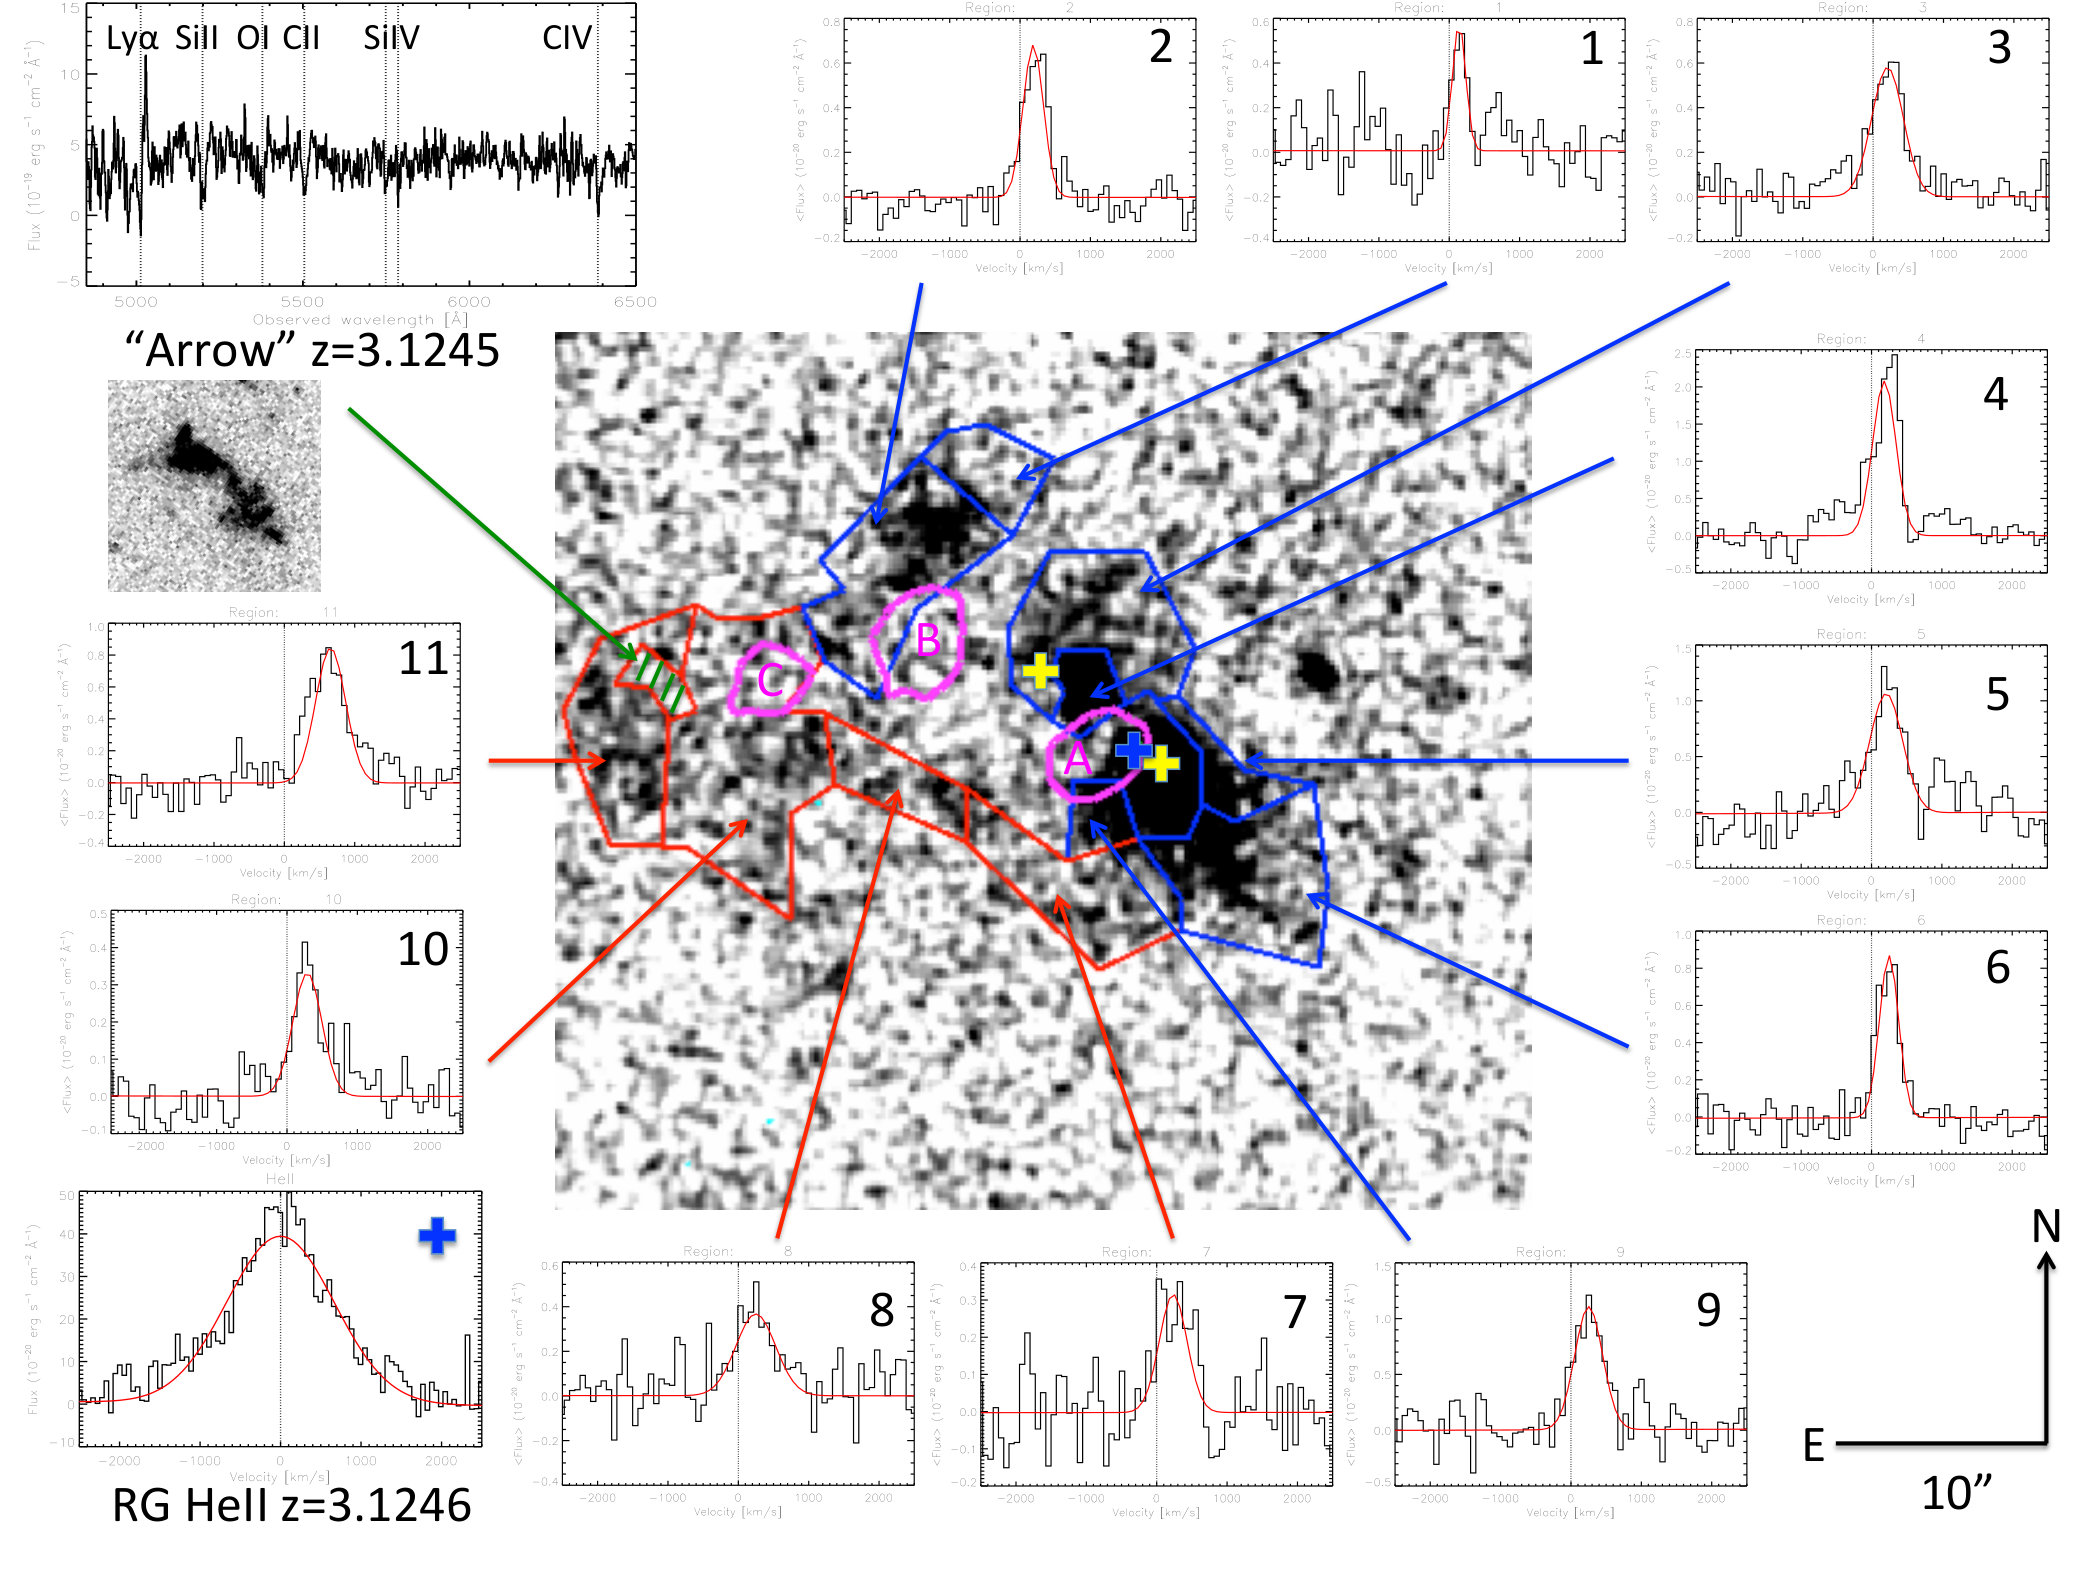 Figure 1
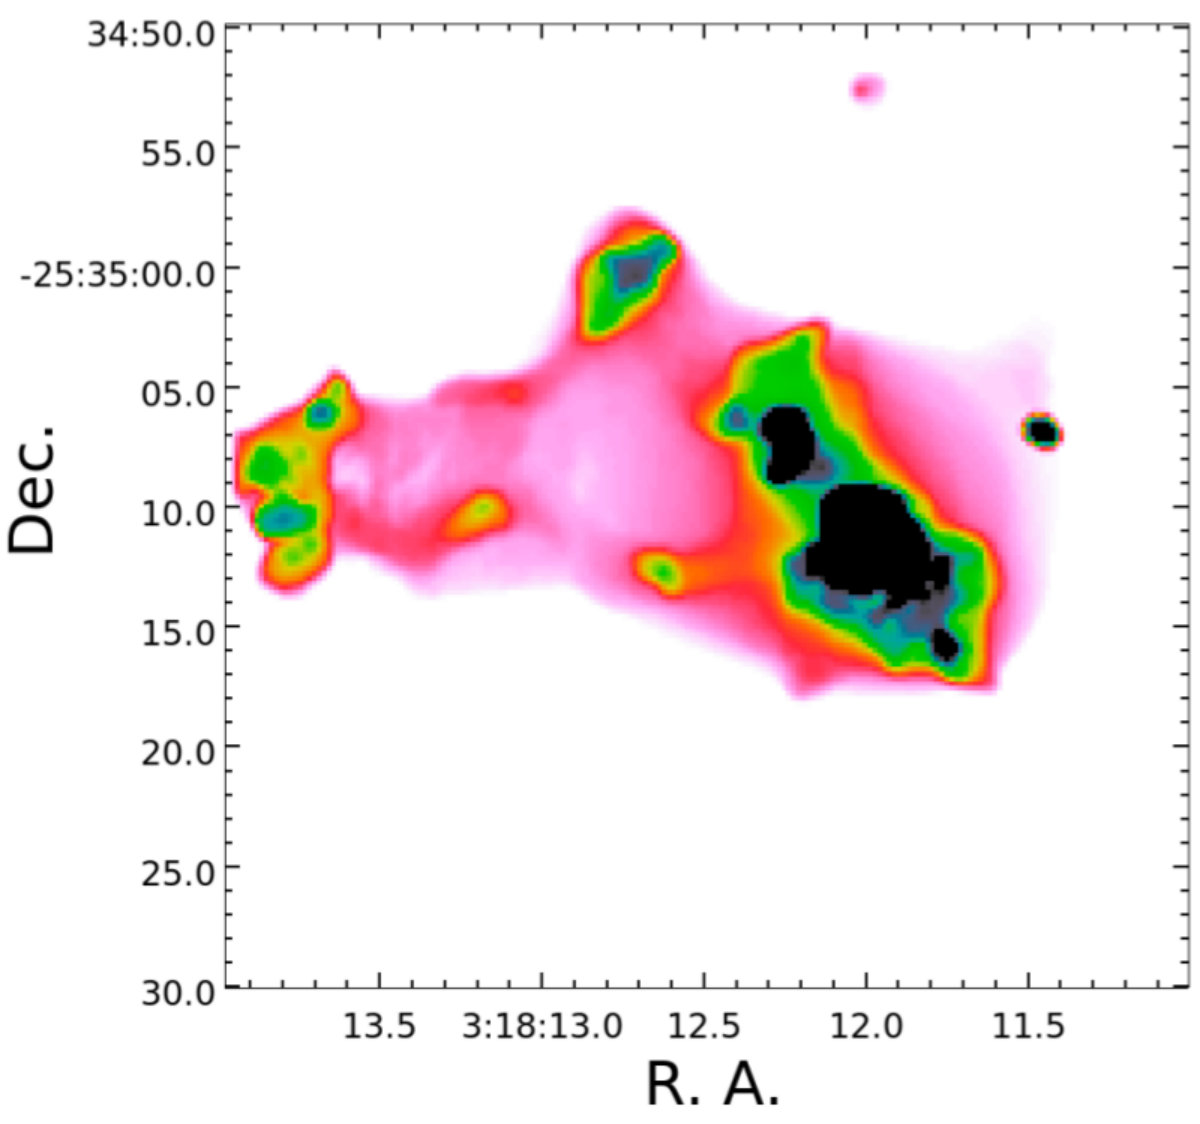 Figure 2
| Id | SB 10-19 | V | FWHM | Area |
|---|---|---|---|---|
| erg s-1 cm-2 arcsec-2 | km s-1 | km s-1 | arcsec2 | |
| 1 | 1.30.2 | 14213 | 25032 | 14.3 |
| 2 | 1.60.1 | 2209 | 43021 | 46.5 |
| 3 | 1.40.1 | 21112 | 55029 | 40.5 |
| 4 | 5.50.2 | 2245 | 41013 | 9.3 |
| 5 | 2.80.1 | 22511 | 55026 | 11.4 |
| 6 | 2.10.1 | 2306 | 39516 | 43.4 |
| 7 | 0.80.1 | 22725 | 52562 | 35.0 |
| 8 | 0.90.1 | 22628 | 67070 | 17.2 |
| 9 | 2.60.2 | 25014 | 51032 | 8.5 |
| 10 | 0.80.1 | 29013 | 51032 | 74.0 |
| 11 | 1.90.1 | 61011 | 72027 | 36.6 |
Peer Reviews
No public reviews on file for this paper yet. If you reviewed it on a platform where reviews are public (OpenReview, ICLR, NeurIPS, ICML), you can paste yours below so the community can read it here.
Videos
No videos yet. Explain this paper in a talk, walkthrough, or lecture? Add one.
11institutetext: European Southern Observatory, Karl-Schwarzschild-Str. 2, D-85748 Garching 11email: [email protected] 22institutetext: Sorbonne Universités, UPMC, Paris VI, CNRS UMR 7095, Institut d’Astrophysique de Paris, 98bis bvd Arago, 75014, Paris, France 33institutetext: Centro de Astrobiologìa (INTA-CSIC), Carretera de Ajalvir, km 4, 28850 Torrejòn de Ardoz, Madrid, Spain 44institutetext: Department of Physics and Astronomy, Johns Hopkins University, 3400 N. Charles St, Baltimore, MD, 21218, USA 55institutetext: International Centre for Radio Astronomy Research, Curtin University, Perth WA 6845, Australia 66institutetext: Instituto de Astrofísica e Ciências do Espaço, Universidade do Porto, CAUP, Rua das Estrelas, P-4150-762 Porto, Portugal 77institutetext: Max-Planck Institute for Astronomy, Königstuhl 17, 69117 Heidelberg, Germany 88institutetext: Institut d’Astrophysique Spatiale, 91405 Orsay, Université Paris Sud et CNRS, France 99institutetext: Research associate at Institut d’Astrophysique de Paris
Are we seeing accretion flows in a 250kpc-sized Ly
halo at z=3?††thanks: Based on observations made with ESO Telescopes at the La Silla Paranal Observatory under program ID 094.B-0699(A)
J. Vernet 11
M. D. Lehnert 22
C. De Breuck 11
M. Villar-Martín 33
D. Wylezalek 44
T. Falkendal 1122
G. Drouart 55
S. Kolwa 11
A. Humphrey 66
B. P. Venemans 77
F. Boulanger 8899
Using MUSE on the ESO-VLT, we obtained a 4 hour exposure of the z=3.12 radio galaxy MRC 0316-257. We detect features down to 10*-19* erg s*-1* cm*-2* arcsec*-2* with the highest surface brightness regions reaching more than a factor of 100 higher. We find Ly emission out to 250 kpc in projection from the active galactic nucleus (AGN). The emission shows arc-like morphologies arising at 150-250 kpc from the nucleus in projection with the connected filamentary structures reaching down into the circum-nuclear region. The most distant arc is offset by 700 km s*-1* relative to circum-nuclear HeII1640 emission, which we assume to be at the systemic velocity. As we probe emission closer to the nucleus, the filamentary emission narrows in projection on the sky, the relative velocity decreases to 250 km s*-1*, and line full-width at half maximum range from 300-700 km s*-1*. From UV line ratios, the emission on scales of 10s of kpc from the nucleus along a wide angle in the direction of the radio jets is clearly excited by the radio jets and ionizing radiation of the AGN. Assuming ionization equilibrium, the more extended emission outside of the axis of the jet direction would require 100% or more illumination to explain the observed surface brightness. High speed (300 km s*-1*) shocks into rare gas would provide sufficiently high surface brightness. We discuss the possibility that the arcs of Ly emission represent accretion shocks and the filamentary emission represent gas flows into the halo, and compare our results with gas accretion simulations.
Key Words.:
Galaxies: evolution – Galaxies: high redshift – Galaxies: active – Galaxies: ISM – Galaxies: halos
1 Introduction
High-redshift radio galaxies, quasars (Heckman et al., 1991a, b), QSOs (Christensen et al., 2006), and “Ly blobs” (Steidel et al., 2000) exhibit large, extended Ly emission. High-redshift radio galaxies play a central role in our evolving understanding of the association between massive galaxies, their clustered environments, and halo gas. In fact, the first galaxies at high redshift, z2, where halo gas was detected in Ly emission over scales of 10-100s kpc, were radio galaxies (Chambers et al., 1990). These Ly halos are generally aligned with the radio jets but extend well beyond the radio lobes (Villar-Martín et al., 2003). It is not clear what the association is between the active galactic nuclei (AGN) and the extended Ly emission. In the circum-galactic environment within the radius subtended by the radio lobes, the Ly kinematics are complex, while outside the radio emission, the gas is relatively quiescent (Villar-Martín et al., 2003).
The energy sources of Ly nebulae are not well-constrained (Cantalupo, 2016). All processes that excite the Ly emission depend on the distribution of the emission line gas, the type of objects within the nebula, and how far the emission is from sources of ionizing photons. While ionizing photons from galaxies embedded within the Ly emission is plausible (Overzier et al., 2013), other sources powering the Ly emission include ionization by the meta-galactic flux, mechanical heating, dissipation of potential energy as the gas falls into the halo, and resonance scattering of Ly and UV continuum photons. The mechanisms powering the emission are inextricably linked with the origin of the gas. If the emission is related to outflows, the excitation of the gas might be due to shocks and ionization by stars or AGN (Swinbank et al., 2015). If the gas extends 100 kpc, it may be accreting from the cosmic web or gas instabilities in the halo (Maller & Bullock, 2004). In that case, we expect the emission to be due to mechanical heating associated with accretion shocks (Birnboim & Dekel, 2003) or from dissipation of potential energy the flows gain as they fall into the potential.
While these general arguments motivated us to obtain deep integral-field spectroscopy of radio galaxies using MUSE on the ESO-VLT, in the specific case of MRC 0316-257, we are motivated by its striking Ly morphology. MRC 0316-257 is well-studied, massive 21011 M*⊙, radio galaxy (De Breuck et al., 2010), which lies in a galaxy over-density (Kuiper et al., 2012). The Ly emission around MRC 0316-257 is filamentary on scales of 250 kpc and has a morphology and surface brightness distribution similar to those seen in galaxy simulations. Simulations of gas accretion imply that streams will be visible via their Ly emission if we detect down to a surface brightness of 10-19* erg s*-1* cm*-2* arcsec*-2* at z3 (Rosdahl & Blaizot, 2012). It is not clear if these simulations are capturing all the physics necessary to model the emission and evolution of the accreting gas (e.g., Cornuault et al., 2016). Observational constraints are needed. Of course, one must worry about expectation bias (Jeng, 2006). Do we call what we observe a “stream” because its morphology agrees with the results of simulations? While we are concerned about this bias, we think it is still instructive to compare our results with those of simulations.
2 Observations, analysis, and results
Multi Unit Spectroscopic Explorer (MUSE; Bacon et al., 2010) observations of MRC 0316-257 were obtained in service mode between UT January 2015 January 14 and 17. We used the Wide Field Mode (1\arcmin$$\times1 field of view) with the 2nd-order blocking filter resulting in a wavelength coverage of 480-935 nm. Our eight 900s exposures were taken at position angles of 0, 90, 180 and 270*∘* with a small pointing offset to mitigate against systematic artefacts. We processed the data using MUSE pipeline version 1 (Weilbacher et al., 2012) to produce a fully-calibrated (wavelength, flux, and astrometry) sky-subtracted data cube. The measured image quality of the reconstructed white light image is 1″. To preserve any possible extended low surface-brightness features, we did not use sky-residual cleaning algorithms.
To remove remaining artefacts, we subtracted all continuum sources from the datacube using a linear interpolation between two 50Å wide bins on both sides of the emission line. The very extended Ly emission is only marginally detected. To make the Ly morphology more evident, we implemented our own version of the algorithm of Martin et al. (2014, Fig. 1). To provide the characteristics of the Ly emission, we extracted and fit the Ly line from several regions (Table 1, Fig. 2). The line ratios of Ly, CIV1548, 1551, HeII1640, and CIII]1907, 1909 of the highest surface brightness regions (3-5) imply they are ionized by the AGN. Beyond the circum-nuclear emission, 10″ from the AGN, the Ly emitting regions are too faint to determine line ratios necessary to constrain the ionization source.
We find Ly emission, down to 10*-19* erg s*-1* cm*-2* arcsec*-2*, up to 35 from the radio galaxy (250 kpc in projection). The morphology of the emission, outside of that likely excited by the AGN, is arc- and stream-like with the higher surface brightness arcs appearing at 150-250 kpc (regions 1, 2, and 11) from the nucleus with the connected filamentary structures reaching into the circum-nuclear regions (regions 6-8). The most distant arc (region 11) has an offset velocity relative to the arc second-scale HeII1640 emission from the AGN of 700 km s*-1*. We assumed that the velocity of the HeII line represents the systemic velocity of the system. This assumption is supported by the small relative offset velocity (≲50 km s*-1*) between circum-nuclear dense gas (from CO(8–7)) and HeII in another radio galaxy (Gullberg et al., 2016). Closer to the nucleus, the filaments of Ly emission narrow on the sky, the redshifted offset velocity decreases to 250 km s*-1*, line full-width at half maximum remain very high, reaching up to 700 km s*-1*, 50-100 kpc from the nucleus. All throughout the emission, the lines are broad, 300-700 km s*-1*.
Projected on to region 11, we find a z=3.1245 galaxy, which we have dubbed the “Arrow” because of its arrow-like morphology in HST/ACS F814W imaging (Fig. 2).
3 What mechanisms power the Ly emission?
Photoionization by the AGN or star formation: While the rest-frame UV emission line ratios indicate that the AGN is likely ionizing the gas within several 10s kpc along the direction of the radio jets (regions 3-6), it is not clear if the AGN could plausibly provide sufficient ionizing photons to explain the surface brightness of the most extended gas. We can estimate the intensity of the radiation field necessary to power the Ly emission observed at distances larger than 100 kpc. The surface brightness ranges from 1-4 10*-19* erg s*-1* cm*-2* arcsec*-2* at such large distances (3-1010*-17* erg s*-1* cm*-2* arcsec*-2* after correcting for surface brightness dimming). Assuming case B recombination, the recombination rate per unit area necessary to sustain these surface brightness is, Rrec= 4ILyα/, where ILyα is the intensity of the Ly emission in photons cm*-2* s*-1* sr*-1* and is the number of Ly photons produced per recombination (0.61). Assuming that every ionizing photon has an energy of 13.6 eV222The photo-ionization cross section of Hydrogen peaks at 13.6 eV and this estimate is the maximum number of photons expected. It is therefore an upper limit to the number of photons. and unity or greater covering fraction, we find the energy flux necessary to sustain the range of surface brightness we observe is 0.7-210*-3* erg cm*-2* s*-1* sr*-1*.
We use H emission line luminosity as an indicator of the photoionization rate from the AGN and massive stars. The luminosity of H (Nesvadba et al., 2008) implies an ionizing luminosity, Lion=4.81045 erg s*-1*. The ionizing intensity of the AGN at a radius of 100 kpc is 10*-3* erg s*-1* cm*-2* sr*-1*. The AGN provides sufficient photons to explain the extended Ly nebula within 100 kpc, but generally falls short for gas at larger distances. This estimate only applies along lines-of-sight free of intervening absorption and scattering, which may be true within the ionization cone, assumed to lie along the radio axes with an opening angle 45°(blue regions in Fig. 2; Drouart et al., 2012). The gas along the radio jet, even the most extended gas along this direction (regions 1 and 2) is thus plausibly to have its surface brightness regulated by the AGN. Away from the ionization cone (red regions 6–11 in Fig. 2), it is unlikely that the AGN provides sufficient photons; young stars embedded in these regions would be an alternative. However, the remarkable uniformity of regions 6–10 suggests there is no significant local ionization by stars as observed in, e.g., MRC 0943-242 (Gullberg et al., 2016) and also argues against a central source such as an AGN ionizing the gas.
Ionization by the meta-galactic flux: At z3, the intensity of ionizing photons due to the meta-galactic flux is 2105 photons cm*-2* s*-1* (Haardt & Madau, 1996). Assuming ionization equilibrium and the clouds are optically thick, implies that the meta-galactic ionization rate is 2 orders-of-magnitude less than that necessary to maintain the ionization of the extended gas. So while the meta-galactic flux contributes to the ionization of the diffuse gas, it does not maintain it.
Resonance Scattering: If the extended gas has sufficient column of neutral HI to be optically thick at the wavelength of Ly then resonance scattering of the Ly and UV continuum from the AGN can contribute to its surface brightness. The line profiles of the extended Ly emission do not mirror those of the nuclear gas – they are both narrower and have significant velocity offsets relative to the nuclear emission (Table 1). The approximately constant surface brightness of the extended emission argues against a central source exciting the emission. In addition, spectropolarimetry of MRC 0316-257 (Reuland et al., 2003) finds unpolarized (4%) Ly emission, arguing against any significant contribution of scattered light to the circum-nuclear emission.
Shock heating in the outer halo: Another possibility for exciting the Ly emission in the halo of MRC 0316-257 is an accretion shock from inflowing gas at the halo boundary and/or shocks from cloud-cloud collisions in a multiphase stream (Cornuault et al., 2016). The morphology of the most extended emission to the west-southwest (region 11) is shell-like and certainly suggestive of compression (a “splash”). We observe a velocity shear between region 11 and that of the inner halo accross regions 6–10 of 400-500 km s*-1*. In addition, over these regions, 6–11, the gas appears to be highly disturbed having FWHM of 300-700 km s*-1*. These violent motions and shears make shock heating a plausible mechanism for exciting the gas.
To test this possibility, we compare our measured surface brightness with those predicted for high velocity shocks. The models of Allen et al. (2008) imply that even in relatively low density, low metallicity, gas ( few10*-3* cm*-3*), the surface brightness produced by shocks is sufficient to explain our observations for the relative velocities we observe in the data, 300-700 km s*-1*. Simulations indicate filament densities of-order 10*-3* to 10*-1* cm*-3* (Rosdahl & Blaizot, 2012), in agreement with what is required. The surface brightness is related to the mass flow rate. These densities and velocities, imply a mass flow rate, vshock Ashock 250 M*⊙* yr*-1*, for pre-shock density, = 0.01 cm*-2*, shock velocity, vshock = 500 km s*-1*, and area, Ashock, and for simplicity, of a circle with a radius of 25 kpc.
While we have used the observed high relative velocities and large line widths as a justification of exploring the possibility of shock heating, caution is warranted. Both the relative velocities and large line widths may be partially due to radiative transfer effects (Cantalupo et al., 2005). The size of the effect depends on whether or not the medium is multiphasic and what causes the ionization. However, none of the Ly lines in the most extended regions (1, 2, and 6–11) appear split as might be expected if radiative transfer effects are important.
4 Ly structures as accretion streams
Comparing the relative velocities of galaxies surrounding MRC 0316-257 with those from cosmological simulations, Kuiper et al. (2012) suggest that it is a result of the on-going merger of two massive, 1014 M*⊙*, proto-clusters. Finding that the surface brightness of the gas in the outer halo is consistent with being shocked heated, its arc- or shell-like and filamentary morphology, large line widths, redshifted velocities, and relatively smooth change in velocity as a function of distance from the AGN suggests this may be gas accreting from the cosmic web (Rosdahl & Blaizot, 2012; Goerdt et al., 2015). If we make this assumption, then what do our results tell us about gas accretion into massive halos and do they agree with those from cosmological simulations?
For this comparison, we focus exclusively on the filamentary structure to the west-southwest of the AGN (regions 6–11). We limit ourselves to these regions because none of the low surface brightness emission shows obvious evidence for being ionized by the AGN, they do not lie along the direction of the radio jets (which trace the direction of the ionization cone and the ionization cones have opening angles 45°, suggesting these regions lie outside; Drouart et al., 2012), and they extend rather continuously in emission from the outer halo into the circum-nuclear region. As already noted in the introduction, these regions have surface brightnesses consistent with estimates from simulations (Rosdahl & Blaizot, 2012). The “Arrow” lies in this structure which is seen in simulated filaments (Gheller et al., 2016, Fig. 2). These observations form the basis for us assuming these regions are part of an accretion stream.
The surface brightness of the distant arc can be explained via shock heating. Assuming such shock occurs at the virial radius, simple scaling relations imply radii of 150 and 330 kpc for 1013 and 1014 M*⊙* halos respectively. Similarly, the virial velocities for halos with these masses are 500 and 1100 km s*-1*. We do not necessarily expect the velocities of the streams to be equal to the virial velocity but can be as low as half (Goerdt & Ceverino, 2015). Both the distance of the outermost shell from the nucleus and the velocities we observe are consistent with virial expectations. We observe projected distances and velocities (and the projection of the velocity could change with position), not true positions and velocities, so this comparison is, by necessity, only order-of-magnitude. Simulations do show broad lines in Ly, of the same order (100s km s*-1*) as we observe (Goerdt et al., 2010).
Gas accretion through a stream, while able to make up most of the total accretion rate, can also vary substantially within a filament. Goerdt et al. (2015) found accretion rates of 50-5000 M*⊙* yr*-1* sr*-1* through filaments for a halo mass of 1012 M*⊙. Scaling up these rates per sr by the virial mass as is appropriate for total mass accretion rates (, Goerdt et al., 2015), we estimate rates 15 to 300 higher for 10 to 100 higher halo masses. A rough estimate suggests the shock subtends 1% of the spherical surface area at 250 kpc and using the mass flow rate (§ 3), implies an accretion rate per unit solid angle 2104* M*⊙* yr*-1* sr*-1* – a value consistent with simulations.
Many properties of the Ly emission we observed in the circum-galactic medium of MRC 0316-257 are broadly consistent with the results of simulations of gas accretion streams. However, we view aspects of this agreement as fortuitous. Simulations generally lack the spatial and temporal resolution necessary to capture thermal and dynamical instabilities, resolve high Mach shock fronts, fragmentation of the post-shock gas, and turbulence that naturally occur in astrophysical gas flows (Kritsuk & Norman, 2002; Cornuault et al., 2016). It is not clear if simulations show conspicuously large shock fronts and strong post-shock cooling at approximately the halo boundary as we have suggested. Such fronts, if real, are important for establishing many properties of the gas on its inward journey deeper into the potential well (fragmenting the gas and inducing turbulence). Until simulations reach the necessary resolutions and input physics to resolve shock fronts and fragmentation, it is fair to say that our theoretical understanding of these flows is limited. Observational constraints, such as those provided here, are crucial for obtaining a deeper understanding of how galaxies get their gas through gas accretion flows.
Acknowledgements.
MDL thanks the ESO visitor program for support.
The reference list from the paper itself. Each links out to its DOI / PubMed record.
- 1Allen et al. (2008) Allen, M., Groves, B., Dopita, M., Sutherland, R., & Kewley, L. 2008, Ap JS, 178, 20
- 2Bacon et al. (2010) Bacon, R., Accardo, M., Adjali, L., et al. 2010, in Proc. SPIE, Vol. 7735, Ground-based and Airborne Instrumentation for Astronomy III, 773508
- 3Birnboim & Dekel (2003) Birnboim, Y. & Dekel, A. 2003, MNRAS, 345, 349
- 4Cantalupo (2016) Cantalupo, S. 2016, ar Xiv:1612.0049
- 5Cantalupo et al. (2005) Cantalupo, S., Porciani, C., Lilly, S. J., & Miniati, F. 2005, Ap J, 628, 61
- 6Chambers et al. (1990) Chambers, K. C., Miley, G. K., & van Breugel, W. J. M. 1990, Ap J, 363, 21
- 7Christensen et al. (2006) Christensen, L., Jahnke, K., Wisotzki, L., & Sánchez, S. F. 2006, A&A, 459, 717
- 8Cornuault et al. (2016) Cornuault, N., Lehnert, M. D., Boulanger, F., & Guillard, P. 2016, ar Xiv:1609.04405