Resolving the H-alpha-emitting Region in the Wind of Eta Carinae
Ya-Lin Wu, Nathan Smith, Laird M. Close, Jared R. Males, Katie M., Morzinski

TL;DR
This study uses high-resolution imaging to directly measure the H-alpha emitting region in Eta Carinae's wind, confirming predictions from radiative transfer models and providing insights into the star's wind structure and parameters.
Contribution
First direct imaging confirmation of the H-alpha emission region size in Eta Carinae's wind, validating stellar wind models and their parameters.
Findings
H-alpha emission region is about 12 mas (~30 AU) in radius.
The observed size agrees with the Hillier stellar-wind model.
No significant asymmetries in H-alpha emission related to the companion or rotation.
Abstract
The massive evolved star Eta Carinae is the most luminous star in the Milky Way and has the highest steady wind mass-loss rate of any known star. Radiative transfer models of the spectrum by Hillier et al. predict that H-alpha is mostly emitted in regions of the wind at radii of 6 to 60 AU from the star (2.5 to 25 mas at 2.35 kpc). We present diffraction-limited images (FWHM ~25 mas) with Magellan adaptive optics in two epochs, showing that Eta Carinae consistently appears ~2.5 to 3 mas wider in H-alpha emission compared to the adjacent 643 nm continuum. This implies that the H-alpha line-forming region may have a characteristic emitting radius of 12 mas or ~30 AU, in very good agreement with the Hillier stellar-wind model. This provides direct confirmation that the physical wind parameters of that model are roughly correct, including the mass-loss rate of 10^-3 M_sun/yr, plus the…
Click any figure to enlarge with its caption.
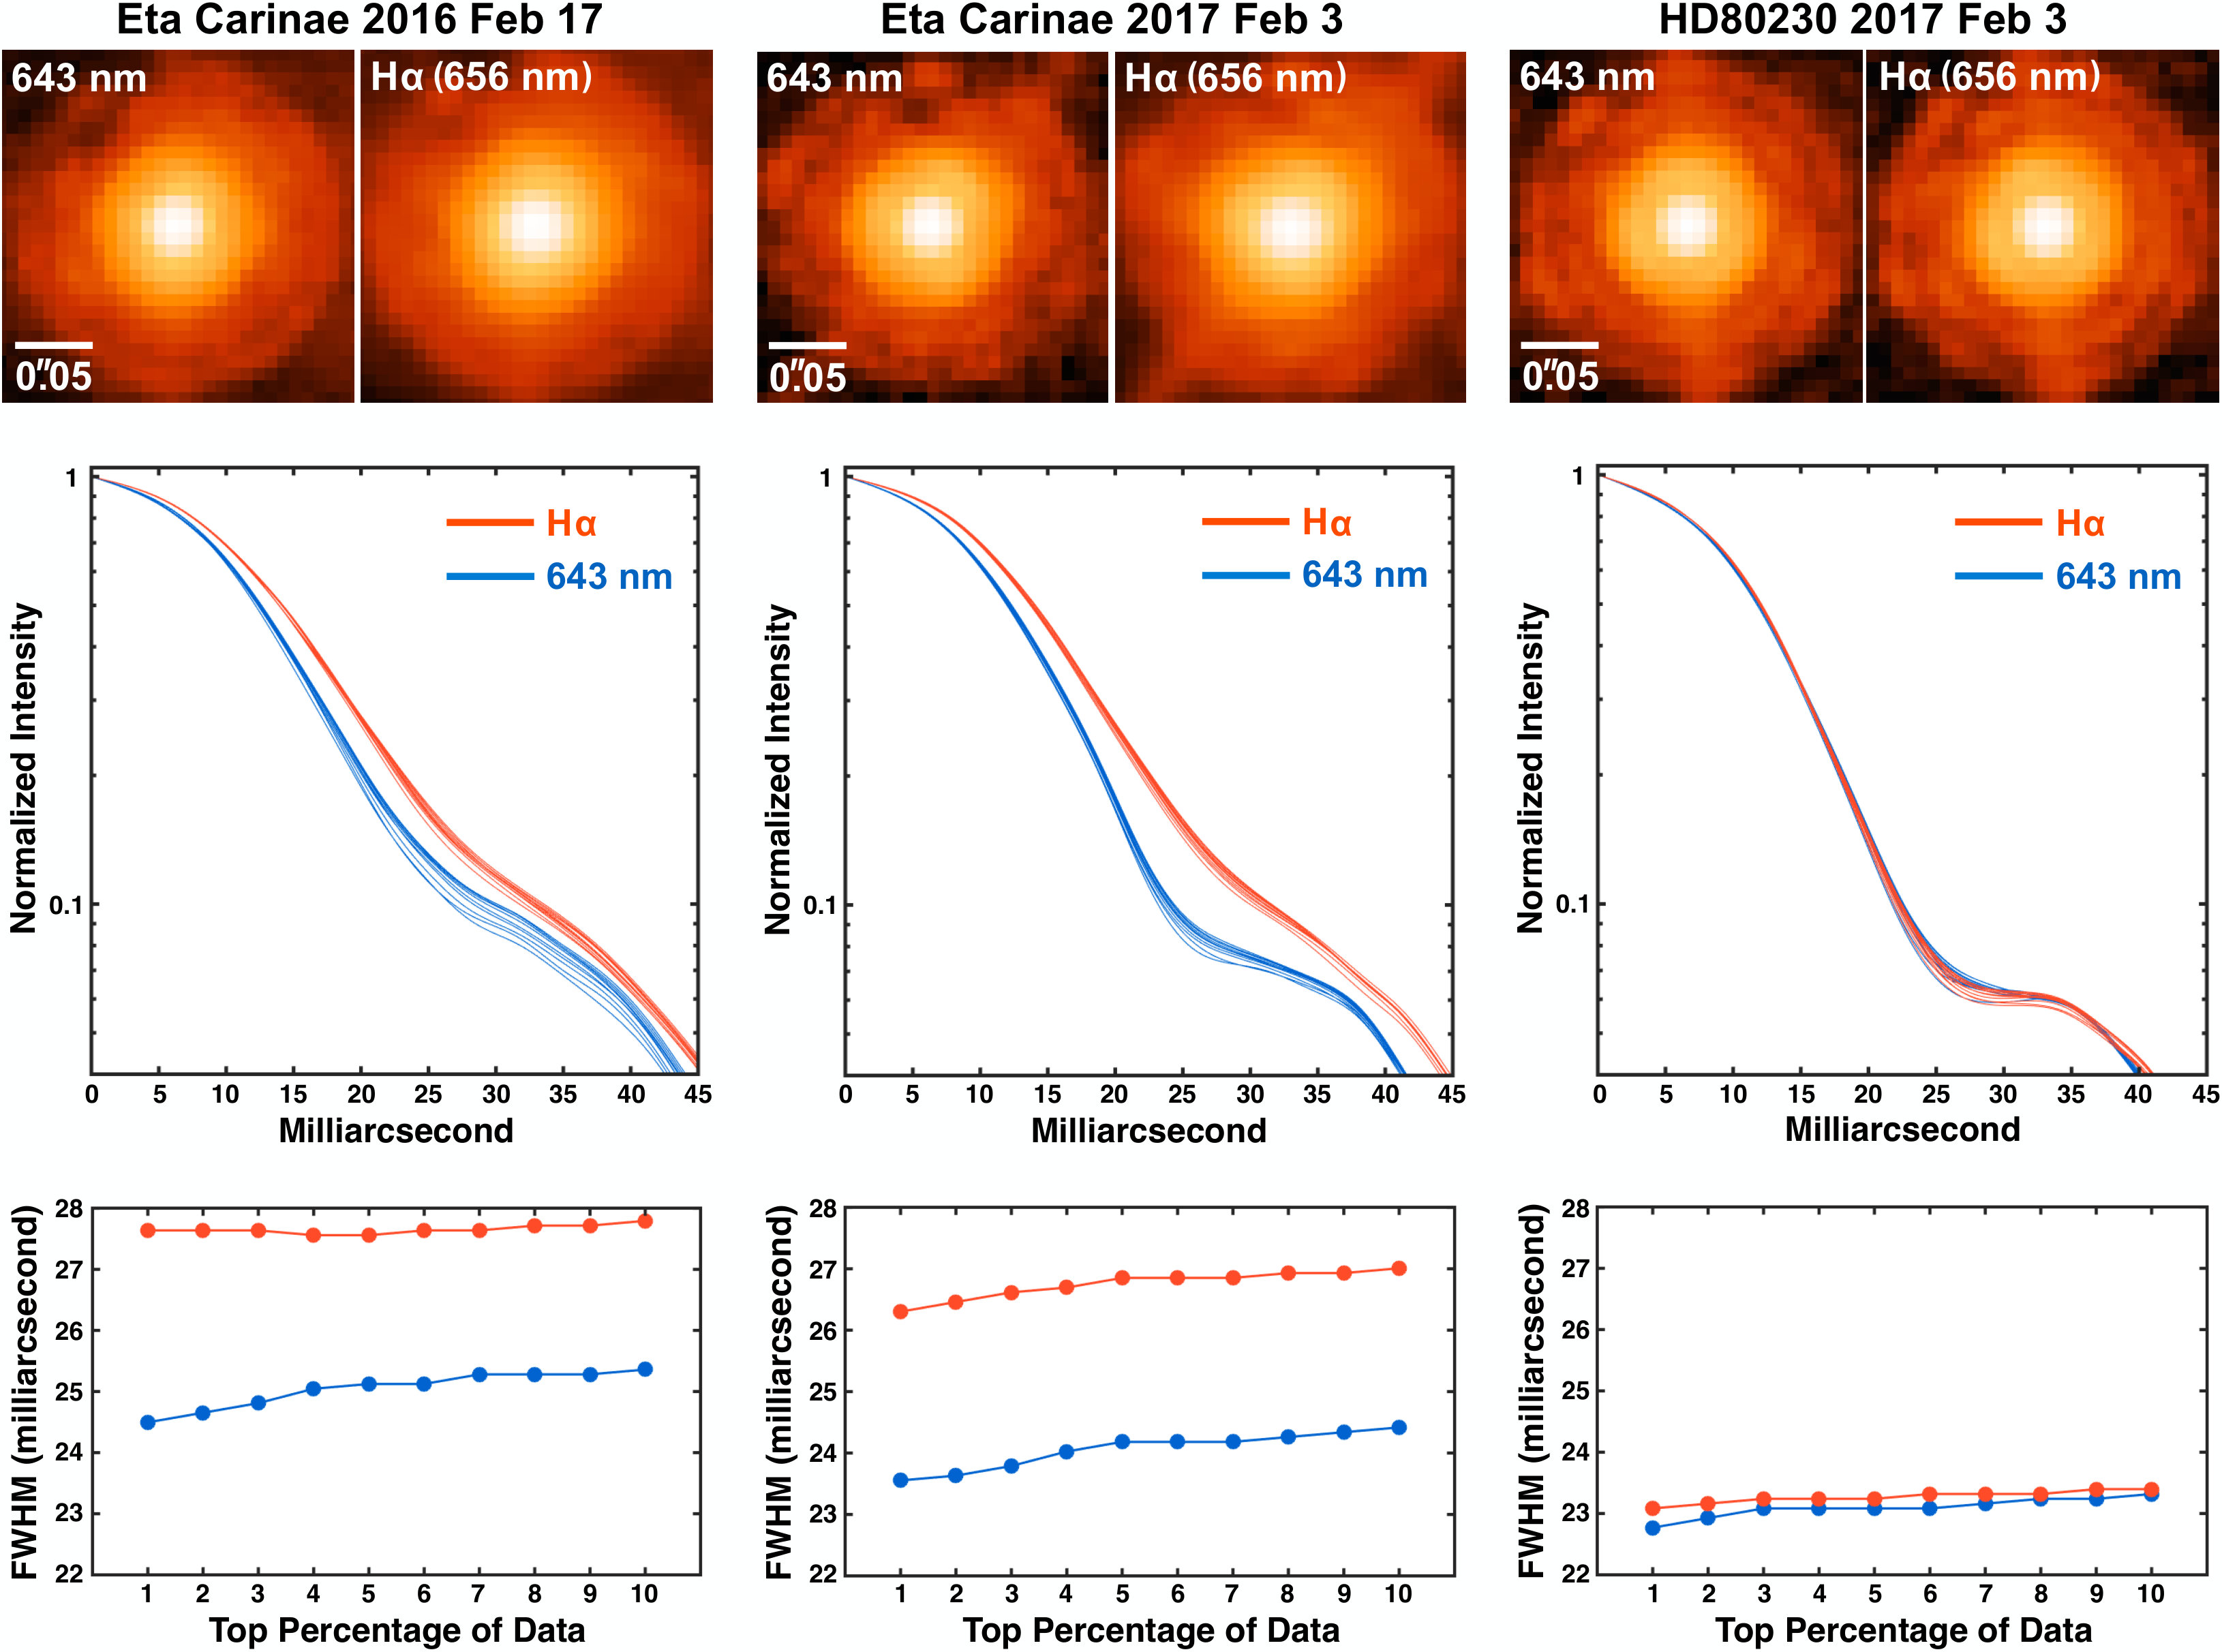 Figure 1
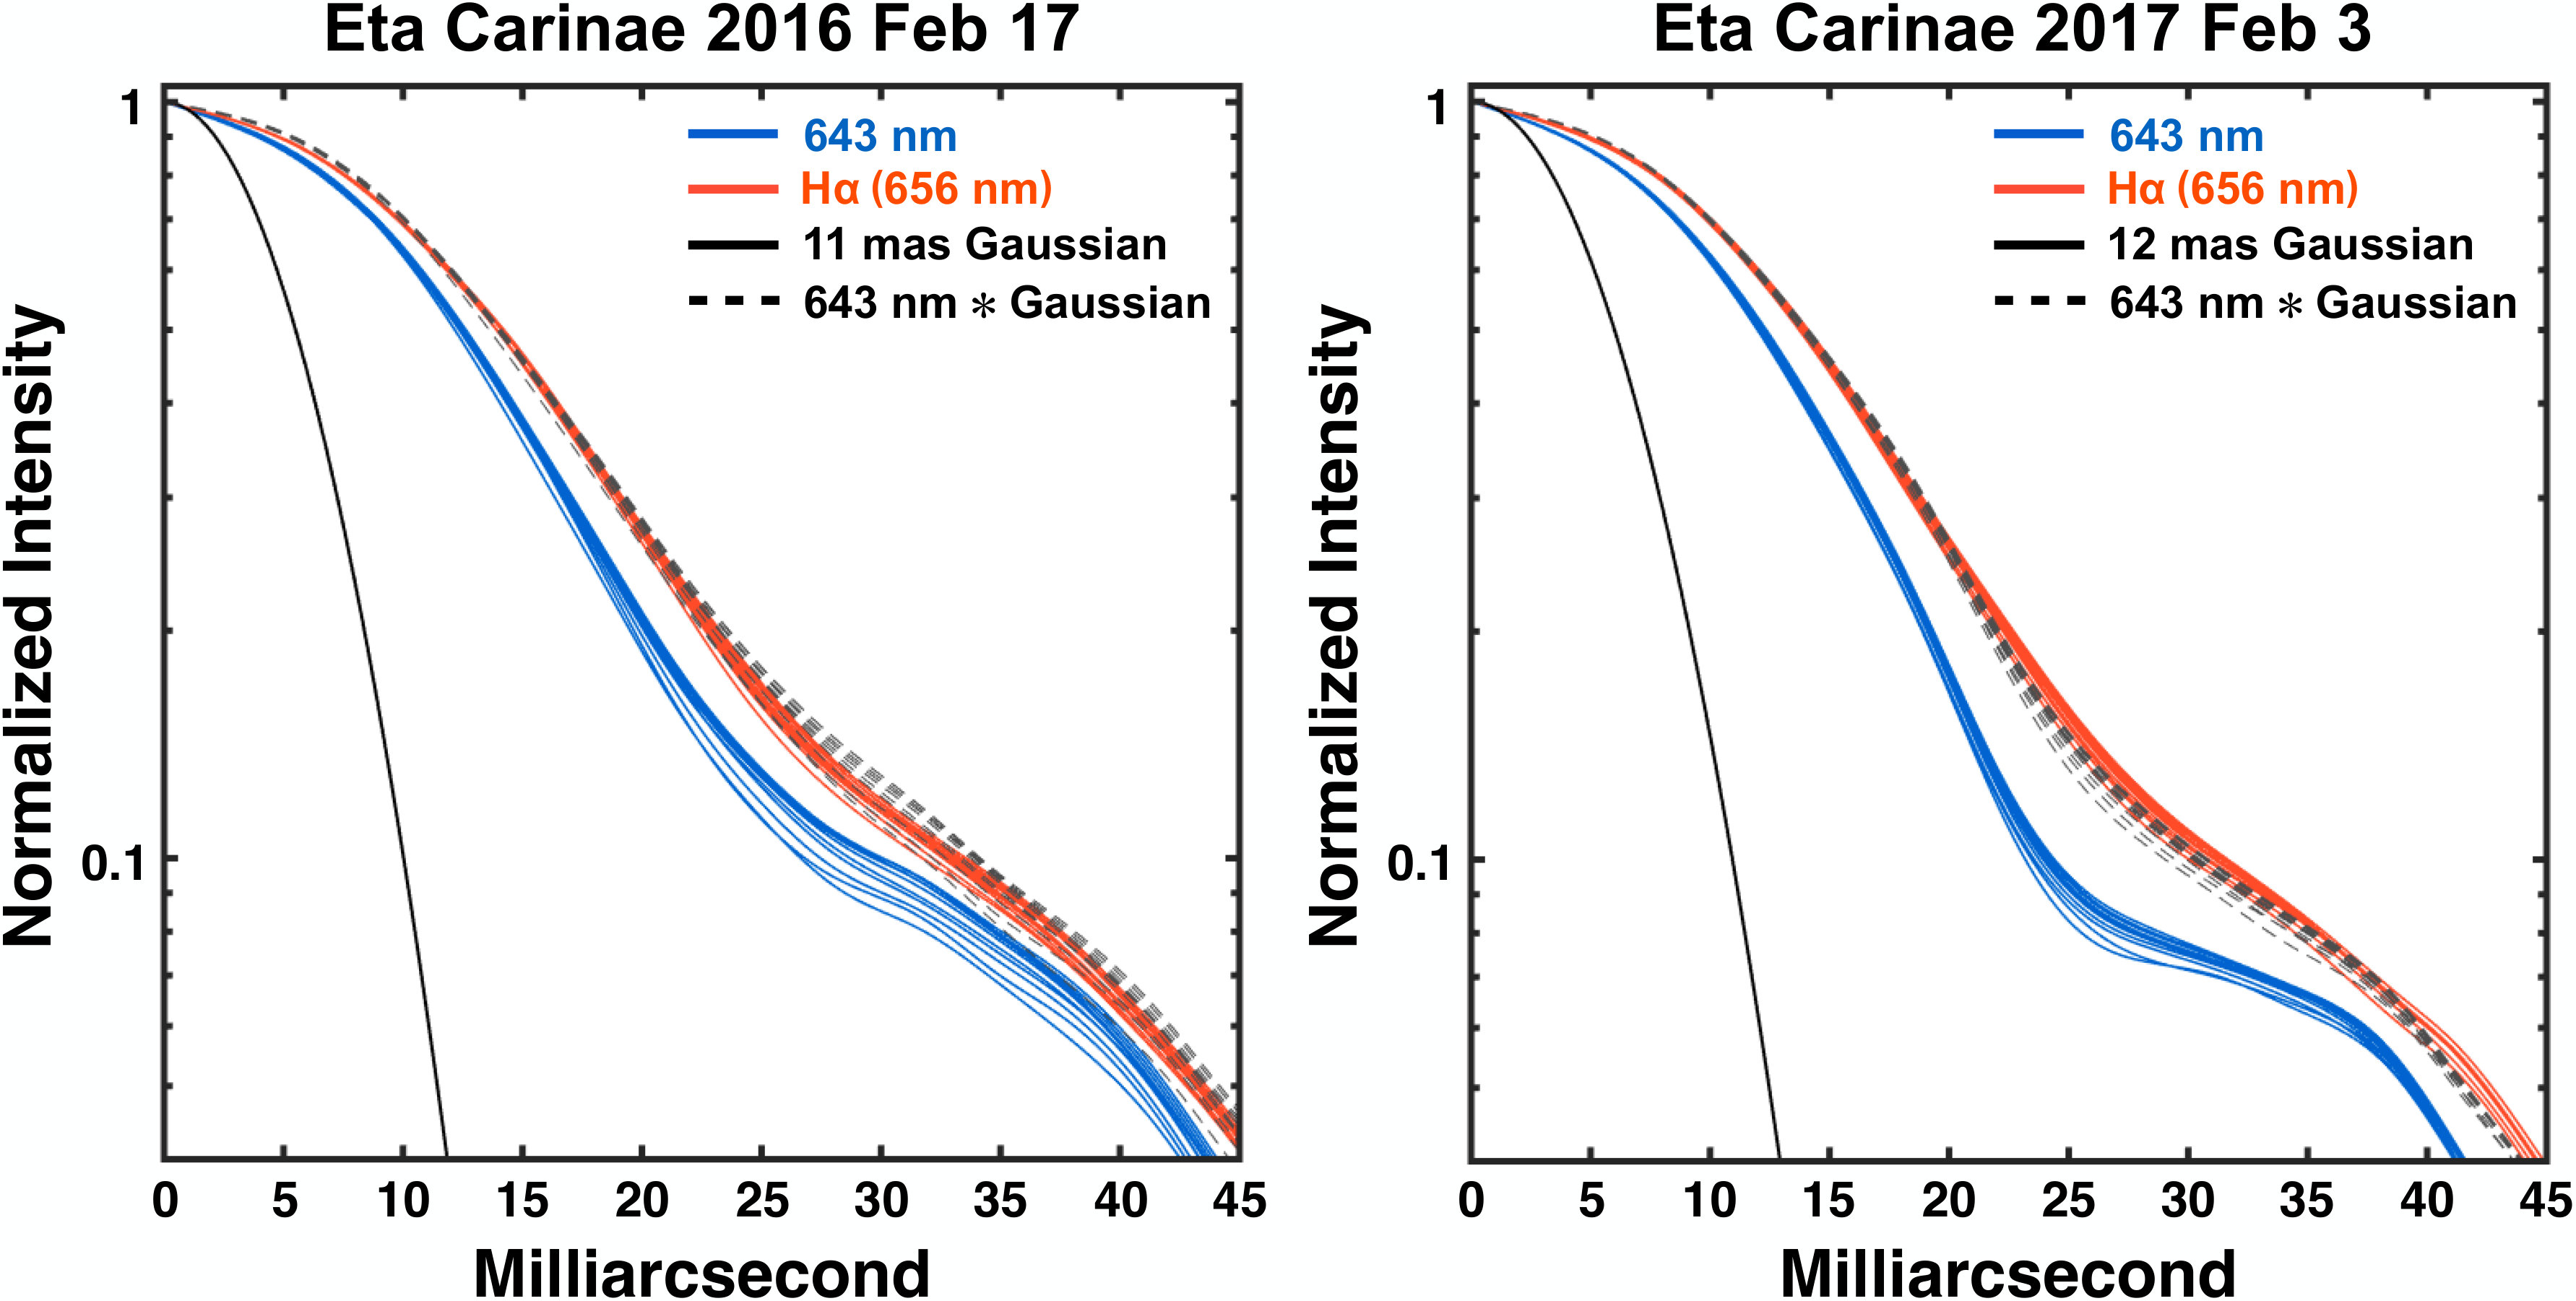 Figure 2
| Object | Date | Seeing | Filter | Speed | Mode | Exposure |
|---|---|---|---|---|---|---|
| Carinae | 2016 Feb 17 | 065 | 643 nm | 990 Hz | 300 | 32 ms 5000 |
| 656 nm | 990 Hz | 300 | 32 ms 5000 | |||
| 2017 Feb 03 | 05 | 643 nm | 1 kHz | 350 | 32 ms 2500 | |
| 656 nm | 1 kHz | 350 | 32 ms 2539 | |||
| HD 80230 | 2017 Feb 03 | 075 | 643 nm | 1 kHz | 350 | 32 ms 2500 |
| 656 nm | 1 kHz | 350 | 32 ms 2500 |
Peer Reviews
No public reviews on file for this paper yet. If you reviewed it on a platform where reviews are public (OpenReview, ICLR, NeurIPS, ICML), you can paste yours below so the community can read it here.
Videos
No videos yet. Explain this paper in a talk, walkthrough, or lecture? Add one.
Resolving the H-emitting Region in the Wind of Carinae
Ya-Lin Wu, Nathan Smith, Laird M. Close, Jared R. Males, and Katie M. Morzinski
Steward Observatory, University of Arizona, Tucson, AZ 85721, USA; [email protected]
Published in ApJL
Abstract
The massive evolved star Carinae is the most luminous star in the Milky Way and has the highest steady wind mass-loss rate of any known star. Radiative transfer models of the spectrum by Hillier et al. predict that H is mostly emitted in regions of the wind at radii of 6–60 AU from the star (2.5–25 mas at 2.35 kpc). We present diffraction-limited images (FWHM 25 mas) with Magellan adaptive optics (MagAO) in two epochs, showing that Carinae consistently appears 2.5–3 mas wider in H emission compared to the adjacent 643 nm continuum. This implies that the H line-forming region may have a characteristic emitting radius of 12 mas or 30 AU, in very good agreement with the Hillier stellar-wind model. This provides direct confirmation that the physical wind parameters of that model are roughly correct, including the mass-loss rate of = 10*-3* yr*-1*, plus the clumping factor, and the terminal velocity. Comparison of the H images (ellipticity and PA) to the continuum images reveals no significant asymmetries at H. Hence, any asymmetry induced by a companion or by the primary’s rotation do not strongly influence the global H emission in the outer wind.
Subject headings:
circumstellar matter – stars: individual (Eta Carinae) – stars: winds, outflows
††slugcomment:
1. Introduction
The strong mass loss of Carinae provides important clues for our understanding of the late evolutionary phases of very massive stars. Classified as a luminous blue variable (LBV), Carinae has exhibited dramatic instability and suffers significant mass loss evidenced by its historical eruptions and its strong present-day wind. Over the past 800 years, repeating eruptions have created the spectacular Homunculus Nebula and numerous outer ejecta (e.g., Morse et al. 2001; Smith et al. 2003b; Kiminki et al. 2016) that have removed 20 or more from the star. Despite this extreme mass ejection, the star apparently survived the 19th century Great Eruption (Smith & Frew, 2011), and its present-day wind has the highest mass-loss rate of any hot star. While the past eruptive mass loss is so strong that it must have been a continuum-driven super-Eddington wind or a non-terminal explosion (Smith et al., 2003b; Owocki et al., 2004; Smith & Owocki, 2006; Smith, 2008; Owocki & Shaviv, 2016), its present-day wind is near the limit of what can be powered by conventional line-driven winds. As such, the strong wind of Carinae is an important test case for understanding the physics of strong stellar-wind mass loss from hot stars.
LBVs and related hot supergiants have such dense ionized winds that their H emission is extremely strong, and comes from radii that can be vastly more extended than the star’s surface. The H-emitting region of the famous LBV star P Cygni, which is located closer to us than Car, has been resolved by optical interferometry (Vakili et al., 1997). It has an apparent size of 5 mas in H, which is about 20 times larger than the visible-wavelength continuum photosphere. Some faint extended structure around P Cygni seen in adaptive optics imaging in H was interpreted as clumpy structures in the outer wind or inner nebula (Chesneau et al., 2000).
Based on a comparison with the UV to near-IR spectrum of the central star observed by the Hubble Space Telescope (HST), Hillier et al. (2001) constructed a 1D radiative transfer model of Car’s spectrum, indicating a very high present-day mass-loss rate of 10*-3* yr*-1*. This model indicates that the expected H-emitting region is extended, at roughly 20–200 stellar radii. This translates to about 1200–12000 for the adopted stellar radius of 60 , or radii of 6–60 AU (2.5–25 mas at = 2.35 kpc; Smith 2006). Directly measuring the extent of this H emission provides a way to test models of the wind mass loss.
For Car, the H-emitting region of the wind has not yet been directly resolved. This is partly because Car is a more difficult target than P Cygni, due to its larger distance and because it is surrounded by very complex nebulosity, which is at least partly attributed to a series of shells and clumps produced by the interacting wind shocks in this massive binary system. Imaging and long-slit spectroscopy with HST have not been able to directly resolve the stellar wind’s H emission, although they have shown complex and time-variable extended structures in the nebula within 01–03 of the star (Morse et al., 2001; Smith et al., 2004; Gull et al., 2009; Madura et al., 2012). At ultraviolet (UV) wavelengths, the wind of Car has a more extended halo because of bound–bound scattering opacity and possibly because of obscuration of the central star’s continuum. This extended UV wind emission, seen mainly in Fe ii and [Fe ii] line emission, has been directly resolved with HST at radii of 30–200 mas from the star (Hillier et al., 2006). The outer wind has also been resolved with radio interferometry with a size of 1″, due to the very large extent and high optical depth of free-free emission (Duncan et al., 1999; Duncan & White, 2003). The radio emission is highly variable and is strongly influenced by time-dependent ionization of circumstellar material from the hot companion star. The highest angular resolution for Car has been achieved with near-IR interferometry, which probes deep enough into the wind to see significant asymmetry at angular scales of 5 mas (van Boekel et al., 2003; Groh et al., 2010; Weigelt et al., 2016). The detected asymmetry has been interpreted as evidence for a bipolar primary wind geometry induced by rotation, as well as strong asymmetry in the equatorial emitting regions due to the shock cone structure in the colliding winds of the binary system.
Mass-loss rates derived from these studies vary from 0.5–1.6 10*-3* yr*-1*. The high end of these values was derived from emission in the polar wind (van Boekel et al., 2003). Lower values of 0.5 10*-3* yr*-1* for the primary star’s mass-loss rate are derived from models of the X-ray emission from the colliding wind binary (Parkin et al., 2009). Since the model of Hillier et al. (2001) is based on a 1D code that adopts spherical symmetry, the mass-loss rate may vary with latitude and the integrated spectrum on which the model is based may be a representative average. Indeed, analysis of line profiles of H emission reflected by the dusty Homunculus Nebula suggests that the velocity and density of the present-day stellar wind do indeed vary from equator to pole (Smith et al., 2003a), with higher density and faster outflow toward the poles (the poles of the wind are oriented along the same direction as the polar axis of the nebula). From the reflected line profiles, the emission components do not show a strong latitude dependence, while blueshifted P Cygni absorption, tracing a single line of sight to the star’s photosphere, shows significant latitude dependence that points toward a rotationally shaped wind (Smith et al., 2003a). Allowing the wind to be aspherical introduces a number of free parameters into the model (Hillier et al., 2006), allowing for direct imaging of the H region to provide helpful constraints.
To directly measure the location of the H line-forming region of the wind would require a 40 mas resolution at optical wavelengths. Here, we report diffraction-limited imaging of Car using the Magellan adaptive optics (MagAO; Close et al. 2012, 2013; Males et al. 2014; Morzinski et al. 2014) in 2016 and 2017. We show that Car appears 2.5–3 mas more extended in H than the 643 nm continuum, thereby constraining the dimensions of the H-forming region in Car’s wind.
2. Observations and Data Reduction
We obtained images of Carinae on 2016 February 17, and again on 2017 February 3 with the MagAO system operated with 300 and 350 corrected modes, respectively. These two epochs were obtained at orbital phases in the binary system of roughly 0.28 and 0.46, about 1.5–2.5 year after periastron. Observations in the H filter (656 nm; = 6.3 nm) and the neighboring continuum filter (643 nm; = 6.1 nm) were interleaved (H, continuum, H, continuum, etc.) so as to wash out any small effects of variability of seeing. In our second-epoch observations, we also imaged the nearby red giant HD 80230 ( 4.3 mag), which is unlikely to have any extended H emission, in the same manner to calibrate the shape of the point spread function (PSF) on an unresolved source. Table 1 summarizes our observations.
Raw data were dark-subtracted, de-rotated, and registered with IRAF111IRAF is distributed by the National Optical Astronomy Observatories, which are operated by the Association of Universities for Research in Astronomy, Inc., under cooperative agreement with the National Science Foundation.(Tody 1986, 1993). Image quality was gauged by the peak intensity of the core. To achieve optimal resolution, we only average-combined the top 1%, 2%, 3%, …, 10% of the reduced frames and measured the FWHM. Since the signal-to-noise ratios (S/Ns) of our average-combined images are high (S/N 3000–7000), we can achieve accurate measurements of the FWHM values. Plate scale for H in MagAO images is 7.85 mas pix*-1* (Close et al., 2013).
3. Results and Interpretation
Figure 1 shows our two epochs of MagAO observations of Car. In the top panels, we show the images of Car and the PSF reference star HD 80230 in 643 nm and H from the top 1% of the data. The first two Airy rings are clearly seen. In the middle panels, we plot the normalized radial profiles in images processed with the top 1%, 2%, 3%, …, 10% of the data. It is clear that Car appears more extended in H than in the continuum in both epochs, while HD 80230 has almost identical PSFs in both filters. This demonstrates that Car’s different profile shapes between line and continuum are genuine, rather than from atmospheric turbulence or imperfect AO corrections. This difference is better seen in the bottom panels, where we show that Car’s H FWHM is approximately 2.5–3 mas wider than its 643 nm continuum. We note that we did not enlarge the 643 nm images by the ratio of wavelength difference (2%) because the slightly poorer AO performance at bluer wavelengths might enlarge the 643 nm PSF by a similar amount, as hinted by the nearly identical H and 643 nm FWHMs of HD 80230. In any case, the difference in profile widths between line and continuum is much larger than the difference in wavelength.
The distribution of H emission is expected to be highly asymmetric because of the bipolar primary wind (Smith et al., 2003a), as well as the influence of the companion star (Damineli, 1996), but the resolutions of our images are not high enough to reveal unambiguously any weak asymmetric structure. We find that the ellipticity and PA are indistinguishable between the H and continuum images. Any real asymmetry is evidently more compact than we can probe, at size scales of 5 mas as seen in the near-IR interferometric results (van Boekel et al., 2003; Groh et al., 2010; Weigelt et al., 2016). To further characterize the extent of the H-forming region in Car’s wind, in Figure 2 we show that the 2.5–3 mas (10%) increase in the H FWHM can be reproduced by convolving the 643 nm PSF with an FWHM12 mas Gaussian. This implies that the H-forming region may be on the order of 12 mas in size, corresponding to 25–30 AU at a distance of 2.35 kpc.
This characteristic scale is remarkably consistent with the predictions in Hillier et al. (2001) that H is mostly emitted at a separation of 20–200 stellar radii, with a peak at a radius of about 65 stellar radii (see Figure 15 in Hillier et al. 2001). With the stellar radius of 60 that Hillier et al. (2001) adopted for Car, this translates to a range of radii from 6 to 60 AU and a peak at a radius of 20 AU. Our finding of the observed extent of H emission around Car at 25–30 AU therefore provides direct confirmation of the globally averaged values of = 10*-3* yr*-1*, a density filling factor for clumps in the wind of 0.1, and a terminal wind velocity of 500 km s*-1* found from the 1D stellar-wind modeling in Hillier et al. (2001).
The length scale derived here for H is larger than in the recent VLTI aperture-synthesis imaging at Br (2.166 µm), which revealed a fan-shaped outflow extending to 6–8 mas (14–19 AU) along the NW–SW direction (Weigelt et al., 2016). Since we find that convolving with a 12 mas Gaussian better reproduces the observed H profile than 6–8 mas Gaussians, the H-emitting region in Car’s wind is more extended than for Br, as expected.
The location of H emission also holds some implications for reconciling the clues of wind asymmetry with the average mass-loss rate derived from 1D radiative transfer models of the unresolved spectrum. A relatively fast and dense polar wind is indicated by P Cygni absorption profiles seen in H, as noted above (Smith et al., 2003a). Meanwhile, the H emission components show little angle dependence in these same spectra that view the star from mid-latitudes to the pole (Smith et al., 2003a). This may be explained because the H emission (integrated over the whole wind) arises at relatively large radii where the asymmetry is washed out, well outside the regions of the strongest asymmetry of the bipolar wind seen in near-IR interferometric data (van Boekel et al., 2003). P Cygni absorption, on the other hand, traces a single line of sight through the wind and can still reveal the angle dependence of speed and density (Smith et al., 2003a). The faster and denser polar wind stands in contrast to lower mass-loss rates inferred from models of the colliding wind X-ray emission. Such models generally yield mass-loss rate estimates for the primary star of yr*-1* or less (Parkin et al., 2009). This is less than the average mass-loss rate from 1D models, whereas the polar wind implies a higher mass-loss rate. The likely explanation for this is that the colliding wind emission reflects the density of the primary star’s wind at low latitudes near the equator, since the plane of the binary orbit is aligned with the equatorial plane of the rotating primary star and with the equatorial plane of the Homunculus (Madura et al., 2012), and the colliding wind shock remains at low latitudes within about 45°. If the primary star’s wind were intrinsically spherical, it would be difficult to understand the simultaneous indication of a higher mass-loss rate of 10*-3* yr*-1*, which seems to be confirmed by our H imaging, and the lower mass-loss rates near the equator indicated by X-ray emission. The most natural conclusion is that the primary star’s wind does actually have a strong latitude dependence, even though it may be modified further by the colliding wind shock cone.
Finally, we note that while the weaker observed P Cygni absorption in H and Fe lines compared to the 1D model might imply that the mass-loss rate is a few times lower than predicted (Hillier et al., 2001), the absorption depth may also be influenced by the hot companion star’s radiation, which is not included in the models, or by clumping in stellar wind (e.g., Petrov et al. 2014). Recently, Mehner et al. (2010) attributed a decrease in the strength of emission lines to a decreasing mass-loss rate over time. This would be expected to shrink the H-forming region over time and make the FWHM of H similar to that of 643 nm. Our observations of the resolved H profile at the present epoch appear to be consistent with the earlier mass-loss rate derived by Hillier et al. (2001) and do not confirm a reduction in the overall mass-loss rate since then. Similarly, analysis of the continued monitoring of X-rays from the colliding wind emission in the Car system do not point to a reduction of the primary star’s mass-loss rate over time (Russell et al., 2016; Corcoran et al., 2017). Future diffraction-limited observations may be able to trace any possible variation in the mass-loss rate.
4. Summary
In 2016 and 2017, we used MagAO on the 6.5 m Clay telescope to perform fast-exposure lucky imaging toward the massive evolved star Carinae, using filters that sample H (656 nm) and the 643 nm continuum. Our diffraction-limited images show that Car is about 2.5–3 mas wider in H, which most likely comes from the line-emitting region in its stellar wind. We show that this H-forming region may have a size on the order of 12 mas, or 25–30 AU at the presumed distance of Car, in agreement with the stellar-wind model of Hillier et al. (2001).
We thank the referee for helpful comments. This material is based upon work supported by the National Science Foundation under grant No. 1506818 (PI Males) and NSF AAG grant No. 1615408 (PI Close). Y.-L.W. and L.M.C. are supported by the NASA Origins of Solar Systems award and the TRIF fellowship. N.S.’s research on Carinae and related LBV-like eruptions received support from NSF grant AST-1312221. K.M.M.’s and L.M.C.’s work is supported by the NASA Exoplanets Research Program (XRP) by cooperative agreement NNX16AD44G. This Letter includes data gathered with the 6.5 m Magellan Clay Telescope at Las Campanas Observatory, Chile.
The reference list from the paper itself. Each links out to its DOI / PubMed record.
- 1Chesneau et al. (2000) Chesneau, O., Roche, M., Boccaletti, A., et al. 2000, A&AS, 144, 523
- 2Close et al. (2012) Close, L. M., Males, J. R., Kopon, D., et al. 2012, Proc. SPIE, 8447, 84470 X
- 3Close et al. (2013) Close, L. M., Males, J. R., Morzinski, K., et al. 2013, Ap J, 774, 94
- 4Corcoran et al. (2017) Corcoran, M. F., Liburd, J., Morris, D., et al. 2017, Ap J, 838, 45
- 5Damineli (1996) Damineli, A. 1996, Ap J, 460, L 49
- 6Duncan & White (2003) Duncan, R. A., & White, S. M. 2003, MNRAS, 338, 425
- 7Duncan et al. (1999) Duncan, R. A., White, S. M., Reynolds, J. E., Lim, J. 1999, in ASP Conf. Ser. 179, Eta Carinae at the Millennium, ed. J. A. Morse, R. M. Humphreys, A. Damineli (San Francisco, CA: ASP), 54
- 8Groh et al. (2010) Groh, J. H., Madura, T. I., Owocki, S. P., Hillier, D. J., & Weigelt, G. 2010, Ap J, 716, L 223