The Survey of Lines in M31 (SLIM): The Drivers of the [CII]/TIR Variation
Maria Julia Kapala, Brent Groves, Karin Sandstrom, Thomas Jarrett,, Elisabete da Cunha, Kevin Croxall, Julianne Dalcanton, Bruce Draine, Simon, Glover, Eva Schinnerer

TL;DR
This study investigates the variation of the [CII]/TIR ratio in M31, revealing it is driven by the hardness of the absorbed stellar radiation field rather than intrinsic photoelectric efficiency changes.
Contribution
The paper demonstrates that [CII]/TIR variation in M31 is primarily due to radiation field hardness, not changes in PE efficiency, challenging its use as a direct proxy for PE efficiency.
Findings
[CII]/TIR correlates with the ratio of attenuated UV to total flux.
The PE efficiency, defined as [CII]/UV_att, remains constant at about 1.85%.
Variation in [CII]/TIR in other galaxies may be due to radiation field hardness.
Abstract
The ratio of the [CII] 158m emission line over the total infrared emission (TIR) is often used as a proxy for the photoelectric (PE) heating efficiency () of the far-ultraviolet (FUV) photons absorbed by dust in the interstellar medium. In the nearby galaxy M31, we measure a strong radial variation of [CII]/TIR that we rule out as being due to an intrinsic variation in . [CII]/TIR fails as a proxy for , because the TIR measures all dust heating, not just the contribution from FUV photons capable of ejecting electrons from dust grains. Using extensive multiwavelength coverage from the FUV to far-infrared (FIR), we infer the attenuated FUV emission (), and the total attenuated flux (). We find [CII]/TIR to be strongly correlated with /, indicating that, in M31 at…
Click any figure to enlarge with its caption.
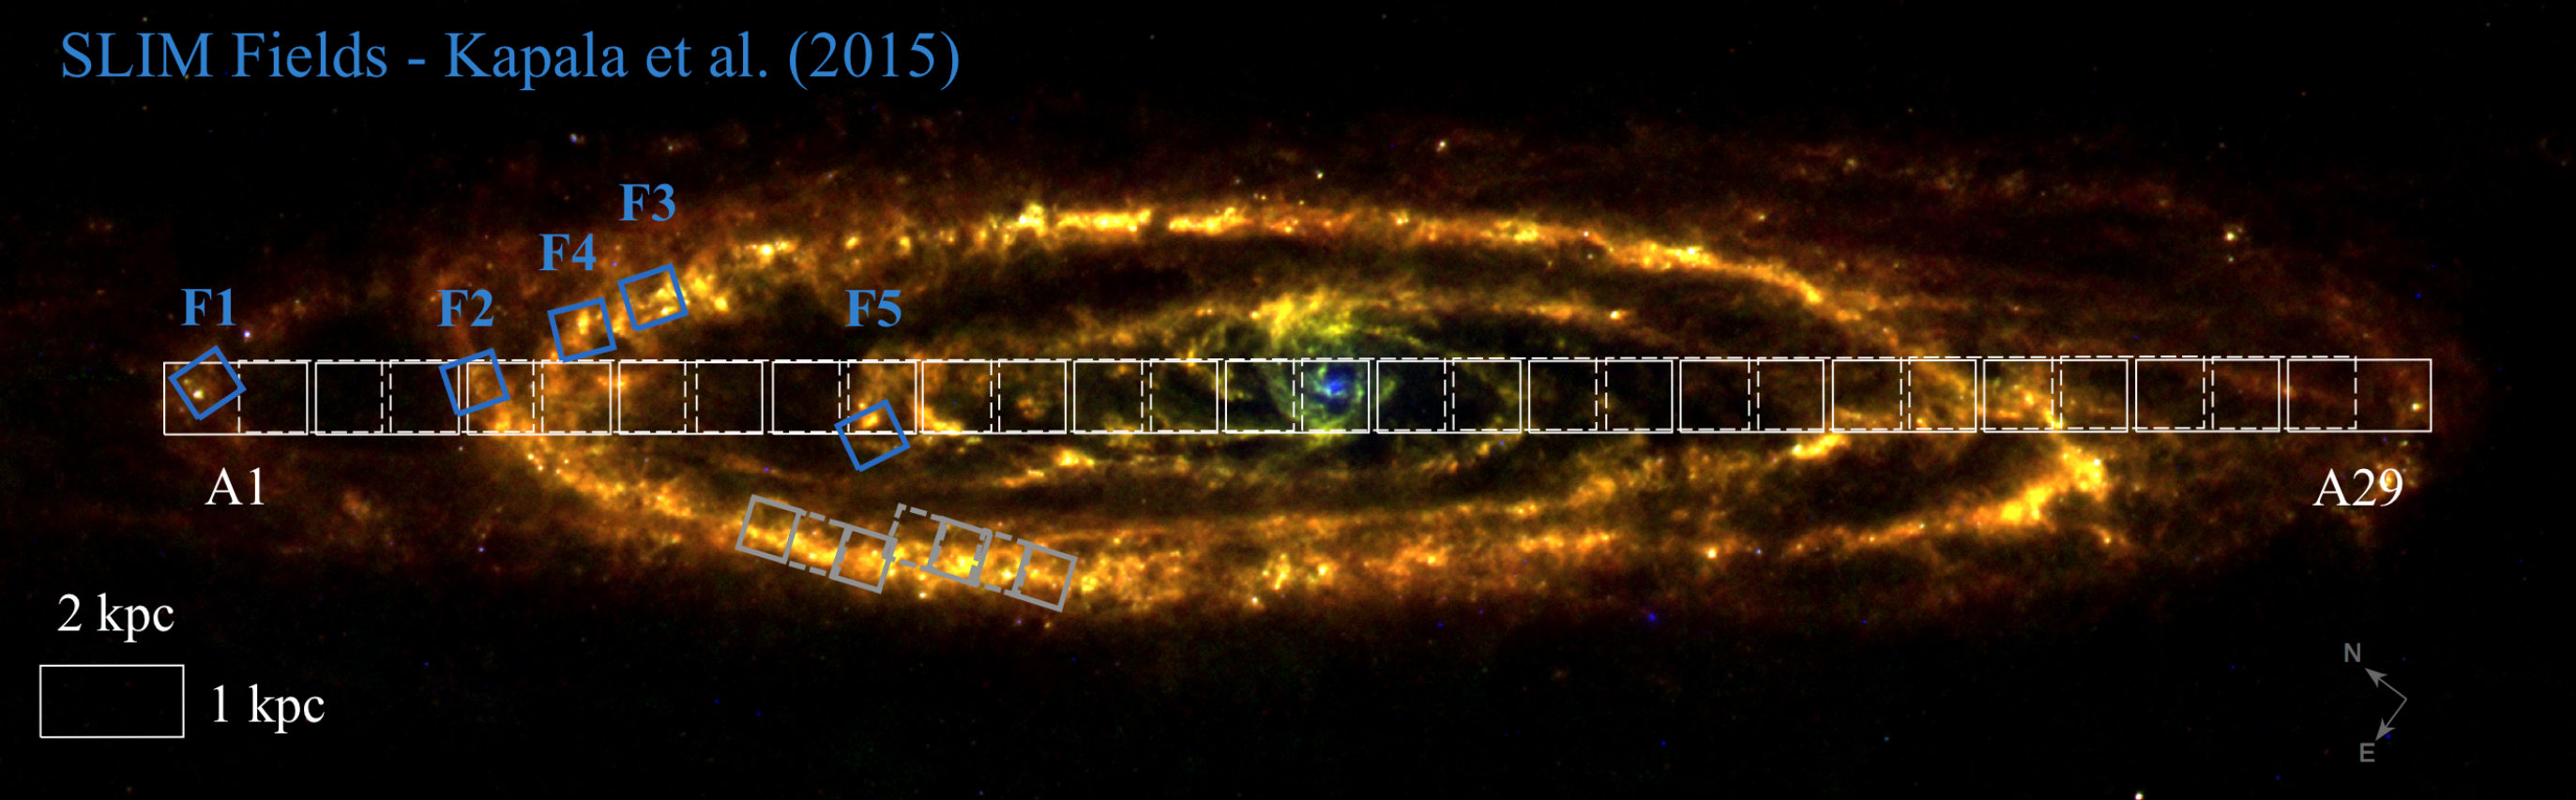 Figure 1
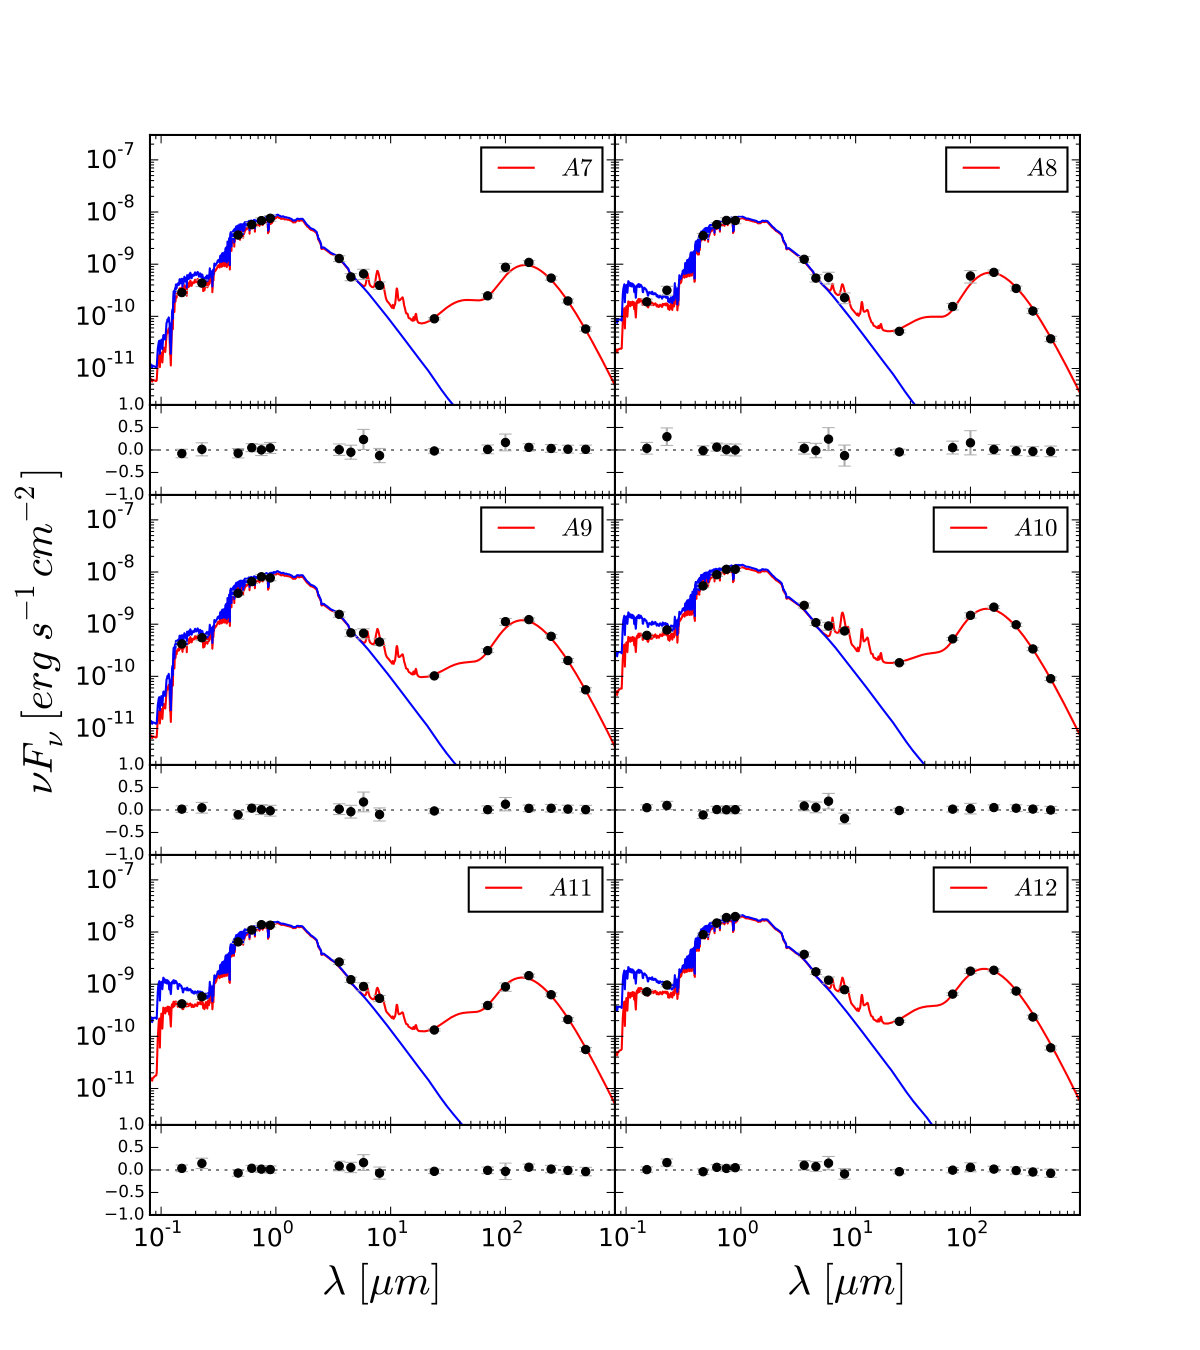 Figure 10
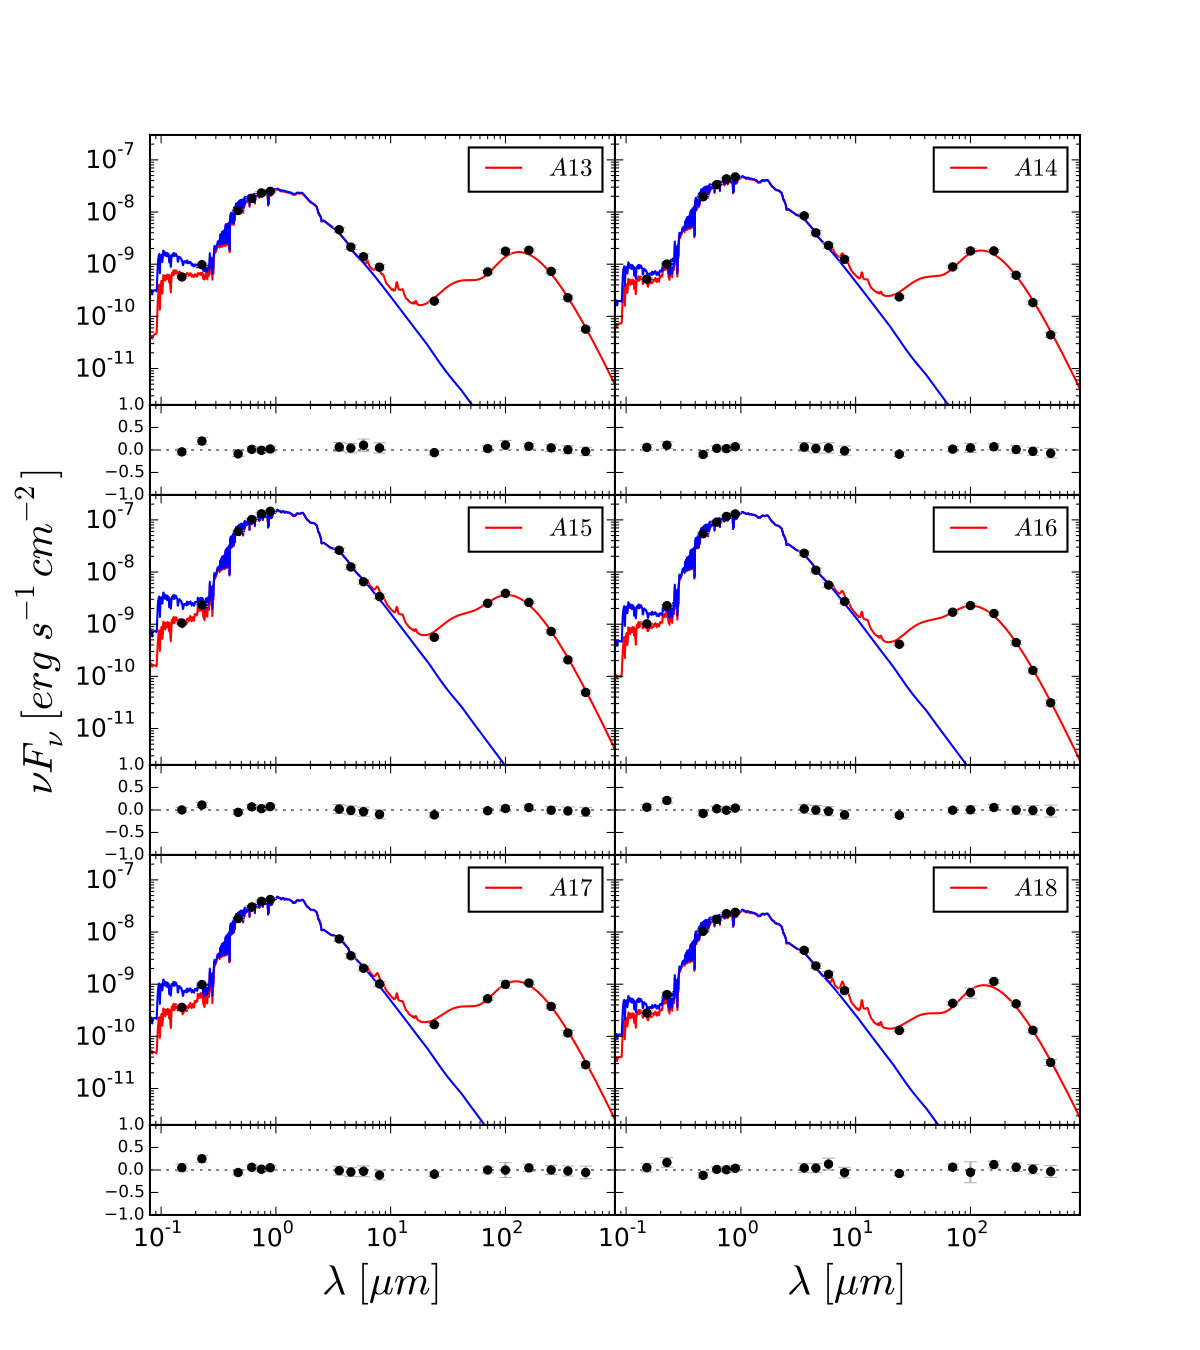 Figure 11
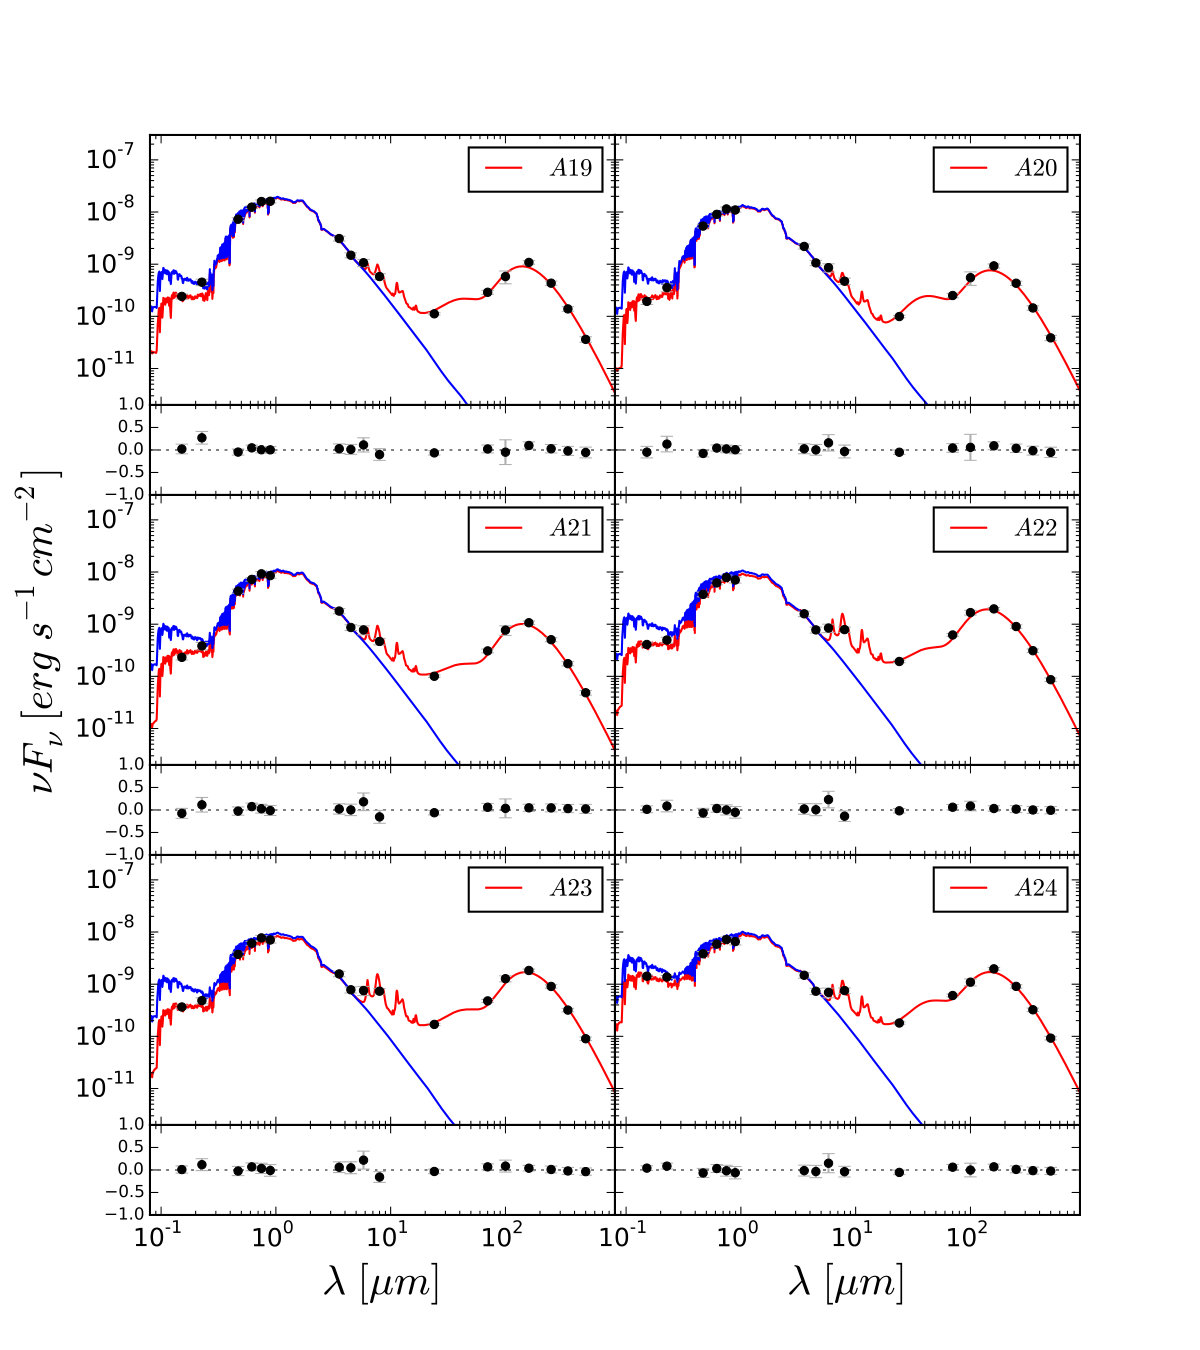 Figure 12
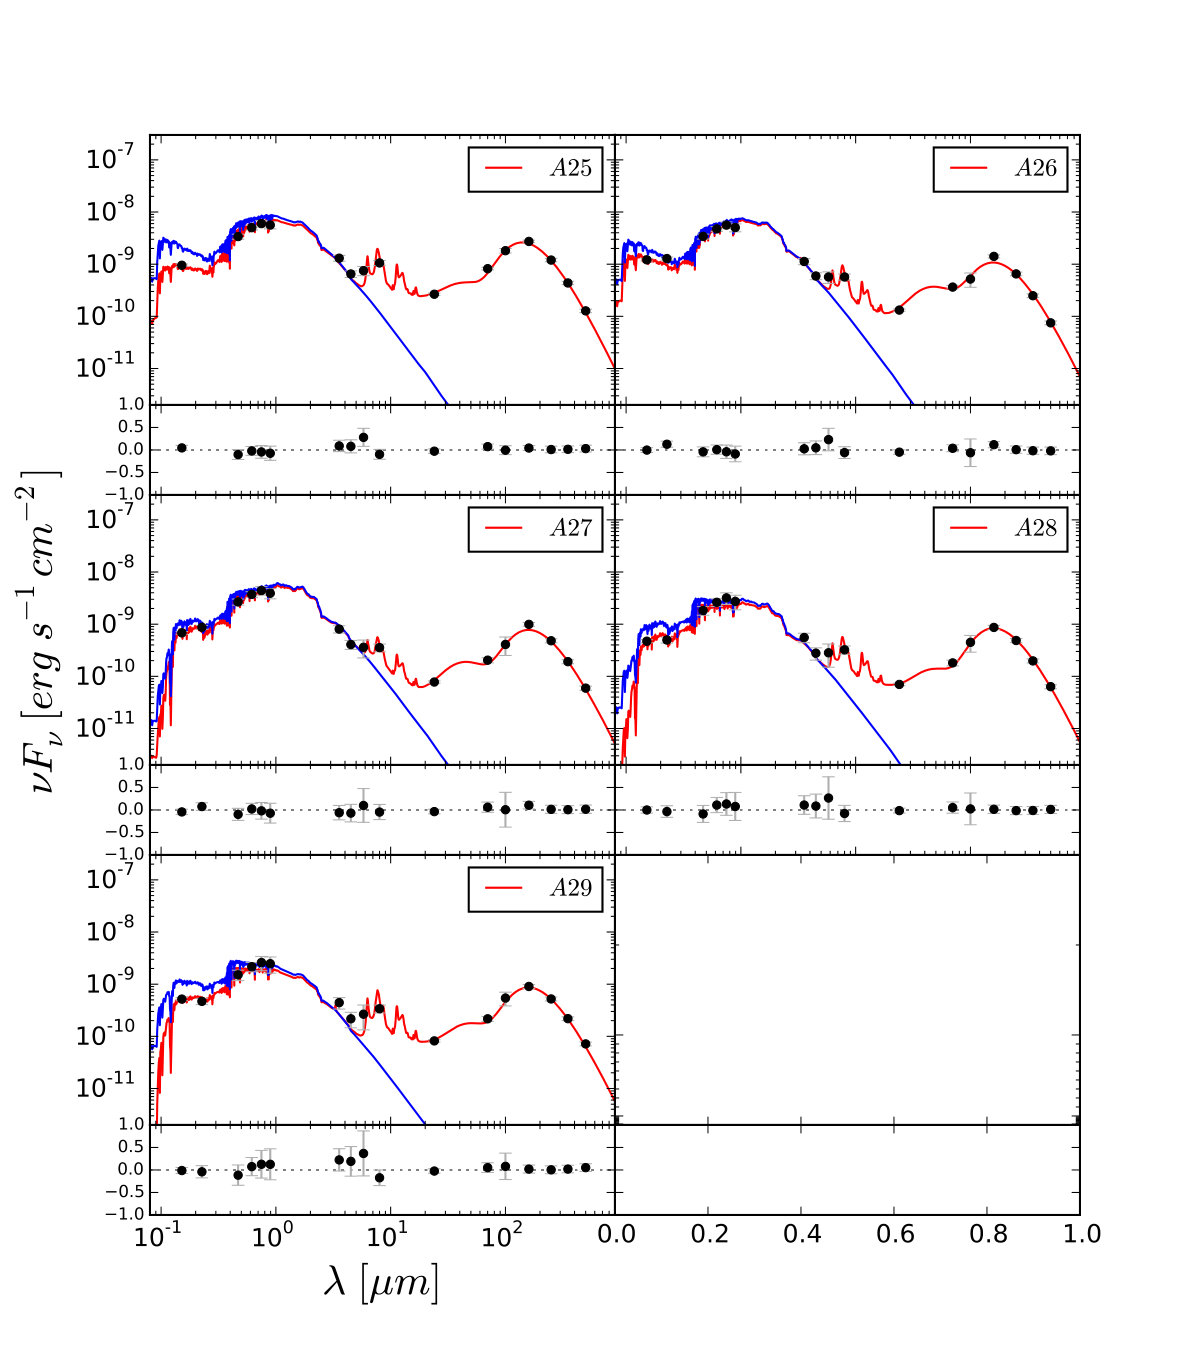 Figure 13
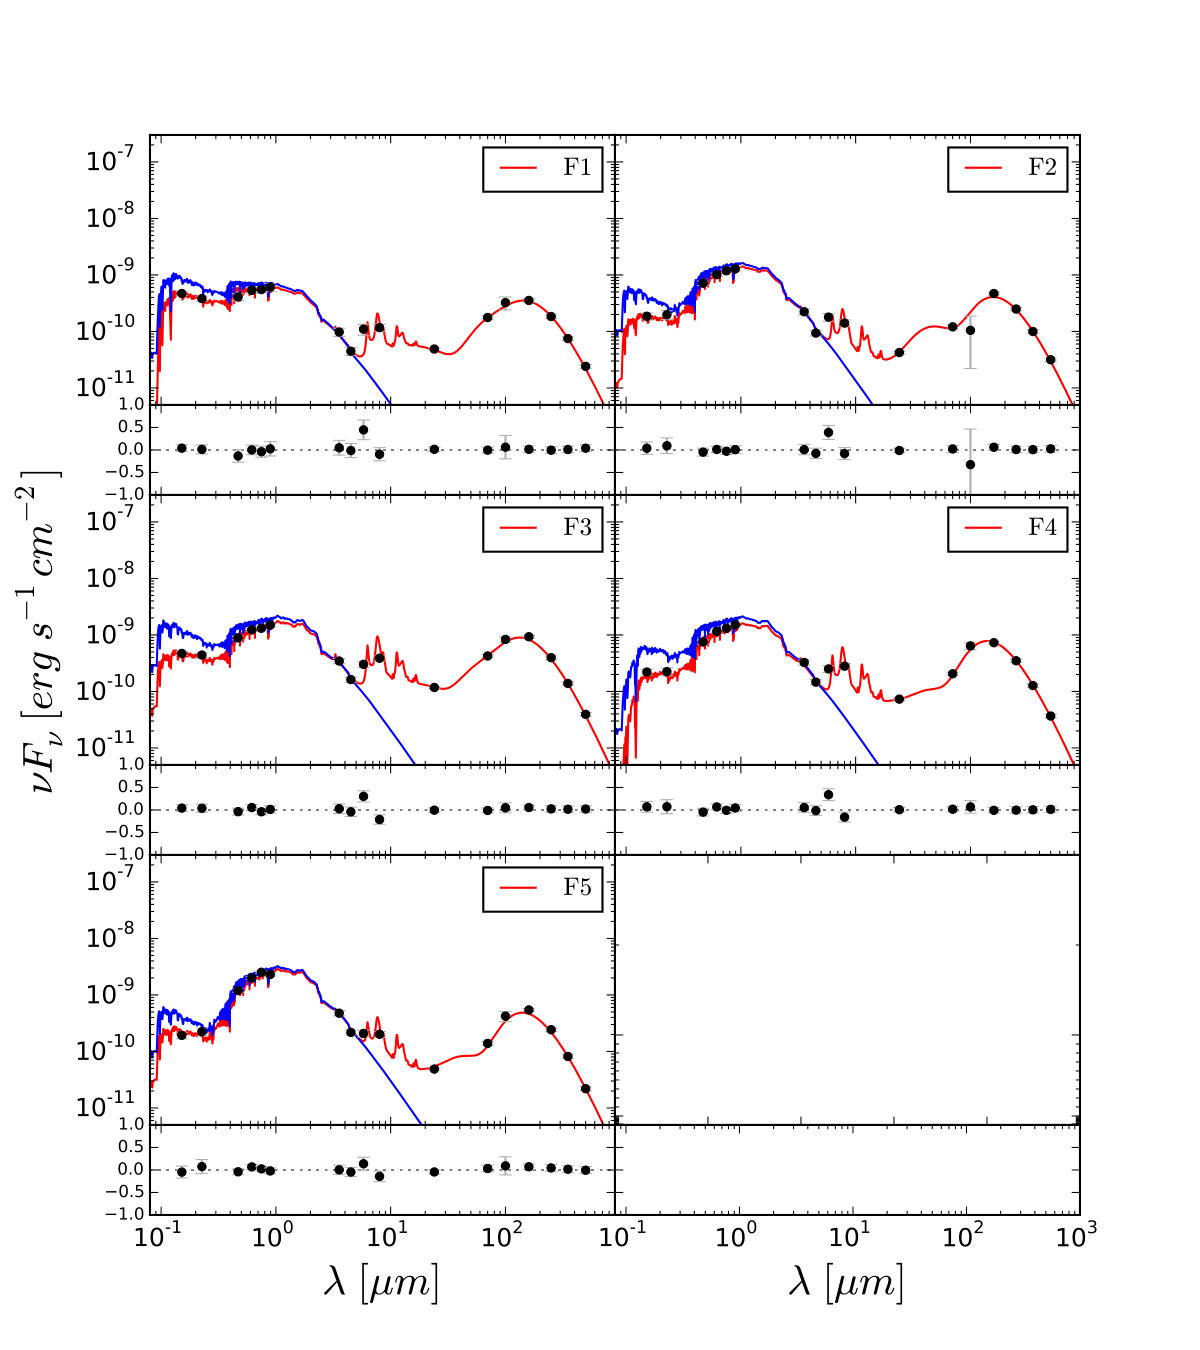 Figure 14
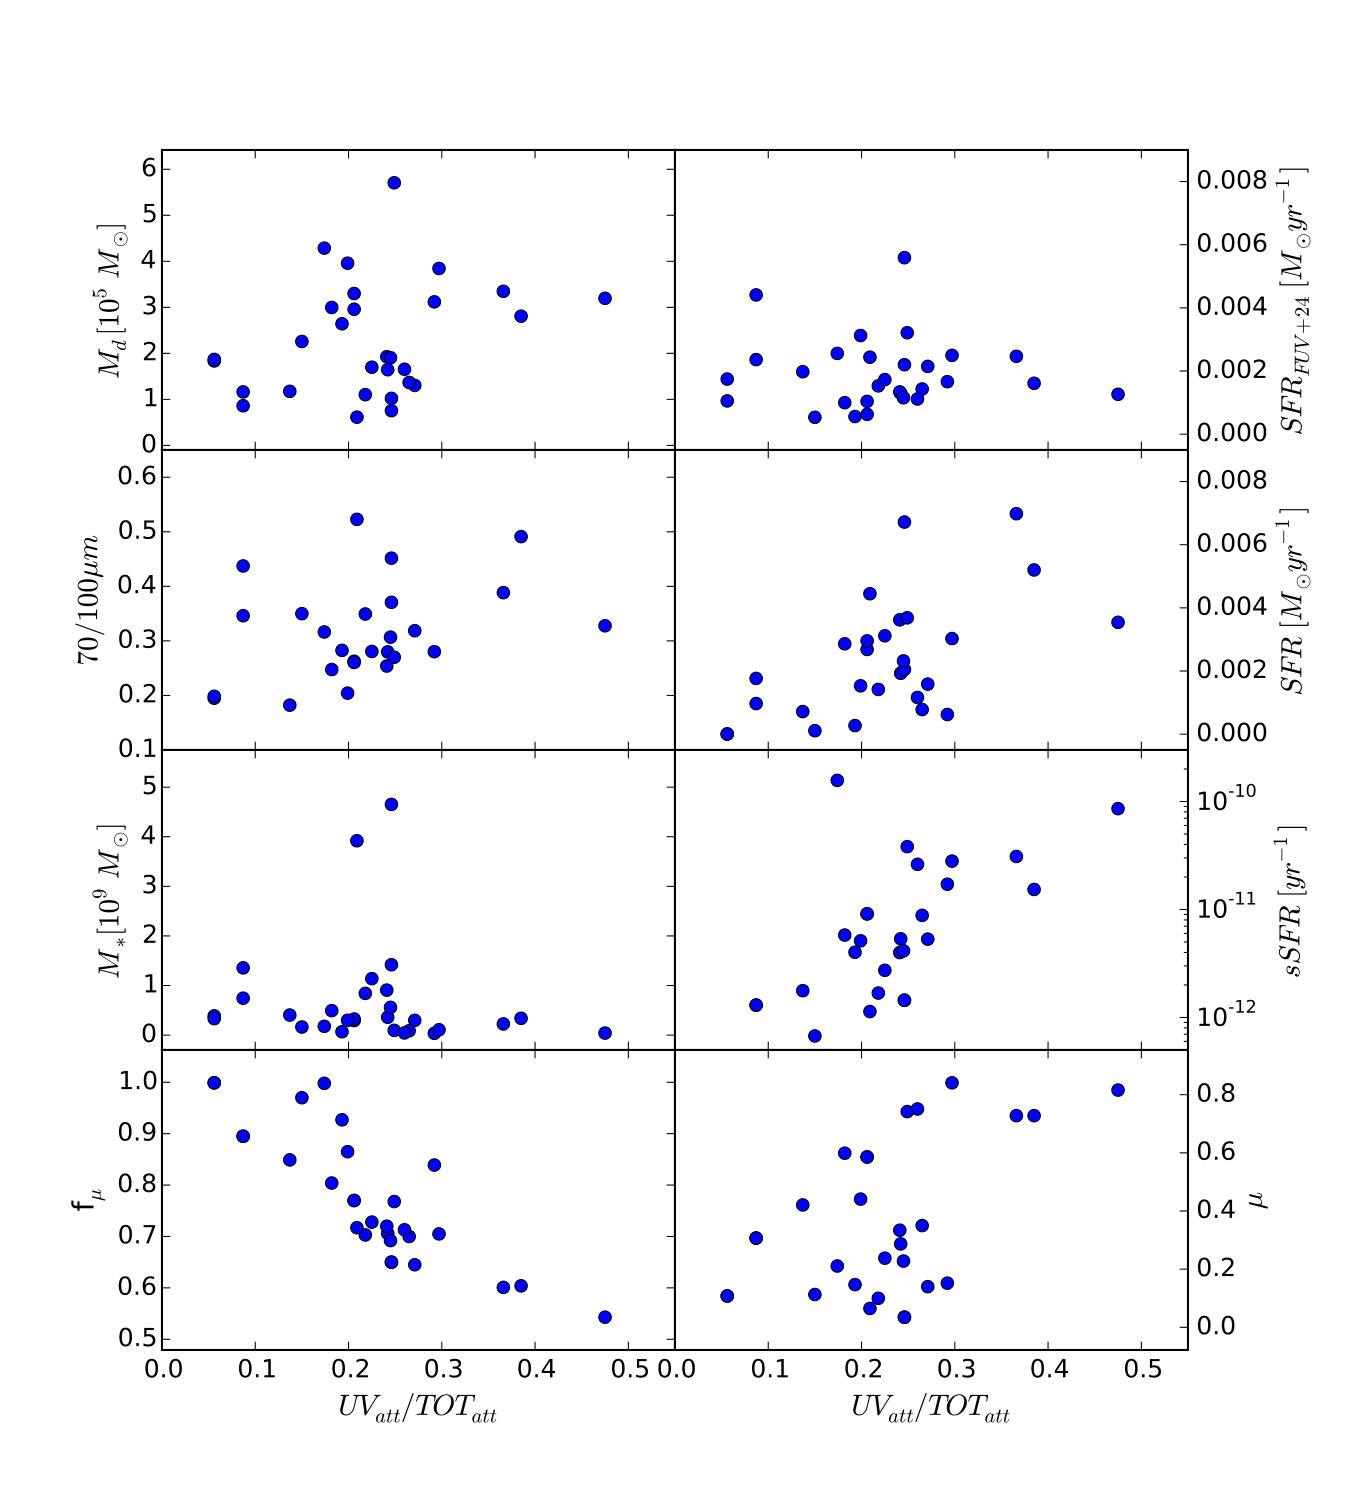 Figure 15
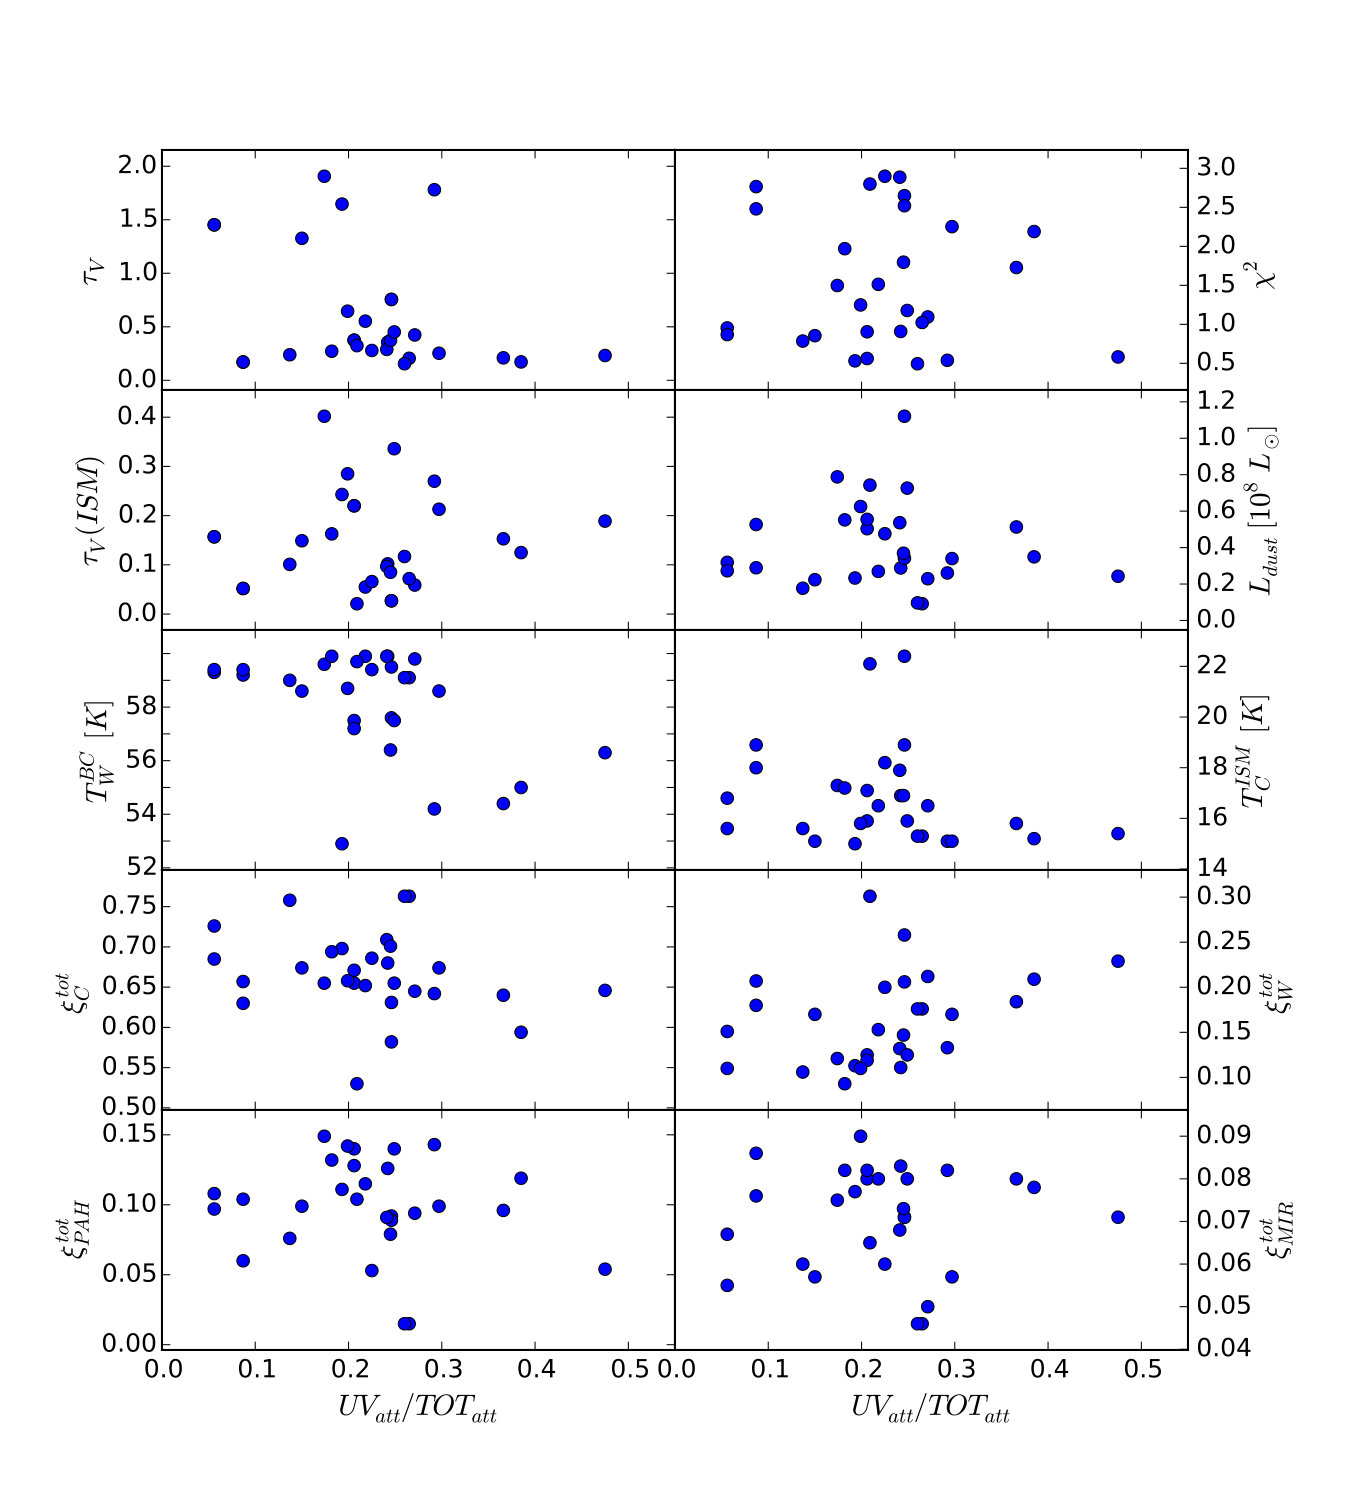 Figure 16
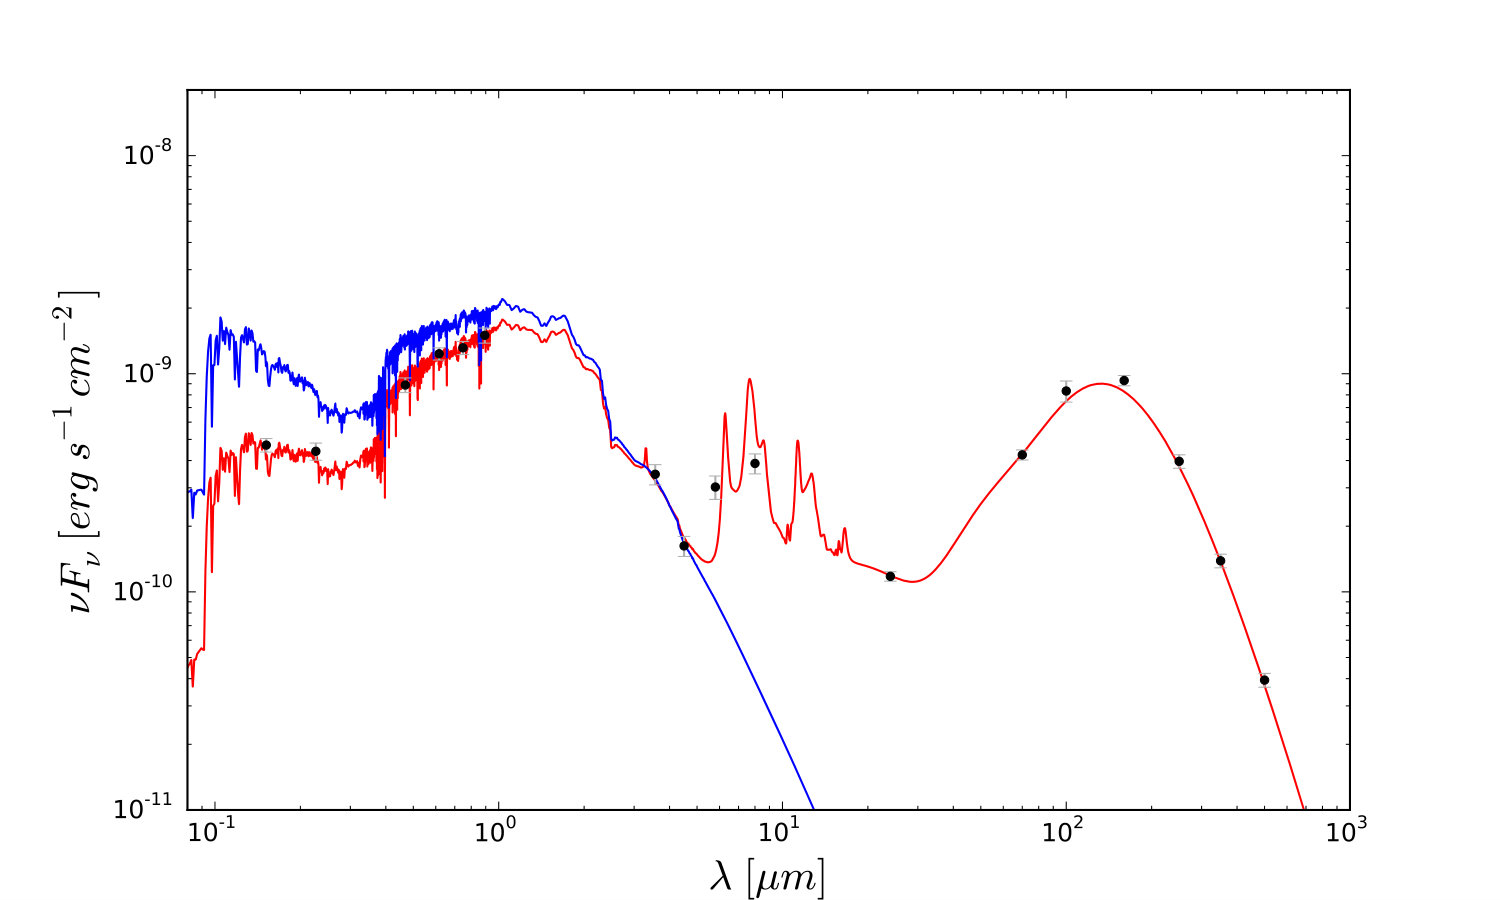 Figure 2
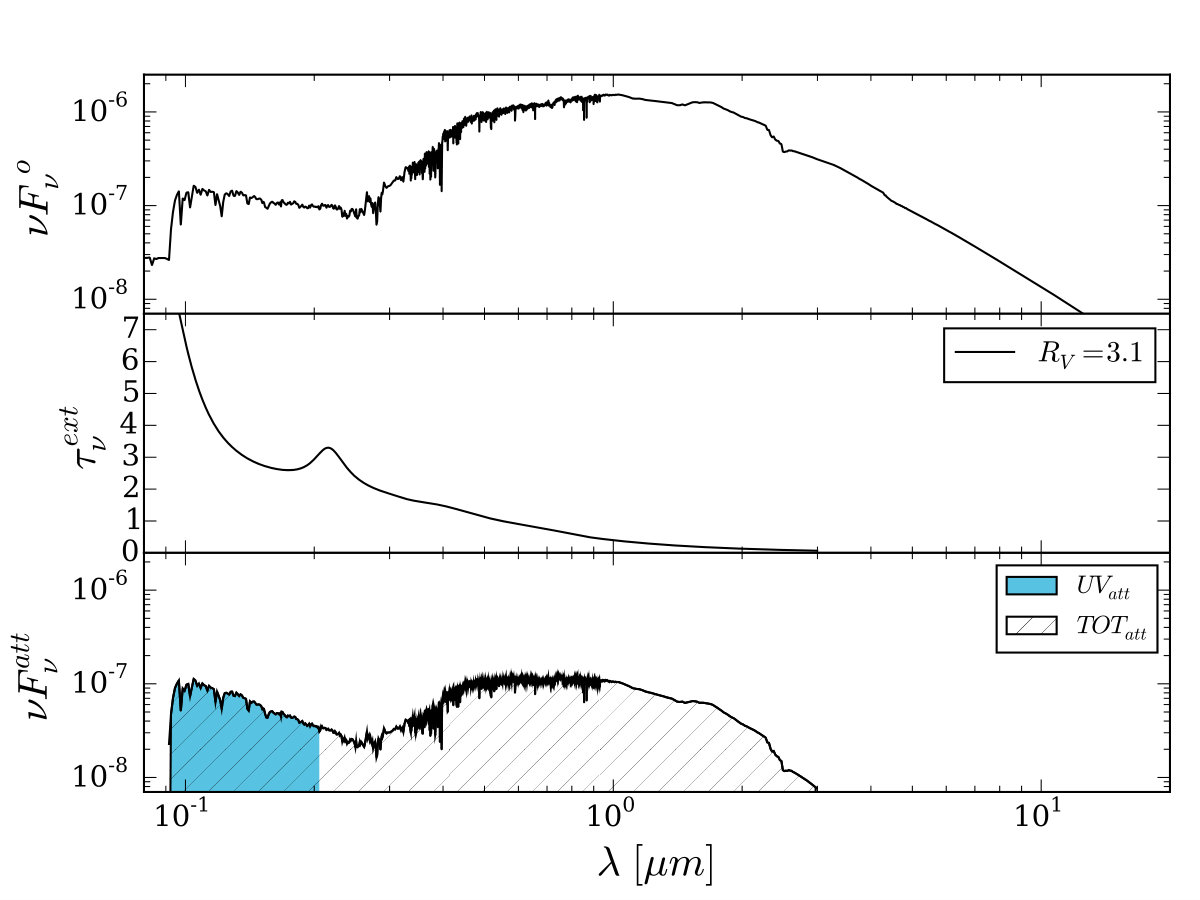 Figure 3
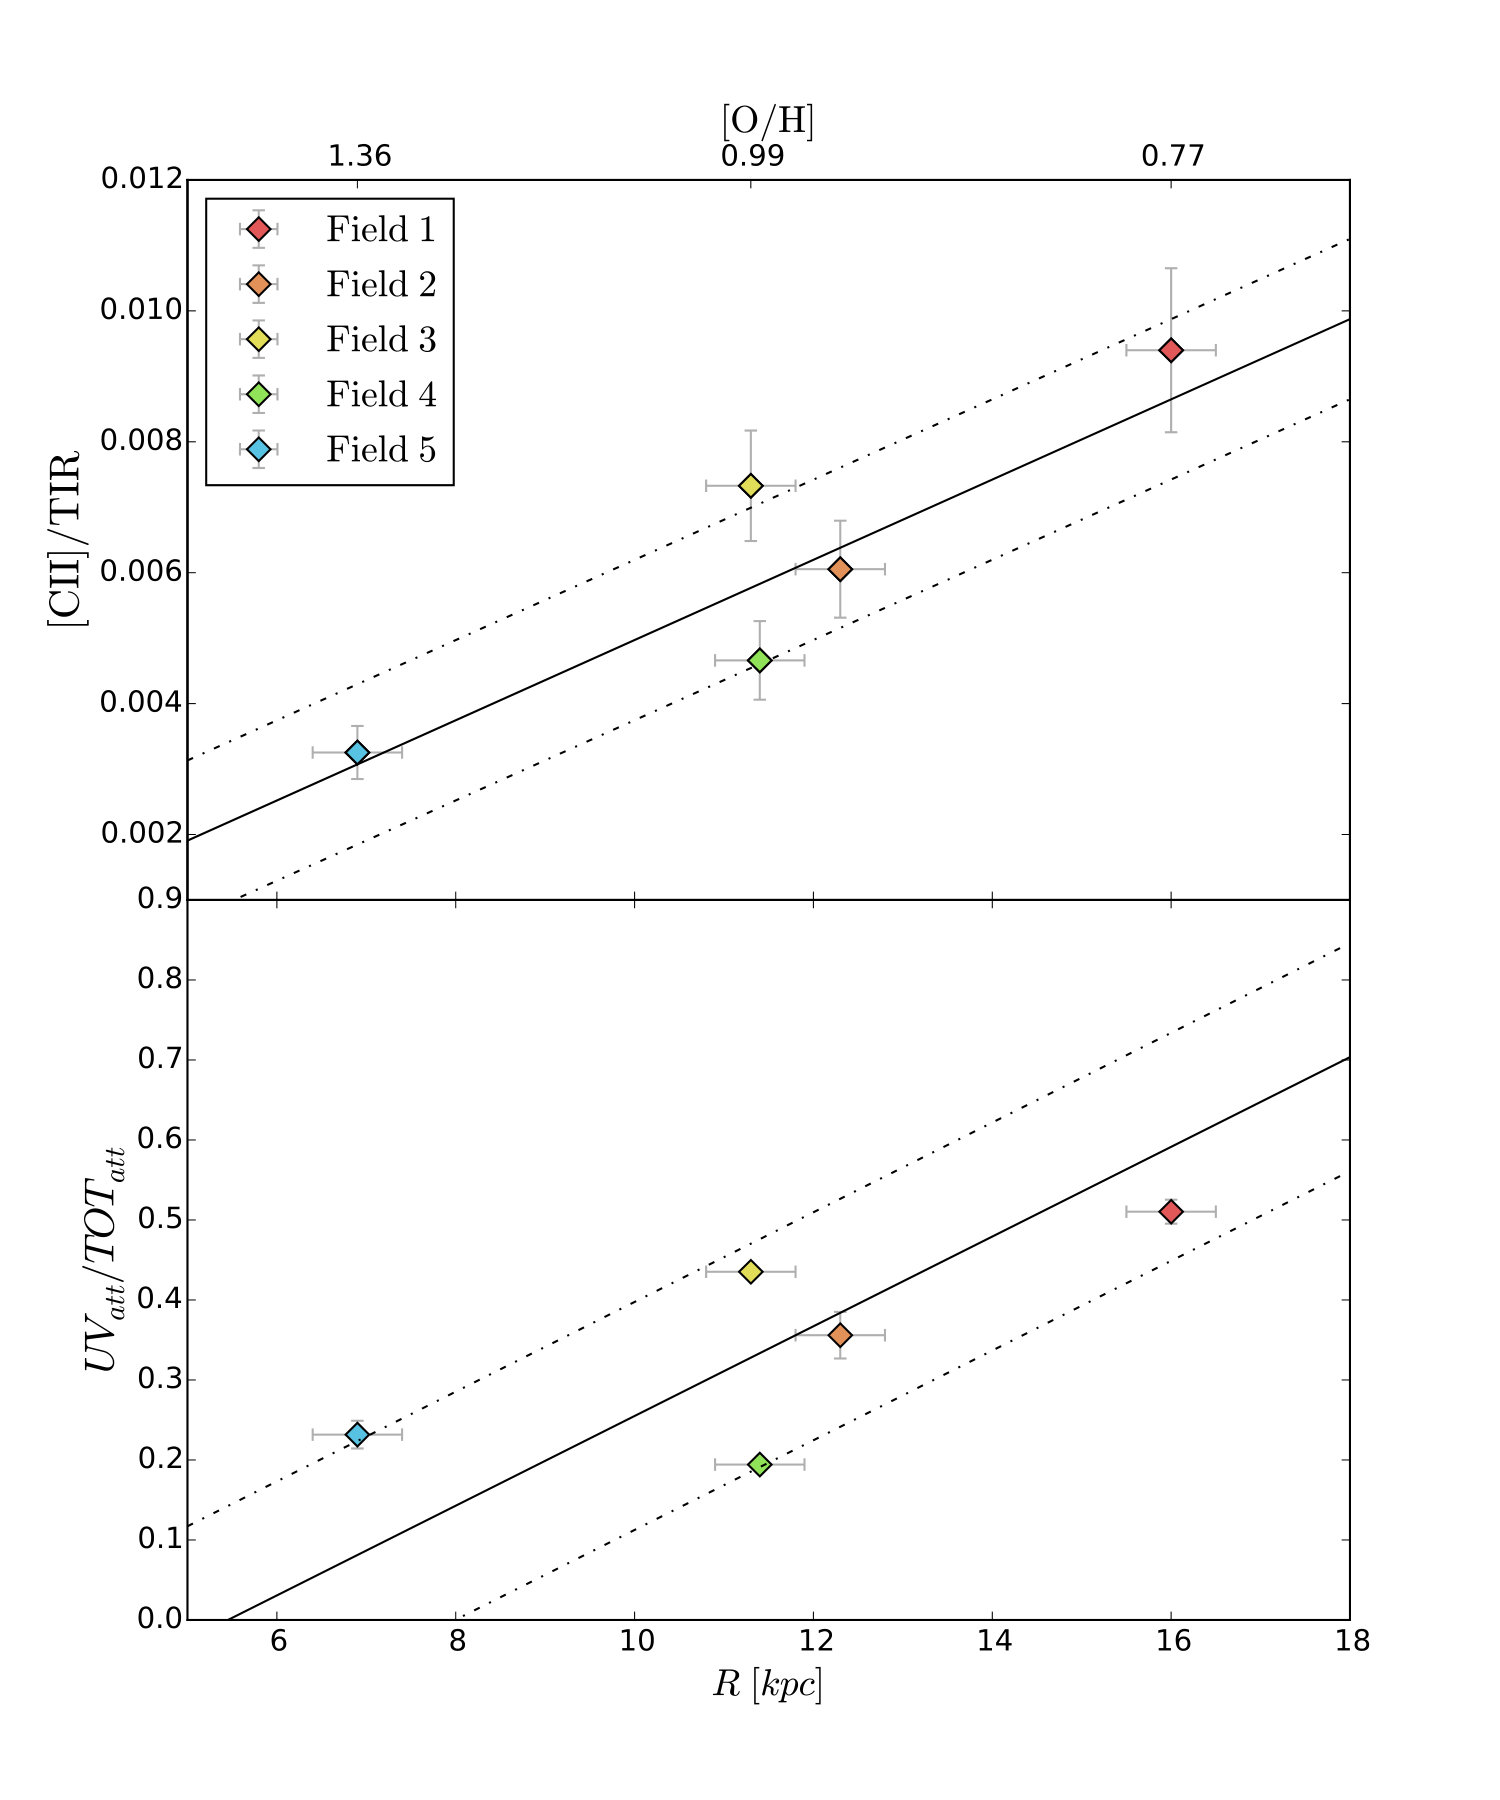 Figure 4
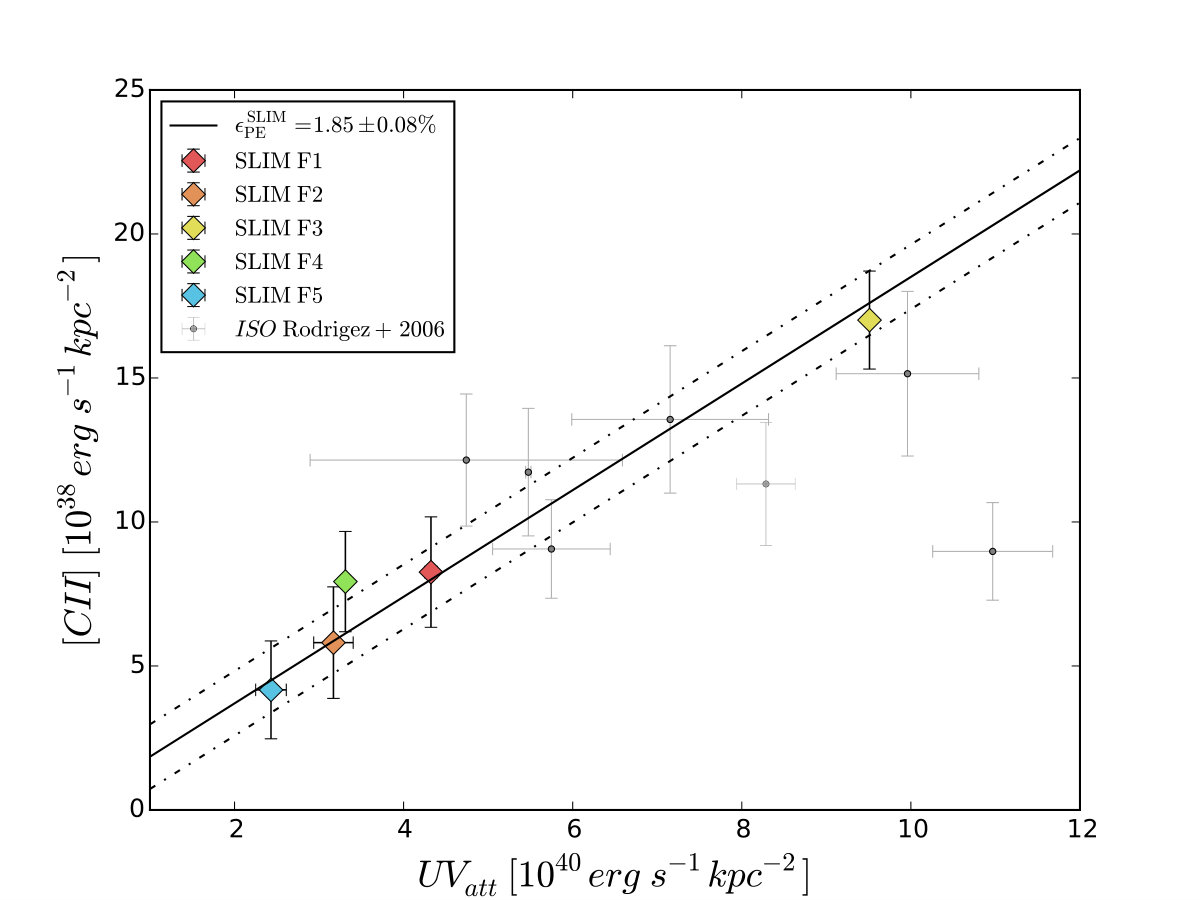 Figure 5
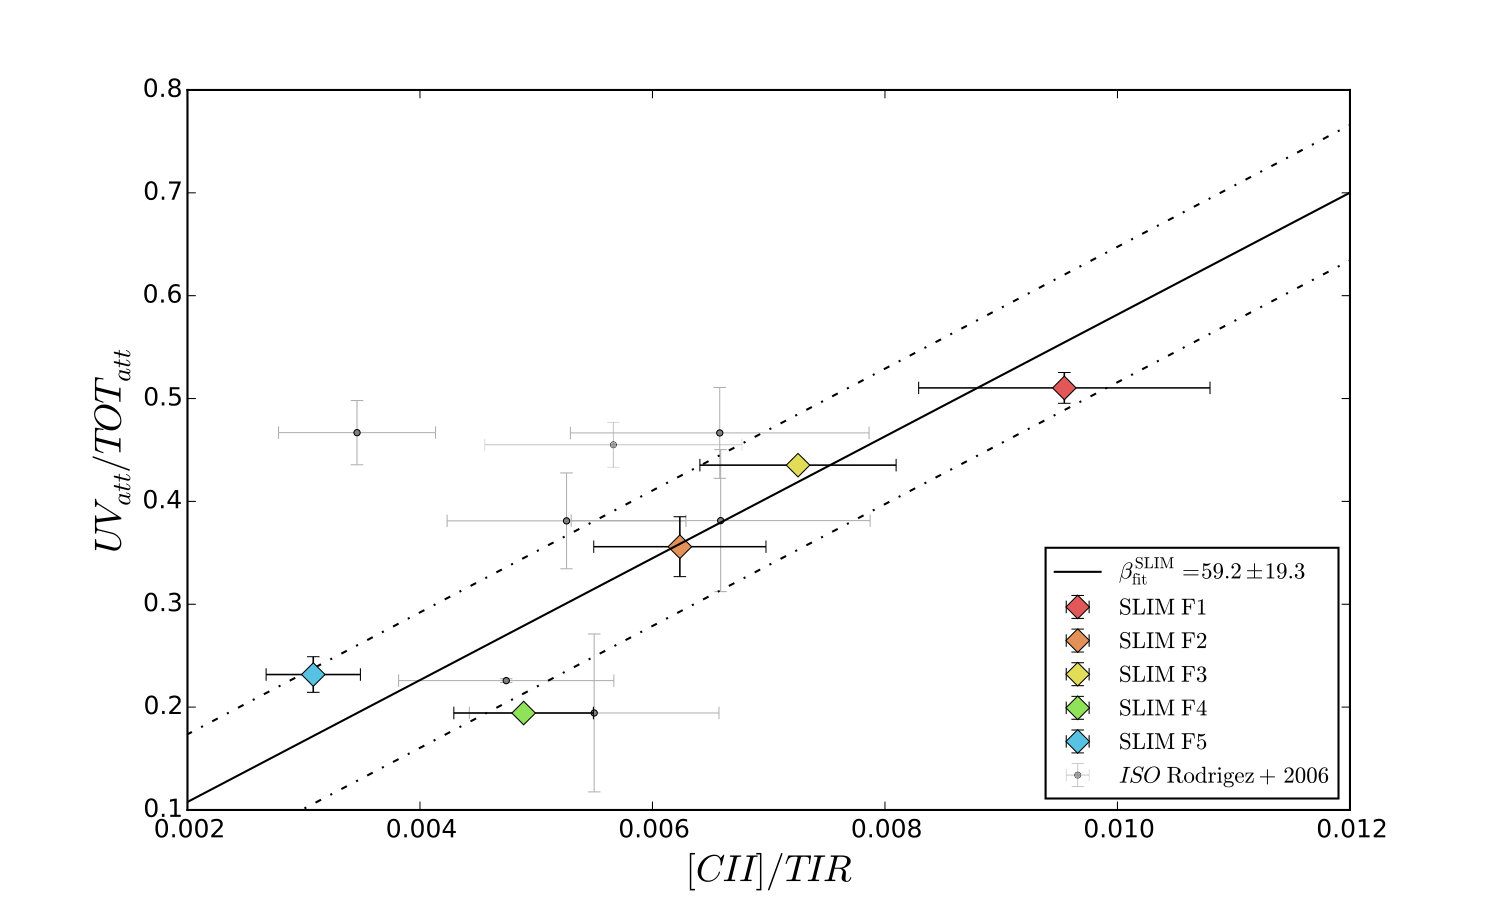 Figure 6
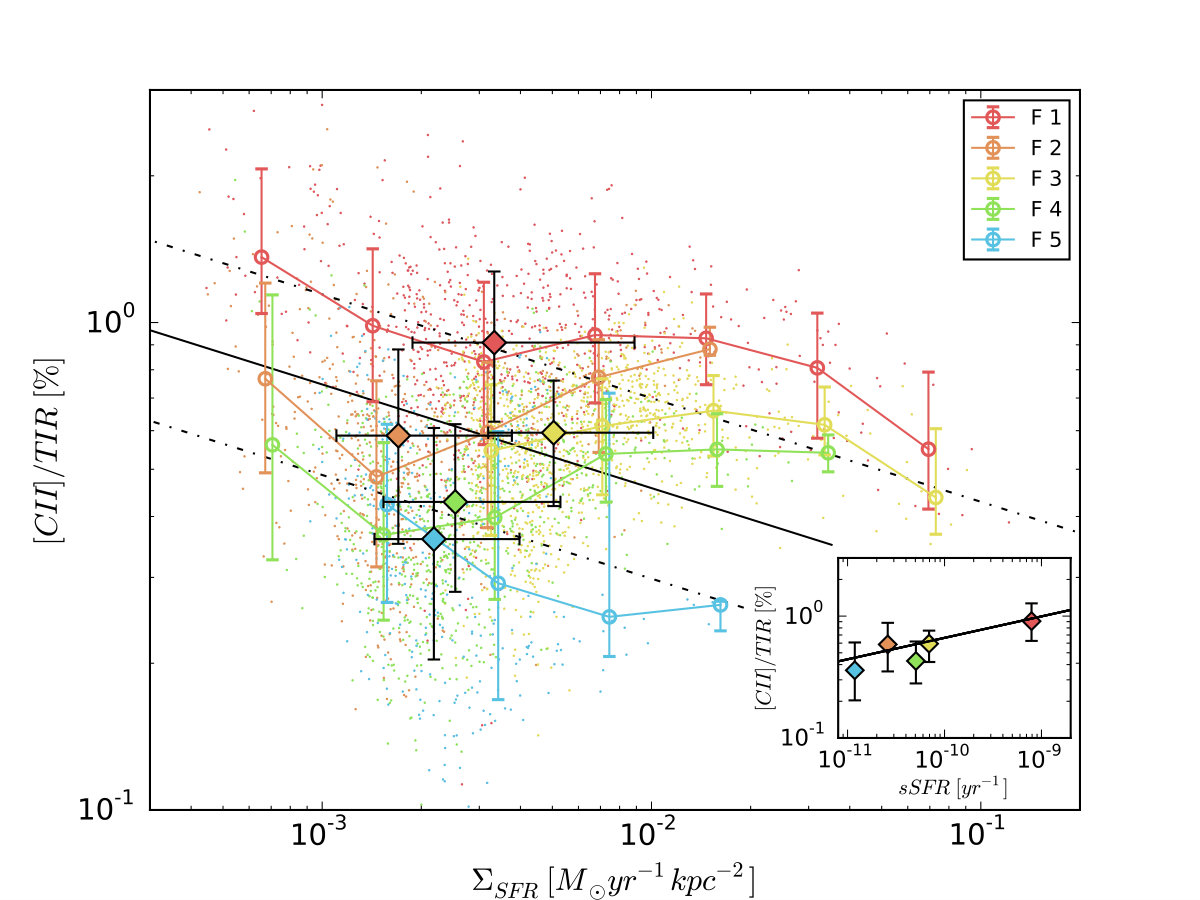 Figure 7
 Figure 8
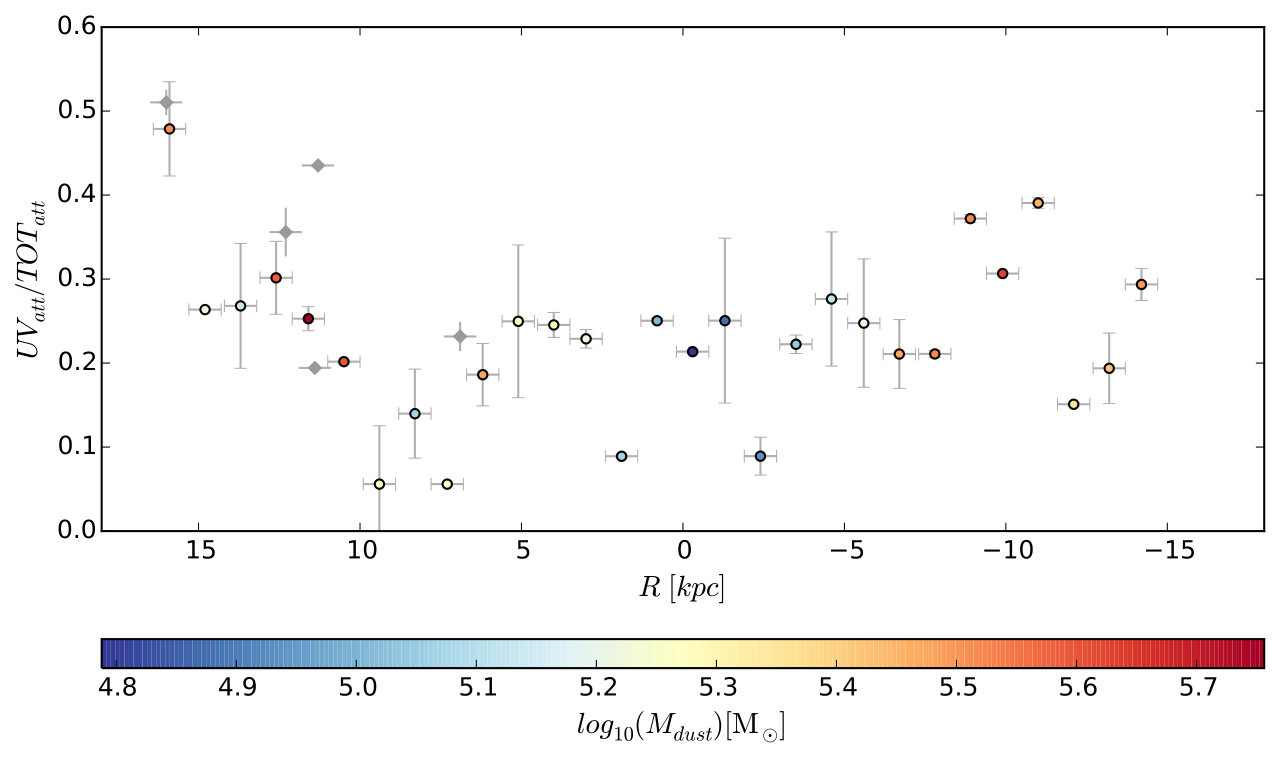 Figure 8
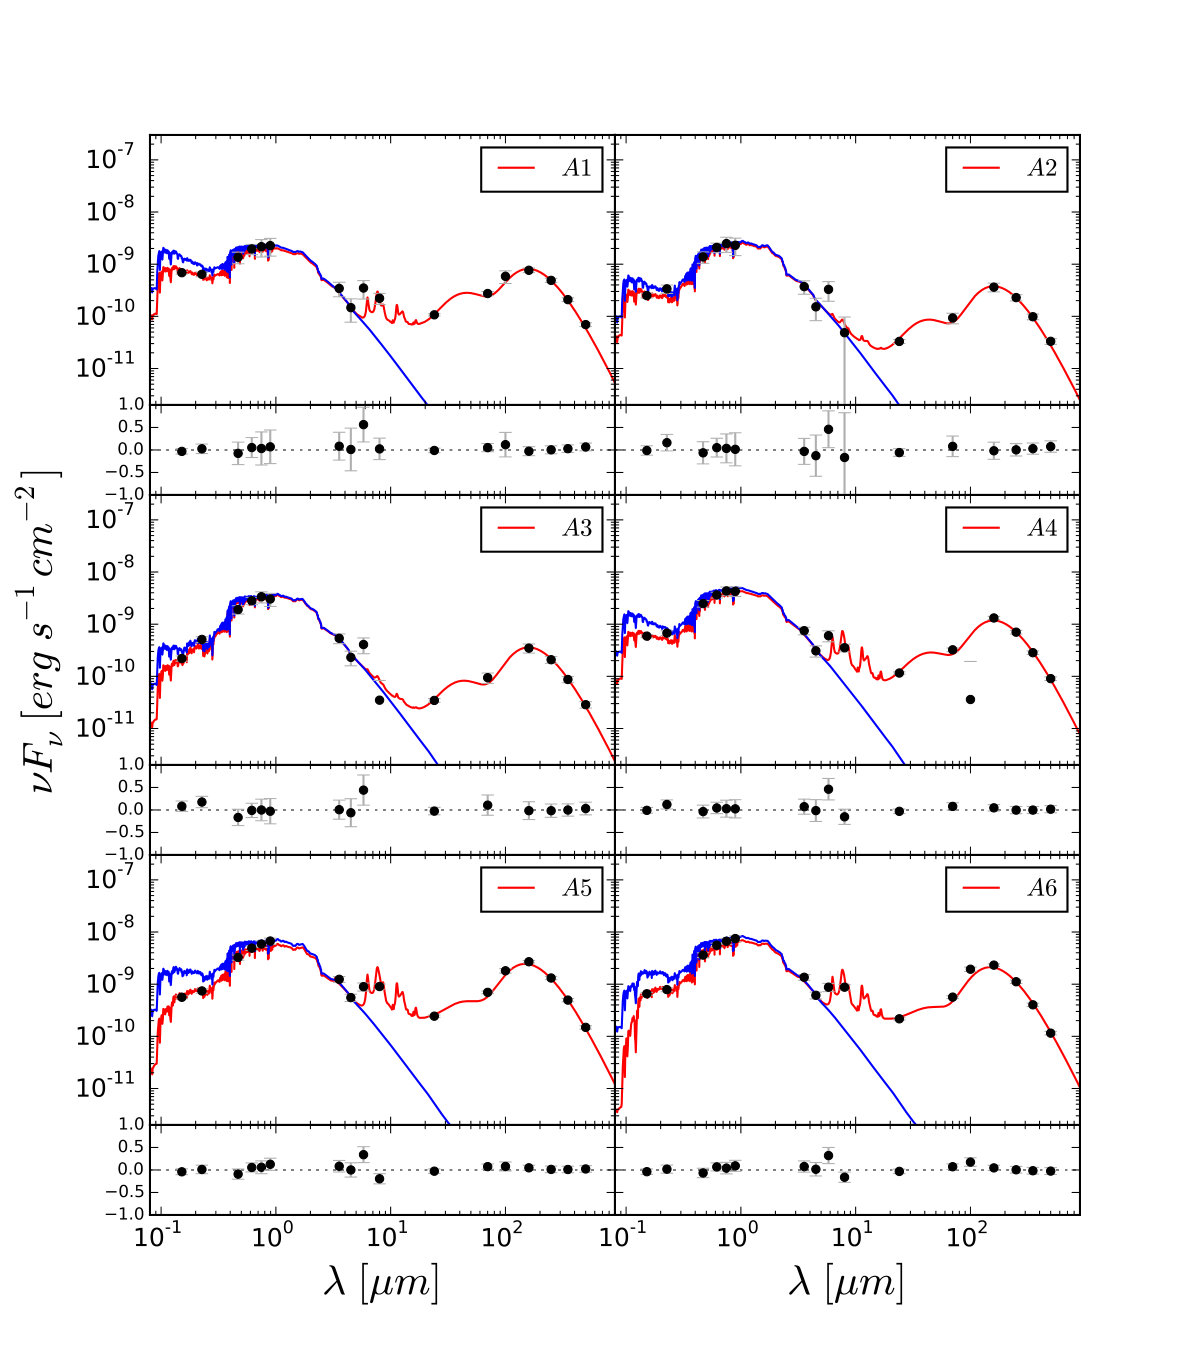 Figure 9
| Band | FWHM | Pix size | 1- | |
|---|---|---|---|---|
| noise | ||||
| FUV | 1516 Å | 40 | 1″ | 6.6 erg s-1 cm-2 |
| NUV | 2267 Å | 56 | 1″ | 2.8 erg s-1 cm-2 |
| SDSS u | 3543 Å | 1″ | 0396 | 0.21 MJy sr-1 |
| SDSS g | 4770 Å | 1″ | 0396 | 0.34 MJy sr-1 |
| SDSS r | 6231 Å | 1″ | 0396 | 0.43 MJy sr-1 |
| SDSS i | 7625 Å | 1″ | 0396 | 0.48 MJy sr-1 |
| SDSS z | 9134 Å | 1″ | 0396 | 1.46 MJy sr-1 |
| IRAC 1 | 3.6 | 166 | 12 | 21.2 mag arcsec-2 |
| IRAC 2 | 4.5 | 172 | 12 | 20.9 mag arcsec-2 |
| IRAC 3 | 5.8 | 188 | 12 | 19.0 mag arcsec-2 |
| IRAC 4 | 8.0 | 198 | 12 | 19.6 mag arcsec-2 |
| MIPS | 24 | 65 | 255 | 0.12 MJy sr-1 |
| 70 | 18″ | 998 | 0.21 MJy sr-1 | |
| PACSa | 70 | 56 | 1″ | 3.17 MJy sr-1 |
| 100 | 68 | 1″ | 3.23 MJy sr-1 | |
| 160 | 114 | 1″ | 2.29 MJy sr-1 | |
| SPIREa | 250 | 176 | 6″ | 0.68 MJy sr-1 |
| 350 | 249 | 10″ | 0.46 MJy sr-1 | |
| 500 | 363 | 14″ | 0.20 MJy sr-1 |
| F | R.A. | Dec. | P.A. | Observationa |
|---|---|---|---|---|
| (J2000) | (J2000) | [∘] | ID | |
| 1 | 70.7 | 1342236285 | ||
| 2 | 55.7 | 1342238390 | ||
| 3 | 55.0 | 1342238391 | ||
| 4 | 51.0 | 1342238726 | ||
| 5 | 63.0 | 1342237597 |
Peer Reviews
No public reviews on file for this paper yet. If you reviewed it on a platform where reviews are public (OpenReview, ICLR, NeurIPS, ICML), you can paste yours below so the community can read it here.
Videos
No videos yet. Explain this paper in a talk, walkthrough, or lecture? Add one.
The survey of lines in M 31 (SLIM): The Drivers of the [C ii]/TIR Variation
Maria J. Kapala11affiliation: University of Cape Town, Cape Town, Republic of South Africa 22affiliation: Max Planck Institute for Astronomy, Heidelberg, Germany , Brent Groves33affiliation: Research School of Astronomy & Astrophysics, Australian National University, Canberra, Australia , Karin Sandstrom44affiliation: Center for Astrophysics and Space Sciences, University of California, San Diego, USA , Thomas Jarrett11affiliation: University of Cape Town, Cape Town, Republic of South Africa , Elisabete da Cunha33affiliation: Research School of Astronomy & Astrophysics, Australian National University, Canberra, Australia , Kevin Croxall55affiliation: Department of Astronomy, Ohio State University, 140 West 18th Avenue, Columbus, USA 66affiliation: Illumination Works LLC, 5650 Blazer Parkway, Dublin, USA , Julianne Dalcanton77affiliation: University of Washington, Seattle, USA , Bruce Draine88affiliation: 108 Peyton Hall, Princeton University, Princeton, USA , Simon Glover99affiliation: Zentrum für Astronomie der Universität Heidelberg, Institut für Theoretische Astrophysik, Albert-Ueberle-Str. 2, 69120 Heidelberg, Germany , Eva Schinnerer22affiliation: Max Planck Institute for Astronomy, Heidelberg, Germany
Abstract
The ratio of the [C ii] 158m emission line over the total infrared emission (TIR) is often used as a proxy for the photoelectric (PE) heating efficiency () of the far-ultraviolet (FUV) photons absorbed by dust in the interstellar medium. In the nearby galaxy M 31, we measure a strong radial variation of [C ii]/TIR that we rule out as being due to an intrinsic variation in . [C ii]/TIR fails as a proxy for , because the TIR measures all dust heating, not just the contribution from FUV photons capable of ejecting electrons from dust grains. Using extensive multiwavelength coverage from the FUV to far-infrared (FIR), we infer the attenuated FUV emission (), and the total attenuated flux (). We find [C ii]/TIR to be strongly correlated with /, indicating that, in M 31 at least, one of the dominant drivers for [C ii]/TIR variation is the relative hardness of the absorbed stellar radiation field. We define , [C ii]/ which should be more closely related to the actual PE efficiency, which we find to be essentially constant () in all explored fields in M 31. This suggests that part of the observed variation of [C ii]/TIR in other galaxies is likely due to a change in the relative hardness of the absorbed stellar radiation field, caused by a combination of variations in the stellar population, dust opacity and galaxy metallicity, although PE efficiency may also vary across a wider range of environments.
1. Introduction
The balance between radiative heating and cooling dictates the multiphase structure of the ISM, which in turn controls the process of star formation (SF). Understanding the energy balance of the interstellar medium (ISM) is therefore an essential step towards understanding the processes which shape the evolution of galaxies. The photoelectric (PE) effect on dust grains is the dominant heating mechanism in the neutral ISM, in particular the diffuse gas and dense photodissociation regions (PDRs) surrounding H ii regions (Weingartner & Draine, 2001; Wolfire et al., 2003). While interstellar dust absorbs both ultraviolet (UV) and visible photons, electrons are ejected from dust grains only by photons with energy exceeding the energy threshold, , the sum of the work function and the Coulomb potential (i.e. eV, equivalent to Å; Draine, 1978; Tielens & Hollenbach, 1985). Any excess energy is carried by the kinetic energy of the photoejected electron, heating the surrounding ISM. There has been much analytic work done on the topic of the PE effect (Watson, 1972; Draine, 1978; Tielens & Hollenbach, 1985; Bakes & Tielens, 1994; Weingartner & Draine, 2001) since Spitzer (1948) first considered it as an important heating mechanism.
The probability that absorption of a photon will result in a photoelectron is a function of the energy of the incident photon , the composition and size of the grain, and the charge of the grain before the event. Following Tielens (2008), we define the theoretical photoelectric heating efficiency as:
[TABLE]
where and indicate the photoelectric heating rate and the grain FUV absorption rate, respectively. Estimates of the photoelectric heating efficiency typically lie in the range (Bakes & Tielens, 1994; Weingartner & Draine, 2001). Its value within this range depends on the relative effectiveness of grain photoionization and recombination, and hence on the parameter (where G0 is the interstellar radiation field strength integrated between 6 and 13.6 eV in units of the Habing (1968) field, is the gas temperature and ne is the electron density).
The [C ii] 158 emission line is the dominant coolant in the bulk of the neutral interstellar medium (Hollenbach et al., 1991), with the exception of the high density and high temperature regime where [O i] 63 emission can become a dominant coolant (e.g. Kaufman et al., 1999). [C ii] is one of the brightest emission lines in most galaxies. It is a forbidden fine-structure line arising from singly ionized carbon C+ ( ). Due to its wavelength and brightness, it is detectable out to high redshifts (Walter et al., 2009; Maiolino et al., 2015; Capak et al., 2015; Willott et al., 2015) with millimeter telescopes.
One of the driving reasons to examine the [C ii] line is its potential to trace star formation rates (SFRs) out to high redshift (Carilli & Walter, 2013). Empirically, the correlation between [C ii] and SFR is close to one-to-one on kpc scales in nearby galaxies (De Looze et al., 2011, 2014; Herrera-Camus et al., 2015). Theoretically, the basis for [C ii] as a SFR indicator relies upon it being the dominant coolant of a neutral ISM heated by massive stars, associated with recent star formation ( few yr), through the PE effect.
Unfortunately, there are potential issues with [C ii] as a SFR tracer. First, C+ has a lower ionization potential than hydrogen at 11.2 eV, and thus [C ii] emission can arise from different interstellar medium phases: the cold and warm neutral medium (CNM and WNM, respectively), and the warm ionized medium (WIM). Therefore, there might be a different proportionality between [C ii] and SFR in different phases if other coolants (e.g. the [O i] 63 emission line) or heat sources (e.g., photons from older stars, cosmic-rays, or X-rays from an AGN) are in play. Second, if the PE heating efficiency is variable or evolves with redshift, the use of [C ii] as a SFR tracer may be complicated. Understanding the efficiency of PE heating is therefore crucial for establishing [C ii] as a robust star formation indicator.
Unfortunately, cannot be directly observationally measured. Instead, the most commonly used approximation of the photoelectric heating efficiency is based on observable properties:
[TABLE]
where the ’s are the heating rates of the gas and the dust, and is the fraction of the total gas cooling that is due to [C ii] (Mochizuki, 2004). This approximation works under the assumption that the ISM is in steady state (heating equals cooling), and that the [C ii] emission dominates neutral gas cooling, so that The latter assumption is reasonable in low density gas (e.g. Wolfire et al., 2003), but in the high density and temperature regime [O i] 63 emission can become a dominant coolant, and so in some studies, [C ii]+[O i] is used in place of [C ii] as the numerator in Equation 2 (see e.g. Croxall et al., 2012; Cormier et al., 2015). The dust is assumed to be in thermal equilibrium, so that its heating rate can be derived by integrating its continuum emission. Since this emission is almost exclusively located in the infrared, it is generally sufficient to compute the total infrared emission of the dust, TIR, as an approximation of .
As mentioned above, neutral gas heating arises predominantly due to collisions with photoelectrons ejected by FUV photons (6–13.6 eV), while dust heating arises due to absorption of photons of all energies (mostly 0.01–13.6 eV). Therefore, we emphasize here that the [C ii]/TIR approximation diverges from the theoretical definition (Eq. 1), since soft optical photons which have energies below the work threshold heat the dust but do not contribute to the PE effect. Thus, is sensitive to the ratio of the soft photons (transferring energy only to dust) to FUV photons (transferring energy to both dust and gas). A similar issue has been raised by Okada et al. (2013), for deriving from the TIR , where they show that only of the total stellar radiation emitted by a B9 star is in the 6–13.6 eV energy range, based on the Castelli & Kurucz (2004) stellar atmosphere model.
Nevertheless, [C ii]/TIR has been extensively used as a proxy for PE heating efficiency in the last 25 years. Studying this ratio led to the discovery of the so called “[C ii] deficit”, defined as [C ii]/TIR declining with warmer dust color (a proxy for dust temperature; Malhotra et al., 2001), or as simply [C ii]/TIR values below (Helou et al., 2001). The observed “[C ii] deficit”, typically treated as a reduction of the PE efficiency, has been explained to arise by several possible mechanisms, including an increase in the mean grain charge (and Coulomb potential ), and therefore a higher Ethr for photoelectron ejection (Malhotra et al., 2001; Croxall et al., 2012), the depletion of polycyclic aromatic hydrocarbons (PAHs; very efficient contributors of photoelectrons) relative to larger dust grains (Helou et al., 2001), or a significant fraction of the TIR arising from dusty H ii regions, where [C ii] is not the dominant coolant (Luhman et al., 2003; Graciá-Carpio et al., 2011).
Many recent studies have used well-resolved galaxies in the local universe to study the environmental dependance of [C ii]/TIR, a PE heating efficiency proxy, including the impact of metallicity, dust grain size distribution, radiation fields etc. Most of the studies found large [C ii]/TIR variations with these parameters. For example, Cormier et al. (2012, 2015) found higher [C ii]/TIR in lower-metallicity galaxies. Rubin et al. (2009) studied systematic variations in [C ii]/TIR in the LMC, and found the highest [C ii]/TIR in the diffuse medium, while the lowest ratios coincide with bright star-forming regions ( 1.4 times lower). However, the bulk of the [C ii]/TIR values are scattered around 0.005. Smith et al. (2016) showed that in a diverse sample of nearby galaxies, there are trends of decreasing [C ii]/TIR with increasing metallicity and with increasing star formation rate surface density. Other studies have shown that PAHs are the most efficient dust constituents in the PE heating mechanism (Rubin et al., 2009), and [C ii]/TIR decreases with increasing ionized fraction of PAHs (Okada et al., 2013). As such, Helou et al. (2001) and Croxall et al. (2012) suggested that [C ii]/PAH is a more direct measure of the heating efficiency in the ISM than [C ii]/TIR. Finally, Mizutani et al. (2004) found decreasing [C ii]/TIR with increasing UV radiation field. The point is that [C ii]/TIR depends strongly on the local galactic environment. Many of the above dependencies are entangled, making any conclusive statements difficult.
Using the Survey of Lines In M 31 (SLIM), Kapala et al. (2015) showed that the [C ii]/TIR ratio varies dramatically with radius in M 31’s disk, spanning a factor of 3 between 6.9 kpc and 16.0 kpc; see top panel Figure 4. This revelation is surprising, as Kapala et al. (2015) also showed that [C ii] correlates well with SFR even on small scales ( 50 pc). How can the [C ii]-SFR relation hold even when the [C ii]/TIR proxy of PE efficiency appears to change?
Kapala et al. (2015) presented two possible scenarios that could cause the variation in [C ii]/TIR without directly changing the PE efficiency (therefore allowing the [C ii]-SFR relationship to hold): (1) a change in the hardness of the integrated stellar spectrum, changing the relative abundance of photoelectric photons to dust heating photons and/or (2) a change in the opacity due to varying gas surface density or dust-to-gas ratio (e.g. allowing photons at longer wavelengths to escape preferentially for lower dust-to-gas ratio or low overall column density of dust; Israel et al., 1996).
The distinction between and [C ii]/TIR raises an issue. A significant fraction of stellar radiation is absorbed by dust in the wavelength range softer than UV. Viaene et al. (2016) find that on average of the dust luminosity comes from absorption of non-UV photons, based on a sample of 239 galaxies. Their conservative UV definition spans to a longer wavelength ( Å), therefore integrating to a shorter wavelength upper limit of Å(as we use here), would lead to an even larger percentage. Therefore, a large fraction of absorbed stellar energy contributes only to dust heating, but is not energetic enough to heat the gas. This leads to a degeneracy: different relative hard (UV) to soft (optical) photon dust heating contributions can result in the same TIR value.
With this paper we investigate the behaviour of the photoelectric efficiency in M 31 using a more carefully motivated tracer for than [C ii]/TIR. We constrain how much of the observed [C ii]/TIR variation can be tied to PE efficiency, and test other explanations for why [C ii]/TIR might vary.
This paper is organized as follows: in Section 2, we describe the data and processing. In Section 3, we apply MAGPHYS, an SED modelling tool to study the energy balance in the ISM. In Section 4, we determine the PE efficiency in the SLIM fields using different approximations, and assess how the underlying assumptions affect measurements. In Section 5, we discuss our results and other possible factors potentially contributing to the variation of the [C ii]/TIR ratio, and the global impact of our results on observational estimates of PE heating efficiency. We summarize our findings in Section 6.
2. Data
The key data in this paper are maps of [C ii] emission combined with multi-wavelength imaging of M 31 spanning from far-UV to far-IR wavelengths. Henceforth, we assume the following parameters for M 31; nucleus position , (J2000)111Based on NED data and references therein; inclination 70*∘* and position angle 43.2*∘* (Dalcanton et al., 2012); Distance kpc (Stanek & Garnavich, 1998).
We mapped the [C ii] 158 emission line in five 700 700 pc fields (henceforth SLIM fields; Kapala et al., 2015) with Herschel PACS at the resolution 50 pc, FWHM 114. The coordinates of the SLIM fields are given in Table 2. For details on the integral field spectroscopic data reduction see Kapala et al. (2015).
We also use Herschel and Spitzer infrared (IR) photometry. Observations of M 31 were done with the Multiband Imaging Photometer (MIPS; Rieke et al., 2004) on board of the Spitzer Space Telescope (Werner et al., 2004) by Gordon et al. (2006) and the InfraRed Array Camera (IRAC; Fazio et al., 2004) by Barmby et al. (2006). At the longer wavelengths, M 31 was observed with the Herschel Space Observatory (PI O. Krause) using the PACS and SPIRE instruments (Spectral and Photometric Imaging Receiver; Griffin et al., 2010). Herschel observations and processing details can be found in Groves et al. (2012) and Draine et al. (2014).
Details about all photometric bands used in this paper, including effective wavelength, FWHM and 1- sensitivity are presented in Table 1.
We use far-UV data from the Galaxy Evolution Explorer (GALEX). FUV ( Å) and NUV ( Å) observations of M 31 (Thilker et al., 2005) were obtained as part of the GALEX Nearby Galaxy Survey (NGS; Bianchi et al., 2003, 2005).
For the optical photometry we used the Sloan Digital Sky Survey (SDSS; York et al., 2000) data, which covered the entirety of the disk of M 31 in a contiguous strip using the filters. Here we use the mosaics of Tempel et al. (2011). Details of the reduction of the SDSS images and the important sky removal are described in Tempel et al. (2011) and Tempel et al. (in prep.). The units are nanomaggies per pixel, where nanomaggie222 is a linear unit of flux density equal to maggies. A star of brightness 1 nanomaggie has an AB magnitude of 22.5 in any band, and a flux density equal to Jansky.
For the comparison with other studies, we use H maps from the optical IFS from Calar Alto 3.5 m telescope with the PMAS instrument in PPAK mode with the V300 grating (Roth et al., 2005; Kelz et al., 2006). For all of the observing and reduction details see Kapala et al. (2015).
2.1. Processing of the data
We use Herschel and Spitzer images that have been processed following a general method described in Aniano et al. (2012), and details specific to M 31 data are reported in Draine et al. (2014).
We summarize the most important processing steps. A “tilted plane” best-model background has been fitted to each IR image (except IRAC 5.8 and 8 , where more complex models were necessary) in regions outside the galaxy. A simple constant value background model has been used in case of GALEX (0.000929 MJy sr*-1* for FUV, and 0.004712 MJy sr*-1* for NUV Thilker et al., 2005) and SDSS data. Corresponding background models have been subtracted from the images. Then, we convolve all data with the convolve_fft package (Astropy Collaboration et al., 2013) to match the MIPS 160 resolution using dedicated kernels from Aniano et al. (2011). The MIPS 160 resolution allows us to use all photometric bands in our analysis, including the longest wavelength band, i.e. SPIRE 500 . Finally, we resample the convolved images to the same pixel grid of 18″by 18″pixel size, which is the lower limit of the Nyquist sampling of the largest beam, i.e. FWHMM160μm. We report 1- noise and other filter properties of interest in Table 1.
3. The intrinsic stellar emission of M 31
To infer the intrinsic UV–optical spectra of the regions we assume that the energy is conserved between the UV–optical absorption and IR emission and use spectral energy distribution (SED) modelling of the integrated photometry.333We note that on small scales where the influence of individual star forming regions can be resolved, energy may not be conserved within a pixel. However, since we work at kpc scales, we expect this to be a good approximation. Parravano et al. (2003) showed that it is stars within 500 pc that create the radiation field near the Sun.
We infer the intrinsic stellar UV-optical continuum to determine the spectrum absorbed by dust and the fraction going into PE heating.
3.1. SED fitting
The SED fitting code MAGPHYS (da Cunha et al., 2008) compares the photometric observations of galaxies with computed photometry from libraries of stellar population synthesis model spectra and model IR SEDs. The template stellar population spectra are derived using the Bruzual & Charlot (2003) stellar synthesis code. The stellar libraries provide high resolution spectra from the rest frame UV to IR and include a range of star formation histories, including bursts, assuming a Chabrier (2003) initial mass function (IMF). The final stellar library spectra are attenuated by dust over a range of ’s assuming a two-component model (Charlot & Fall, 2000), that takes into account the effect of the higher attenuation of young ( yr) stars in the natal clouds (, optical depth in birth clouds), in addition to the attenuation of all stars by dust in the ambient ISM ().
The library of dust emission spectra is calculated from a four-component model created specifically for MAGPHYS by da Cunha et al. (2008). The main contributors to this model are PAHs (emitting spectral features between 3 and 20 ), stochastically heated very small grains ( , emitting mainly at mid-IR wavelengths ), and two emitting components of cold and warm large grains in thermal equilibrium (emitting mainly at far-IR wavelengths).
The strength of MAGPHYS lies in the consistent modelling of the stellar and dust emission from the FUV to the far-IR via an energy balance technique: the angle-averaged amount of starlight absorbed by dust in the FUV to near-IR is computed using realistic star formation histories and dust attenuation prescription, and this energy is then re-radiated in the mid- to far-IR range using empirically-calibrated dust emission components. MAGPHYS uses a two-component ISM geometry to account for the attenuation of starlight from stellar birth clouds and from the diffuse ISM, following Charlot & Fall (2000). The resulting attenuation curve is flatter than a typical extinction law because it accounts for a geometry where the stars and dust clouds are mixed, and includes the scattering of short wavelength stellar emission back into the line of sight. Moreover, MAGPHYS allows for a 15% variation between the total dust emission and the attenuated stellar emission to account for any geometric discrepancies not accounted for in a simple isotropic model. Finally MAGPHYS uses a Bayesian approach, and calculates the likelihood distribution of each physical parameter by evaluating how well each SED in the model grid accounts for the observed properties of the galaxy (for details on the assumed priors see da Cunha et al., 2008).
3.2. Quantifying attenuated stellar emission
We use the intrinsic and reddened stellar spectra fitted with MAGPHYS to determine the stellar energy contribution to the ISM heating. We present an example SED fit to SLIM field 3 in Figure 2. The attenuated stellar emission is the difference between the intrinsic (unreddened; blue curve in Figure 2) and reddened model spectrum (red curve in Figure 2) that best fit the observed data.
Compared to inferring stellar radiation properties solely from the dust IR emission, this method gives us the advantage of estimating the hardness of the intrinsic stellar radiation field. We use these full-SED best fits and we define two energy bins over which we integrate the attenuated spectrum. The first, between 6 eV and 13.6 eV, captures the stellar energy input capable of ejecting electrons from the dust grain surface (; indicated as the blue area in the bottom panel in Figure 3). The second, between 0.01 eV and 13.6 eV (where the nm limit ensures capturing the energy at long wavelengths), measures the total stellar energy absorbed and scattered by dust (; marked as the hatched area in the bottom panel in Figure 3). Their ratio () represents an estimate of the fraction of stellar energy that can contribute to gas heating compared to the total stellar energy contributing to the dust heating.
To estimate the uncertainties in and , we incorporated them into the MAGPHYS code. The parameters, and , are not used explicitly in the MAGPHYS code, but by calculating these parameters simultaneously with the model fit, we can build the Bayesian likelihood distributions for them, in the same way as for any other physical parameter in MAGPHYS.
We note that MAGPHYS is typically applied to integrated galaxy SEDs, and works under the assumption that energy is conserved, allowing for a small variation to account for the effects of inclination. In this work we use MAGPHYS on 700 pc scales, which is comparable to pixel-by-pixel (659 pc) SED fitting of 7 nearby galaxies done by Boquien et al. (2012) and Viaene et al. (2014). These scales are large enough that the assumption of energy conservation should be reasonable. With these caveats in mind, we present the derived / ratio which is an estimate of the relative hardness of the absorbed stellar radiation in Figure 4. There appear to be an increasing trend in Figure 4, however due to a large scatter and a low number statistics it is not significant (for more details on the relation see Figure 8).
4. Results
4.1. Photoelectric heating efficiency estimates
Theoretically, the photoelectric heating efficiency is defined as the ratio of the photoelectric heating rate to the rate at which energy in the FUV part of the spectrum is absorbed by dust grains (see e.g. Tielens, 2008). Ab initio estimates for the heating efficiency cover the range , depending primarily on the local conditions in the gas (Bakes & Tielens, 1994; Weingartner & Draine, 2001). Observationally, the most commonly used tracer of the photoelectric heating efficiency is [C ii]/TIR. However, there is a major discrepancy between these two values as takes into account dust heating by soft optical photons, whereas considers only FUV photons.
In the following we make a new observationally driven estimate from the attenuated UV and [C ii] emission, and compare that to to see if the latter is actually tracing PE efficiency variations.
We now take advantage of our MAGPHYS results to improve the estimate of the photoelectric heating efficiency. As discussed above, the traditional [C ii]/TIR estimate suffers from a mismatch between the wavelengths responsible for dust heating and those responsible for PE heating. Instead of using TIR, we match explicitly the wavelengths of photons absorbed by dust to the wavelengths responsible for PE. Specifically, we substitute for TIR, to define a new approximation of the photoelectric heating efficiency as:
[TABLE]
is closer to the theoretical photoelectric heating efficiency, although we still need to approximate the total gas heating by the [C ii] emission, and includes both scattering and averaging over the full grain size and charge distributions. However, the latter two averages are accounted for in standard calculations of the efficiency as well.
By accounting for only the absorbed FUV photons, the approximation in Equation 3 marginalizes out the local stellar photon energy distribution, allowing us to see more clearly the impact of grain properties on the PE efficiency.
4.2. PE efficiency in the SLIM fields
Before calculating , we first plot the observed [C ii] emission versus the modelled from MAGPHYS in the SLIM fields in Figure 5. We find a very good correlation. A linear fit to [C ii], using orthogonal distance regression (ODR from python.scipy package; Brown et al., 1990) that accounts for uncertainties along both and axis, results in a photoelectric heating efficiency . We obtain a similar answer, , when we simply average values for the 5 SLIM fields using Equation 3.
These values agree well with theoretical predictions. We expect to recover efficiencies in the cold neutral medium (CNM) that are close to the theoretical maximum of %, but to find much lower values in the WNM (%) and in dense PDRs (%; see e.g. Tielens, 2008). Our result therefore suggests that we are probing emission from a mixture of these three components within each SLIM field. The resolved [C ii] maps of the SLIM fields confirm that picture, with a few star-forming regions surrounded by more quiescent regions (see Figures 2 and 3 in Kapala et al., 2015).
Given that our result is based on only 5 points, this result is clearly limited by low number statistics. To test the robustness of our PE efficiency, we include archival [C ii] Infrared Space Observatory (ISO) measurements (Rodriguez-Fernandez et al., 2006). Unfortunately, the regions targeted by Rodriguez-Fernandez et al. (2006) lie away from the major axis, on the far side of the M 31’s 10 kpc ring. Therefore these likely suffer larger projection effects and energy conservation issues compared to the SLIM fields. We show the additional points as gray circles in Figure 5. All but one point agree with our PE efficiency at 1-. If all points are included in the fit we would derive .
If other mechanisms dominate the heating of the ISM from which the [C ii] emission arises (such as turbulent shocks) then our determined PE efficiency will overestimate the true value. However, Kapala et al. (2015) found only a small contribution of ionized gas to the total [C ii] emission in the SLIM fields, based on [N ii] 122 emission line observations. Similarly, based on diagnostics such as linewidths, X-ray emission, cosmic-ray emission and modelling (Kapala et al. in prep), we find that other mechanisms that can heat the neutral ISM (i.e. cosmic rays, X-rays, shocks/mechanical heating) contribute negligibly to the [C ii] emission in the SLIM fields, therefore we ignore them hereafter. Given the small ionized gas contribution to [C ii] and the minor contribution of other heating mechanisms, we expect [C ii] emission in these fields to be generated mostly by photoelectric heating. Alternatively, could be an underestimate if [C ii] does not dominate neutral gas cooling. Based on the relatively small [O i] contribution to the cooling in the SLIM fields (Kapala et al., 2015), it is very likely that [C ii] is the dominant coolant.
Given that photoelectric heating dominates the [C ii] emission, Figure 5 demonstrates that a constant photoelectric heating efficiency (i.e. ) can accurately predict the observed [C ii] emission in all of the SLIM fields. Therefore, the factor of 3 gradient across the disk in [C ii]/TIR (see Figure 9 in Kapala et al. (2015)) can not be related to the PE efficiency. That raises the question: what else drives the [C ii]/TIR gradient in the disk?
4.3. correlation with [CII]/TIR
A major weakness in the [C ii]/TIR ratio as a PE heating efficiency proxy is its dependence on the relative shape of the stellar radiation field. To quantify the relative hardness of the dust-absorbed stellar radiation field, we use our MAGPHYS output parameters and . The ratio is an estimate of the fraction of stellar energy that can contribute to gas heating over the total absorbed stellar energy.
We find a correlation between [C ii]/TIR and in the SLIM fields (Figure 6). This correlation emphasizes the discrepancy between the theoretical PE efficiency definition and [C ii]/TIR approximation, and supports the argument that variations in [C ii]/TIR are primarily driven by variations in the hardness of the dust-absorbed stellar radiation field in the disk of M 31.
Following Figure 5, we populate the vs [C ii]/TIR plot with averaged [C ii] observations by Rodriguez-Fernandez et al. (2006) over SLIM-sized regions. Here, in Figure 6, we again see agreement at the 1- level for all but one of the ISO points, despite the projection effects and energy conservation problems that likely affect those regions of M 31.
5. Discussion
The [C ii]/TIR ratio is the most commonly used observational proxy for PE heating efficiency. This ratio has been found to be “deficient” in many galaxies on global and sub-galactic scales suggesting large variations in the PE efficiency (see the discussion section in Smith et al., 2016, for an overview). Our observation (Kapala et al., 2015) that the [C ii]/TIR ratio changes by a factor of 3 in M 31, while [C ii] still closely traces SFR suggested that [C ii]/TIR might not be a good proxy for the PE efficiency. The correlation of [C ii]/TIR with in Figure 6 indicates that, in M 31 at least, one of the drivers for [C ii]/TIR variation is the relative shape of the absorbed stellar radiation field.
Studies of other galaxies have attributed [C ii]/TIR variations to other sources, none of which are a plausible cause for M 31’s [C ii]/TIR behavior. The variation in the fraction of the total dust in PAHs, i.e. qPAH, across M 31 (Draine et al., 2014) peaks in dense ISM structures such as the 10 kpc ring, therefore qPAH does not correlate with the radially changing [C ii]/TIR. This suggests that destruction of PAHs is minimal and is not impeding PE heating. Ionized gas contributions leading to overestimates of cooling have been ruled out by [N ii] observations (Kapala et al., 2015). The influence of an AGN on gas ionization or infrared emission is negligible at this distance from the center and given M 31’s lack of a strong AGN (Li et al., 2011).
The other possible driver of the [C ii]/TIR variation is radial gradient in gas-phase metallicity, already considered as a potential explanation in Kapala et al. (2015). Following the arguments proposed by Israel et al. (1996); Israel & Maloney (2011), a lower metallicity is associated with a lower dust-to-gas ratio. A lower dust-to-gas ratio enables the UV to penetrate more deeply into the clouds (Lebouteiller et al., 2012), but also allows a relatively greater number of the soft photons to escape due to the increased mean free path of photons due to the decreased opacity of the gas. Thus the absorbed radiation field in a volume of gas would become relatively harder, and this could explain the observed increase in the [C ii]/TIR ratio with galactocentric radius in M 31. Israel & Maloney (2011) also describe a counter-mechanism, where lower metallicity means also lower PAH abundances, and therefore decreases gas heating efficiency. Although the first mechanism goes in the right direction to explain our observations of [C ii]/TIR increasing with decreasing metallicity, Kapala et al. (2015) could not explain the amplitude of the observed variations. The difference in the metallicities of the different SLIM fields is relatively small, ranging from Z*⊙* to Z*⊙. We note that the metallicities in the Magellanic Clouds are significantly lower ( 0.5 and 0.25 Z⊙*) than in M 31, therefore the impact of metallicity on the ISM is likely to be stronger in the MCs than M 31. Furthermore, considering the correlation with the absorbed stellar radiation hardness (Section 4.3) and SFRs (Smith et al., 2016), the metallicity seems to be a secondary factor that impacts [C ii]/TIR or [C ii]/ in massive, star forming galaxies. Nevertheless, since the is defined as an integral over a narrower wavelength range than TIR, should be less affected as a PE heating approximation than by metallicity changes.
In Section 4.3 we presented an explanation of the [C ii]/TIR variation within M 31 as driven by the . However the relative change in absorbed stellar hardness is controlled by more than one parameter, mainly by the star formation history (SFH) and dust opacity/extinction. While we cannot quantify the contributions of SFH and dust opacity to the changes across M 31, the correlations we find indicate that changes in the star formation history seems to dominate (for details see Appendix B where we explore correlations of other parameters with the ratio).
It is reassuring that our findings are consistent with Kapala et al. (2015) using an independent method, a spatial comparison between various SFR tracers: H, [C ii], 24 and TIR. Kapala et al. (2015) looked at how compact/extended the emission of these tracers is around star-forming regions, and found that H is the most compact, [C ii] emission is typically more extended than H but less than 24 and TIR. They suggested that TIR might be affected by heating arising from older stellar populations. Therefore, Kapala et al. (2015) and the current paper agree with each other in the context of TIR being affected by softer radiation coming from older stars.
There are no independent observational measurements in the literature of the photoelectric efficiency that do not simply rely on [C ii]/TIR, that we know of. We can try to calculate the PE efficiency for the Milky Way (MW) based on Pineda et al. (2013), who estimate that roughly half of the observed [C ii] emission in the Milky Way (MW) comes from dense PDRs, and the remainder comes from cold atomic or CO-dark molecular gas. We emphasize that these estimated fractions rely on detections of velocity resolved Herschel HIFI spectra that are biased towards bright, SF regions in the MW that tend to be PDR dominated. A similar bias occurs in selection of our SLIM fields in M 31. If we take the values for the PE efficiency in dense PDRs and in the CNM from Tielens (2005) of 0.3% and 3% respectively, and the Pineda et al. (2013) estimate of the fractional [C ii] contributions from those phases, this results in a PE efficiency of . This value is in good agreement with our determinations of the efficiency in M 31. While this is only a crude estimate for the MW value, the agreement with M 31 is encouraging considering the similarity between these two galaxies.
However, the dust SED modeling from Draine et al. (2014) in M 31 estimates that the SLIM fields have maximal fraction of the total dust luminosity that is radiated by dust grains in PDR regions, fPDR444fPDR is a model parameter, and it can be derived from eq. 29 in Draine & Li (2007), using Umin and maps from Draine et al. (2014), where Umax is fixed at . These maps can be downloaded from www.astro.princeton.edu/~draine/m31dust/m31dust.html, values in the range of 5-26%, significantly lower than the MW estimates. The PDR fractions agree better with Croxall et al. (2012) who estimated the fraction of the [C ii] emission arising from PDRs to be less than 25% for two nearby galaxies (NGC 1097 and NGC 4559). If we use this lower estimate of 25% PDR fraction in our determination of the MW PE efficiency, we get . This value is above our estimate for in M 31, but still reasonably close. Based on this, our measured PE for M 31 is consistent with theoretical expectations over a wide range of potential PDR/CNM [C ii] fractions.
However, most studies use [C ii]/TIR to estimate the PE efficiency. The recent work of Smith et al. (2016) examining the [C ii]/TIR ratio in nearby galaxies, has a sample (KINGFISH galaxies) close in resolution and stellar mass to M 31. They find a trend of decreasing [C ii]/TIR with increasing that becomes strong when measurements from other studies are included. In Figure 7, we directly compare the M 31 [C ii]/TIR data (available only in the SLIM fields) and corresponding (derived from H 24 using the Calzetti et al., 2007, formula) with the Smith et al. (2016) results. We find a comparable, large scatter in [C ii]/TIR relation with derived from H (Calzetti et al., 2007, formula) at 50 pc scales (figure 7) as Smith et al. (2016) at sub-kpc scales (within 54 nearby galaxies covering a wide range of galaxy properties and local ISM environment; figure 3, Smith et al., 2016). We see a similar, albeit weaker, declining trend of [C ii]/TIR with as Smith et al. (2016) on smaller scales (evenly binned 50 pc measurements in log space; see fig. 7) than their sub-kpc scales. When integrated over the SLIM fields, the [C ii]/TIR values (diamonds) show no trend with , but are consistent with the global trend and scatter found by Smith et al. (2016) (black lines on main plot in fig. 7). This lack of a trend may be due to the small dynamic range in probed by our SLIM fields, as compared to the 6 orders of magnitude seen in Smith et al. (2016).
In a similar study of the LMC, Rubin et al. (2009) find [C ii]/TIR roughly constant over 2.5 order of magnitude change of . However, there are pixels in figure 4 of Rubin et al. (2009) that do appear to follow the same declining trend of Smith et al. (2016), but were dismissed by the authors as likely affected by the noise in the [C ii] map.
One obvious conclusion to draw from these comparisons is that the scales and placement of the apertures over which the [C ii]/TIR and are measured have a significant impact on the results.
In contrast to the trend with , given the demonstrated trends of –[C ii]/TIR (fig. 6) and sSFR– (fig. 15 in appendix B) relations, we infer that the [C ii]/TIR ratio increases with the specific SFR (sSFR; subplot in the bottom right corner in figure 7). Given that the [C ii]/TIR vs relation is in agreement with Smith et al. (2016), the inverse trend of [C ii]/TIR with sSFR in M 31 must arise because of the impact of on the dust heating. As the TIR is affected by the diffuse radiation field arising from all stellar populations, increasing (and thus decreasing sSFR) must act to increase the TIR and thus decrease [C ii]/TIR, creating the trend seen in figure 7. Whether this trend still exists in the larger sample of Smith et al. (2016) is yet to be seen.
The Smith et al. (2016) trend of the [C ii]/TIR declining with agrees best with the PDR models of Tielens & Hollenbach (1985) and Wolfire et al. (1990). These models find that the environmental conditions found in extreme star forming regions, such as the increased radiation fields and gas temperatures and densities, all act to relatively decrease the [C ii] emission. This occurs through; (1) the [C ii] emission line no longer being the dominant coolant, in which case we might test by observing the relative brightness of the [O i] 63 emission line (this is theoretically predicted Tielens & Hollenbach, 1985, but has not yet been observed), and (2) increasing the average grain charge, therefore increasing the work potential and decreasing the true PE efficiency, which we can test for example by observing PAH features in the MIR (Okada et al., 2013). It would be interesting to test whether some/all of the trend goes away if we use our instead of for the larger data sets like Smith et al. (2016). If the trend remains, it means that we either observe a real PE efficiency variations or other heating mechanisms or cooling lines take over, where the latter can be tested.
When parameters such as [C ii]/TIR are integrated over a region, any small scale variations, such as the [C ii] and TIR arising from distinct regions, will be smoothed over. It is only through simulations and comparing nearby objects, such as the MW and M 31, to the distant objects examined in Smith et al. (2016), can we begin to account for these effects.
6. Conclusions
The main conclusion of this paper is that in M 31 the [C ii]/TIR variation is not tracing changes in the photoelectric heating efficiency. Worth noting is that the photoelectric heating efficiency proxy [C ii]/TIR is defined significantly differently from the theoretical definition. In particular, in this work we have demonstrated that the [C ii]/TIR ratio () is an imperfect approximation for the photoelectric heating efficiency in M 31. We define a new method to use a SED fitting technique to derive the energy absorbed by dust in the PE heating wavelength range (), that together with the [C ii] emission allows us to determine a more direct estimate of the photoelectric efficiency:
[TABLE]
Using [C ii] imaging from the Survey of Lines in M 31 and a library of multiwavelength observations from UV through IR, we have demonstrated that it is possible to predict the [C ii] emission based on the estimated fraction of the stellar energy that contributes to gas heating () with a constant photoelectric heating efficiency (). A constant photoelectric heating efficiency is also supported by fact that [C ii] works as a SFR tracer in each SLIM field despite the factor of 3 gradient in the [C ii]/TIR found between these fields (Kapala et al., 2015).
We found that the attenuated UV energy relative to the total attenuated energy () correlates well with the variation in the [C ii]/TIR ratio suggesting that it is the hardness of the dust-absorbed stellar radiation field that is driving the variation in the [C ii]/TIR ratio across this disk, not PE efficiency changes.
The question remains whether the use of attenuated UV energy can correct the “[C ii]-deficit” observed in many galaxies, or whether there is still some remaining factors (such as true variations in ) which cause this observed deficit. Larger samples with [C ii] observations and ancillary multiwavelength data, such as the KINGFISH or GOALS samples, may be able answer whether is a true constant or does vary across galaxies.
Appendix
A. MAGPHYS SED modeling across M 31
We use MAGPHYS SED modeling across the galaxy along the major axis in kpc apertures (dashed and solid boxes in Figure 1) to derive the overall trend of with galactocentric radius. We present the results in Figure 8. The top panel showing a cut-out of the Herschel image of M 31, and the color-coded points with dust mass surface density (extracted from Draine et al., 2014, maps) help to orientate each data point to a position within the galaxy and indicate the structure of the galaxy (e.g., spiral arms).
There is a hint of the overall radial trend in on the NE (positive radius) side, however the scatter is considerable. There is a tentative systematic excess, a relatively higher in the arm than in the interarm regions, with the exception of the central regions dominated by the massive bulge.
We present the corresponding SED fits for all regions in Figures 9–13. In future work, we plan to use the to predict [C ii] emission in the disk of M 31.
B. Correlations of MAGPHYS parameters
We explore correlations between and various physical and MAGPHYS output parameters. We find the best anti-correlation with (the fraction of the total infrared luminosity contributed by the dust in the ambient, diffuse ISM) with a Pearson correlation coefficient , giving the probability of an uncorrelated data . This anti-correlation indicates that an increasingly harder radiation is absorbed in the vicinity of star forming regions, or at least where they dominate the IR emission. depends itself on the total effective V-band dust optical depth, (, ), the fraction, , of this contributed by dust in the ambient ISM (, ), and the relative proportion of young and old stars (which we approximate here by sSFR; , ). The second strongest correlation of the is with sSFR (, ), while with (, ) and (, ) are much weaker. To summarize, while we cannot quantify the contributions of SFH and dust opacity to the changes, the correlations we find indicate that changes in the star formation history seem to dominate.
Acknowledgments
The authors thank E. Tempel and collaborators for sharing the SDSS data with us. The authors thank J. D. Smith, H.-W. Rix and F. Walter for helpful conversations in the course of this project. M. J. K. thank M. Łyczek, M. Cluver and Ch. Magoulas for the support. The authors would also like to thank the anonymous referee for providing us with very constructive comments. We thank J. D. Smith for providing an early version of his paper for comparison. During the course of this research, M. J. K. received funding support from the DLR through Grant 50 OR 1115 and the National Research Foundation (NRF; South Africa). K. S. acknowledges funding from a Marie Curie International Incoming Fellowship. B.G. gratefully acknowledges the support of the Australian Research Council as the recipient of a Future Fellowship (FT140101202). S.C.O.G. acknowledges financial support from the Deutsche Forschungsgemeinschaft via SFB 881, “The Milky Way System” (sub-projects B1, B2 and B8) and SPP 1573, “Physics of the Interstellar Medium” (grant number GL 668/2-1), and by the European Research Council under the European Community’s Seventh Framework Programme (FP7/2007-2013) via the ERC Advanced Grant STARLIGHT (project number 339177). This research made use of (1) Montage, funded by the National Aeronautics and Space Administration’s Earth Science Technology Office, Computation Technologies Project, under Cooperative Agreement Number NCC5-626 between NASA and the California Institute of Technology. Montage is maintained by the NASA/IPAC Infrared Science Archive. (2) the NASA/IPAC Extragalactic Database (NED) which is operated by the Jet Propulsion Laboratory, California Institute of Technology, under contract with the National Aeronautics and Space Administration. This research has made use of NASA’s Astrophysics Data System Bibliographic Services. PACS has been developed by a consortium of institutes led by MPE (Germany) and including UVIE (Austria); KU Leuven, CSL, IMEC (Belgium); CEA, LAM (France); MPIA (Germany); INAF-IFSI/OAA/OAP/OAT, LENS, SISSA (Italy); IAC (Spain). This development has been supported by the funding agencies BMVIT (Austria), ESA-PRODEX (Belgium), CEA/CNES (France), DLR (Germany), ASI/INAF (Italy), and CICYT/MCYT (Spain).
The reference list from the paper itself. Each links out to its DOI / PubMed record.
- 1Aniano et al. (2012) Aniano, G., et al. 2012, Ap J, 756, 138
- 2Aniano et al. (2011) Aniano, G., Draine, B. T., Gordon, K. D., & Sandstrom, K. 2011, PASP, 123, 1218
- 3Astropy Collaboration et al. (2013) Astropy Collaboration et al. 2013, A&A, 558, A 33
- 4Bakes & Tielens (1994) Bakes, E. L. O., & Tielens, A. G. G. M. 1994, Ap J, 427, 822
- 5Barmby et al. (2006) Barmby, P., et al. 2006, Ap J, 650, L 45
- 6Bianchi et al. (2003) Bianchi, L., Madore, B., Thilker, D., Gil de Paz, A., & GALEX Science Team. 2003, in Bulletin of the American Astronomical Society, Vol. 35, American Astronomical Society Meeting Abstracts, 1354
- 7Bianchi et al. (2005) Bianchi, L., et al. 2005, Ap J, 619, L 27
- 8Boquien et al. (2012) Boquien, M., et al. 2012, A&A, 539, A 145