An Inside Look at Sunspot Oscillations with Higher Azimuthal Wavenumbers
David B. Jess, Tom Van Doorsselaere, Gary Verth, Viktor Fedun, S., Krishna Prasad, Robert Erd\'elyi, Peter H. Keys, Samuel D. T. Grant, Han, Uitenbroek, Damian J. Christian

TL;DR
This study provides the first direct observational evidence of an m=1 slow magneto-acoustic wave mode in sunspot chromospheric umbrae, using Fourier filtering and theoretical modeling to analyze wave signatures.
Contribution
The paper identifies and characterizes the m=1 slow magneto-acoustic mode in sunspot umbrae, a novel observation not previously described.
Findings
Detection of m=1 mode with ~170 s period
Fourier filtering isolates specific wave components
Theoretical models confirm observational interpretation
Abstract
Solar chromospheric observations of sunspot umbrae offer an exceptional view of magneto-hydrodynamic wave phenomena. In recent years, a wealth of wave signatures related to propagating magneto-acoustic modes have been presented, which demonstrate complex spatial and temporal structuring of the wave components. Theoretical modelling has demonstrated how these ubiquitous waves are consistent with an m=0 slow magneto-acoustic mode, which are excited by trapped sub-photospheric acoustic (p-mode) waves. However, the spectrum of umbral waves is broad, suggesting that the observed signatures represent the superposition of numerous frequencies and/or modes. We apply Fourier filtering, in both spatial and temporal domains, to extract chromospheric umbral wave characteristics consistent with an m=1 slow magneto-acoustic mode. This identification has not been described before. Angular frequencies…
Click any figure to enlarge with its caption.
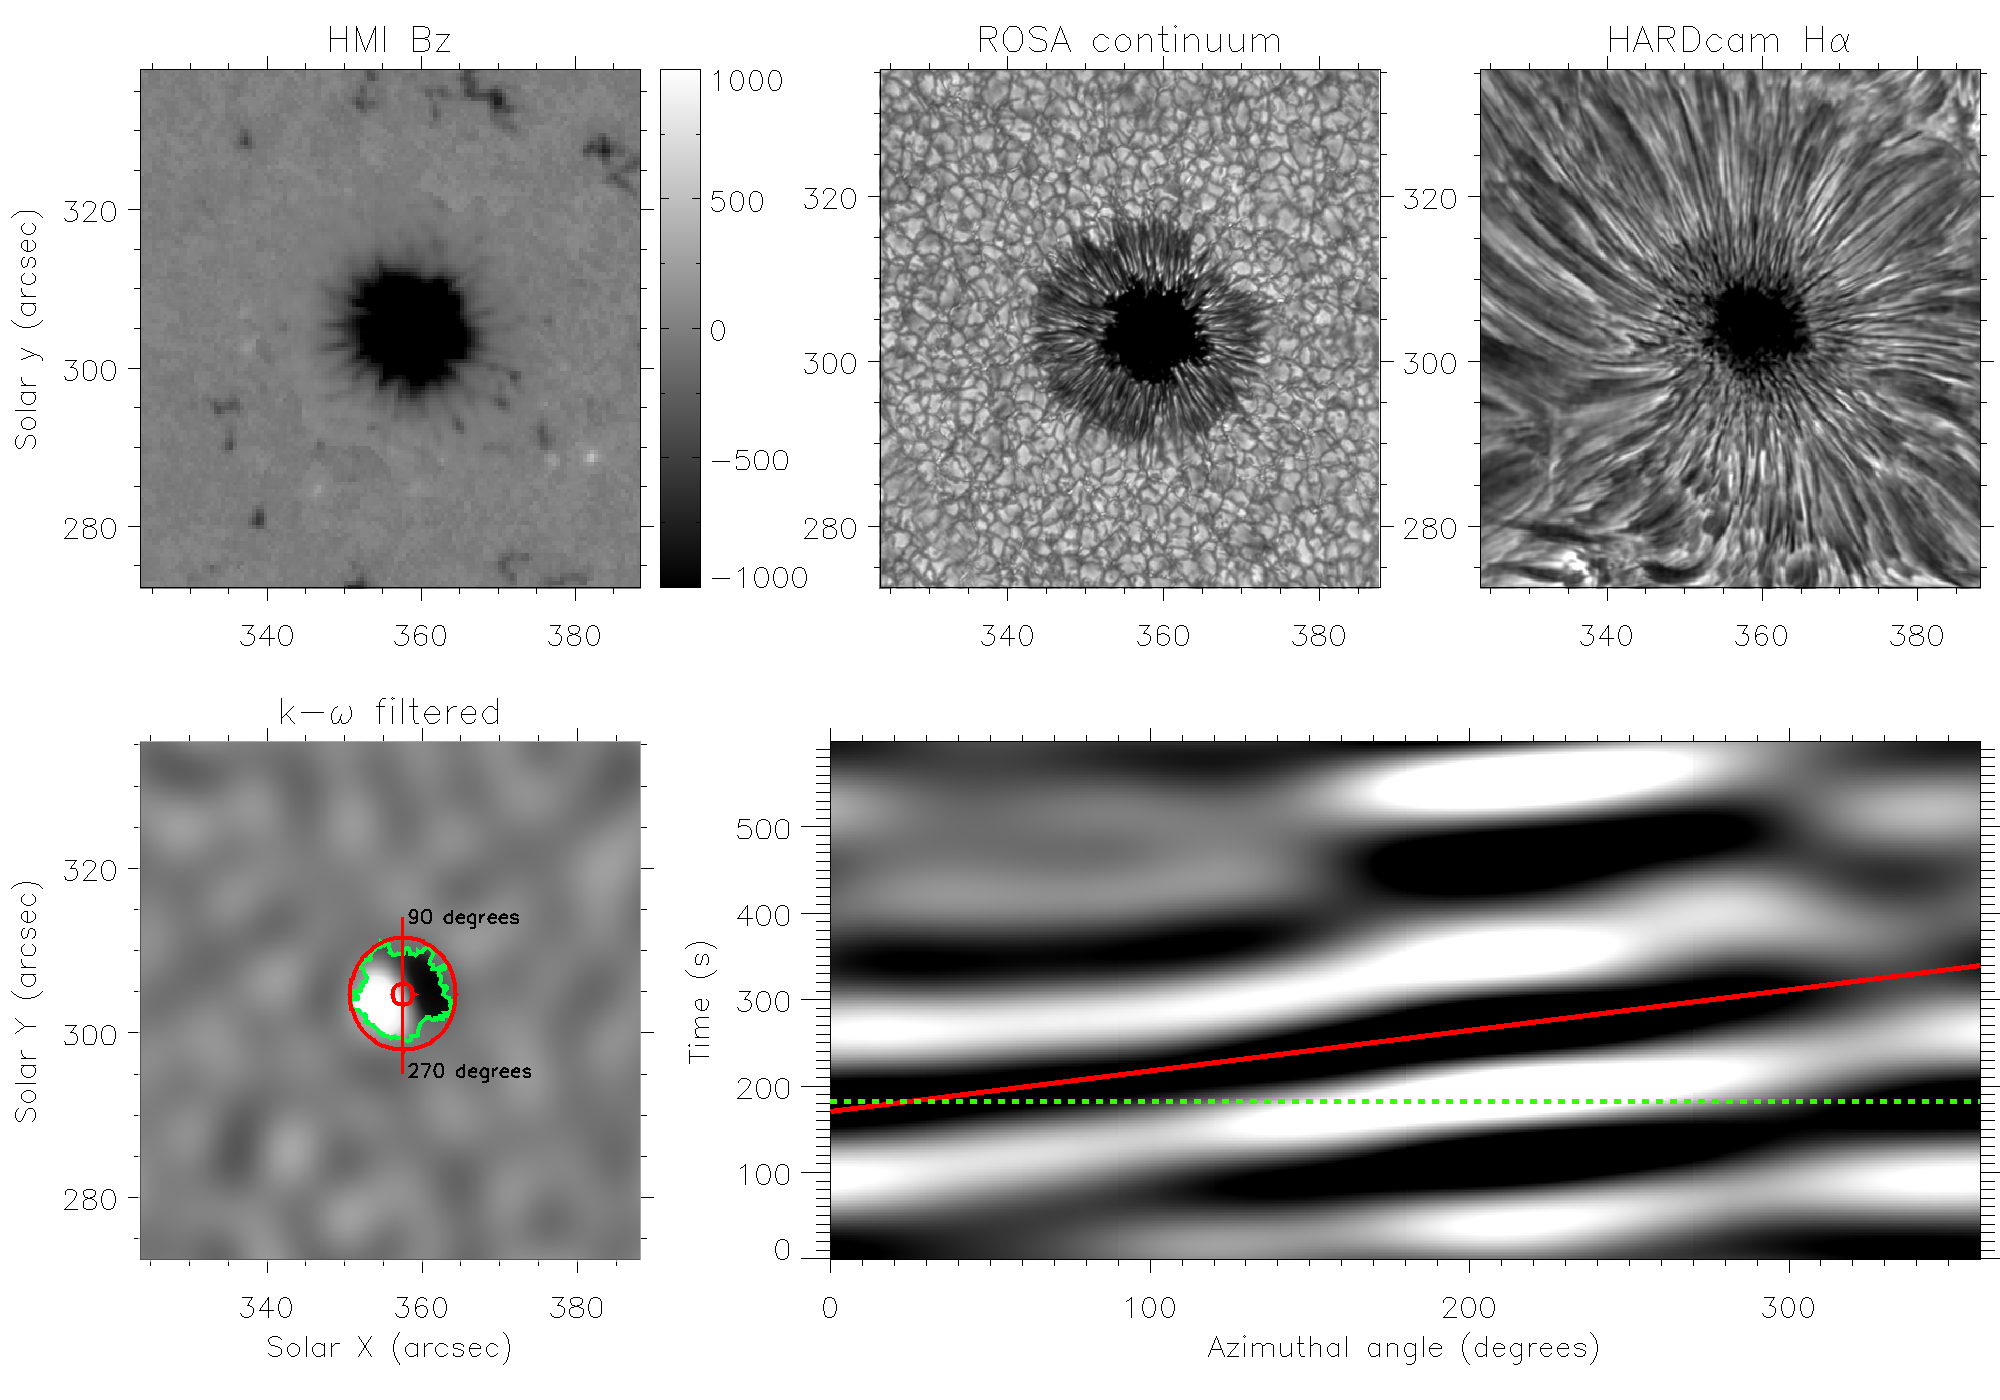 Figure 1
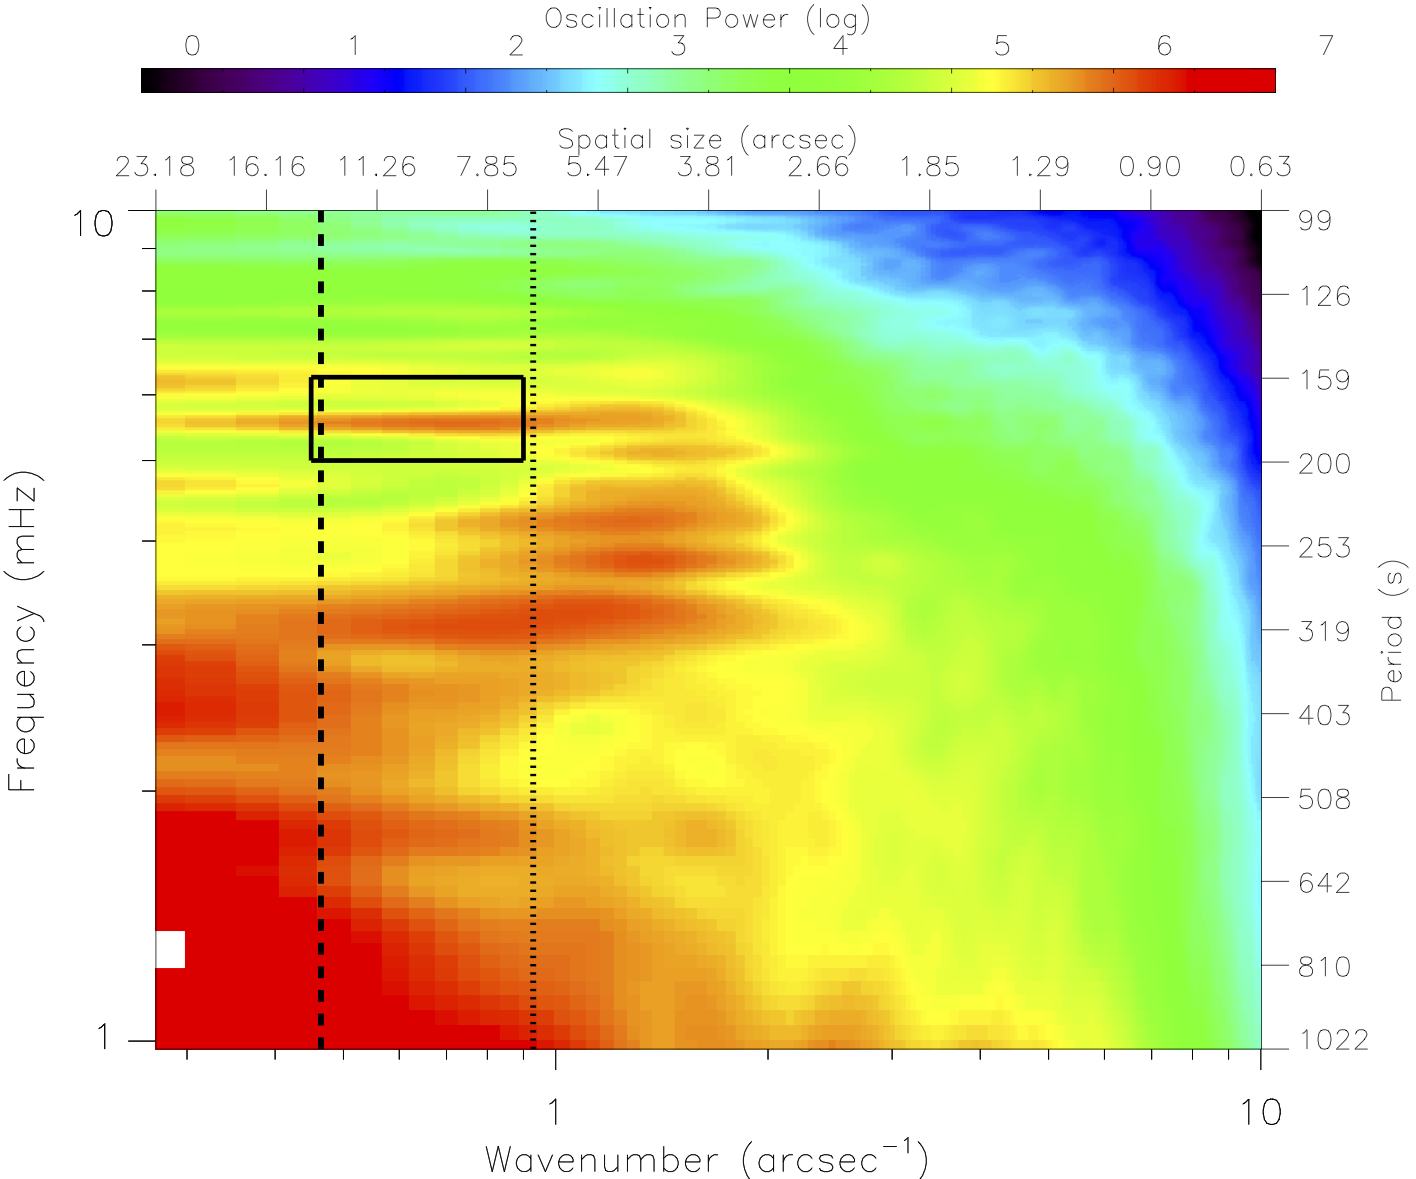 Figure 2
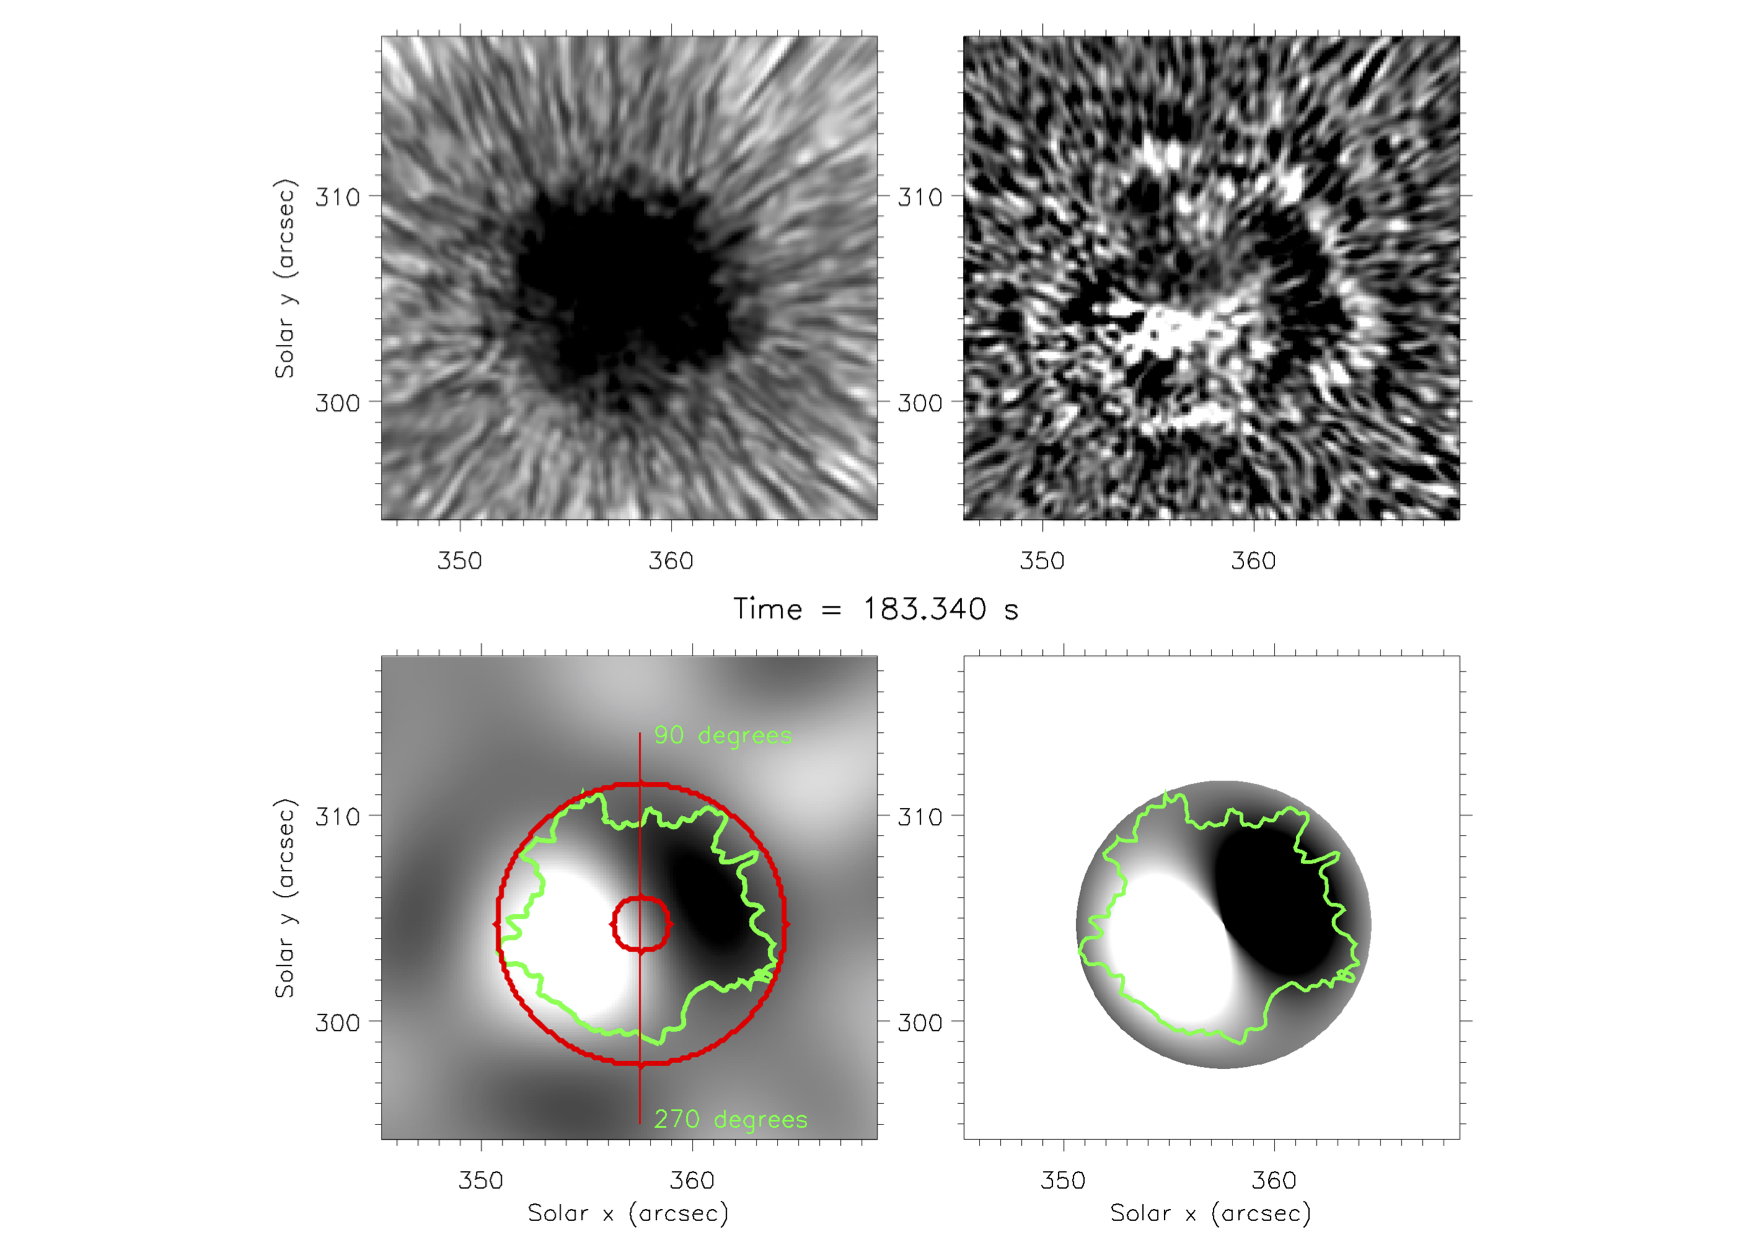 Figure 3
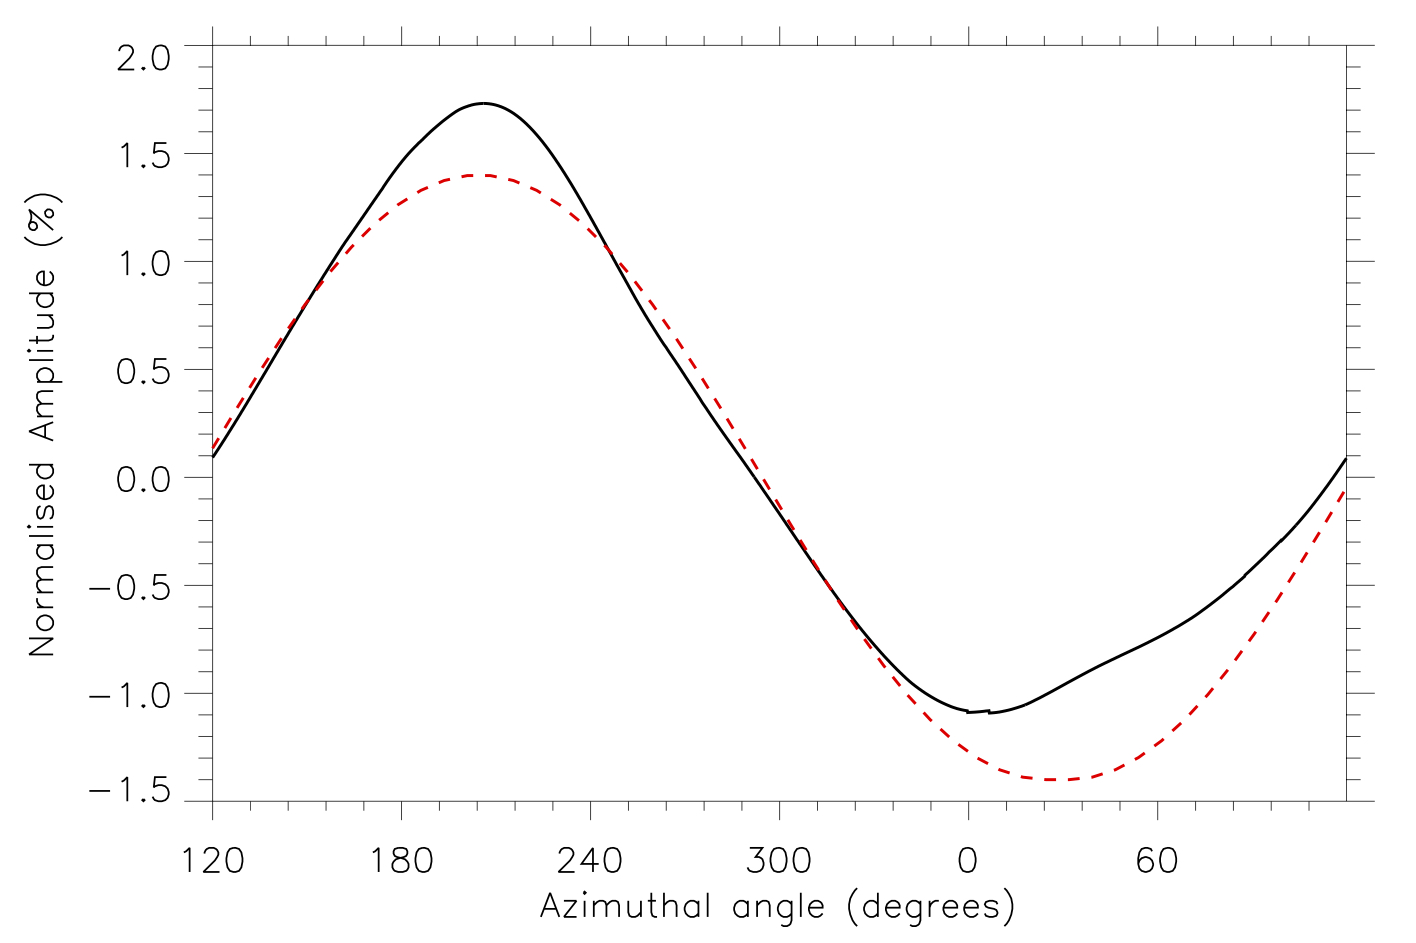 Figure 4
Peer Reviews
No public reviews on file for this paper yet. If you reviewed it on a platform where reviews are public (OpenReview, ICLR, NeurIPS, ICML), you can paste yours below so the community can read it here.
Videos
No videos yet. Explain this paper in a talk, walkthrough, or lecture? Add one.
An Inside Look at Sunspot Oscillations with Higher Azimuthal Wavenumbers
David B. Jess1,2, Tom Van Doorsselaere3, Gary Verth4, Viktor Fedun5, S. Krishna Prasad1, Robert Erdélyi4, Peter H. Keys1, Samuel D. T. Grant1, Han Uitenbroek6 & Damian J. Christian2
1Astrophysics Research Centre, Queen’s University Belfast, Belfast, BT7 1NN, UK
2Department of Physics and Astronomy, California State University Northridge, Northridge, CA 91330, USA
3Centre for mathematical Plasma Astrophysics, Department of Mathematics, KU Leuven, Celestijnenlaan 200B bus 2400, B-3001 Heverlee, Belgium
4Solar Physics and Space Plasma Research Centre (SP2RC), The University of Sheffield, Hicks Building, Hounsfield Road, Sheffield, S3 7RH, UK
5Space Systems Laboratory, Department of Automatic Control and Systems Engineering, University of Sheffield, Sheffield, S1 3JD, UK
6National Solar Observatory†, University of Colorado Boulder, 3665 Discovery Drive, Boulder, CO 80303, USA
Abstract
Solar chromospheric observations of sunspot umbrae offer an exceptional view of magneto-hydrodynamic wave phenomena. In recent years, a wealth of wave signatures related to propagating magneto-acoustic modes have been presented, which demonstrate complex spatial and temporal structuring of the wave components. Theoretical modelling has demonstrated how these ubiquitous waves are consistent with an slow magneto-acoustic mode, which are excited by trapped sub-photospheric acoustic (-mode) waves. However, the spectrum of umbral waves is broad, suggesting that the observed signatures represent the superposition of numerous frequencies and/or modes. We apply Fourier filtering, in both spatial and temporal domains, to extract chromospheric umbral wave characteristics consistent with an slow magneto-acoustic mode. This identification has not been described before. Angular frequencies of (, corresponding to a period 170 s) for the mode are uncovered for spatial wavenumbers in the range of arcsec*-1* ( km). Theoretical dispersion relations are solved, with corresponding eigenfunctions computed, which allows the density perturbations to be investigated and compared with our observations. Such magnetohydrodynamic modelling confirms our interpretation that the identified wave signatures are the first direct observations of an slow magneto-acoustic mode in the chromospheric umbra of a sunspot.
Sun: chromosphere — Sun: magnetic fields — Sun: oscillations — Sun: photosphere — sunspots
1 Introduction
22footnotetext: The National Solar Observatory is operated by the Association of Universities for Research in Astronomy under a cooperative agreement with the National Science Foundation.
Since the early pioneering work by Beckers & Tallant (1969), Wittmann (1969) and Havnes (1970), to name but a few, oscillations and propagating waves tied to sunspot atmospheres have remained a challenging research area within solar physics. Observations have long indicated that wave power suppression exists in photospheric sunspot umbrae, with Nagashima et al. (2007) providing a high-resolution view of this phenomenon with the Hinode/SOT instrument. Many theories have been put forward to explain such power suppression, including the absorption, scattering or channeling of field-guided magneto-acoustic waves following the mode conversion of -mode oscillations (e.g., Braun et al., 1987; Cally, 1995; Crouch & Cally, 2003; Cally et al., 2003; Rijs et al., 2016), the less efficient excitation of wave activity due to reduced turbulent convection (e.g., Goldreich & Keeley, 1977; Goldreich & Kumar, 1988), and the reduction of attenuation lengths in the highly magnetic umbral regions of a sunspot (e.g., Jain et al., 1996; Hindman et al., 1997). What all of these theories have in common is the fact that the concentrated umbral magnetic fields modify the emerging wave signatures to produce magneto-acoustic wave activity (Zharkov et al., 2013), which is observed to propagate anisotropically along the expanding magnetic field lines (see the recent review articles by Jess et al., 2015; Verth & Jess, 2016). The interplay between various plasma measurements (e.g., the magnetic field strength, the line-of-sight velocity, the intensity perturbations, etc., Fujimura & Tsuneta, 2009; Freij et al., 2014; Moreels et al., 2015b) has allowed researchers to verify that the majority of visible wave signatures in sunspot umbrae are synonymous with the slow magneto-acoustic mode. Indeed, such activity can readily be identified in chromospheric (e.g., Bloomfield et al., 2007; Vecchio et al., 2007; Kobanov et al., 2011; Jess et al., 2013; Löhner-Böttcher & Bello González, 2015; Moreels et al., 2015a) and coronal (e.g., De Moortel, 2006; McEwan & De Moortel, 2006; Jess et al., 2012a, 2016; Krishna Prasad et al., 2012, 2015) sunspot-related studies involving both imaging and spectroscopic capabilities.
Observations of sunspot umbral atmospheres often show increased activity as one moves away from the photospheric layer. Socas-Navarro et al. (2009) revealed evidence for dynamic filamentary structures in the chromosphere of a sunspot umbra when observed in the Ca ii H absorption line. Henriques & Kiselman (2013) and Henriques et al. (2015) found similar features, which were illuminated by the increased emission found in the vicinity of umbral flashes, suggesting there may be convective processes still at work within the cooler, magnetically dominated umbral atmosphere, allowing wave motion to more readily disturb the lower density chromospheric plasma (see, also, the recent review by Sych, 2016). This has important consequences, since it means that in the more-dynamic chromosphere, additional wave modes not readily identified (or suppressed) in the corresponding photosphere may present themselves more clearly. Gary (2001) devised a static model atmosphere of a solar active region, and found that the plasma- (ratio of the plasma pressure to the magnetic pressure) was consistently less than unity across all atmospheric heights, indicating that the magnetic field will continue to play an important role in the propagation of waves through the chromosphere (e.g., Yuan et al., 2014a; Löhner-Böttcher et al., 2016), often creating radial structuring of the oscillation signals depending on the strength and orientation of the localized magnetic field, which are clearly visible in the Fourier power spectra maps presented by Reznikova et al. (2012) and Sych & Nakariakov (2014).
Modeling efforts focused on the excitation, propagation and/or dissipation of compressive waves in simplified solar atmospheres have been developed over a number of decades, with earlier examples including the work of Cram & Wilson (1975), Schmieder (1977) and Ulmschneider et al. (1977), to name but a few. More recent models have been constructed by, e.g., Khomenko & Collados (2006), Khomenko et al. (2008), Fedun et al. (2011a), Vigeesh et al. (2012), Cally & Moradi (2013), Santamaria et al. (2015, 2016) and Cally (2017). The excitation of longitudinal waves have been shown to be a consequence of the convective massaging of flux tubes (magnetic pumping, Kato et al., 2011, 2016), while on the other hand, Krishna Prasad et al. (2015) have observationally shown that their generation is rather connected to -mode oscillations. The propagation of Alfvén waves in magnetic pores, and its potential for seismology, was described by Fedun et al. (2011b), Mumford & Erdélyi (2015) and Mumford et al. (2015), with their observational signatures computed by Shelyag & Przybylski (2014). The effect of neutrals on their dissipation and the resulting heating was further studied by Arber et al. (2016) and Shelyag et al. (2016).
Importantly, in recent years we have developed better imaging detectors that are more sensitive to incident photons. The benefits of this are twofold: (1) higher sensitivity equates to shorter exposure times, which helps to ‘freeze’ atmospheric seeing when acquiring observations from ground-based facilities to help prevent spatial degradation, and (2) shorter exposure times allow for higher cadence image sequences, which raises the intrinsic Nyquist limit and allows us to probe high-frequency oscillations and propagating waves (see Chapter 2 in the review article by Jess et al., 2015). Furthermore, better and more-robust adaptive optics systems are allowing longer duration studies of solar phenomena to be captured, providing a much improved frequency resolution for pinpointing and segregating particular oscillations of interest. Therefore, we are in an era where we can finally probe and examine the signatures and characteristics resulting from the superposition of multiple wave modes and harmonics within a single dataset. Here, in this article, we employ modern processing techniques to extract, interpret and model, for the first time, higher-order wave modes found within a sunspot umbral atmosphere.
2 Observations & Processing
The dataset used here has been thoroughly documented in previous studies (e.g., Jess et al., 2013, 2016; Krishna Prasad et al., 2015). However, for completeness, we will provide a brief overview. The image sequence duration was 75 minutes, and was obtained during excellent seeing conditions between 16:10 – 17:25 UT on 2011 December 10 with the Dunn Solar Telescope (DST) at Sacramento Peak, New Mexico. The Rapid Oscillations in the Solar Atmosphere (ROSA; Jess et al., 2010) and Hydrogen-Alpha Rapid Dynamics camera (HARDcam; Jess et al., 2012a) imaging systems were utilised to capture the near circularly-symmetric sunspot present within active region NOAA 11366, which was positioned at heliocentric co-ordinates (356″, 305″), or N17.9W22.5 in the conventional heliographic co-ordinate system. Here, we employ the blue continuum (52 Å bandpass filter centered at 4170 Å) and H (0.25 Å filter centered on the line core at 6562.8 Å) filtergrams, with platescales of and per pixel, respectively, to provide a field-of-view size equal to . High-order adaptive optics (Rimmele, 2004) and speckle reconstruction algorithms (Wöger et al., 2008) were implemented to improve the final data products, with final cadences of the continuum and H channels equal to 2.11 s and 1.78 s, respectively. The Helioseismic and Magnetic Imager (HMI; Schou et al., 2012) present on the Solar Dynamics Observatory (SDO; Pesnell et al., 2012) provided simultaneous vector magnetograms of the active region with a cadence of 720 s and a two-pixel spatial resolution of . A contextual HMI continuum image was also employed to co-align the images obtained from the DST with the full-disk HMI observations. Once aligned, a time-averaged 4170 Å continuum image was used to determine the umbral center-of-gravity, or intensity ‘barycenter’, which forms the central co-ordinates of the umbral annulus used Section 3. Sample images of the data employed here are displayed in Figure 1.
3 Analysis & Discussion
An image sequence obtained at the core of the H line profile is employed to examine wave-related activity in the solar chromosphere for three distinct reasons. First, even with the reduced opacities present in the sunspot umbra, there is no evidence in our H observations of umbral flash behaviour, which dominates datasets obtained at the core of the Ca ii H/K or Ca ii 8542 Å absorption profiles. Grant et al. (2017) have shown statistically that umbral flashes first appear at an optical depth of , and preferentially manifest at an optical depth , corresponding to approximate geometrical heights of 250 km and 750 km, respectively (sunspot model ‘M’; Maltby et al., 1986). Therefore, with this in mind, our H umbral observations are likely to be formed at heights above 750 km, thus avoiding contamination from umbral flash events and making the visible intensity fluctuations purely related to the embedded (non-shocked) wave activity. Second, as the modelling efforts of Leenaarts et al. (2012, 2013) have revealed, the opacity of the H line in the upper chromosphere is only weakly sensitive to the localised temperature, thus further reducing its sensitivity to high-forming umbral flash behaviour. Third, the time cadence of the H observations is the highest (1.78 s), thus providing the best possible temporal frequency coverage, while still maintaining a diffraction-limited spatial resolution.
The work of Jess et al. (2013) employed temporal filtering of the H time series to provide a thorough understanding of dominant periodicities as a function of radial distance from the center of the umbra (or umbral ‘barycenter’). For the purposes of that work, no filtering was performed in the spatial domain. However, examining time-lapse movies of the temporally filtered H images reveals a plethora of dynamic wave activity across a variety of spatial scales, particularly within the umbra where a dominant periodicity of 180 s was uncovered, which is consistent with the work of Kobanov et al. (2011, 2013, 2015). The enhanced oscillations, which are clearly observed in the temporally (150 – 180 s) filtered H observations, are similar in magnitude to the outputs of chromospheric umbral resonance models put forward by Zhugzhda & Locans (1981) and Staude et al. (1985), whereby the upwardly propagating slow magneto-acoustic waves, which do not violate the acoustic cut-off period (e.g., Bel & Leroy, 1977; Fleck & Schmitz, 1991; Zhugzhda, 2008; Yuan et al., 2014b; Snow et al., 2015, to name but a few), are reflected continuously between the steep temperature gradients present close to the photospheric temperature minimum and at the transition region boundary. Of course, temperature and density gradients within the umbra provide a non-ideal resonator, which in turn gives wave amplitude inhomogeneities across the magnetic waveguide, similar to what is seen in the upper-right panel of Figure 3. These effects have been investigated previously by Locans et al. (1988), and more recently by Norton (2000), Norton & Ulrich (2000), Christopoulou et al. (2003), Botha et al. (2011) and the review article by Khomenko & Collados (2015), with observational evidence for such a scenario found by Moreels et al. (2015a). However, importantly, the temporally filtered time series indicates that a component of the observed umbral oscillations are occurring on much-larger spatial scales than previously uncovered.
To isolate and examine the presence of large-scale umbral oscillations, a complete - filtering process was applied to the H data, where is the spatial wavenumber (equal to , where is the spatial wavelength) and is the temporal frequency. Following the work of Jess et al. (2013), a relatively broad temporal bandpass filter corresponding to 160 – 200 s (or 5.0 6.3 mHz) was employed to extract the dominant umbral oscillations. To examine the larger spatial fluctuations, a filter covering 7 – 14″ (or arcsec*-1*) was chosen, as highlighed by the solid black box in Figure 2. This wavenumber range was chosen since the diameter of the sunspot umbra is 98 pixels (see the outer edge of the annulus shown in Figure 3), corresponding to 13.5″, which means a spatial filter spanning 7 – 14″ will allow coherent oscillations of a similar size to the umbra to be investigated. Both the temporal and spatial filtering bandpasses are multiplied (in Fourier space) by a Gaussian envelope to reduce edge effects once transformed back into the space/time domain, hence the frequency ranges stipulated above are representative of the full-width at half-maximum of the corresponding - filter. It is clear from Figure 2 that within the chosen - filter there is a very strong oscillatory power signal, which is approximately 7 orders-of-magnitude above the background. The overall - diagram depicts many of the quiet-Sun and internetwork features documented by Krijger et al. (2001), Kneer & Bello González (2011) and Jess et al. (2012b), whereby higher temporal frequencies tend to be synonymous with larger spatial wavenumbers, producing the diagonal arm of enhanced oscillatory power seen in Figure 2. However, within the boundaries of the applied - filter, there is considerably elevated oscillatory power that spans a multitude of spatial scales (particularly within the range of arcsec*-1*), yet remains relatively discrete in terms of the temporal frequency. This implies that the wave motion is best categorised by a narrow frequency range, yet demonstrates coherency across a broad spectrum of spatial scales, ranging from those close to the diameter of the sunspot umbra (13.5″), through to those of similar size to the umbral radius, as indicated by the vertical dashed and dotted lines in Figure 2, respectively.
Oscillatory power, albeit reduced, is still clearly evident at smaller spatial wavenumbers than those associated with the umbral diameter. This implies that the discrete frequencies found within the umbra are still prevalent on much larger spatial scales, including outside the umbral waveguide. From the pioneering work of Ulrich (1970) and Deubner (1975), which has subsequently been thoroughly developed by the use of modern, more sensitive instrumentation and techniques (e.g., Kosovichev et al., 1997; Rhodes et al., 1997; Haber et al., 1999; Christensen-Dalsgaard, 2002; Howe et al., 2004; González Hernández et al., 2006, to name but a few), significant -mode power at similar temporal frequencies (i.e., 3 minutes) has been found to coherently extend out to spatial wavelengths on the order of 100 Mm (140″), corresponding to wavenumbers arcsec*-1*. This is bigger than our current field-of-view, and indicates that large-scale coherent wave power readily exists in the solar photosphere at the temporal frequencies examined here. Of course, the H observations presented in the current study are not only chromospheric in their composition (forming 1500 km above the photosphere), but the presence of a highly magnetic sunspot embedded within the atmosphere naturally adds complexity to the picture (see, e.g., the recent review by Cally et al., 2016). Through multi-wavelength investigations, Rajaguru et al. (2010, 2013) have demonstrated how sunspot structures can modify the observable characteristics of underlying 3 minute -mode oscillations. Hence, a combination of chromospheric resonances and modified upwardly propagating -mode oscillations may be the cause of the elevated wave power found at spatial scales exceeding that of the umbral diameter. Indeed, it seems likely that the observed heightened oscillatory power within the sunspot umbra may also be linked to the ubiquitous underlying -mode oscillations. As per the work of Rajaguru et al. (2010, 2013), a multi-wavelength study (including photospheric observations) is necessary to examine the two-dimensional phase relationships with atmospheric height in order to conclusively verify whether the global -modes are responsible for the observed wave power at large spatial scales. At spatial scales smaller than the umbral radius (i.e., arcsec*-1*), the oscillatory power begins to decrease rapidly, while also shifting to slightly higher temporal frequencies in agreement with previously observed () magneto-acoustic wave phenomena (e.g., Krijger et al., 2001; Kneer & Bello González, 2011; Jess et al., 2012b). However, importantly, the lack of a positively correlated relationship between increasing and values within the chosen - filter is not consistent with previous observations of traditional -mode generated magneto-acoustic waves (e.g., Duvall et al., 1988), hinting at the presence of a more elusive wave mode.
Once the H image sequence had been passed through the - filter, it became very obvious from the resulting time series that large-scale spatially-coherent oscillations were manifesting within the chromospheric sunspot umbra, as indicated in the - diagram displayed in Figure 2 and revealed in Figure 3 (and the corresponding movie accessible in the online edition). The movie linked to Figure 3 documents a 10-minute comparison between the unfiltered (raw), temporally filtered, and spatially and temporally filtered time series, in addition to the numerically modelled oscillations (see below), with simultaneous snapshots visible in the panels of Figure 3. Due to the azimuthal rotation about the umbral barycenter (central pivot of the annulus displayed in the lower-left panel of Figure 3, and visible in the associated movie), the intensities are averaged in the radial direction across the width of the annulus (40 pixels, or 5.5″). This is in agreement with the - diagram presented in Figure 2, whereby the frequency of oscillation contained within the chosen - filter remains independent of the spatial scale (e.g., radius from the umbral barycenter), thus implying a rotation with constant angular frequency about the center of the sunspot umbra. Following the radial averaging of the umbral intensities, a polar transformation is performed to convert the azimuthal angle into a linearized array. Stacking these on top of one another produces the time-azimuth diagram shown in the lower-right panel of Figure 1. Here, in a similar way to traditional time-distance diagrams, the gradients present in the time-azimuth panel relate to the rotational velocities, or more precisely, the angular frequencies (i.e., or ) of the wave mode. These are measured by following the techniques defined by Morton et al. (2012) and Jess et al. (2016), whereby a Gaussian profile is first fitted across the widths of the diagonal peaks (bright ridges) and troughs (dark ridges), before fitting a line-of-best-fit to the resulting Gaussian peaks and minimizing the sum of the squares of the residuals (i.e., least squares fitting; see the solid red line in the lower-right panel of Figure 1). This provides angular frequencies of (), corresponding to periodicities of 170 s, which (as expected) is within the range of the applied - filter (160 – 200 s), yet more precisely quantifies the embedded temporal frequencies.
To model this wave, we consider the sunspot as a cylindrical structure in the polar coordinate system , with the -axis aligned with the umbral magnetic field, using the associated wave numbers and (following standard notation). We consider a plasma that changes its conditions (density, temperature, magnetic field) from the internal values (denoted with subscript ‘i’) to the external values (denoted with subscript ‘e’) with a step function. We take the centre of the sunspot as being a low- plasma, with a sound speed of and Alfvén speed of . These choices are consistent with the Maltby ‘M’ model used by Jess et al. (2013) for the same sunspot structure. Exterior to the sunspot, we consider an unmagnetised () fluid with a sound speed . From the total pressure balance, we compute that the exterior is 3.4 times more dense than the interior of the sunspot. We now solve numerically the dispersion relation (as derived by Zaitsev & Stepanov, 1975; Edwin & Roberts, 1983) for slow waves in a cylindrical configuration. Given the observed behaviour, we take an azimuthal dependence of . Moreover, we take (inspired by Moreels et al., 2013; Freij et al., 2016), where is the radius of the waveguide. For these parameters, we obtain a phase speed of . Next, we computed the eigenfunctions of these waves in our assumed cylindrical configuration. To that end, we have used Eq. 14–23 of Yuan & Van Doorsselaere (2016), which relate the physical variables (, , ) to Bessel eigenfunctions. The main difference with the calculation in Yuan & Van Doorsselaere (2016) is that all wave perturbations (in particular, the density and temperature) were put proportional to . These perturbations were then added to the background density (assuming that the radial displacement of the oscillation is small, as would be expected for a slow-mode wave) to produce the image shown in the lower-right panel of Figure 3. Here, the radius of the cylindrical waveguide has been scaled, for clarity, to match the spatial size of the observed umbra, thus allowing a direct comparison to be made between the observed and simulated wave amplitudes displayed in the lower-left and lower-right panels, respectively, of Figure 3. In addition, the movie linked to Figure 3 in the online edition displays the time evolution of the modelled slow magneto-acoustic mode, which is repeated continuously throughout the duration of the movie. Comparing the modelled wave signatures to those observed in our filtered observations reveals a remarkable level of consistency, further strengthening our interpretation that we have identified, for the first time, evidence for an slow magneto-acoustic wave propagating in the chromospheric umbra of a sunspot.
While deriving the dispersion relation for the standard cylindrical case, we placed all perturbed variables proportional to . Considering the real part of the perturbations yields a displacement proportional to , in which for the kink asymmetry. When plotting these eigenfunctions as a function of time, they would be represented by anti-clockwise cork-screwing regions of high density along and that propagate upwards. Traditionally, for example in the case of coronal loop oscillations, we see propagating kink waves that oscillate in a plane. To model such instances, the solutions and are added together, which represent the and modes, respectively. Simplification of the resulting motion would provide the displacement relation , where is a steady state component no longer dependent on or . Ultimately, adding the and modes together produces a wave that only propagates in the -direction (i.e., becomes a standing wave in the direction). In this case, however, we only consider the eigenfunction (i.e., not ) as we wish to maintain the propagation behaviour in the direction (i.e., the apparent azimuthal motion). As our H observations correspond to the upper chromospheric layer, it is not important for our present study whether the resulting wave is standing or propagating in the -direction. Here, this distinction results from the superposition of independent waves with , and is something that will be investigated using simultaneous, multi-wavelength observations in a follow-up publication.
Alternatively, the observed angular frequency may be the consequence of the superposition of two perpendicularly polarised slow, kink waves, which are standing waves in their respective directions. Here, the initial conditions would require that two independent slow kink waves are present, which are 90 degrees out-of-phase in : (1) and (2) . The superposition of these two kink modes produces a density perturbation relation , which is identical to the fluctuations produced from a single, isolated slow kink mode. Therefore, while the driving mechanism for the observed wave behaviour may be different (e.g., a single, isolated slow kink mode or a pair of perpendicularly polarised slow kink waves), the wave signatures produced (and observed) are identical.
It must be noted that while our observations clearly indicate apparent azimuthal motion related to the embedded density perturbations of the slow kink mode, this is distinctly different to the rotational twisting associated with torsional Alfvén waves. In the case of Alfvén waves, the physical bulk periodic rotation of magnetic field isocontours is a signature of such wave motion. Observationally, this may manifest as either the visible rotation of the magnetic feature (if well-resolved by the telescope), asymmetric Doppler velocities at opposite sides of the magnetic structure (e.g., De Pontieu et al., 2014; Srivastava et al., 2017), or as periodic changes in the non-thermal line widths of the spectral lines used to observe the feature (e.g., Banerjee et al., 1998; Jess et al., 2009). For a more in-depth review, we refer the reader to the work of Zaqarashvili & Erdélyi (2009) and Mathioudakis et al. (2013). However, in the case of the present analysis, no physical rotation of the sunspot (periodic or otherwise) is observed. Instead, we identify the bulk azimuthal rotation of Fourier power peaks inside the umbra, which are introduced by the density perturbations created from the presence of a single, isolated slow kink mode or a pair of perpendicularly polarised slow kink waves. These signatures relate to the presence of the embedded wave mode (i.e., relative phase relationships across the spatial confines of the umbra), rather than a physical motion of the solar plasma. In addition, the signatures deduced in the present study are also distinctly different from those that would be associated with a fast kink mode. Here, the velocity components (i.e., the plasma flow field of the wave perturbations) are in the vertical direction, while a fast kink mode would be characterized by horizontal velocity perturbations. Furthermore, the intensity (i.e., density) fluctuations associated with fast kink modes would be significantly diminished as a result of the near incompressibility of these waves.
An interesting test to verify the robustness of our interpretation is to plot the instantaneous wave amplitudes as a function of azimuthal angle around the sunspot umbra, as defined by the annulus depicted in Figures 1 & 3. Following the polar transformation, the dashed green line in the lower-right panel of Figure 1 represents the instantaneous intensity fluctuations around the circumference of the annulus. These intensities are displayed in Figure 4, whereby a peak-to-peak amplitude is on the order of 2.8% above the background, which is of the same order, albeit slightly smaller, as previous measurements of magnetically-confined slow-mode waves in the lower solar atmosphere (e.g., Jess et al., 2007; Beck et al., 2012; Grant et al., 2015). The reduced peak-to-peak amplitude of the mode is likely a result of the relatively inefficient excitation mechanism for this mode, hence why the identification of such slow magneto-acoustic modes have proven impossible until the combination of modern high-resolution datasets and Fourier filtering techniques. Furthermore, as would be expected of an slow-mode wave, the intensity fluctuations, when plotted as a function of azimuthal angle, provide clear evidence of a single, well-resolved oscillation period. Figure 4 displays both the observed (solid black line) and modelled (dashed red line) intensity fluctuations around the azimuth of the umbra. The similarities between the two curves highlight a continued consistency with our interpretation that we have identified an slow magneto-acoustic mode in the chromospheric umbra of our sunspot. Any slight misalignments between the modelled azimuthal fluctuations and those observed in our data may be the consequence of, for example, the non-perfect circular cross-section of the sunspot, shifts in the inclination angles of the umbral magnetic fields which affect the visible compressions of the localized plasma (e.g., Sych & Nakariakov, 2014; Krishna Prasad et al., 2015), or from changes in the opacity across the diameter of the sunspot which may modify the magnitude of the observed intensity fluctuations (e.g., Jensen & Maltby, 1965; Khomenko et al., 2003; Felipe et al., 2014).
Of particular interest is the fact that the slow-mode wave is not omnipresent throughout the duration of the time series. The movie linked to Figure 3 displays the visible manifestation, approximately three complete oscillation cycles, then the disappearance of the oscillation. This is in stark contrast to the ubiquitous slow-mode waves that thrive throughout all umbral time series. What is the reason behind this? Are the driving mechanisms completely different, therefore requiring special circumstances to induce the mode, which by itself may be a relatively inefficient wave driver? Or if driven by the underlying -mode oscillations, could the broadness of this spectrum induce various modes at fractionally different angular frequencies, thus giving rise to beat phenomena that can modulate the signals produced by the (already weak) driver? Or, finally, could the not quite perfectly cylindrical shape of the sunspot umbra introduce slight differences between any and eigenfunctions that might be present? Indeed, Norton et al. (1999) found evidence for 3 minute magneto-acoustic oscillations surrounding the darkest central portion of an irregularly shaped sunspot umbra, although the Fourier power maps presented did not allow any temporal variability to be investigated. Perhaps, in such a regime, additional beating of these two modes (on top of what might be present from modes at fractionally different angular frequencies) might occur, thus introducing a quasi-periodic nature of the observed wave phenomenon.
4 Conclusions
Here, we have presented high spatial and temporal resolution H observations, captured by the HARDcam instrument at the Dunn Solar Telescope, of wave activity in the umbra of a sunspot. On the date of the observations, 2011 December 10, the sunspot corresponding to active region NOAA 11366 was very quiet and exhibited near-circular geometry. Within the immediate vicinity of the sunspot, a - diagram revealed the traditional trend of lower-frequency oscillations being associated with larger spatial scales (e.g., as detailed in Jess et al., 2013). However, of particular interest was a region of high oscillatory power, which corresponded to a constant frequency (5.9 mHz, 170 s or 0.037 ) over a wide range of spatial wavenumbers ( arcsec*-1* or 7 – 14″). Through the application of a - filter, this oscillation was isolated and further studied.
Through modelling the sunspot as a cylindrical structure in the polar coordinate system , with the -axis aligned with the umbral magnetic field, we solved the intrinsic dispersion relation for an slow mode wave and computed the corresponding eigenfunctions. We find that the modelled density perturbations remain consistent with our high-resolution observations, suggesting we have uncovered a large-scale isolated slow kink mode oscillation in the chromospheric umbra of a sunspot. However, through analysis of the mathematical eigenfunctions, our observations may also be consistent with a pair of perpendicularly polarised kink waves. While the wave signatures produced will be identical, the underlying driving mechanism may be vastly different; something that will require further study utilizing a plethora of multiwavelength observations. Thus, for the first time, we have presented a detailed examination of slow kink mode oscillations in the chromospheric umbra of a sunspot, which display spatial coherency on distances of up to 14″ (or ).
DBJ thanks the UK Science and Technology Facilities Council (STFC) for an Ernest Rutherford Fellowship, in addition to a dedicated standard grant that allowed this project to be undertaken. DBJ also wishes to thank Invest NI and Randox Laboratories Ltd. for the award of a Research & Development Grant (059RDEN-1) that allowed the filtering techniques employed to be developed. TVD was supported by an Odysseus grant of the FWO Vlaanderen, the IAP P7/08 CHARM (Belspo) and the GOA-2015-014 (KU Leuven). GV, VF, SKP and RE also wish to thank the UK STFC. RE further acknowledges support by the Chinese Academy of Sciences President’s International Fellowship Initiative, Grant No. 2016VMA045 and the Royal Society (UK). PHK is grateful to the Leverhulme Trust for the award of an Early Career Fellowship that allowed this work to be undertaken. SDTG wishes to thank the UK Department of Employment and Learning for a PhD studentship. DJC is grateful to CSUN for start-up funding. The contextual imaging and magnetic field measurements employed in this work are courtesy of NASA/SDO and the AIA, EVE, and HMI science teams.
The reference list from the paper itself. Each links out to its DOI / PubMed record.
- 1Arber et al. (2016) Arber, T. D., Brady, C. S., & Shelyag, S. 2016, Ap J, 817, 94
- 2Banerjee et al. (1998) Banerjee, D., Teriaca, L., Doyle, J. G., & Wilhelm, K. 1998, A&A, 339, 208
- 3Beck et al. (2012) Beck, C., Rezaei, R., & Puschmann, K. G. 2012, A&A, 544, A 46
- 4Beckers & Tallant (1969) Beckers, J. M., & Tallant, P. E. 1969, Sol. Phys., 7, 351
- 5Bel & Leroy (1977) Bel, N., & Leroy, B. 1977, A&A, 55, 239
- 6Bloomfield et al. (2007) Bloomfield, D. S., Lagg, A., & Solanki, S. K. 2007, Ap J, 671, 1005
- 7Botha et al. (2011) Botha, G. J. J., Arber, T. D., Nakariakov, V. M., & Zhugzhda, Y. D. 2011, Ap J, 728, 84
- 8Braun et al. (1987) Braun, D. C., Duvall, T. L. J., & Labonte, B. J. 1987, Ap J, 319, L 27