Colloidal Motion under the Action of a Thermophoretic Force
Jerome Burelbach, Mykolas Zupkauskas, Robin Lamboll, Yang Lan, Erika, Eiser

TL;DR
This study measures thermophoretic motion of polystyrene colloids with different surface properties, revealing complex dependencies on surface charge and a model for relaxation dynamics, advancing understanding of colloidal thermophoresis.
Contribution
It introduces a novel measurement technique for colloidal thermophoresis and uncovers the influence of surface functionality on the Soret coefficient.
Findings
Weakly charged colloids show stronger thermophoretic effects.
Surface functionality affects the Soret coefficient more than predicted.
Relaxation speed increases with thermophoretic force magnitude.
Abstract
We present thermophoretic measurements in aqueous suspensions of three different polystyrene (PS) particles of varying negative charge, size and surface coating. Our measurement technique is based on the observation of the colloidal steady-state distribution using conventional bright-field microscopy, which avoids undesirable effects such as laser-induced convection or local heating. We find that the colloids with the weakest zeta potential exhibit the strongest thermophoretic effect, suggesting that surface functionality leads to a more intricate dependence of the Soret coefficient on hydrodynamic boundary conditions than predicted by existing theoretical approaches. We also study the relaxation of the colloids to steady-state and propose a model to quantify the relaxation speed, based on the time evolution of the colloidal center of mass. Our observations are well described by this…
Click any figure to enlarge with its caption.
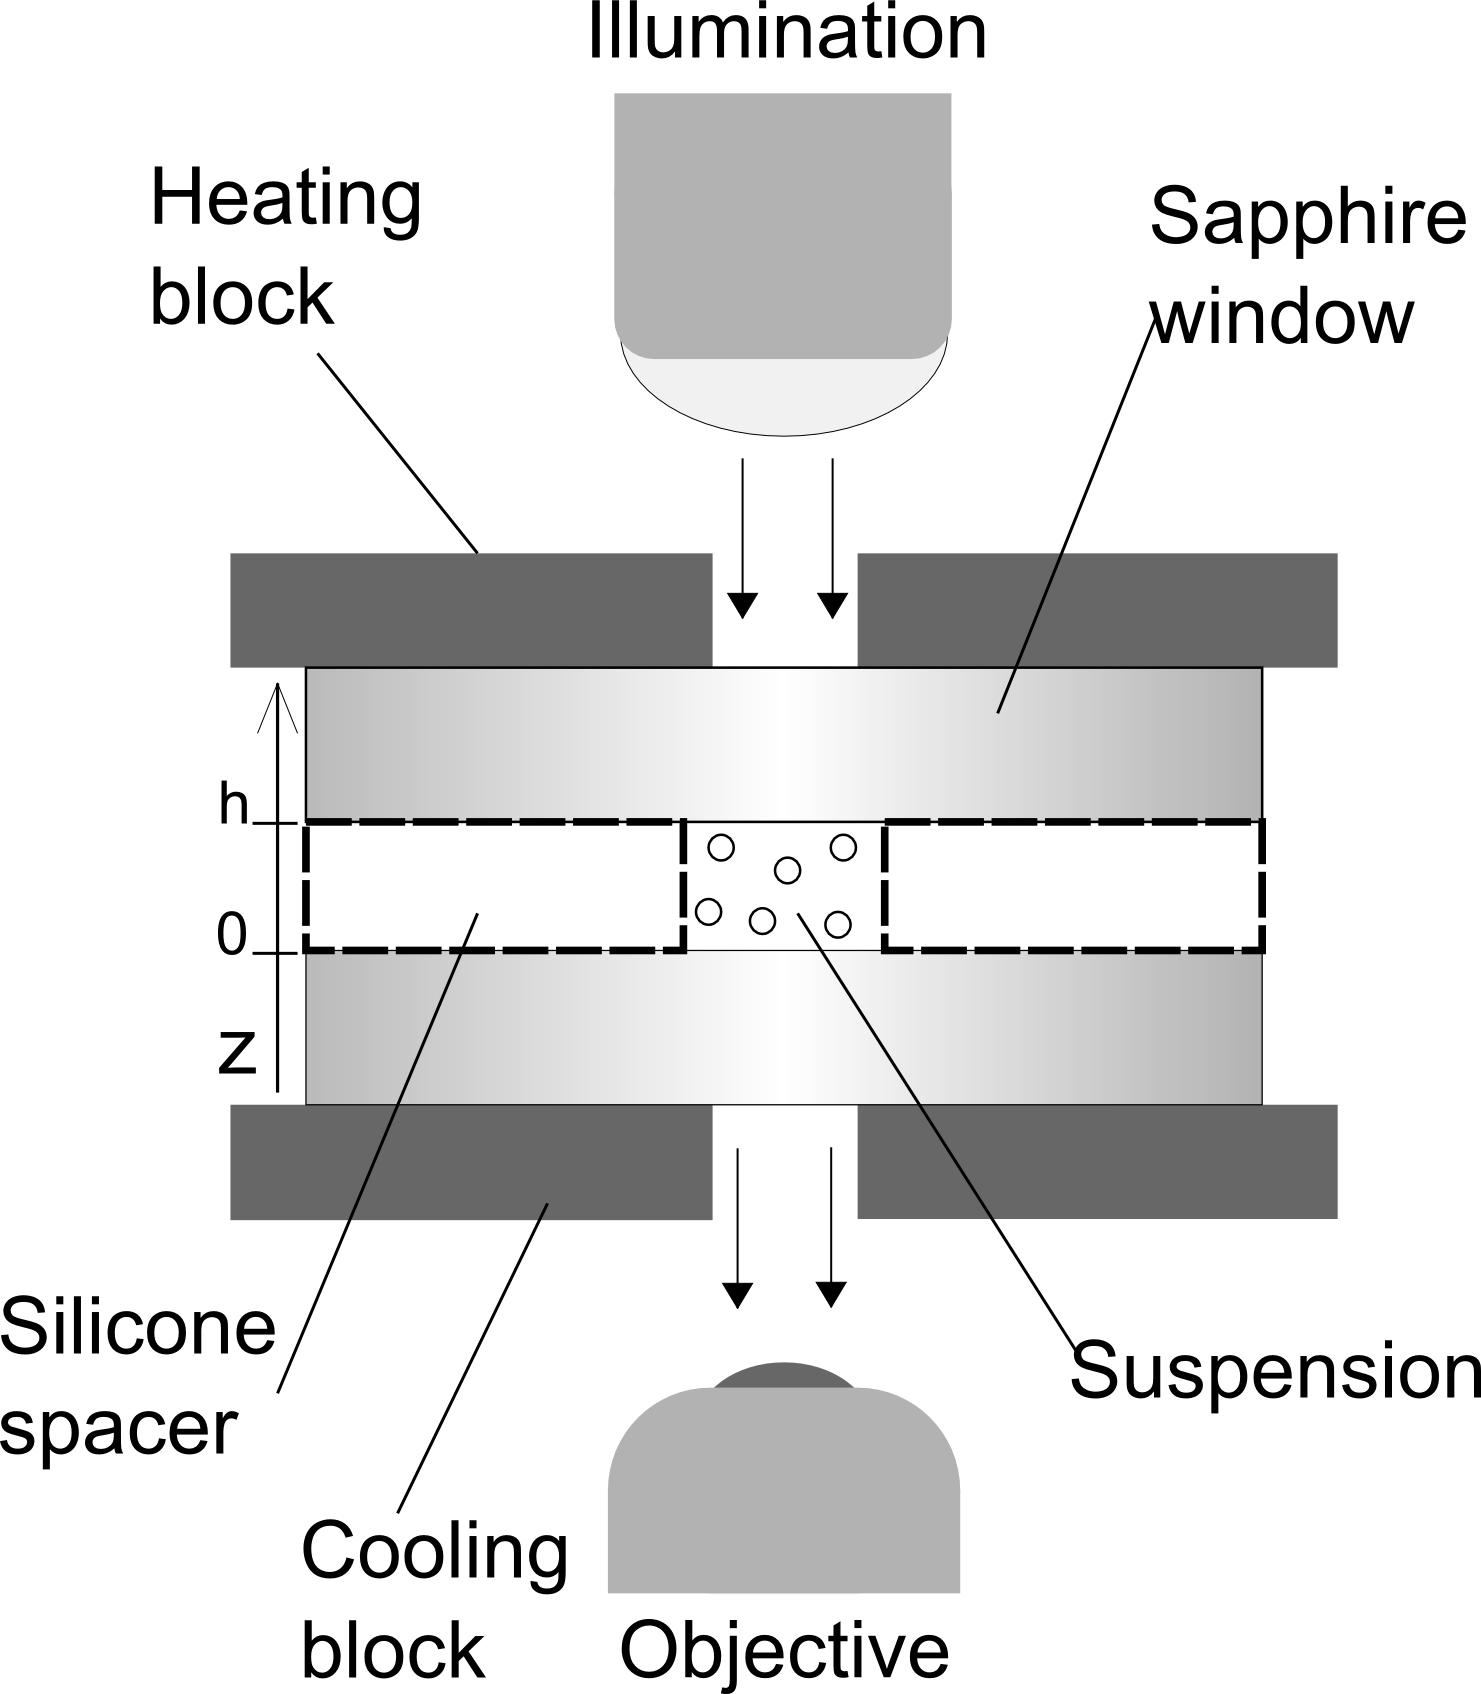 Figure 1
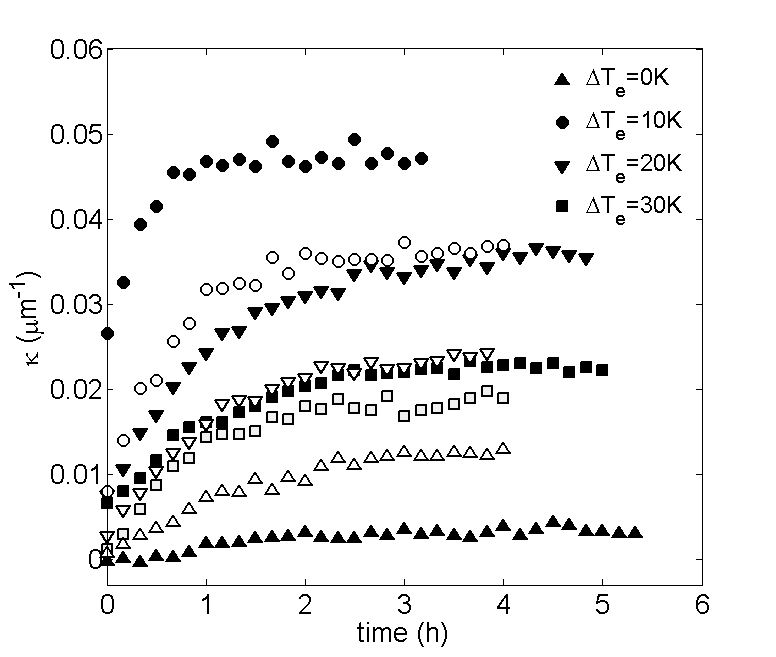 Figure 2
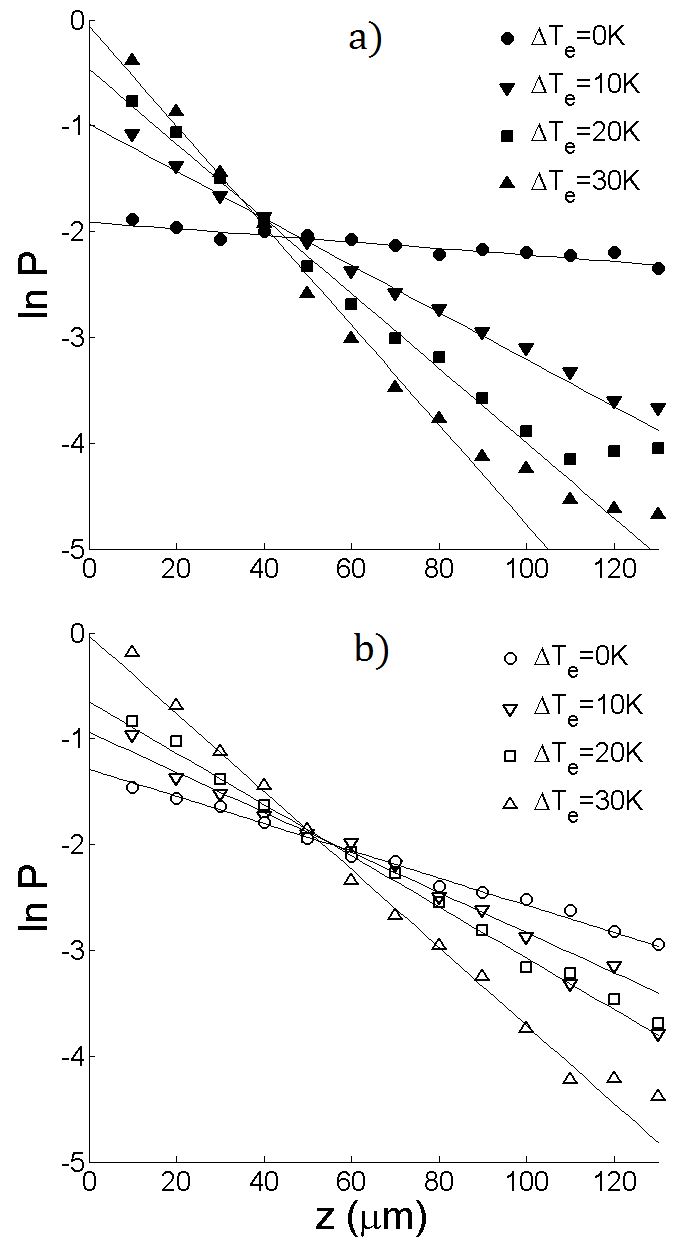 Figure 3
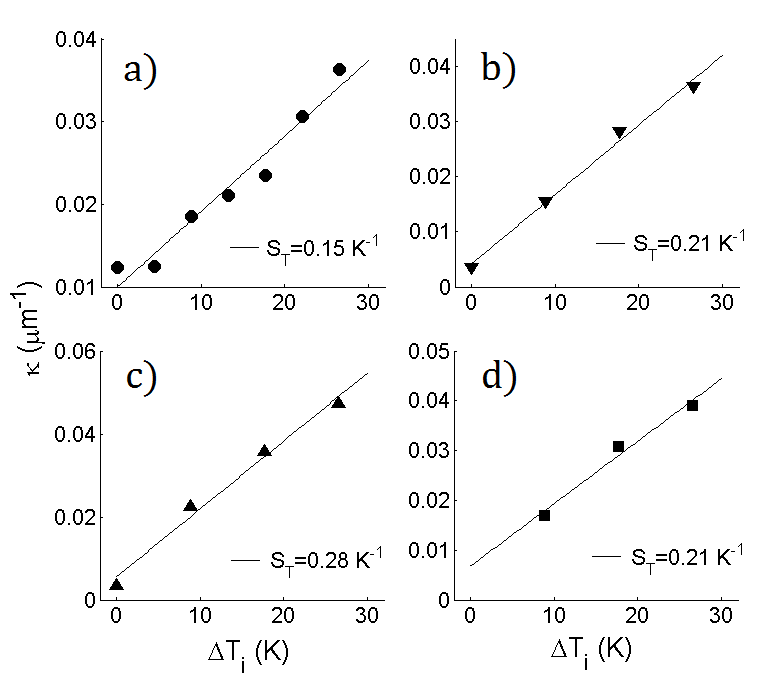 Figure 4
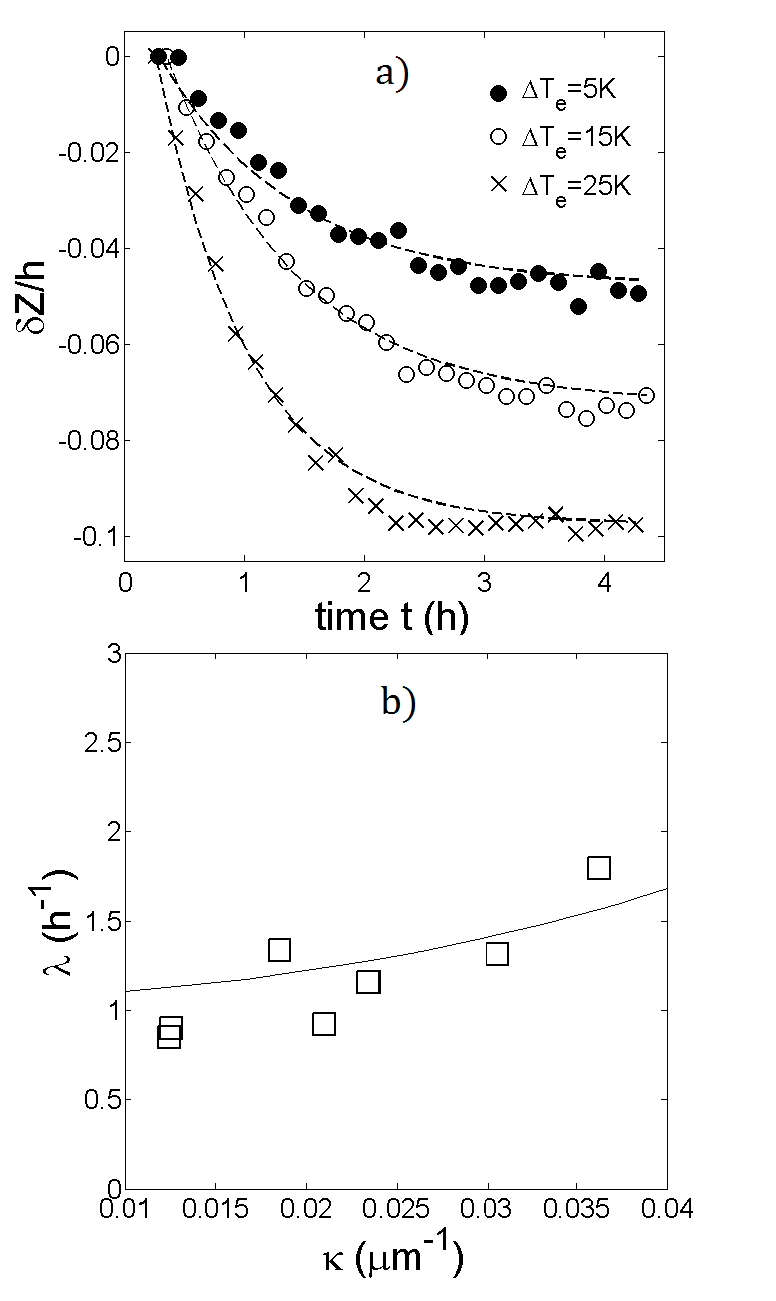 Figure 5
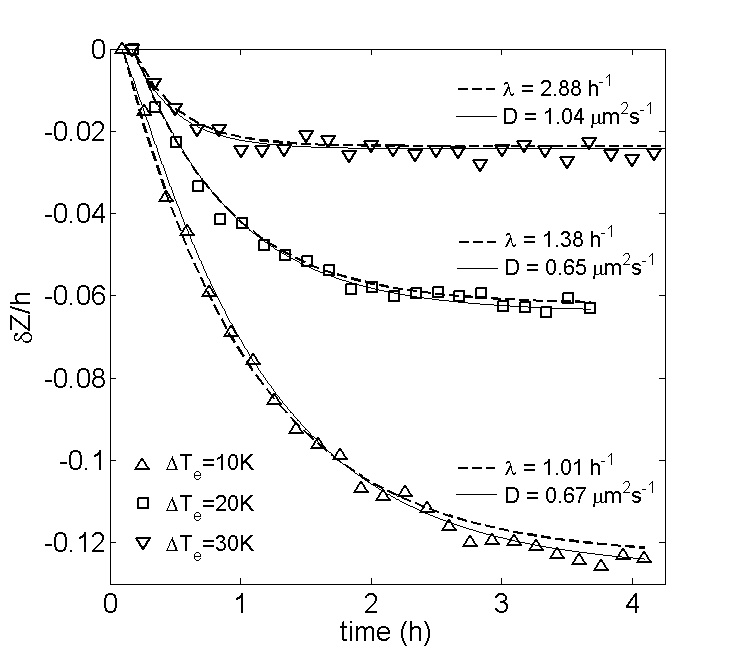 Figure 6
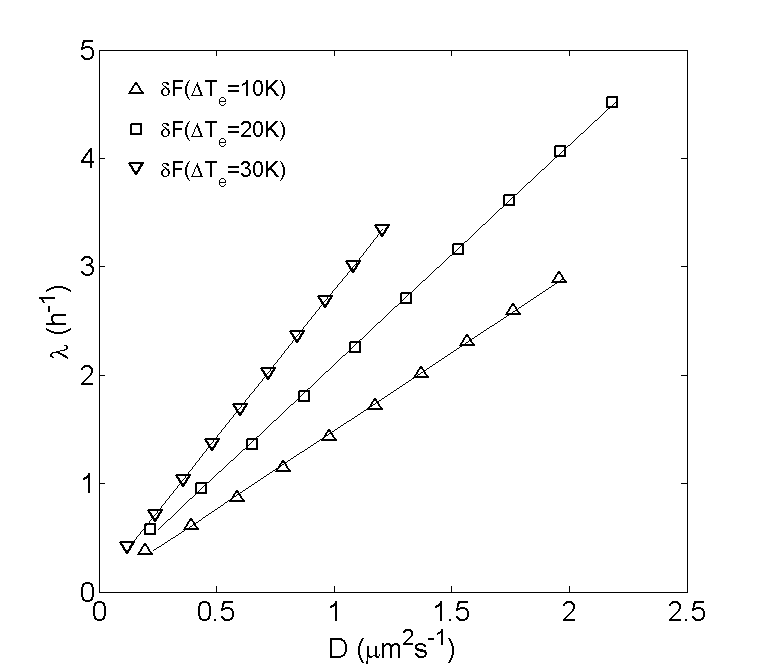 Figure 7
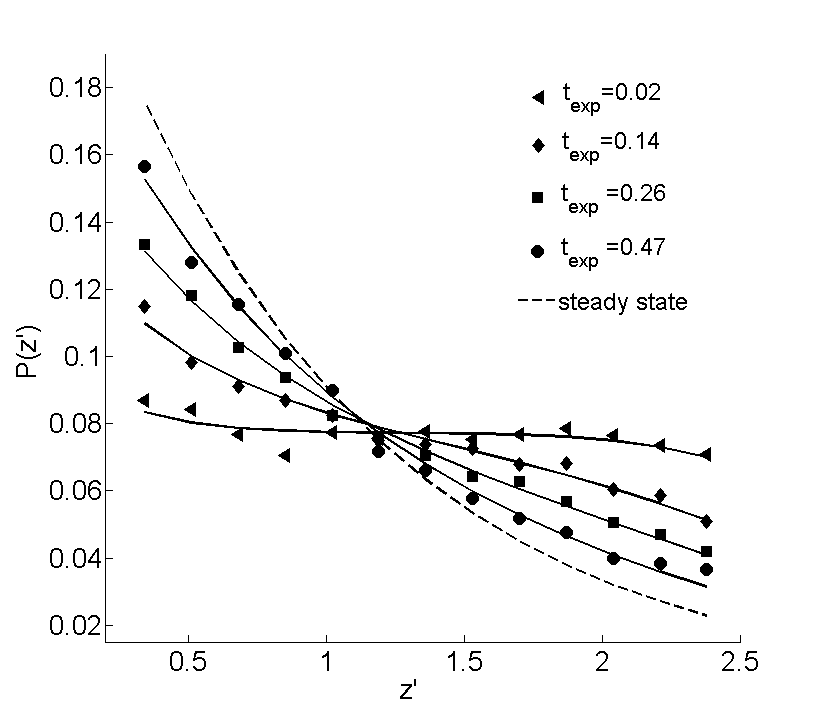 Figure 8
| PS-STV | PS-PEG-N3 | PS-PEG-DNA | |
|---|---|---|---|
| 591 | 446 | 491 | |
| 0.84 | 1.11 | 1.01 | |
| 4.78 | 3.62 | 3.97 |
| in DiW | PS-STV | PS-PEG-N3 | PS-PEG-DNA |
|---|---|---|---|
| 0.25 0.02 | 0.63 0.04 | 0.43 0.03 | |
| -29.5 | -18.9 | -30.6 |
Peer Reviews
No public reviews on file for this paper yet. If you reviewed it on a platform where reviews are public (OpenReview, ICLR, NeurIPS, ICML), you can paste yours below so the community can read it here.
Videos
No videos yet. Explain this paper in a talk, walkthrough, or lecture? Add one.
Colloidal Motion under the Action of a Thermophoretic Force
Jerome Burelbach
[email protected], [email protected]
Cavendish Laboratory, University of Cambridge, Cambridge CB3 0HE, United Kingdom
Mykolas Zupkauskas
Cavendish Laboratory, University of Cambridge, Cambridge CB3 0HE, United Kingdom
Robin Lamboll
Cavendish Laboratory, University of Cambridge, Cambridge CB3 0HE, United Kingdom
Yang Lan
Cavendish Laboratory, University of Cambridge, Cambridge CB3 0HE, United Kingdom
Erika Eiser
[email protected], [email protected]
Cavendish Laboratory, University of Cambridge, Cambridge CB3 0HE, United Kingdom
Abstract
We present thermophoretic measurements in aqueous suspensions of three different polystyrene (PS) particles of varying negative charge, size and surface coating. Our measurement technique is based on the observation of the colloidal steady-state distribution using conventional bright-field microscopy, which avoids undesirable effects such as laser-induced convection or local heating. We find that the colloids with the weakest zeta potential exhibit the strongest thermophoretic effect, suggesting that surface functionality leads to a more intricate dependence of the Soret coefficient on hydrodynamic boundary conditions than predicted by existing theoretical approaches. We also study the relaxation of the colloids to steady-state and propose a model to quantify the relaxation speed, based on the time evolution of the colloidal center of mass. Our observations are well described by this model and show that the relaxation speed tends to increase with the magnitude of the thermophoretic force.
I Introduction
The motion of particles in a temperature gradient is known as thermophoresis. The thermophoretic effect has been studied in a wide range of systems, from charged particles Putnam and Cahill (2005); Duhr and Braun (2006a); Iacopini, Rusconi, and Piazza (2006); Braibanti, Vigolo, and Piazza (2008); Duhr and Braun (2006b); Dhont et al. (2007) or micelles Piazza and Guarino (2002); Piazza (2003) in aqueous electrolyte solutions to polymers in polar and nonpolar solvents Schimpf and Giddings (1987); Zhang et al. (1999); Duhr, Arduini, and Braun (2004); Braun and Libchaber (2002). Experimental evidence suggests that the thermophoretic velocity is insensitive to particle size, making it the ideal candidate for the fractionation of small biomolecules Jeon, Schimpf, and Nyborg (1997), as opposed to dielectrophoresis or magnetophoresis, where the velocity scales with the square of the particle radius Piazza and Parola (2008). It has also been shown that thermophoresis combined with convection can be used as a focussing technique to achieve strong accumulation of DNA Braun and Libchaber (2002), indicating that it might have played a fundamental role in the formation of life Baaske et al. (2007).
Despite these advances, studying thermophoresis in colloidal suspensions remains a challenging task, both experimentally and theoretically. Thermophoresis in dilute suspensions is driven by hydrodynamic stresses resulting from a local interaction between colloid and fluid. This interaction is influenced by a wide range of parameters Piazza and Parola (2008), including intensive variables of the system such as temperature, salinity, pH and solvent expansivity, as well as single colloid properties like shape and surface coating Würger (2010). Some experimental techniques suffer from undesirable effects that inhibit the direct measurement of purely thermophoretic motion, such as local heating or convection induced by external fields. Here, we report measurements based on the observation of the colloidal steady-state distribution in a closed cell, using conventional bright-field microscopy. This method is practically bias-free and has the advantage of capturing all single-particle and collective contributions to thermophoresis. Furthermore, we study the motion of colloids during the relaxation to steady-state and propose a theoretical model to describe this relaxation more quantitatively.
The motion of colloids resulting from thermodynamic gradients in concentration and temperature is quantified by the total particle flux , which is given by Piazza and Parola (2008):
[TABLE]
where is the Fickian diffusion coefficient, is the colloidal concentration, is the thermal diffusion coefficient and is the temperature. The second term on the right hand side of eq. (1) describes the particle flux induced by a temperature gradient. From the relation , the thermophoretic velocity can be identified as . In a closed system, a steady-state of the colloidal component is reached when the total flux vanishes:
[TABLE]
The ratio , also known as the Soret coefficient, quantifies the strength and direction of colloidal thermophoresis.
In dilute suspensions, colloidal pair-interactions can be neglected and the Stokes-Einstein relation can be used to relate the diffusion coefficient to the friction coefficient of the colloid, where is the Boltzmann constant. As a result, the effective force that drives thermophoresis can be written as:
[TABLE]
Using this expression for , the steady-state concentration profile of colloids in a temperature gradient can hence be expressed as:
[TABLE]
Our experimental technique is based on eqs. (2) and (4), which show that the Soret coefficient can be determined from the colloidal concentration profile at steady-state when the temperature gradient is known.
II Materials and Methods
We have performed thermophoretic measurements in aqueous suspensions using three different polystyrene (PS) particles of varying negative charge, size and surface coating, including Streptavidin (PS-STV, from microParticles GmbH), Polyethylenglycol-azide groups (PS-PEG-N3, in house) and Polyethylenglycol-DNA (PS-PEG-DNA, in houseZupkauskas et al. (pted)). The PS particles are either dispersed in deionised water (ACROS Organics, Fisher Scientific), abbreviated as DiW, or custom-made Tris-EDTA buffer ( Tris-HCl and disodium EDTA at pH 8.0, in house), denoted as TE, and diluted down to volume fractions of about . Before each experiment, the suspensions are sonicated for 20 minutes to break up potential aggregates. The hydrodynamic diameters and zeta potentials of the PS particles are obtained from Dynamic Light Scattering (DLS) measurements using a Zetasizer (Nano ZS, Malvern).
A schematic diagram of the setup is shown in fig. 1. The cell for the suspension is made of an ultra thin silicone spacer with a circular hole ( thick, from Silex Silicones LTD), sandwiched between two sapphire windows (32 x 37 x 0.50mm, from UQG Optics). Sapphire is optically transparent and a very good heat conductor, thus guaranteeing a uniform temperature gradient inside the sample. Upon contact, the silicone film immediately sticks to the sapphire window due to strong adhesion forces. A droplet of the suspension () is then introduced and the second window is carefully placed on top of the spacer. Moderate pressure is exerted on the top window to squeeze out any excess liquid and to amplify the adhesion between the windows. The sample is then transferred to a Nikon Eclipse Ti-E inverted microscope, equipped with a Ximea MQ013MG-E2 camera with a E2V EV76C560 CMOS sensor. An extra-long working distance objective is used for bright-field imaging, with a numerical aperture of 0.60, corresponding to a depth of focus of about . The sample is then mounted onto the microscope stage and sandwiched between two copper blocks. Both blocks are connected to PID (proportional integral derivative) controllers and have small central holes for the transmission of light. To avoid large-scale convection, a uniform temperature gradient is set up vertically by heating at the top and cooling at the bottom. For this purpose, the top and bottom blocks are connected to an electric heater and a water bath; and the corresponding temperatures are monitored using thermocouples. The time evolution of the colloidal concentration profile is captured by acquiring images of horizontal slices in 10 minute intervals, spanning the entire height of the cell. The slices are all equally spaced by a vertical distance of 10 and averaged over multiple images to improve the accuracy of the measurement. The local concentration at each altitude is determined via image analysis using a home-developed MATLAB code, based on a binarisation method with a high pass filter for contrast and feature size.
III Thermophoretic Force Measurement at Steady-State
In dilute suspensions, a single colloid is subjected to two different forces, the thermophoretic force and the gravitational pull where . The reduced mass is given by , where is the volume of a colloid and and are the mass densities of the colloid (PS) and solvent (water), respectively. Taking into account the gravitational pull of the suspended particle, the colloidal distribution along the temperature gradient can hence be written as:
[TABLE]
Here, the colloidal concentration has been replaced by its corresponding probability distribution .
In our experiments, we have measured the colloidal concentration profile at steady-state for different temperature gradients, keeping the bottom block at and raising the temperature of the upper block to a maximum of . Within this narrow temperature range, the expansion of water barely effects the reduced mass of the colloid and the thermal energy can be assumed constant. In view of eq. (5), the Soret coefficient can then be identified as the negative slope of the curve defined by vs , allowing a natural elimination of the gravitational pull as a constant offset at . It is important to note that the colloids must be at steady-state before this measurement technique for is applied. An order of magnitude estimate for the relaxation time required to reach this steady-state is given by the diffusive time scale , where is the cell height set by the thickness of the silicone spacer. The diffusion coefficient can be determined from the Stokes-Einstein relation , where is the hydrodynamic diameter of the particle and is the solvent viscosity, which takes the value of for water at room temperature. The values of , and are reported in Table 1.
The complete relaxation to steady-state is verified by monitoring the time evolution of the decay parameter , which we define as the negative slope of the best-fit line to vs . Examples of these time evolutions are shown in fig. (2), for PS-PEG-N3 and PS-STV in DiW. For both systems, reaches a stable value after around 4 hours, which indeed falls into the range of values for given in Table 1. Fig. (3) shows the plots of vs at steady-state for the same systems. It can be seen that the concentration of colloids is highest at the bottom of the cell and falls off rapidly towards the top. The lines represent best fits to the data over the range of - micrometers above the bottom surface. The reason for limiting the fitting to a bulk range is twofold. Apart from colloidal absorption, which tends to be stronger at the bottom due to gravity, lower concentrations give poor statistics close to the top surface. Fluctuations due to poor statistics are visible in fig. 3 at higher altitudes and become more pronounced with increasing temperature difference. A most notable feature of fig. 3 is the linearity of in the bulk. In view of eq. (4), this linearity implies that the Soret coefficient is constant throughout the suspension, meaning that the colloids are subjected to a uniform thermophoretic force. At steady-state, the decay parameter can thus be related to the Soret coefficient via:
[TABLE]
where . Knowing the cell height and the internal temperature difference inside the suspension, can hence be determined from:
[TABLE]
The internal temperature difference differs from the externally applied difference due to the finite thermal conductivity of sapphire. By treating the sapphire windows and suspension as conducting elements in series, it can be shown that:
[TABLE]
where is the thickness of a sapphire window and and are the thermal conductivities of sapphire and water, respectively. Using these values, we obtain the relation .
The plots of vs are shown in fig. 4 for all studied systems. It should be noted that the measurements on PS-STV were performed on different samples, thus explaining the higher noise level in fig. 4a. The relative sample error associated with these measurements is and is likely due to a fluctuating pH in DiW. It can be seen that is approximately linear for each system, indicating that is linear in and that is rather insensitive to temperature. The values of obtained from eq. (7) are also displayed in fig. 4 and are exclusively positive, corresponding to a thermophobic behaviour of all studied PS particles. The values of measured in DiW deserve particular attention, as they do not conform with theoretical predictions for charged colloids in aqueous electrolyte solutionsParola and Piazza (2004); Würger (2010). More generally, these models predict that the ratio increases with the magnitude of the zeta potential . For comparison, the measured values of and in DiW are given in Table 2. Although the value of may fluctuate in DiW (), these measurements show that PS-PEG-N3 clearly has the weakest zeta potential. This is mainly due to the azide () groups on the colloidal surface. Unlike DNA, which carries a net negative charge, the azide groups are neutral and therefore reduce the zeta potential by shifting the hydrodynamic slip plane away from the charged surface. However, the ratio has been found to be highest for PS-PEG-N3 (), which opposes the theoretical prediction that increases with the magnitude of . Our measurements thus support the interpretation of thermophoresis as an interfacial effect, but also suggest that surface functionality might lead to a more intricate dependence of on hydrodynamic boundary conditions than predicted by the aforementioned -model.
IV Colloidal Center of Mass Motion in Response to a Thermophoretic Force
Although the colloidal steady-state has previously been exploited to determine , very little is known about the relaxation process behind this steady-state. The diffusive time scale yields a rough estimate for the relaxation time but provides no further insight into the underlying relaxation dynamics. In biological processes however, we are often interested in how a collection of confined particles or molecules relaxes to steady-state under the action of a weak thermodynamic force, the accumulation of biomolecules in out-of-equilibrium pores being an important example Baaske et al. (2007). A theoretical model is therefore required that allows a more quantitative description of this collective relaxation. Here, we propose the colloidal center of mass (CoM) as a natural candidate for this description, defined as:
[TABLE]
Our theoretical consideration starts from the continuity equation for an effectively one-dimensional, closed system in the absence of particle generation:
[TABLE]
is the linear probability density, satisfying . The CoM is then simply related to via . The corresponding probability flux is given by:
[TABLE]
where is the total force on a colloid. As the temperature variation inside the system is very small (, the diffusion coefficient and friction coefficient of a colloid can be taken as approximately constant. With the expression for given by eq. (11), the continuity equation (10) can then be rewritten in terms of rescaled variables:
[TABLE]
where and . Here, we compare our experimental data to numerical solutions of eq. (12), using a standard PDE-solver (MATLAB). By assuming perfectly reflecting boundaries at and , eqs. (10) and (11) can further be used to derive the following equation of motion for the colloidal CoM:
[TABLE]
where is the CoM velocity. The term has an entropic nature and is given by:
[TABLE]
As only has a simple stationary form at steady-state, there is no straightforward analytical prediction for the time evolution of .
Let us now consider the case where the system is at steady-state. The colloidal CoM has reached a stable position () and the force balance is given by . The system is then suddenly subjected to a constant perturbation at time , e.g. by increasing the temperature gradient. The resulting CoM shift will induce an entropic response that opposes the external perturbation until a new steady-state is reached. It thus follows that acts as a restoring force, satisfying . To make progress in quantifying the CoM relaxation, we examine the weak perturbation limit by assuming a linear response relation of the form . Eq. (13) can then be solved analytically, giving:
[TABLE]
where is the final CoM shift over the entire system, in response to the perturbation . Following eq. (15), we propose that the temporal decay constant can be used to quantify the speed of the relaxation to steady-state. In view of eq. (13), should further satisfy the relation:
[TABLE]
As eq. (15) relies on reflecting boundaries, it must be noted that some of our colloids suffered from weak surface absorption to the sapphire windows, in particular PS-STV in DiW. Although the number of absorbed colloids saturates during the relaxation, absorption can temporarily perturb the free evolution of the CoM. Furthermore, the system boundaries have to be excluded from the data analysis, leading to deviations from eq. (16) when the CoM is only tracked over a limited bulk range of the system. Nonetheless, we find that the CoM relaxation of PS-STV in DiW is well fitted by an exponential decay. For this system, each relaxation was studied in a separate experiment where an initially uniform distribution of colloids was subjected to a thermophoretic force fixed by the externally applied temperature difference . Three of these relaxations are displayed in fig. 5a, together with their exponential fits from which the relaxation speed is determined. In fig. 5b, these values of are plotted against the corresponding values of , which are directly related to the magnitude of via eq. (6). It can be seen that tends to increase with , corresponding to shorter relaxation times for stronger thermophoretic forces. The same conclusion is drawn from the trend of as obtained from numerical solutions of eq. (12). Although assuming reflecting boundaries, the numerical curve (full line) displays a good agreement with the experimental data. The observed trend of can clearly not be explained by the diffusive time-scale , which just gives , with no allowance for a dependence on .
Fig. (6) shows the relaxation of PS-PEG-N3 in TE, for which no surface absorption was observed. The CoM shifts are again very well fitted by our exponential model (dashed lines). This system was measured in a single experiment, so that the initial concentration was uniform for the relaxation at and subsequently fixed by the previously reached steady-states for the relaxations at and . For each relaxation, the perturbation is thus fixed by the difference between the values of at the final and initial steady-state. In units of , these are given by , and in order of increasing . The corresponding values of are reported in fig. 6 and indicate that the relaxation speed increased rapidly with the incremental increase of . As the magnitude of barely changed from one relaxation to the next, the observed increase of with in this experiment is mainly related to the initial condition, showing that the CoM relaxes faster when the distance to steady-state is reduced.
Due to the absence of absorption, the CoM shift of PS-PEG-N3 can be directly compared to numerical solutions of eq. (12). For this purpose, the solutions (full lines in fig. 6) were obtained by using the diffusion coefficient as a fitting parameter to reproduce the measured value of most accurately. This is achieved by extracting from a curve of vs based on eq. (12), for each perturbation and corresponding initial condition. These curves are shown in fig. 7 and display a linear relationship for each relaxation. Interestingly, the thus determined optimal value of is always smaller than the value of for PS-PEG-N3 obtained from the Einstein relation, the difference being particularly large for the relaxations at and , where the optimal value is roughly . A possible reason for this discrepancy might be the existence of hydrodynamic effects, giving rise to an additional time-dependent term in eq. (11) that slows down the relaxation and disappears at steady-state. However, fig. 8 suggests that these effects do not influence the -dependence of eq. (12), as the observed shape of the concentration profile of PS-PEG-N3 is always well fitted by a corresponding numerical solution.
V conclusion
We have introduced a measurement technique for thermophoresis that is based on observing the change of the colloidal steady-state concentration profile with the applied temperature gradient. This method automatically eliminates the gravitational pull and is free of any other external influences, allowing a clean and direct measurement of the Soret coefficient. Our measurements show that the Soret coefficient is rather insensitive to temperature for charged PS particles in aqueous suspensions. Further, the measured thermophroretic force varies linearly with the temperature gradient, supporting the linear-response assumption of the theory of non-equilibrium thermodynamics. Our results also suggest that surface functionality plays an intricate role in thermophoresis that cannot be explained by considerations of surface potential only. We have also investigated the relaxation to steady-state by studying the CoM motion of the colloids. The observed CoM motion is in agreement with a theoretical model that predicts an exponential decay to steady-state. The decay speed has been found to depend on both the initial condition and the thermophoretic force, with a tendency to increase with the magnitude of the force. This insight cannot be gained from an estimate based on the diffusive time-scale, which only predicts a linear dependence on the diffusion coefficient.
VI Acknowledgements
This work was funded by the Winton Programme for the Physics of Sustainability, Unilever Case and EPSRC (Grant No. 1353070). We are greatly indebted to Emma Talbot and Jurij Kotar for helpful advice and would like to thank Daan Frenkel and Alessio Caciagli for fruitful discussions.
The reference list from the paper itself. Each links out to its DOI / PubMed record.
- 1Putnam and Cahill (2005) S. A. Putnam and D. G. Cahill, “Transport of nanoscale latex spheres in a temperature gradient.” Langmuir : the ACS journal of surfaces and colloids 21 , 5317–23 (2005) . · doi ↗
- 2Duhr and Braun (2006 a) S. Duhr and D. Braun, “Why molecules move along a temperature gradient,” Proceedings of the National Academy of Sciences of the United States of America 2006 (2006 a).
- 3Iacopini, Rusconi, and Piazza (2006) S. Iacopini, R. Rusconi, and R. Piazza, “The ”macromolecular tourist”: universal temperature dependence of thermal diffusion in aqueous colloidal suspensions.” The European physical journal. E, Soft matter 19 , 59–67 (2006) . · doi ↗
- 4Braibanti, Vigolo, and Piazza (2008) M. Braibanti, D. Vigolo, and R. Piazza, “Does Thermophoretic Mobility Depend on Particle Size?” Physical Review Letters 100 , 108303 (2008) . · doi ↗
- 5Duhr and Braun (2006 b) S. Duhr and D. Braun, “Thermophoretic Depletion Follows Boltzmann Distribution,” Physical Review Letters 96 , 168301 (2006 b) . · doi ↗
- 6Dhont et al. (2007) J. K. G. Dhont, S. Wiegand, S. Duhr, and D. Braun, “Thermodiffusion of Charged Colloids: Single-Particle Diffusion,” Langmuir , 1674–1683 (2007).
- 7Piazza and Guarino (2002) R. Piazza and A. Guarino, “Soret Effect in Interacting Micellar Solutions,” Physical Review Letters 88 , 208302 (2002) . · doi ↗
- 8Piazza (2003) R. Piazza, “Thermal diffusion in ionic micellar solutions,” Philosophical Magazine 83 , 2067–2085 (2003) . · doi ↗