Search for the Dimuon Decay of the Higgs Boson in $pp$ Collisions at $\sqrt{s}$ = 13 TeV with the ATLAS Detector
ATLAS Collaboration

TL;DR
This paper reports a search for the Higgs boson decaying into two muons using 13 TeV proton-proton collision data from the ATLAS detector, setting upper limits on the decay rate relative to the Standard Model.
Contribution
First search for Higgs to dimuon decay at 13 TeV with ATLAS, providing new upper limits on the decay rate compared to the Standard Model.
Findings
No significant excess observed above background.
Upper limit on cross section times branching ratio is 3.0 times the Standard Model at 13 TeV.
Combined data yields an upper limit of 2.8 times the Standard Model.
Abstract
A search for the dimuon decay of the Higgs boson was performed using data corresponding to an integrated luminosity of 36.1 fb collected with the ATLAS detector in collisions at TeV at the Large Hadron Collider. No significant excess is observed above the expected background. The observed (expected) upper limit on the cross section times branching ratio is 3.0 (3.1) times the Standard Model prediction at the 95% confidence level for a Higgs boson mass of 125 GeV. When combined with the collision data at TeV and TeV, the observed (expected) upper limit is 2.8 (2.9) times the Standard Model prediction.
Click any figure to enlarge with its caption.
 Figure 1
 Figure 2
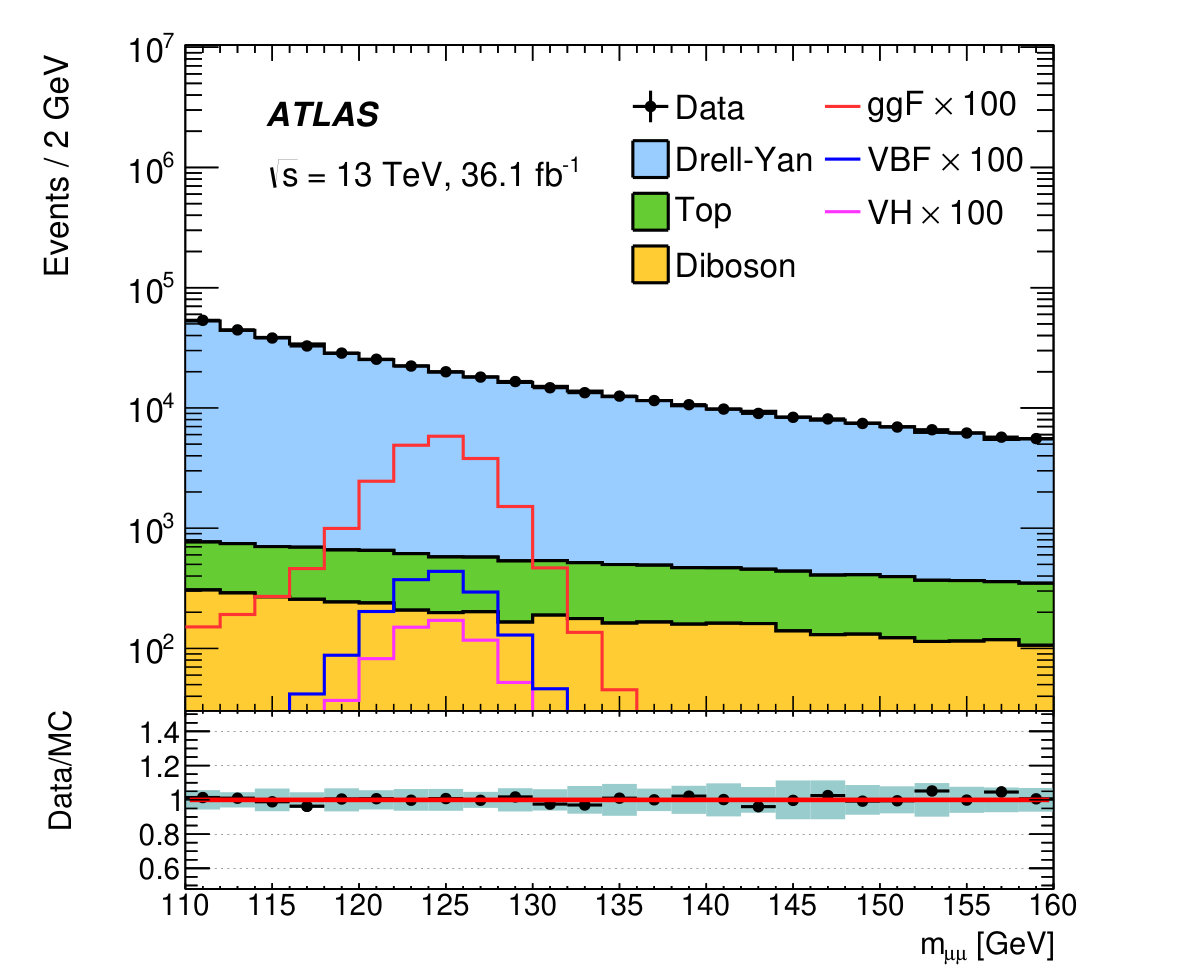 Figure 1
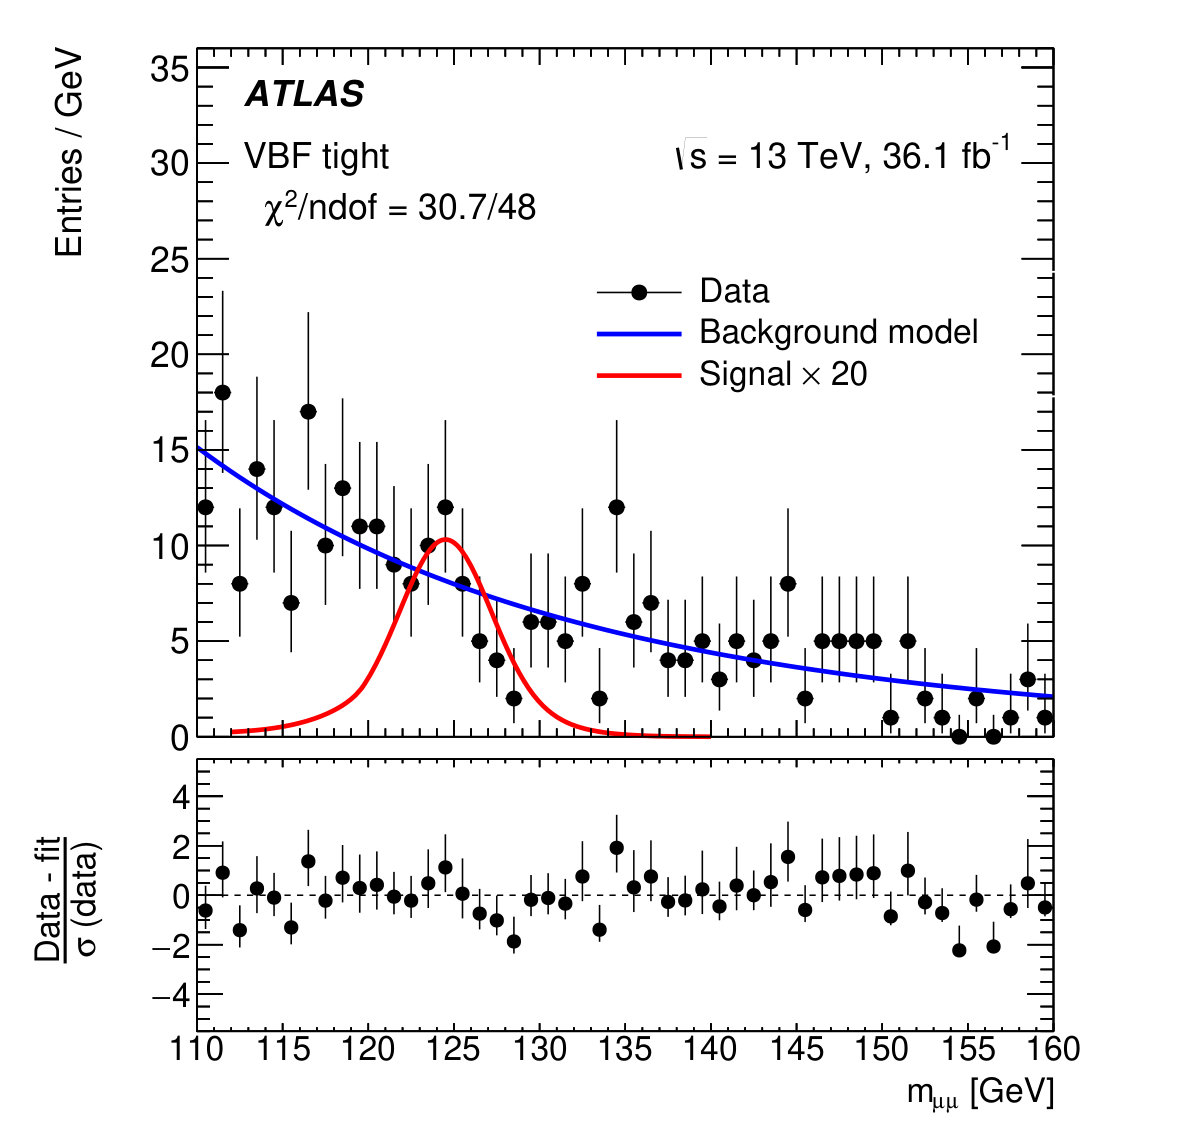 Figure 2
| / | FWHM (GeV) | Data | |||
|---|---|---|---|---|---|
| Central low | 11 | 8000 | 0.12 | 5.6 | 7885 |
| Noncentral low | 32 | 38000 | 0.16 | 7.0 | 38777 |
| Central medium | 23 | 6400 | 0.29 | 5.7 | 6585 |
| Noncentral medium | 66 | 31000 | 0.37 | 7.1 | 31291 |
| Central high | 16 | 3300 | 0.28 | 6.3 | 3160 |
| Noncentral high | 40 | 13000 | 0.35 | 7.7 | 12829 |
| VBF loose | 3.4 | 260 | 0.21 | 7.6 | 274 |
| VBF tight | 3.4 | 78 | 0.38 | 7.5 | 79 |
Peer Reviews
No public reviews on file for this paper yet. If you reviewed it on a platform where reviews are public (OpenReview, ICLR, NeurIPS, ICML), you can paste yours below so the community can read it here.
Videos
No videos yet. Explain this paper in a talk, walkthrough, or lecture? Add one.
\PreprintIdNumber
CERN-EP-2017-078
\AtlasTitleSearch for the Dimuon Decay of the Higgs Boson in Collisions at = 13 TeV with the ATLAS Detector \AtlasJournalRefPhys. Rev. Lett. 119 (2017) 051802 \AtlasDOI10.1103/PhysRevLett.119.051802 \AtlasAbstractA search for the dimuon decay of the Higgs boson was performed using data corresponding to an integrated luminosity of 36.1 fb*-1* collected with the ATLAS detector in collisions at TeV at the Large Hadron Collider. No significant excess is observed above the expected background. The observed (expected) upper limit on the cross section times branching ratio is 3.0 (3.1) times the Standard Model prediction at the 95% confidence level for a Higgs boson mass of 125 GeV. When combined with the collision data at TeV and TeV, the observed (expected) upper limit is 2.8 (2.9) times the Standard Model prediction.
In July 2012, the ATLAS and CMS Collaborations discovered a new particle with a mass of approximately 125 GeV [1, 2, 3] at the CERN Large Hadron Collider (LHC). Subsequent measurements have indicated that this particle is consistent with the Standard Model (SM) Higgs boson [4, 5, 6, 7, 8, 9, 10], denoted by . The decay is a sensitive channel in which the Higgs coupling to second-generation fermions can be measured with a clean final-state signature at the LHC. The SM branching ratio for the Higgs boson to dimuon decay is [11] for GeV. Several scenarios beyond the SM [12, 13, 14] predict a higher branching ratio. Any deviation from the SM prediction could be a sign of new physics. The ATLAS experiment carried out a search for the process using data collected in 2011 and 2012 (LHC Run 1), corresponding to integrated luminosities of 4.5 at a center-of-mass energy TeV and 20 at TeV [15]. For a Higgs boson with a mass of 125 GeV, an observed (expected) upper limit of 7.1 (7.2) was set at the 95% confidence level (C.L.) on the signal strength, defined as the production rate of the process normalized to the SM prediction. The CMS experiment also performed searches for the process with data collected in LHC Run 1 [16]. The observed (expected) upper limit from CMS on the signal strength was 7.4 (6.5) at the 95% C.L. for a Higgs boson with GeV.
In this Letter, a search for the dimuon decay of the Higgs boson is presented. The Higgs boson mass is assumed to be GeV for all the results presented in this Letter. The search is performed using collision data recorded with the ATLAS detector in 2015 and 2016 at TeV. The data set corresponds to an integrated luminosity of . This analysis selects events with exactly two opposite-charge muons and classifies them into eight orthogonal categories. Two categories are defined using a multivariable discriminant and provide good sensitivity to the vector-boson fusion (VBF) process. Signal events produced in the VBF process tend to have two high- forward jets in opposite detector hemispheres and little hadronic activity between them. The other six categories are sensitive to signal events produced in the gluon–gluon fusion (ggF) process and are defined with different requirements on muon pseudorapidity () and the transverse momentum of the dimuon system (). The dominant irreducible background is the (Drell-Yan) process. A simultaneous fit to distributions of the dimuon invariant mass in all the categories is performed in the range 110 to 160 GeV to extract the overall signal strength and determine the background normalizations and shapes. The fitting range is chosen to avoid the boson mass peak and have enough data events to constrain the background.
The ATLAS detector[17] at the LHC covers nearly the entire solid angle around the collision point [18]. It consists of an inner tracking detector (ID) surrounded by a thin superconducting solenoid, electromagnetic and hadronic calorimeters, and a muon spectrometer (MS) incorporating three large superconducting toroidal magnets. Events used in this analysis were recorded using a combination of single-muon triggers, with the transverse momentum () threshold being 26 GeV for isolated muons or 50 GeV for muons without any isolation requirement imposed. The trigger efficiency is about 95% for the signal processes.
Monte Carlo (MC) simulated samples are used to optimize the event selection, to model the signal processes and to develop an analytic function to model the distributions for the total background. Signal events from the ggF and VBF processes were generated with Powheg-box v2 [19] at next-to-leading order (NLO) in quantum chromodynamics (QCD) using the CT10 [20] parton distribution function (PDF) set and Pythia8 [21] for parton showering and hadronization. Pythia8 was also used to model events produced in association with a or boson (). The hadronization and underlying-event parameters were set according to the AZNLO tune based on the boson distribution measurement in 7 TeV collisions [22]. The simulated Higgs boson spectrum for the ggF process is tuned to match the HRes prediction [23, 24].
The signal samples are normalized to the predicted cross sections times branching ratio. The production cross sections of the Higgs boson at TeV are reported in Refs. [25, 26, 11]. The cross section for the ggF process is calculated at next-to-next-to-next-to-leading-order QCD [27] and NLO electroweak accuracies [28, 29]. Both the VBF and cross sections are computed with next-to-next-to-leading-order QCD [30] and NLO electroweak precision [31, 32, 33]. The branching ratio for the decay is calculated using Hdecay [34] at NLO in QCD.
Drell-Yan background events were generated with MadGraph5 [35] with the NNPDF23LO [36] PDF set interfaced to Pythia8. The and single-top quark samples were generated with Powheg-box v2 using the CT10 PDF set interfaced to Pythia6 [37] for parton showering and hadronization. The diboson processes (, , and ) were generated with Sherpa v2.1 [38] with the CT10 PDF set.
All simulated samples were processed through the full ATLAS detector simulation[39] based on Geant4[40]. The effects arising from multiple collisions in the same or neighboring bunch crossings (pileup) were included in the MC simulation. Events are reweighted such that the distribution of the average number of interactions per bunch crossing matches that observed in data. Simulated events are corrected to reflect the muon momentum scale and resolution and the muon trigger and identification efficiencies measured in data.
Events are required to contain at least one reconstructed collision vertex candidate with at least two associated ID tracks each with GeV. The vertex with the largest sum of of tracks is considered to be the primary vertex. Dimuon events are selected by requiring two opposite-charge muons. Muons are reconstructed by combining tracks in the ID with tracks in the MS. Candidate muons are required to satisfy the “medium” criteria defined in Ref. [41] and required to have GeV and . Muons are matched to the primary vertex by requiring the longitudinal impact parameter to satisfy mm, where is the polar angle of the track. The significance of the transverse impact parameter calculated with respect to the measured beam line position is required to satisfy , where is the uncertainty in . Furthermore, the “loose” isolation criteria described in Ref. [41] are applied to suppress muons from -hadron decays. Jets are reconstructed using the anti- algorithm [42] with a radius parameter of . Candidate jets must have , and the jet must be larger than 25 (30) GeV for 2.5 (2.5 4.5). To suppress pileup contributions, an additional requirement using the track and vertex information inside a jet [43] is imposed on jets with and GeV. Top quark production is the second largest background with neutrinos and hadrons in the final states. Jets containing hadrons with 2.5 are identified as -tagged jets using a multivariate -tagging algorithm that provides a 60% efficiency and a rejection factor of more than 1000 for light-flavor jets [44]. Neutrinos escape from the detector and lead to missing transverse momentum . The is defined as the magnitude of the negative vectorial sum of the transverse momenta of the selected and calibrated physics objects (including muons and jets) and the ID tracks not associated with any physics object (soft term) [45]. To reduce the top quark contribution, events are required to have 80 GeV and no -tagged jets.
To ensure a high trigger efficiency, the leading muon must have > 27 GeV. These criteria form the preselection, and events passing the preselection with GeV constitute the inclusive signal region. The signal efficiency is 57% (59%) for the ggF (VBF) process. The distributions for data and MC events in the inclusive signal region are shown in Figure 1.
The VBF categories are only considered for events containing at least two jets. To optimize the selections, several kinematic variables that are sensitive to the characteristics of the VBF production are used. For jet-related variables, only the two jets with highest are considered, with the leading (subleading) jet denoted by (). Among those variables, the most sensitive ones are dijet invariant mass (), , difference in pseudorapidity , and angular distance between the two jets. Other variables with less discriminating power include transverse momentum of the dijet system (), , scalar sum of muons and jets (), of the system containing two muons and one or two jets (, and ), rapidity difference between the dimuon system and the jets (, and ), and “centrality”, defined as the difference between the dimuon rapidity and the averaged jet rapidity divided by the absolute rapidity difference between and . The MC modeling of these variables for the Drell-Yan process is compared with data in the region with 76 GeV < < 106 GeV, and no significant mismodeling is found. All these variables are combined into a multivariate discriminant, which is then trained using MC events with a boosted-decision-tree (BDT) method [46, 47, 48] to maximize the separation between the VBF signal and the total background. Events with a larger BDT score are more signallike, while background events tend to populate the low BDT score region. Finally, events with BDT score 0.9 constitute one of the VBF categories (“VBF tight”), and the other one (“VBF loose”) is defined with .
The remaining events that are not selected for the VBF categories all enter into the ggF categories. Signal events from the ggF process tend to have a harder spectrum than Drell-Yan events due to the higher initial-state QCD radiation. To take advantage of this feature, events are separated into three categories: “low ” ( GeV), “medium ” (15 GeV 50 GeV), and “high ” ( 50 GeV). Since the muon momentum resolution in the barrel region () is better than that in the end cap regions (), events in each category are further divided according to the pseudorapidities of the muons. Requiring both muons to have forms the “central” category, while the remaining events constitute the “noncentral” category.
Table 1 shows the expected signal and background event yields as well as the observed number of data events within an interval in each category. Each chosen interval is centered at the simulated signal peak and contains 90% of the expected signal events. These numbers are provided to demonstrate the expected detection sensitivity, while in the final results, the signal and background yields are determined by fitting the observed distributions.
Analytical models are used to describe the distributions for both the signal and background processes. To describe the Higgs boson peak with a lower-mass tail due to final-state photon radiation, the signal model is chosen as the sum of a Crystal Ball function (CB) [49] and a Gaussian function (GS):
[TABLE]
where is the fraction of the CB contribution when each component (CB or GS) is normalized to unity. The parameters and define the power-law tail of the CB distribution. The parameters , , , and denote the CB mean value, GS mean value, CB width, and GS width, respectively. These parameters are determined for each signal category by fitting the signal model to the simulated spectrum. In each category, the ggF, VBF, and signal shapes are obtained separately and then combined into the total signal shape according to their SM predictions.
The background model should be able to describe the steeply falling distributions from the dominant Drell-Yan process. At the same time, it should have sufficient flexibility to absorb potential differences between data and MC simulation, and allow variations in the spectra due to different selections and additional contributions from minor background processes. The adopted model is the sum of a Breit-Wigner function (BW) convolved with a GS, and an exponential function divided by a cubic function:
[TABLE]
where is the fraction of the BW component when each component is normalized to unity. The parameter in each category is fixed to the corresponding average resolution as determined from MC Drell-Yan events. For all the categories, the BW parameters are fixed to GeV and GeV [50]. The parameters and are unconstrained and uncorrelated between different categories.
A binned maximum-likelihood fit to the observed distributions in the range is performed using the sum of the signal and background models (“S+B model”). The fit is done simultaneously in all the categories. In addition to the background model parameters ( and A) described earlier, the background normalization in each category is a free parameter in the fit. The product of the signal strength and the expected signal yield gives the signal normalization in each category.
The expected signal yields used in the fit are subject to experimental and theoretical uncertainties. The systematic uncertainties in the expected signal are correlated between all the categories.
The uncertainty in the combined 2015 and 2016 integrated luminosity is 3.2%, derived, following a methodology similar to that detailed in Ref. [51], from a preliminary calibration of the luminosity scale using – beam-separation scans performed in August 2015 and May 2016. Other sources of experimental uncertainty include the muon reconstruction and identification efficiencies, the efficiencies due to the trigger, isolation and impact parameter requirements, the muon momentum scale and resolution, the determination of the soft term, the -tagging efficiency, the pileup modeling, as well as the jet energy scale and resolution. The total experimental uncertainty in the predicted signal yield in each ggF category is between 4% and 6%, dominated by the luminosity, muon, jet, and pileup contributions. The experimental uncertainty increases to 15% in the VBF categories, due to larger contributions from the jet energy scale and resolution uncertainties. The effects of the experimental uncertainties in the predicted signal shapes are found to be minor and are therefore neglected in this search.
The theoretical uncertainties in the production cross section of the Higgs boson and the decay branching ratio are set according to Refs. [25, 26]. The uncertainty in the signal acceptance in the ggF categories, due to the modeling of the Higgs boson spectrum, is estimated by varying the QCD scales used in the HRes program. The acceptance uncertainties of ggF signal events in the VBF categories are estimated using the method described in Ref. [15]. The uncertainties associated with the modeling of multiparton interactions are estimated by turning them off in the event generation, according to the recommendations in Ref. [11]. The uncertainty in the ggF signal prediction ranges from 15% to 25%, dominated by the uncertainties due to omitted high-order effects. The total theoretical uncertainty in the VBF signal yield in each category is typically around 5%.
Any systematic bias in the background model when describing the underlying spectrum might result in spurious signal events in the measurement. In each category, the number of spurious signal events () is estimated by fitting the parameterized S+B model to the simulated background distribution in the range 110–160 GeV. The spectra are obtained from large Drell-Yan MC samples, which were produced with Powheg-box v2 [19] and MadGraph5 [35] for the ggF and VBF categories, respectively, and correspond to an equivalent integrated luminosity of about 5 ab*-1*. Values of are derived for three nearby Higgs boson masses (120, 125, and 130 GeV), and from these the largest value between the yields and their statistical uncertainties is taken as the value for a certain category. A detailed discussion about how is used in the fitting procedure is given in Ref. [52]. The background modeling uncertainty is treated as uncorrelated among all the categories. This uncertainty varies from 8% to 50% of the statistical uncertainties of the background, depending on the selection category. The impact of the background mismodeling on the expected upper limit on the signal strength is about 2%.
The observed spectrum is compared to the background-only fit in Figure 2 for the VBF tight category.
The S+B model is fitted to the observed spectra in eight signal categories simultaneously, and the measured overall signal strength is . An upper limit on is computed using a modified frequentist CL method [53, 54] with the profile-likelihood-ratio test statistic [53]. The observed (expected) upper limit on at the 95% C.L. is found to be 3.0 (3.1). This limit is driven by the data statistical uncertainty, while the impact of the systematic uncertainties is found to be 2.2%. When combined with the ATLAS Run 1 data, the observed (expected) upper limit is 2.8 (2.9) at the 95% C.L.. The corresponding measured signal strength is . The theoretical and experimental uncertainties in the expected signal and the background modeling uncertainty are correlated in the combination.
To conclude, a search for the dimuon decay of the Higgs boson is performed using of data collected with the ATLAS detector in collisions at 13 TeV at the LHC. No significant excess is observed in data, and an upper limit is set on the signal strength.
We thank CERN for the very successful operation of the LHC, as well as the support staff from our institutions without whom ATLAS could not be operated efficiently.
We acknowledge the support of ANPCyT, Argentina; YerPhI, Armenia; ARC, Australia; BMWFW and FWF, Austria; ANAS, Azerbaijan; SSTC, Belarus; CNPq and FAPESP, Brazil; NSERC, NRC and CFI, Canada; CERN; CONICYT, Chile; CAS, MOST and NSFC, China; COLCIENCIAS, Colombia; MSMT CR, MPO CR and VSC CR, Czech Republic; DNRF and DNSRC, Denmark; IN2P3-CNRS, CEA-DSM/IRFU, France; SRNSF, Georgia; BMBF, HGF, and MPG, Germany; GSRT, Greece; RGC, Hong Kong SAR, China; ISF, I-CORE and Benoziyo Center, Israel; INFN, Italy; MEXT and JSPS, Japan; CNRST, Morocco; NWO, Netherlands; RCN, Norway; MNiSW and NCN, Poland; FCT, Portugal; MNE/IFA, Romania; MES of Russia and NRC KI, Russian Federation; JINR; MESTD, Serbia; MSSR, Slovakia; ARRS and MIZŠ, Slovenia; DST/NRF, South Africa; MINECO, Spain; SRC and Wallenberg Foundation, Sweden; SERI, SNSF and Cantons of Bern and Geneva, Switzerland; MOST, Taiwan; TAEK, Turkey; STFC, United Kingdom; DOE and NSF, United States of America. In addition, individual groups and members have received support from BCKDF, the Canada Council, CANARIE, CRC, Compute Canada, FQRNT, and the Ontario Innovation Trust, Canada; EPLANET, ERC, ERDF, FP7, Horizon 2020 and Marie Skłodowska-Curie Actions, European Union; Investissements d’Avenir Labex and Idex, ANR, Région Auvergne and Fondation Partager le Savoir, France; DFG and AvH Foundation, Germany; Herakleitos, Thales and Aristeia programmes co-financed by EU-ESF and the Greek NSRF; BSF, GIF and Minerva, Israel; BRF, Norway; CERCA Programme Generalitat de Catalunya, Generalitat Valenciana, Spain; the Royal Society and Leverhulme Trust, United Kingdom.
The crucial computing support from all WLCG partners is acknowledged gratefully, in particular from CERN, the ATLAS Tier-1 facilities at TRIUMF (Canada), NDGF (Denmark, Norway, Sweden), CC-IN2P3 (France), KIT/GridKA (Germany), INFN-CNAF (Italy), NL-T1 (Netherlands), PIC (Spain), ASGC (Taiwan), RAL (UK) and BNL (USA), the Tier-2 facilities worldwide and large non-WLCG resource providers. Major contributors of computing resources are listed in Ref. [55].
The reference list from the paper itself. Each links out to its DOI / PubMed record.
- 1[1] ATLAS Collaboration, Observation of a new particle in the search for the Standard Model Higgs boson with the ATLAS detector at the LHC , Phys. Lett. B 716 (2012) 1 , ar Xiv:1207.7214 [hep-ex] . · doi ↗
- 2[2] CMS Collaboration, Observation of a new boson at a mass of 125 Ge V with the CMS experiment at the LHC , Phys. Lett. B 716 (2012) 30 , ar Xiv:1207.7235 [hep-ex] . · doi ↗
- 3[3] CMS Collaboration, Observation of a new boson with mass near 125 Ge V in pp collisions at s 𝑠 \sqrt{s} = 7 and 8 Te V , JHEP 06 (2013) 081 , ar Xiv:1303.4571 [hep-ex] . · doi ↗
- 4[4] ATLAS Collaboration, Measurements of the Higgs boson production and decay rates and coupling strengths using p p 𝑝 𝑝 pp collision data at s = 7 𝑠 7 \sqrt{s}=7 and 8 8 8 Te V in the ATLAS experiment , Eur. Phys. J. C 76 (2016) 6 , ar Xiv:1507.04548 [hep-ex] . · doi ↗
- 5[5] CMS Collaboration, Precise determination of the mass of the Higgs boson and tests of compatibility of its couplings with the standard model predictions using proton collisions at 7 and 8 Te V , Eur. Phys. J. C 75 (2015) 212 , ar Xiv:1412.8662 [hep-ex] . · doi ↗
- 6[6] CMS Collaboration, Study of the Mass and Spin-Parity of the Higgs Boson Candidate via Its Decays to Z Boson Pairs , Phys. Rev. Lett. 110 (2013) 081803 , ar Xiv:1212.6639 [hep-ex] . · doi ↗
- 7[7] ATLAS Collaboration, Evidence for the spin-0 nature of the Higgs boson using ATLAS data , Phys. Lett. B 726 (2013) 120 , ar Xiv:1307.1432 [hep-ex] . · doi ↗
- 8[8] CMS Collaboration, Constraints on the spin-parity and anomalous HVV couplings of the Higgs boson in proton collisions at 7 and 8 Te V , Phys. Rev. D 92 (2015) 012004 , ar Xiv:1411.3441 [hep-ex] . · doi ↗