Mining Functional Modules by Multiview-NMF of Phenome-Genome Association
YaoGong Zhang, YingJie Xu, Xin Fan, YuXiang Hong, Jiahui Liu, ZhiCheng, He, YaLou Huang, MaoQiang Xie

TL;DR
This paper introduces a hierarchical NMF-based method called CMNMF that leverages phenotype ontology structure to more effectively identify biologically meaningful gene modules from gene-phenotype association data.
Contribution
The novel CMNMF method utilizes hierarchical phenotype ontology information to improve gene module detection compared to traditional expression data-based approaches.
Findings
CMNMF outperforms baseline clustering methods in gene module identification.
Gene modules identified by CMNMF show higher biological significance.
The method effectively predicts gene pathway members and protein interactions.
Abstract
Background: Mining gene modules from genomic data is an important step to detect gene members of pathways or other relations such as protein-protein interactions. In this work, we explore the plausibility of detecting gene modules by factorizing gene-phenotype associations from a phenotype ontology rather than the conventionally used gene expression data. In particular, the hierarchical structure of ontology has not been sufficiently utilized in clustering genes while functionally related genes are consistently associated with phenotypes on the same path in the phenotype ontology. Results: We propose a hierarchal Nonnegative Matrix Factorization (NMF)-based method, called Consistent Multiple Nonnegative Matrix Factorization (CMNMF), to factorize genome-phenome association matrix at two levels of the hierarchical structure in phenotype ontology for mining gene functional modules. CMNMF…
Click any figure to enlarge with its caption.
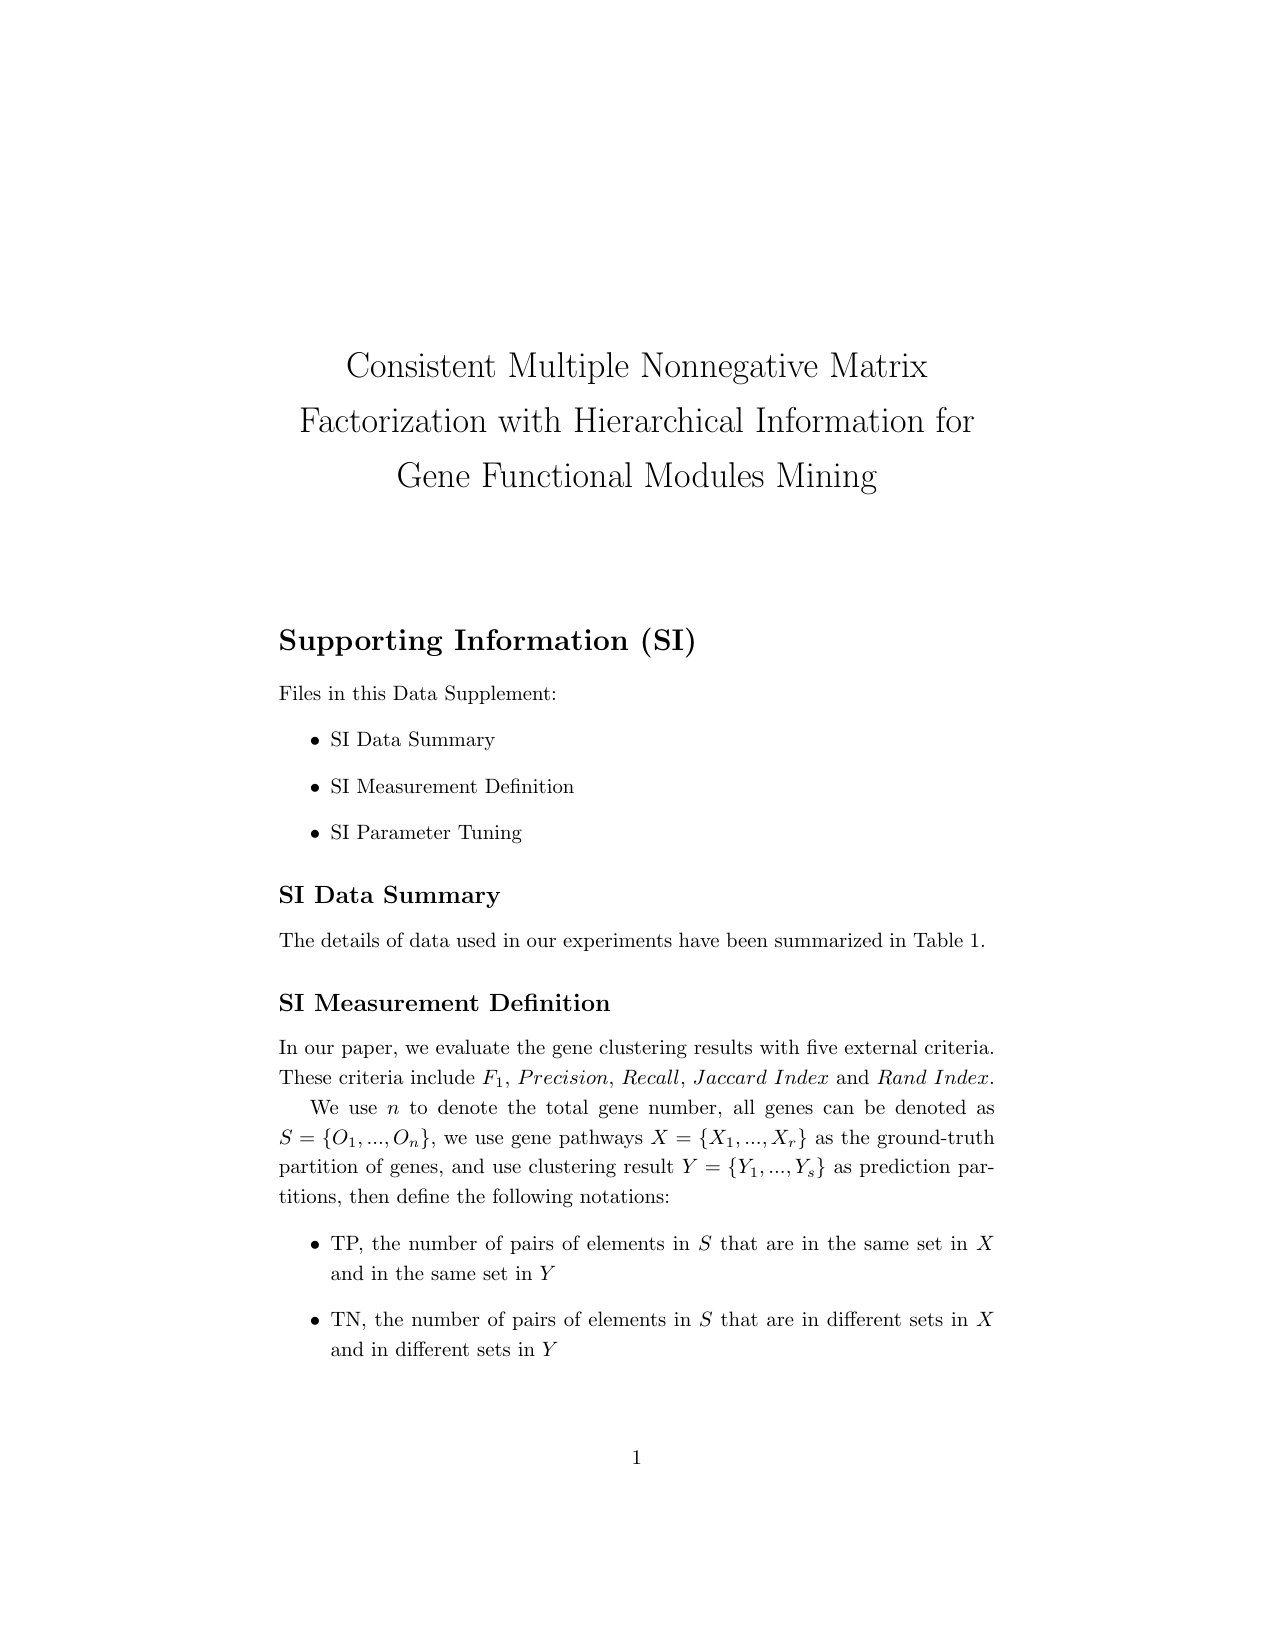 Figure 1
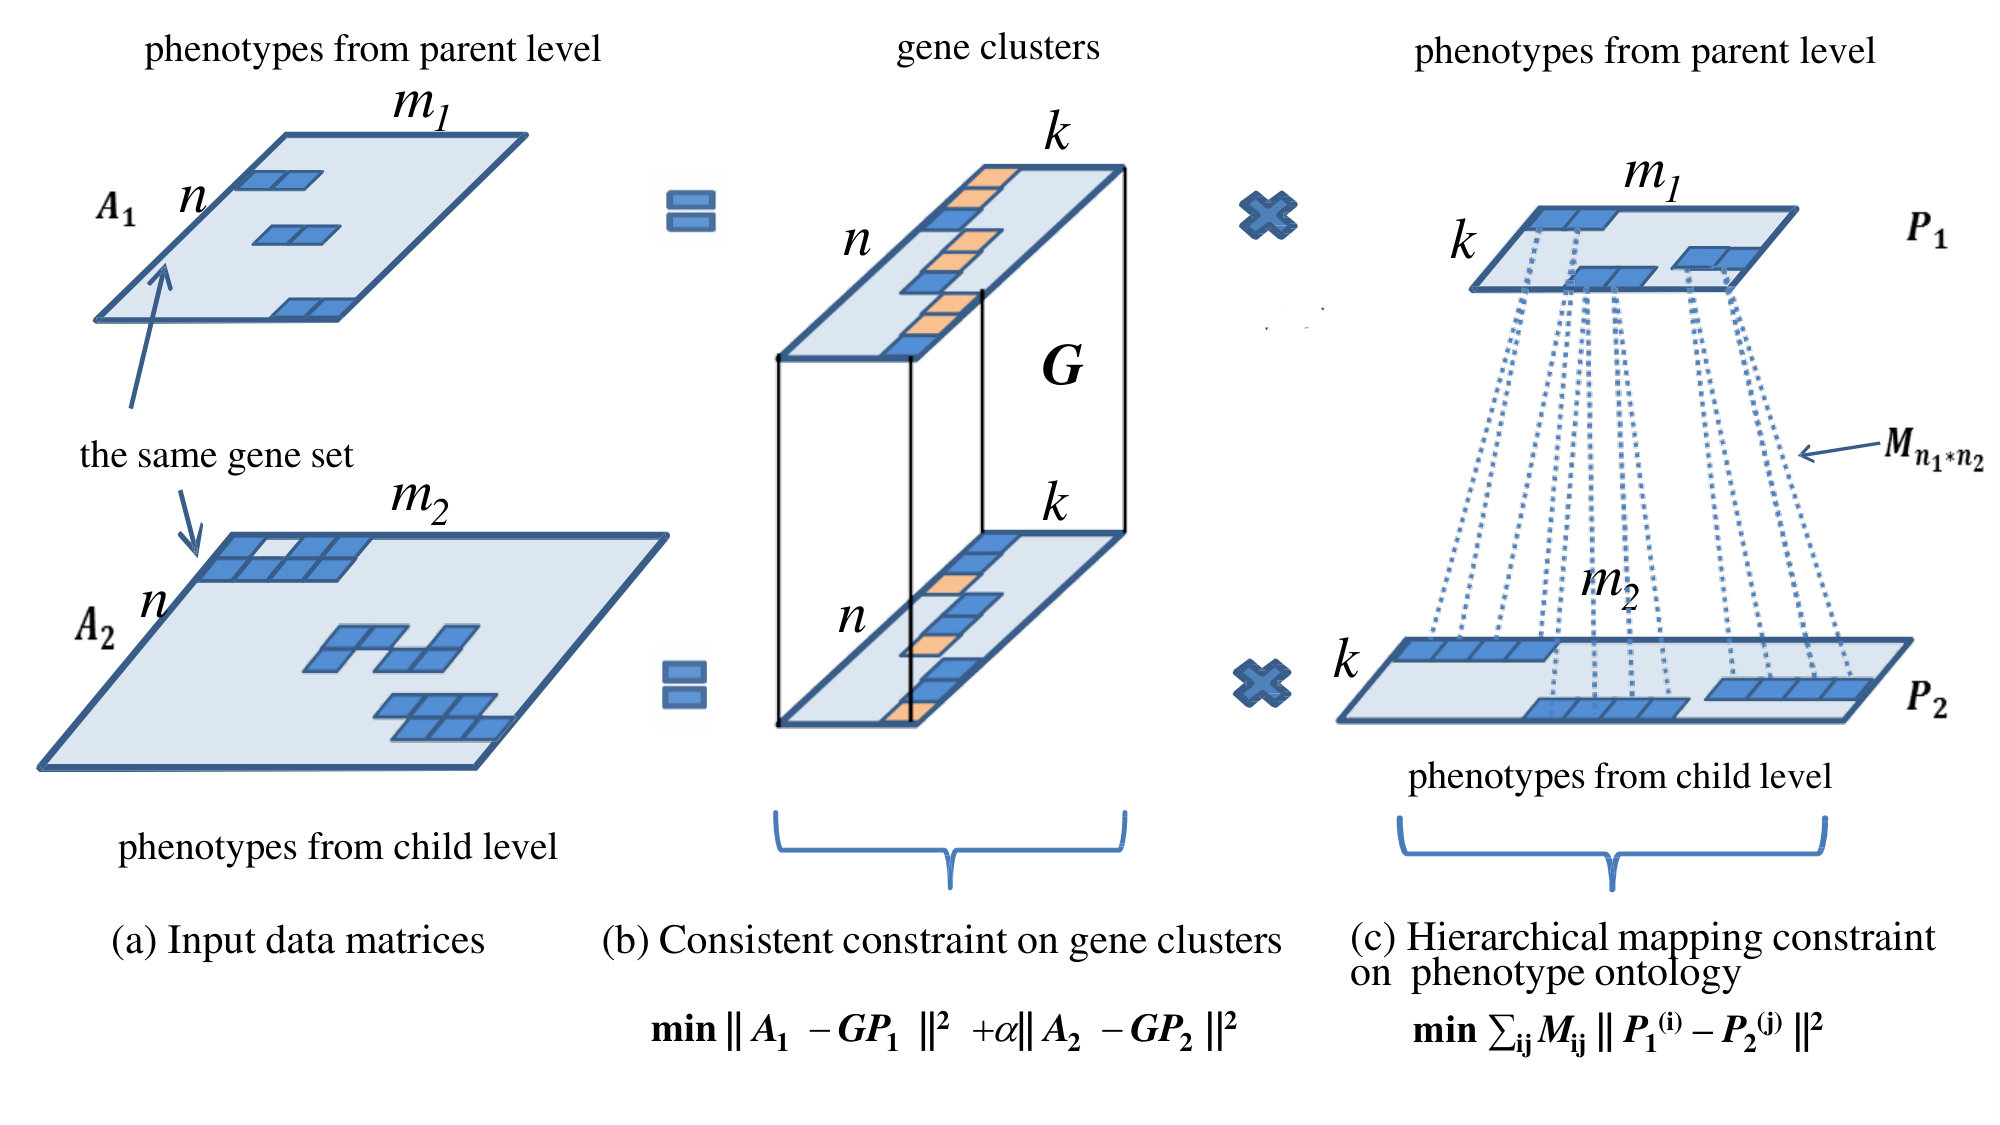 Figure 2
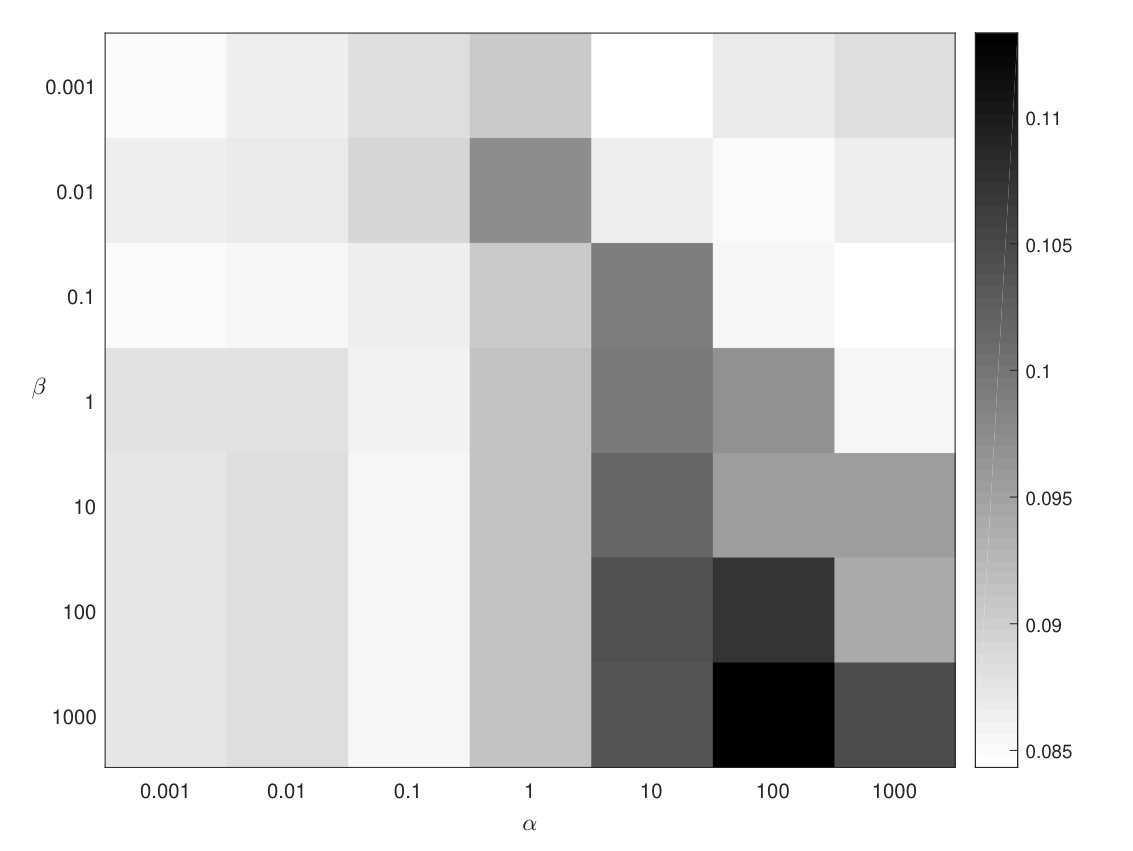 Figure 3
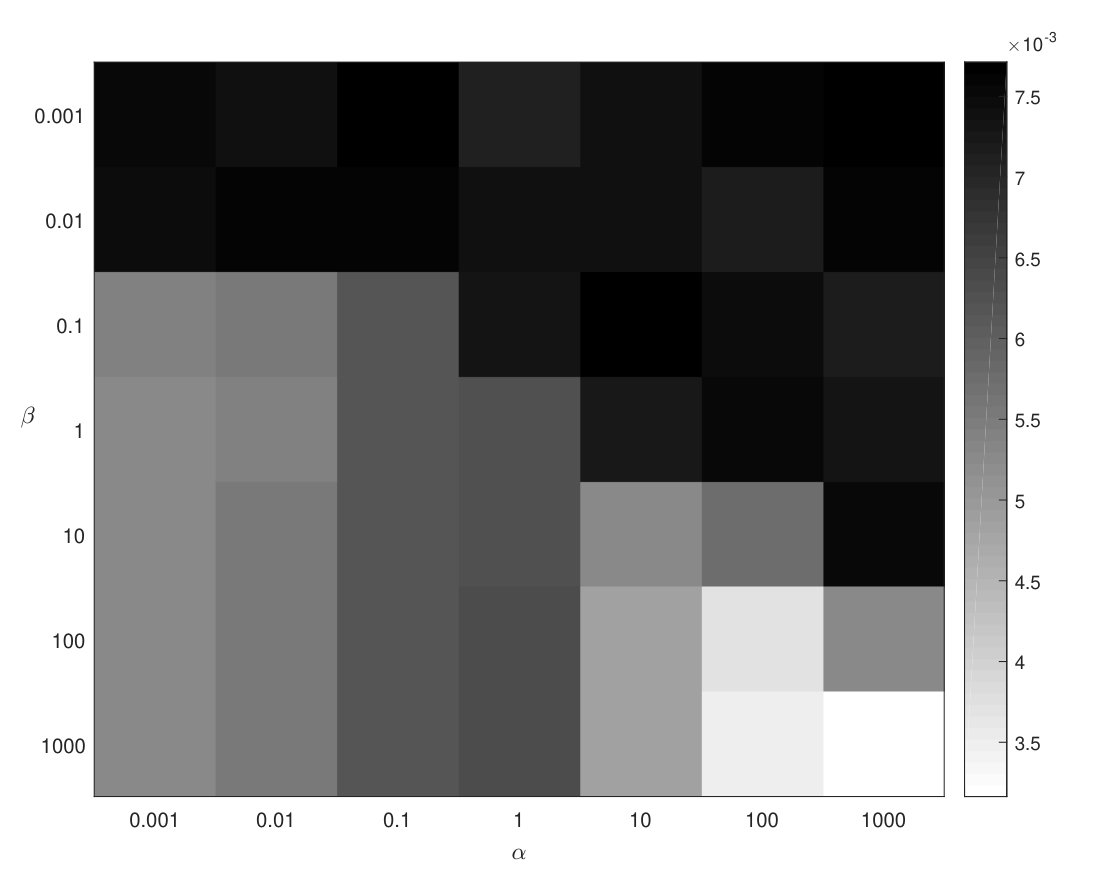 Figure 4
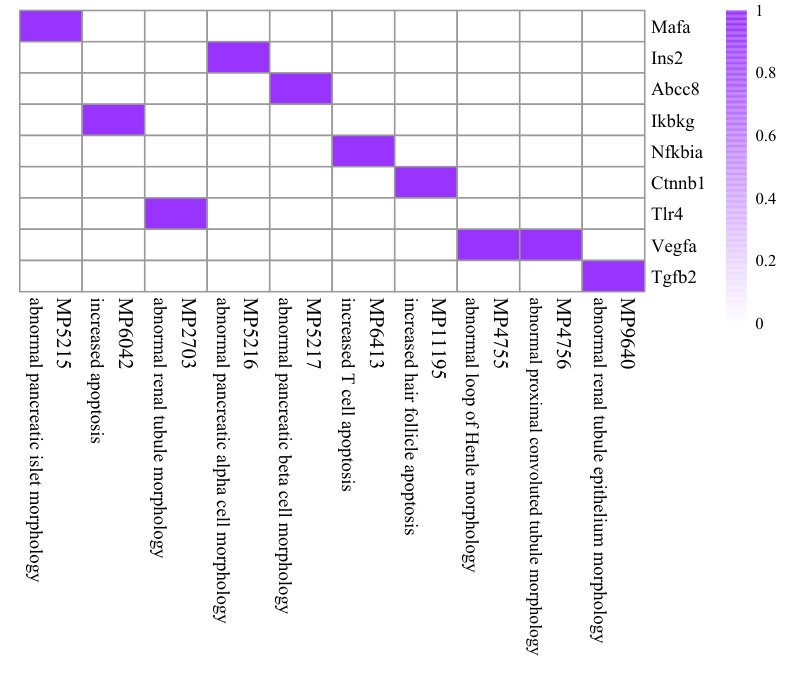 Figure 5
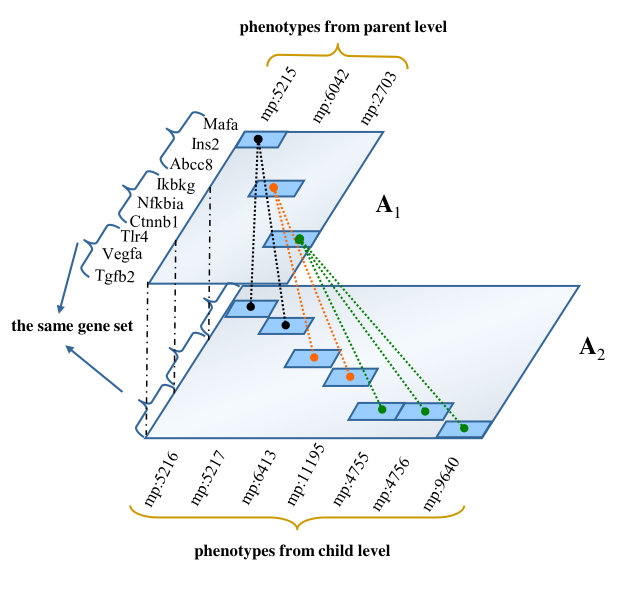 Figure 6
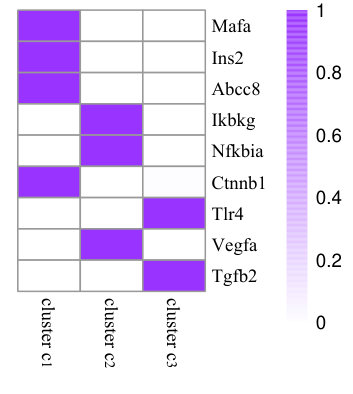 Figure 7
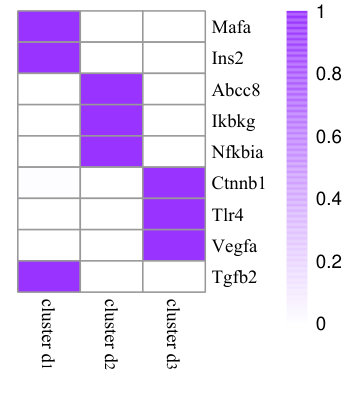 Figure 8
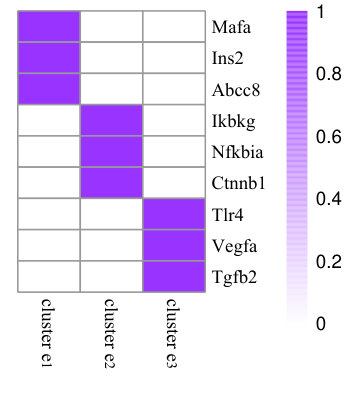 Figure 9
| Notations | Explanations |
|---|---|
| Genome-phenome association matrix | |
| Genome-phenome association matrix with phenotype | |
| ontology at parent level | |
| Genome-phenome association matrix with phenotype | |
| ontology at child level | |
| Gene cluster membership matrix | |
| Phenotype cluster membership matrix | |
| Annotated gene cluster membership matrix | |
| Phenotype cluster membership matrix at parent level | |
| Phenotype cluster membership matrix at child level | |
| Phenotype ontologies relationship matrix | |
| Number of genes | |
| Number of phenotypes | |
| Number of latent clusters | |
| Number of phenotypes at parent level | |
| Number of phenotypes at child level |
| measure | Precision | Recall | Jaccard Index | Rand Index | |
|---|---|---|---|---|---|
| AHC | 0.0871 | 0.0624 | 0.1443 | 0.0455 | 0.7654 |
| Constrained AHC | 0.0925 | 0.0554 | 0.2803 | 0.0485 | 0.5738 |
| K-means | 0.0517 | 0.0760 | 0.0392 | 0.0265 | 0.8886 |
| Constrained K-means | 0.0554 | 0.0750 | 0.0439 | 0.0285 | 0.8839 |
| NMF | 0.1037 | 0.1084 | 0.0993 | 0.0547 | 0.8668 |
| HMF | 0.0818 | 0.1080 | 0.0658 | 0.0426 | 0.8855 |
| ColNMF | 0.0883 | 0.1074 | 0.0750 | 0.0462 | 0.8799 |
| CMNMF | 0.1181 | 0.0898 | 0.1726 | 0.0628 | 0.8002 |
| measure | Precision | Recall | Jaccard Index | Rand Index | |
|---|---|---|---|---|---|
| AHC | 0.0037 | 0.0019 | 0.1420 | 0.0019 | 0.8321 |
| Constrained AHC | 0.0080 | 0.0040 | 0.6491 | 0.0040 | 0.6421 |
| K-means | 0.0041 | 0.0022 | 0.0426 | 0.0021 | 0.9544 |
| Constrained K-means | 0.0107 | 0.0056 | 0.1197 | 0.0054 | 0.9509 |
| NMF | 0.0126 | 0.0065 | 0.1988 | 0.0063 | 0.9305 |
| HMF | 0.0137 | 0.0072 | 0.1298 | 0.0069 | 0.9584 |
| ColNMF | 0.0120 | 0.0062 | 0.1420 | 0.0060 | 0.9478 |
| CMNMF | 0.0138 | 0.0072 | 0.1521 | 0.0070 | 0.9518 |
| measure | Precision | Recall | Jaccard Index | Rand Index | |
|---|---|---|---|---|---|
| AHC | 0.0808 | 0.0998 | 0.0679 | 0.0421 | 0.9044 |
| Constrained AHC | 0.0952 | 0.0570 | 0.2892 | 0.0500 | 0.6599 |
| K-means | 0.0787 | 0.0829 | 0.0748 | 0.0409 | 0.8915 |
| Constrained K-means | 0.0889 | 0.0813 | 0.0980 | 0.0465 | 0.8756 |
| NMF | 0.0966 | 0.0891 | 0.1056 | 0.0508 | 0.8778 |
| HMF | 0.0863 | 0.1034 | 0.0741 | 0.0451 | 0.9029 |
| ColNMF | 0.0850 | 0.0869 | 0.0831 | 0.0444 | 0.8893 |
| CMNMF | 0.1046 | 0.0727 | 0.1886 | 0.0552 | 0.8023 |
| measure | Precision | Recall | Jaccard Index | Rand Index | |
|---|---|---|---|---|---|
| AHC | 0.0096 | 0.0055 | 0.0410 | 0.0048 | 0.9709 |
| Constrained AHC | 0.0089 | 0.0045 | 0.4403 | 0.0045 | 0.6637 |
| K-means | 0.0095 | 0.0051 | 0.0743 | 0.0048 | 0.9464 |
| Constrained K-means | 0.0117 | 0.0068 | 0.0422 | 0.0059 | 0.9754 |
| NMF | 0.0141 | 0.0074 | 0.1457 | 0.0071 | 0.9300 |
| HMF | 0.0142 | 0.0077 | 0.0927 | 0.0072 | 0.9557 |
| ColNMF | 0.0156 | 0.0083 | 0.1303 | 0.0079 | 0.9432 |
| CMNMF | 0.0166 | 0.0089 | 0.1203 | 0.0084 | 0.9510 |
| measure | Precision | Recall | Jaccard Index | Rand Index | |
|---|---|---|---|---|---|
| AHC | 0.0015 | 0.0008 | 0.1373 | 0.0008 | 0.8330 |
| Constrained AHC | 0.0034 | 0.0017 | 0.6569 | 0.0017 | 0.6417 |
| K-means | 0.0017 | 0.0009 | 0.0392 | 0.0009 | 0.9577 |
| Constrained K-means | 0.0045 | 0.0023 | 0.1176 | 0.0022 | 0.9519 |
| NMF | 0.0052 | 0.0026 | 0.1936 | 0.0026 | 0.9312 |
| HMF | 0.0053 | 0.0027 | 0.1176 | 0.0027 | 0.9593 |
| ColNMF | 0.0047 | 0.0024 | 0.1324 | 0.0024 | 0.9488 |
| CMNMF | 0.0055 | 0.0028 | 0.1495 | 0.0028 | 0.9507 |
| measure | Precision | Recall | Jaccard Index | Rand Index | |
|---|---|---|---|---|---|
| AHC | 0.0043 | 0.0023 | 0.0388 | 0.0021 | 0.9727 |
| Constrained AHC | 0.0039 | 0.0019 | 0.4313 | 0.0019 | 0.6639 |
| K-means | 0.0040 | 0.0021 | 0.0759 | 0.0020 | 0.9431 |
| Constrained K-means | 0.0041 | 0.0022 | 0.0309 | 0.0020 | 0.9771 |
| NMF | 0.0057 | 0.0029 | 0.1309 | 0.0029 | 0.9313 |
| HMF | 0.0056 | 0.0029 | 0.0791 | 0.0028 | 0.9572 |
| ColNMF | 0.0063 | 0.0032 | 0.1160 | 0.0032 | 0.9446 |
| CMNMF | 0.0065 | 0.0034 | 0.1033 | 0.0033 | 0.9524 |
| No | Gene Cluster | Most Related GO Terms | P-value | FDR |
| 239 | BCL2, EGFR, FOXO1, TGFA, IKBKB,PDGFB, PDGFRA, CREB3L3, etc. | positive regulation of cell proliferation; | 2.2E-06 | 3.0E-03 |
| wound healing; | 1.3E-05 | 1.8E-02 | ||
| protein heterodimerization activity; | 7.3E-05 | 7.4E-02 | ||
| 173 | CLAM1, NOS1, ITPR1, ATP2A2, CYCS,GRIN2A, CACNA1C, COX6A1, etc. | regulation of cardiac muscle contraction | 6.8E-07 | 9.3E-04 |
| by regulation of the release of sequestered calciumion; | ||||
| regulation of ryanodine-sensitive calcium-release | 6.8E-07 | 9.3E-04 | ||
| channel activity; | ||||
| regulation of cardiac muscle contraction; | 9.3E-07 | 1.3E-03 | ||
| 143 | BRAF, SMAD3, NRAS, RAF1, SOS1, TGFB2, PTPN11, TGFBR1, etc. | intracellular; | 2.3E-04 | 2.1E-01 |
| MAPK cascade; | 2.9E-04 | 4.0E-01 | ||
| regulation of Rho protein signal transduction; | 8.3E-04 | 1.1E-00 | ||
| 140 | CDK4, ERCC1, G6PC, GAD2,GHR, GPI1, PDX1,MAFA, etc. | mitochondrial respiratory chain complex I assembly; | 5.7E-33 | 7.6E-30 |
| mitochondrial inner membrane; | 5.6E-16 | 6.0E-13 | ||
| mitochondrion; | 1.8E-09 | 1.9E-06 | ||
| 127 | GRIN1, HTT, LAMC3, DCTN1, SOD1, TBP, SLC25A4,NDUFA1, etc. | extracellular matrix organization; | 1.5E-07 | 2.1E-04 |
| cell adhesion; | 1.0E-05 | 1.4E-02 | ||
| basement membrane; | 2.0E-05 | 1.9E-02 | ||
| 2 | CYTB,ND5,ND2, COX1,ND1,COX3, ND6,ATP6, etc. | mitochondrial electron transport, NADH to ubiquinone; | 2.1E-11 | 2.0E-08 |
| NADH dehydrogenase (ubiquinone) activity; | 2.2E-11 | 1.5E-08 | ||
| mitochondrial respiratory chain complex I; | 5.8E-09 | 4.3E-06 |
Peer Reviews
No public reviews on file for this paper yet. If you reviewed it on a platform where reviews are public (OpenReview, ICLR, NeurIPS, ICML), you can paste yours below so the community can read it here.
Code & Models
Videos
No videos yet. Explain this paper in a talk, walkthrough, or lecture? Add one.
Taxonomy
TopicsBioinformatics and Genomic Networks · Gene expression and cancer classification · Biomedical Text Mining and Ontologies
Mining Functional Modules by Multiview-NMF of Phenome-Genome Association
YGZ\fnmYaoGong Zhang
YJX\fnmYingJie Xu
XF\fnmXin Fan
YXH\fnmYuXiang Hong
JHL\fnmJiaHui Liu
ZCH\fnmZhiCheng He
YLH\fnmYaLou Huang
MQX\fnmMaoQiang Xie
\orgnameCollege of Software, Nankai University, \postcode300350 \cityTianJin, \cnyChina
\orgnameCollege of Computer and Control Engineering, Nankai University, \postcode300350 \cityTianJin, \cnyChina
Abstract
\parttitle
Background Mining gene modules from genomic data is an important step to detect new gene members of the pathways or other relations such as protein-protein interactions. In this work, we explore the feasibility of detecting gene modules by factorizing gene-phenotype associations with phenotype ontologies rather than the conventionally used gene expression data. In particular, the hierarchical structure of the ontologies has not been taken full advantage of in clustering genes and the consistency proposed is believed to be found in the gene clusters obtained with the method built on the hierarchical structure of ontologies.
Results: We propose a hierarchal Nonnegative Matrix Factorization (NMF)-based method, called Consistent Multiple Nonnegative Matrix Factorization (CMNMF), with which the genome-phenome association matrix has been factorized into two levels of hierarchical structure among phenotype ontologies so as to mine gene functional modules. Gene clusters from the association matrices at two consecutive levels are constrained by CMNMF and are consistent since the genes are annotated with both the child phenotypes and the parent phenotypes. CMNMF also restricts the identified phenotype clusters to be intensively connected within the phenotype ontology hierarchy. In the experiments on mining functionally related genes from mouse phenotype ontologies and human phenotype ontologies, CMNMF effectively improves clustering performance over the baseline methods. Gene ontology enrichment analysis is also conducted to reveal biologically significant gene modules.
Conclusions: Utilizing the information in the hierarchical structure of phenotype ontologies, biologically significant gene modules can be identified with CMNMF. CMNMF also serves as a better tool for detecting new gene members in the pathways and protein-protein interactions.
Availability: https://github.com/nkiip/CMNMF
Non-negative Matrix Factorization,
Gene module mining,
Phenotype ontology,
Hierarchical structure,
keywords:
\startlocaldefs\endlocaldefs
{fmbox}\dochead
Research
{abstractbox}
Background
Gene functional modules within the genomic data are often identified to find genes sharing the same functions, being involved in the same pathway or interacting with each other. To find these functionally related gene sets, clustering methods are commonly used. K-means and AHC (Agglomerative Hierarchical Clustering) are the most frequently used clustering algorithms to cluster gene expression data. Recently, NMF and its variants have also been successfully adopted for clustering gene expression [1] and gene-phenotype association data [2]. NMF has advantages over other methods because of its interpretability and good performance.
More recently, multi-view NMF methods have been proposed. Collective NMF (ColNMF), proposed by Singh, can get more consistent results by using the shared coefficient matrix but different basis matrices across different views [3]. Zhang and Zhou proposed a multiple NMF framework to integrate multiple types of genomic data to identify microRNA-gene regulatory modules jointly [4]. Additionally, NMF-based methods integrated with some structure information were also proposed and have achieved better results. Pehkonen adopted NMF to analyze association data between gene and Gene Ontology (GO), in which the association matrix has been enriched according to the “true path rule” [5] of gene ontology hierarchy [6]. Hwang and Kuang proposed a nonnegative matrix tri-factorization method to cluster phenotypes and genes simultaneously [2]. Focusing on predicting missing traits for plants, HPMF incorporates hierarchical phylogenetic information into matrix factorization [7].
In the context of gene clustering, one useful structural feature that has never been integrated with multi-view NMF is the hierarchical structure phenotype ontology which is potentially helpful for clustering genes. In this work, we assume that the clustering of genes with different representations in multiple views should be consistent, i.e. genes will be consistently clustered by the association with phenotypes at different levels (or granularity) of the hierarchy in a phenotype ontology, in which each level of the phenotype ontology provides a different view for clustering genes.
Based on this motivation, we propose a multi-view NMF-based method called CMNMF (consistent multiple non-negative matrix factorization) for mining functional gene modules, in which the hierarchical structure of phenotype is introduced as prior knowledge. In detail, a consistency constraint on gene clusters and a hierarchical mapping constraint among the phenotypes in two consecutive levels in the ontology are introduced in the loss function. In the experiment, we apply CMNMF on gene-phenotype association data of mouse and human. CMNMF is compared with the baseline methods by measuring the performance of predicting KEGG pathways and protein-protein interaction networks. Furthermore, GO enrichment analysis equipped with DAVID tool [8] is performed to evaluate the biological significance of the gene clusters.
Materials and Method
Data Preparation
Mouse gene-phenotype associations were downloaded from Mouse Genome Informatics (MGI)[9] in Feb. 2016, including 15,524 associations between 5,971 phenotypes and 1,350 genes. More specifically, 3,414 phenotype ontologies were at level 7 and their parents, 2,557 phenotype ontologies were at level 6. The phenotype ontology levels in our experiment were chosen by the “most frequent level of annotation” criterion [10]. Two versions of mouse protein-protein interaction (PPI) network were obtained from the BIOGRID (Feb. 2016 and Sep. 2016) [11] and two versions of 292 mouse KEGG pathways (Feb. 2016 and Sep. 2016) were extracted for evaluation [12].
53,929 human gene-phenotype associations between 3,280 genes and 5,948 phenotypes were downloaded in Feb. 2016 from Human Phenotype Ontology (HPO) project [13]. 3,707 phenotype ontologies at level 8 and their parents, 2,241 phenotype ontologies at level 7, were applied in the following experiments. Two versions of human PPI networks were obtained from the BIOGRID (Feb. 2016 and Sep. 2016) and two versions of 296 human KEGG pathways (Feb. 2016 and Sep. 2016) were extracted for evaluation. A table summary of the data used in this paper can be found in Supporting Information.
Problem Formulation
The notations used in the models are summarized in Table 1. Let be the number of genes, be the number of phenotypes, and the gene-phenotype associations are represented by a binary matrix with 1 for entries of known associations and 0 otherwise. The loss function of factorizing matrix is used to derive gene clusters and phenotype clusters based on gene-phenotype associations, where is the number of clusters. The loss function of factorizing matrix can be defined as:
[TABLE]
However, the loss function mentioned above does not consider the hierarchical structure of phenotype ontologies. To address this problem, we design a framework by considering phenotypes at different levels in the separate hierarchical structure separately (Fig. 1(a)). In this framework, we assume the gene clustering derived from both parent and child phenotype ontology levels should be identical (Fig. 1(b)). In addition, a phenotype mapping constraint is also considered to reinforce the consistency between learned phenotype clusters at parent level and those at child level (Fig. 1(c), mapping relations are represented by dot lines). By optimizing the components mentioned above, we propose a CMNMF algorithm to learn the gene clusters from gene-phenotype associations with different levels of phenotype ontologies.
Loss Functions for Penalizing Inconsistency
Motivated by the assumption mentioned above, the phenotype ontologies are divided into two sets according to the two adjacent levels. Two gene-phenotype association matrices and are set up based on the original gene-phenotype association matrix and the two sets of phenotype ontologies. We assume that the gene clusters , derived by matrix factorization on and , should be consistent, although the genes are annotated by phenotype ontologies at adjacent levels. can be derived by optimizing the following loss function:
[TABLE]
where is a hyper-parameter to balance the two matrix factorization problems. To reinforce the hierarchical mapping relationships between phenotypes at parent level and child level, the hierarchical mapping constraint on phenotype ontologies is added to the loss function,
[TABLE]
denotes the hierarchical mapping relation matrix between phenotype ontologies at adjacent levels. is set to 1 if there is a parent-child association between phenotype and phenotype , otherwise 0. We reinforce the hierarchical mapping constraint by maximizing the similarity between the phenotype ontologies with parent-child mapping relation in gene-phenotype network and . By combining the two components, the loss function can be formulated as follows:
[TABLE]
where is a hyper-parameter to balance the two components.
The CMNMF Algorithm
To minimize the loss function in Equation (4), an alternative iterative schema is adopted. It solves the problem with respect to one variable while fixing the other variables. In the original NMF [14], the loss function in Equation (4) is not convex on , , and jointly, but it is convex on one variable with the other two fixed. In the following subsections, the steps of deriving , and are presented separately. The complete CMNMF algorithm is outlined in Algorithm 1.
Computation of in CMNMF
Loss function in Equation (4) can be rewritten as:
[TABLE]
where and are diagonal matrices with and respectively. When variables and are fixed, the partial derivative of Equation (5) with respect to is:
[TABLE]
and the multiplicative update rule is:
[TABLE]
Computation of and in CMNMF
When is fixed, the partial derivatives of Equation (5) with respect to and are:
[TABLE]
and the multiplicative update rule is ( is fixed when we calculate , vice versa):
[TABLE]
For the loss function of original NMF , it is easy to check that if and are the solutions, then , will also form a solution for any positive diagonal matrix . To eliminate this uncertainty, in practice it will be further required that the Euclidean length of each column vector in matrix is 1 [15, 16]. The matrix will be adjusted accordingly so that does not change. This can be achieved by:
[TABLE]
This strategy has been adopted in CMNMF as well. After the multiplicative updating procedure converges, the Euclidean length of each column vector in matrix is set to 1 and the matrix and are adjusted with following rules:
[TABLE]
Parameter Tuning
We use old versions of PPI network (Feb. 2016) and KEGG pathways (Feb. 2016) as validation set to select the best parameters for each method. The selected parameters have been used in each method to get the performance results by using new versions of PPI network (Sep. 2016) and KEGG pathways (Sep. 2016) as test set.
We perform our experiments on two biological datasets, mouse species dataset and human species dataset. In parameter tuning process, the validation experiment results for each method have been repeated 10 times independently and the average results are applied for parameter tuning. As the parameter tuning processes for mouse data and human data are similar, we show the details on mouse KEGG pathways data as an illustration. Parameter tuning processes on mouse PPI network and human data (human KEGG pathways and human PPI network) are described in Supporting Information.
The hyper-parameters and have been tuned by grid with measure. balances the contributions of two factorization problems on different phenotype ontology levels. When is close to 0, CMNMF becomes NMF. controls the hierarchical structure effects of phenotype ontologies. When is set to 0, CMNMF becomes ColNMF (Collective NMF) [3]. The performance of CMNMF with different and combinations while taking old versions of mouse KEGG pathways (Feb. 2016) as validation set is shown in Fig. 2. We search in {0.001, 0.01, 0.1, 1, 10, 100, 1000} and in {0.001, 0.01, 0.1, 1, 10, 100, 1000}, the darker the color, the higher the score with the corresponding and combinations. In this experiment, and are chosen as the best parameters while mouse KEGG pathways data are used as validation set. The detailed parameter tuning for baseline methods is described in Supporting Information.
Evaluation
There are two types of evaluation indices: external indices and internal indices [17]. Because internal indices require extracting additional node features for measuring the similarity between nodes, we choose external indices in the experiments. These external indices, including measure, Jaccard Index, Rand Index, Precision and Recall, are applied to show the consistency between the learned gene clusters and the known KEGG pathways or the gene pairs in the PPI network. The higher the value, the more consistent the learned gene clusters and the known gene sets are.
Results
In this section, we first demonstrate the properties of CMNMF compared with NMF on a small MGI mouse gene-phenotype association matrix. Then CMNMF is compared with seven baseline methods by evaluating the consistency between identified gene modules and the new versions of KEGG pathways (Sep. 2016) or gene pairs in the PPI network (Sep. 2016). Moreover, Gene Ontology enrichment analysis is performed to evaluate the biological significance of discovered gene modules.
CMNMF on a Small Mouse Gene-Phenotype Associations
To illustrate the effects of consistency constraint (the first two terms in Equation (4)) and structure mapping constraint (the last term in Equation (4)), we demonstrate the performance of NMF, CMNMF(=0) and CMNMF(=1) on a small gene-phenotype association matrix from MGI in Fig. 3(a). The gene set in the experiment are selected from three mouse KEGG pathways. In detail, Mafa, Ins2, Abcc8 are from pathway MMU4930 (Type-II diabetes mellitus). Ikbkg, Nfkbia, Ctnnb1 are from MMU5215 (Prostate cancer). Tlr4, Vegfa, Tgfb2 are from MMU5205 (Proteoglycans in cancer). The hierarchical relationships between phenotype ontologies associated with selected genes are shown in Fig. 3(b). An effective algorithm should assign the genes from a KEGG pathway into the same cluster.
Fig. 3(c), 3(d), and 3(e) represent the clustering results with NMF, CMNMF(=0) and CMNMF(=1), respectively. Compared with Fig. 3(c), the significant improvement can be observed by considering the multiple levels of the hierarchy in the phenotype ontology in Fig. 3(d) and 3(e). By reinforcing the relationship among the phenotypes in different levels, CMNMF(=1) assigns gene Ctnnb1 to the right cluster comparing with CMNMF(=0). Note that the clustering result shown in Fig. 3(e) agrees with gene members in the KEGG pathways.
Comparison with Baseline Methods by Mining Gene Modules
In this section, we evaluate the gene clusters identified by CMNMF with KEGG pathways and PPI network. Seven clustering methods, agglomerative hierarchical clustering (AHC) [18], agglomerative hierarchical clustering with pairwise constraints [19] (Constrained AHC), K-means, pairwise constrained K-means [20] (Constrained K-means), NMF [21], HMF (Hierarchical Matrix Factorization) [22] and ColNMF (Collective NMF) [3], are compared in the experiment. Please notice AHC and K-means are unsupervised clustering methods with no parameters, in order to have a relatively fair comparison with other methods, we introduce additional pairwise constraints AHC [19] and pairwise constraints K-means [23], the old versions of KEGG pathways (Feb. 2016) and PPI network (Feb. 2016) are used as pairwise constraint validation set to help get clustering results. For CMNMF, HMF and ColNMF, the gene-phenotype association matrix is divided into two matrices and according to the levels of phenotype ontologies. For AHC, Constrained AHC, K-means, Constrained K-means, and NMF, the entire gene-phenotype association matrix is applied. Moreover, the associations to parent phenotype terms in the ontology have also been included, i.e. using the “true path rule” to enrich the association matrix. For NMF, HMF, ColNMF and CMNMF, the gene clustering results are row-normalized by z-score and is set as 0 if it is less than 3. Six validation indices are reported in Table 2-5.
Validation by Known KEGG Pathways and Protein-Protein Interactions
New versions of KEGG pathways (Sep. 2016) and PPI network (Sep. 2016) are applied as known gene relationships to test the performance of gene clustering results. Table 2 and Table 3 show the evaluation results on mouse data with KEGG pathways and PPI network, respectively. The evaluation results on human data are reported in Table 4 and Table 5. The best results across all the methods are bold. Comparing with the baseline methods, it is clear that CMNMF outperforms other methods on measure, Jaccard Index in all cases for both mouse and human data. It demonstrates the advantage of combining the consistency constraint with two levels of gene-phenotype association information and the structure constraint with parent-child phenotype ontology mapping information. In particular, comparing with the conventional NMF, the performance of CMNMF is improved with the additional knowledge from the consistency constraint. Moreover, the phenotype structure constraint in CMNMF reinforces the learning results following the mapping relation in the phenotype ontology, so CMNMF gets better performance comparing with ColNMF (CMNMF with ). However, AHC works better than other methods with index “Recall”. We analyse the clustering results of AHC and find a few large-scale gene clusters (with more than four hundred genes), these large gene clusters would result in an increase in index “Recall” and a decrease in “Precision”. The centroid criterion is applied in AHC which tends to find the pair of clusters that leads to minimum increase in total inter-cluster Euclidean distances when merging the clusters. Therefore the compact clustering results identified by AHC will benefit the “Recall” score. We also notice CMNMF does not achieve the best performance on “Rand Index”. As we know, “Rand Index” takes true negative gene pairs into consideration, however, in most cases the experiment results are evaluated on what we have known, i.e. the true positive gene pairs. True negative gene pairs are dominant in the original data involved in the experiments (accounting for 95%-99% of all gene pairs), this would lead to a bias comparison between different methods. Overall, the CMNMF outperforms all current clustering methods and the improvement is obvious.
Validation by Latest Protein-Protein Interactions
CMNMF is also tested on the latest protein-protein interactions added between Feb. 2016 and Sep. 2016 from BIOGRID. The parameters and are tuned by the old version PPI network (Feb. 2016) mentioned in the previous section with measure. The results are reported in Table 6 and Table 7 for mouse and human data, with the best and respectively. Comparing with baseline methods, CMNMF also outperforms them on measure, Jaccard Index and Precision.
Biological Analysis on Gene Clusters
We further study the functional roles of the identified human gene clusters with enrichment analysis against Gene Ontology (GO) using DAVID [8]. The enriched GO terms by selected gene clusters are reported in Table Biological Analysis on Gene Clusters, the P-value and FDR adjusted P-value are also presented. It is clear that gene clusters found by CMNMF are biological functionally relevant.
The reference list from the paper itself. Each links out to its DOI / PubMed record.
- 1[1] Wang, J., Wang, X., Gao, X.: Non-negative matrix factorization by maximizing correntropy for cancer clustering. BMC Bioinformatics 14 (1), 107 (2013)
- 2[2] Hwang, T., Atluri, G., Xie, M., Dey, S., Hong, C., Kumar, V., Kuang, R.: Co-clustering phenome-genome for phenotype classification and disease gene discovery. Nucleic Acids Research 40 (19), 1–16 (2012)
- 3[3] Singh, A.P., Gordon, G.J.: Relational learning via collective matrix factorization. In: KDD 08, p. 650. ACM Press, New York, New York, USA (2008)
- 4[4] Zhang, S., Li, Q., Liu, J., Zhou, X.J.: A novel computational framework for simultaneous integration of multiple types of genomic data to identify microrna-gene regulatory modules. Bioinformatics 27 (13), 401–409 (2011)
- 5[5] Valentini, G.: True path rule hierarchical ensembles for genome-wide gene function prediction. IEEE/ACM transactions on computational biology and bioinformatics / IEEE, ACM 8 (3), 832–47
- 6[6] Pehkonen, P., Wong, G., Törönen, P.: Theme discovery from gene lists for identification and viewing of multiple functional groups. BMC bioinformatics 6 , 162 (2005)
- 7[7] Shan, H., Kattge, J., Reich, P., Banerjee, A., Schrodt, F., Reichstein, M.: Gap Filling in the Plant Kingdom—Trait Prediction Using Hierarchical Probabilistic Matrix Factorization. ICML, 1303–1310 (2012). 1206.6439
- 8[8] Dennis, G., Sherman, B.T., Hosack, D.A., Yang, J., Gao, W., Lane, H.C., Lempicki, R.A.: DAVID: Database for Annotation, Visualization, and Integrated Discovery. Genome biology 4 (5), 3 (2003)