IFU spectroscopy of Southern Planetary Nebulae IV: A Physical Model for IC 418
M.A. Dopita, A. Ali, R.S. Sutherland, D.C. Nicholls, M. A. Amer

TL;DR
This study presents detailed spectroscopic analysis and physical modeling of the planetary nebula IC 418, revealing its ionization structure, stellar parameters, and dynamic evolution over the past few thousand years.
Contribution
It provides a comprehensive physical model of IC 418 using high-resolution spectroscopy, including stellar parameters, nebular structure, and shock interactions, which advances understanding of planetary nebula evolution.
Findings
High ionization parameter with radiation pressure dominance.
Detection of shocks in the nebular shell.
Recent ionization and structural evolution within 200-2000 years.
Abstract
We describe high spectral resolution, high dynamic range integral field spectroscopy of IC418 covering the spectral range 3300-8950{\AA} and compare with earlier data. We determine line fluxes, derive chemical abundances, provide a spectrum of the central star, and determine the shape of the nebular continuum. Using photoionisation models, we derive the reddening function from the nebular continuum and recombination lines. The nebula has a very high inner ionisation parameter. Consequently, radiation pressure dominates the gas pressure and dust absorbs a large fraction of ionising photons. Radiation pressure induces increasing density with radius. From a photoionisation analysis we derive central star parameters; K, , and using stellar evolutionary models we estimate an initial mass of .…
Click any figure to enlarge with its caption.
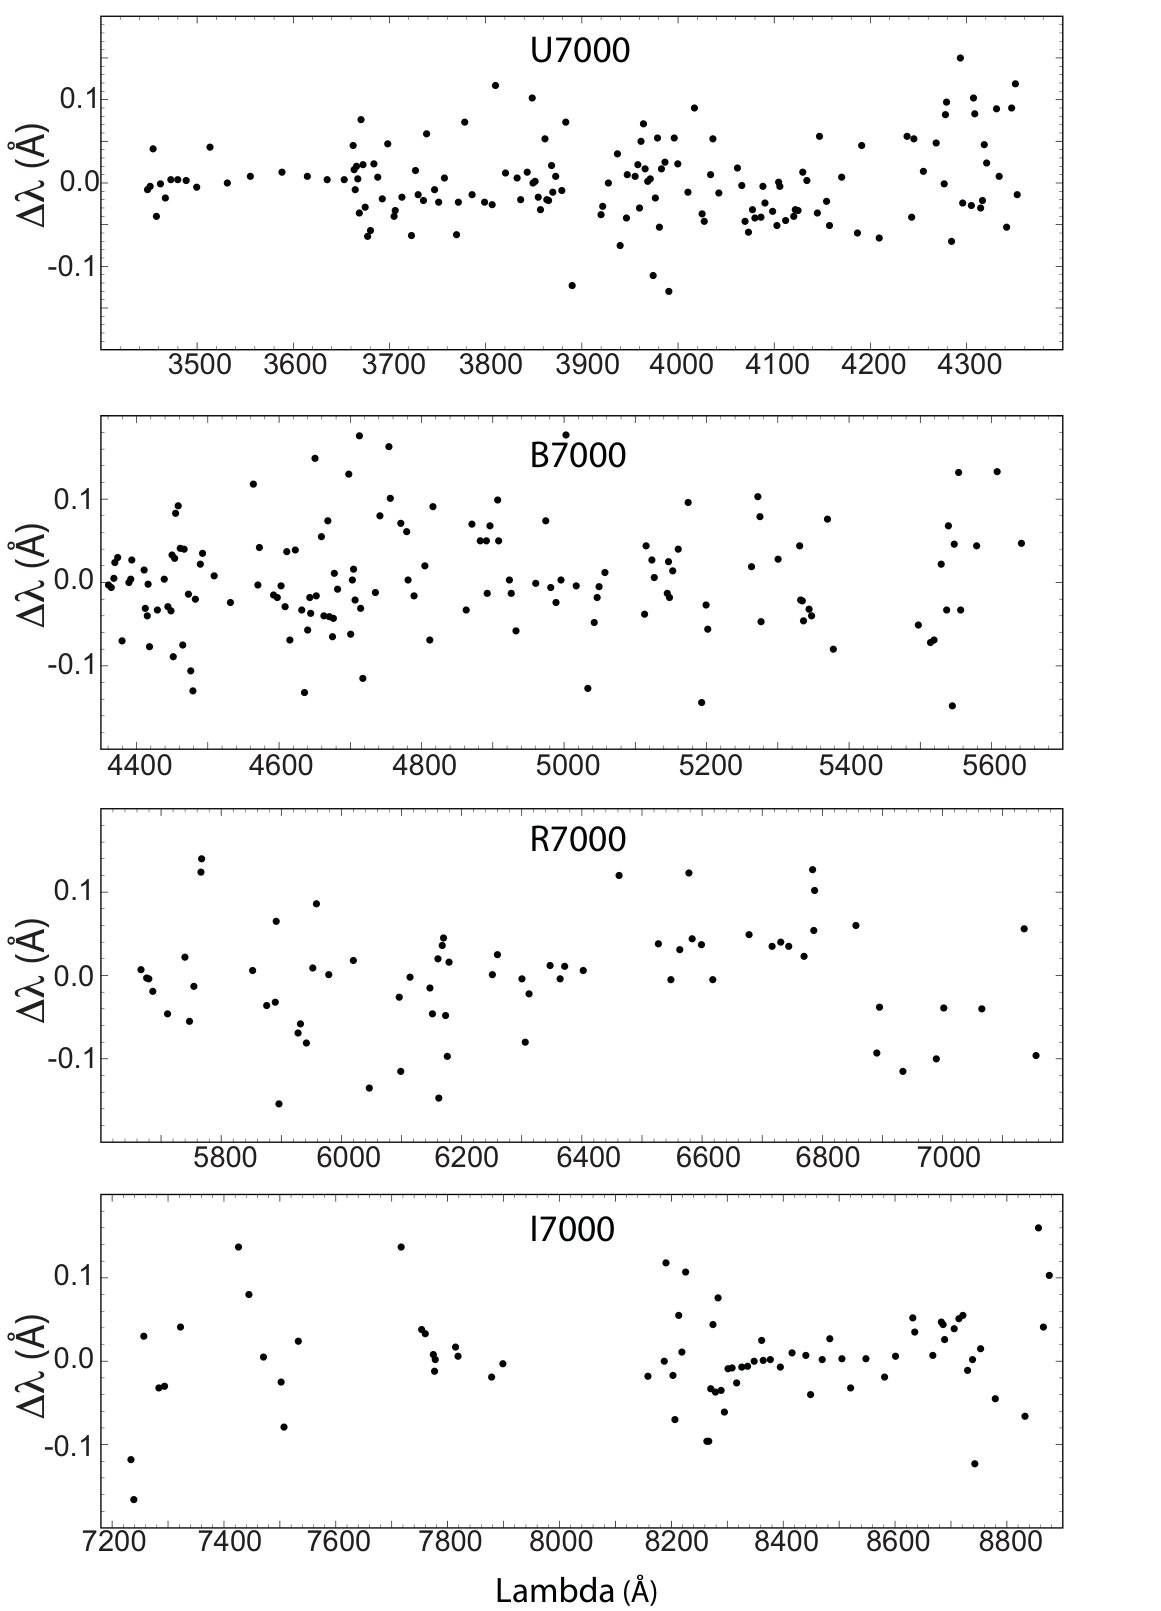 Figure 1
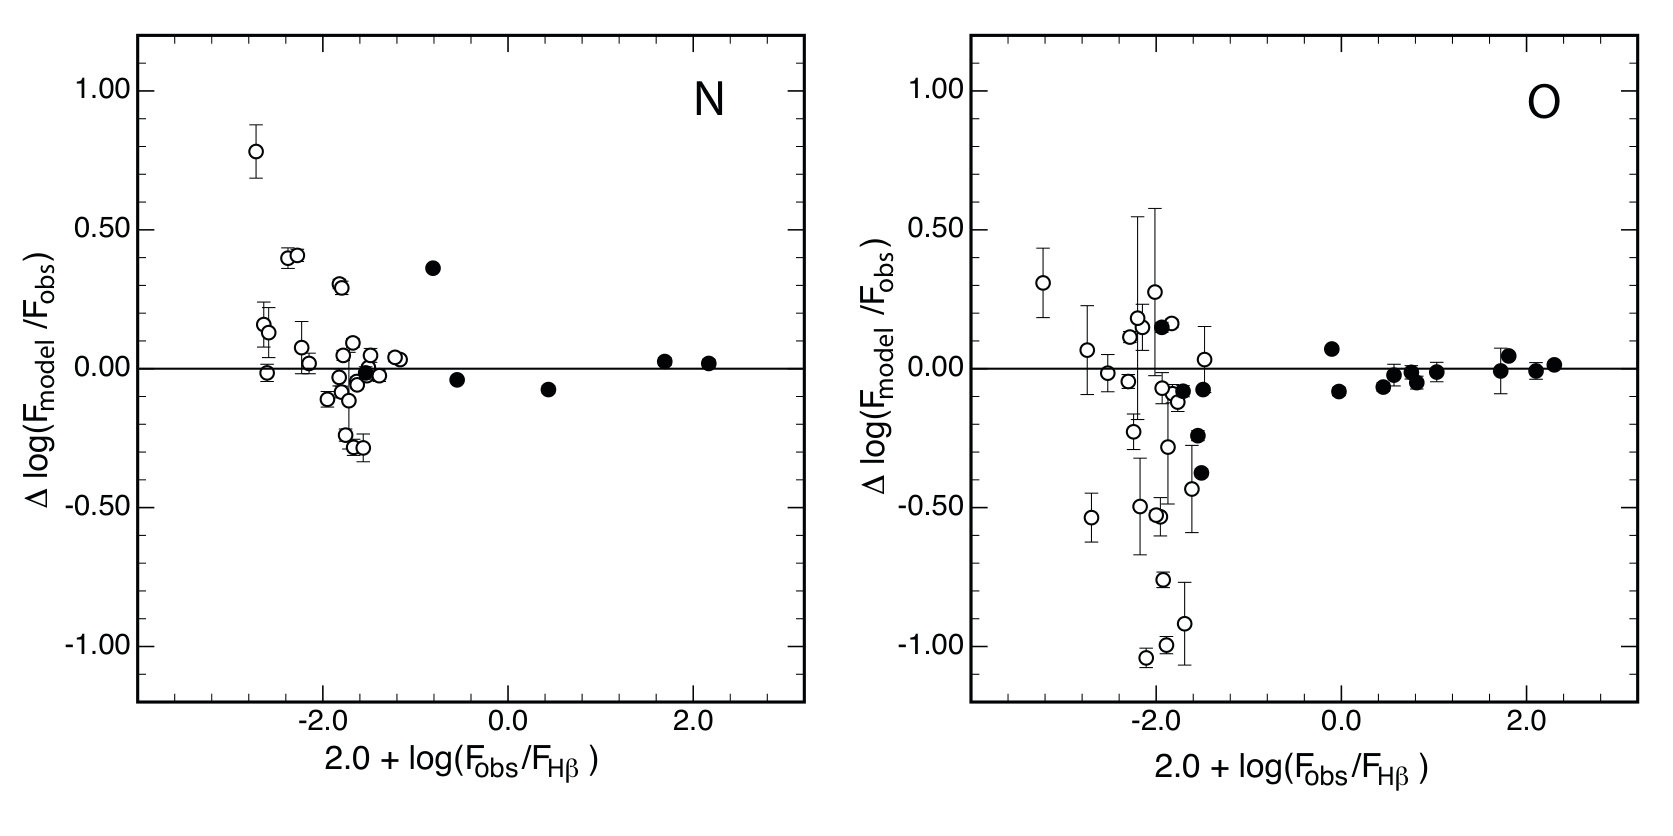 Figure 10
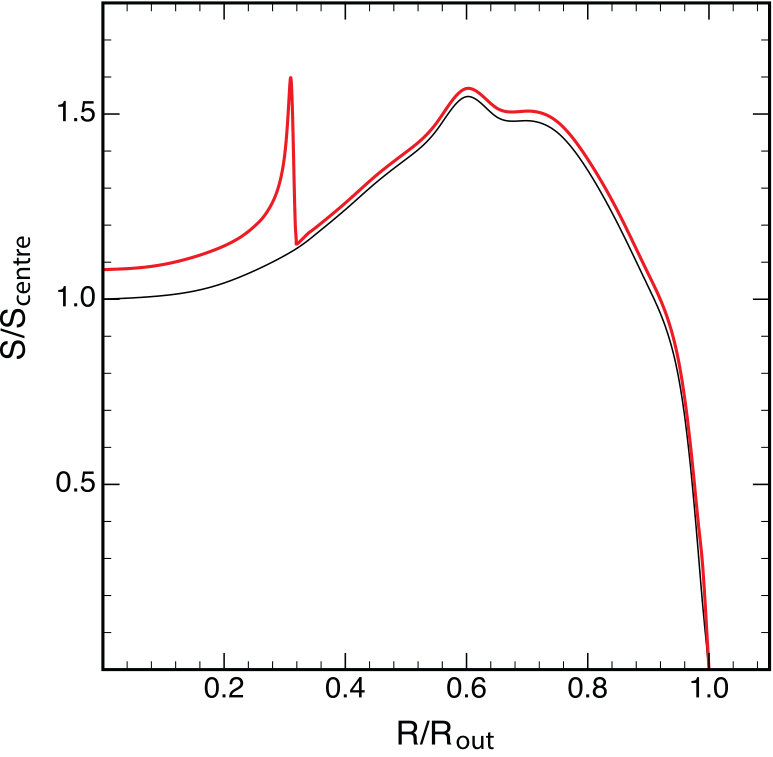 Figure 11
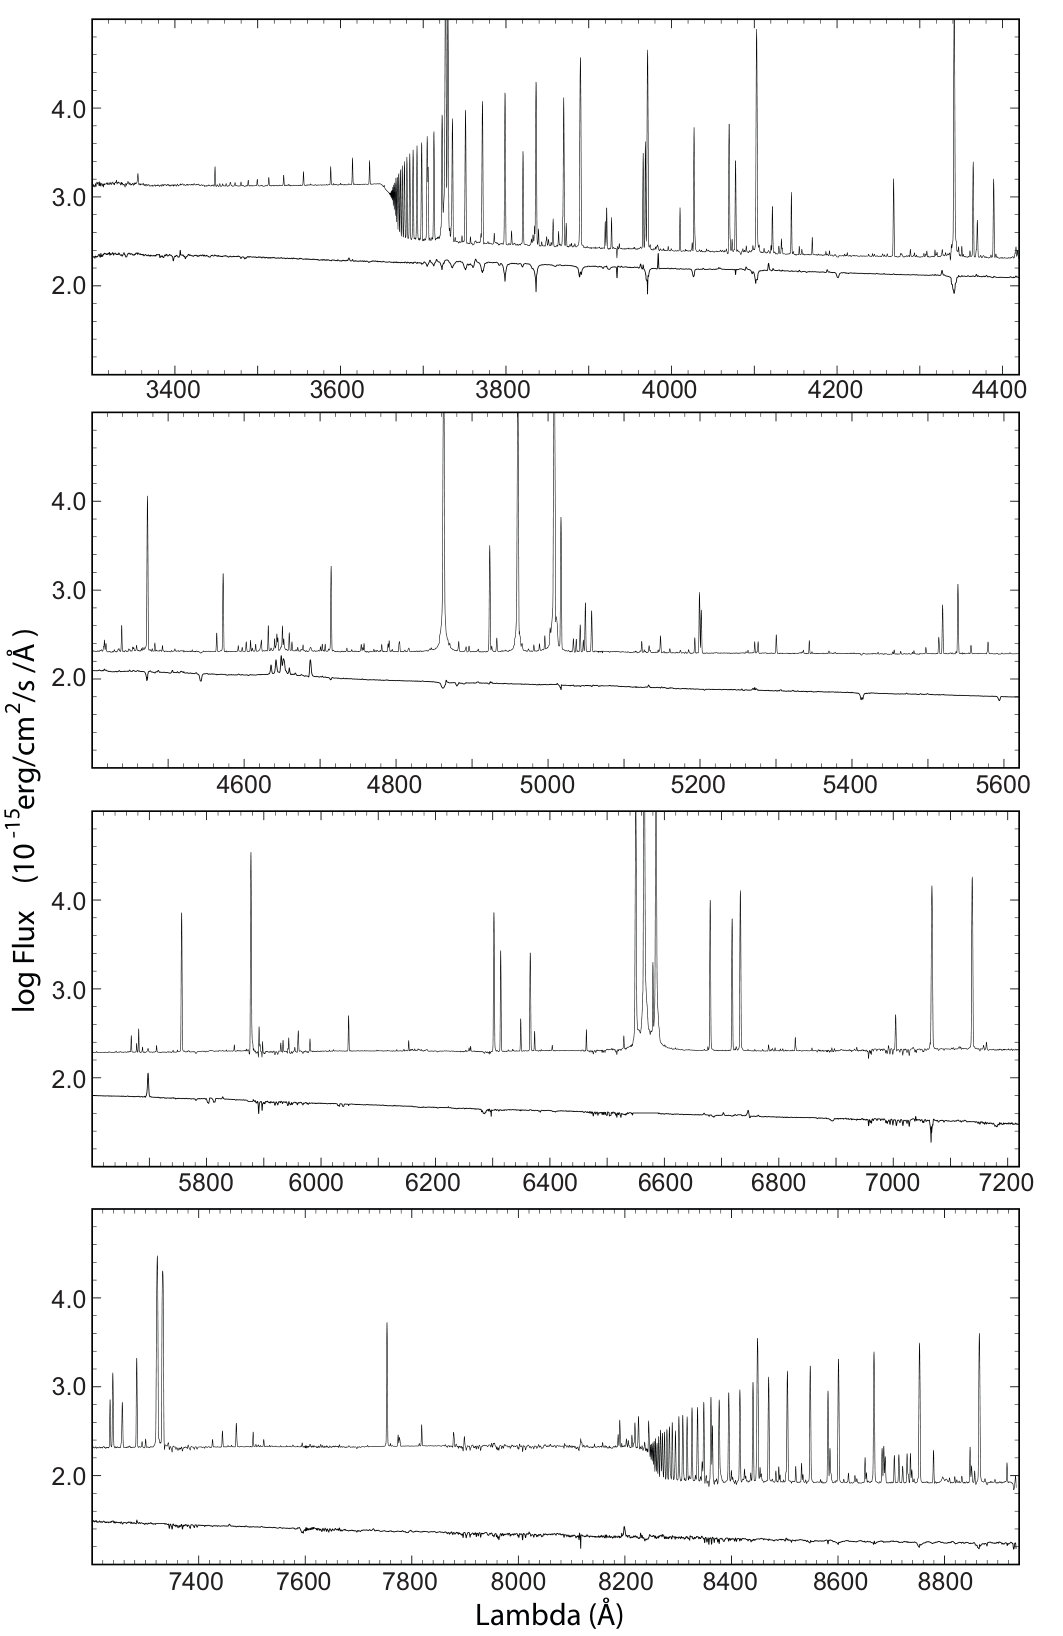 Figure 2
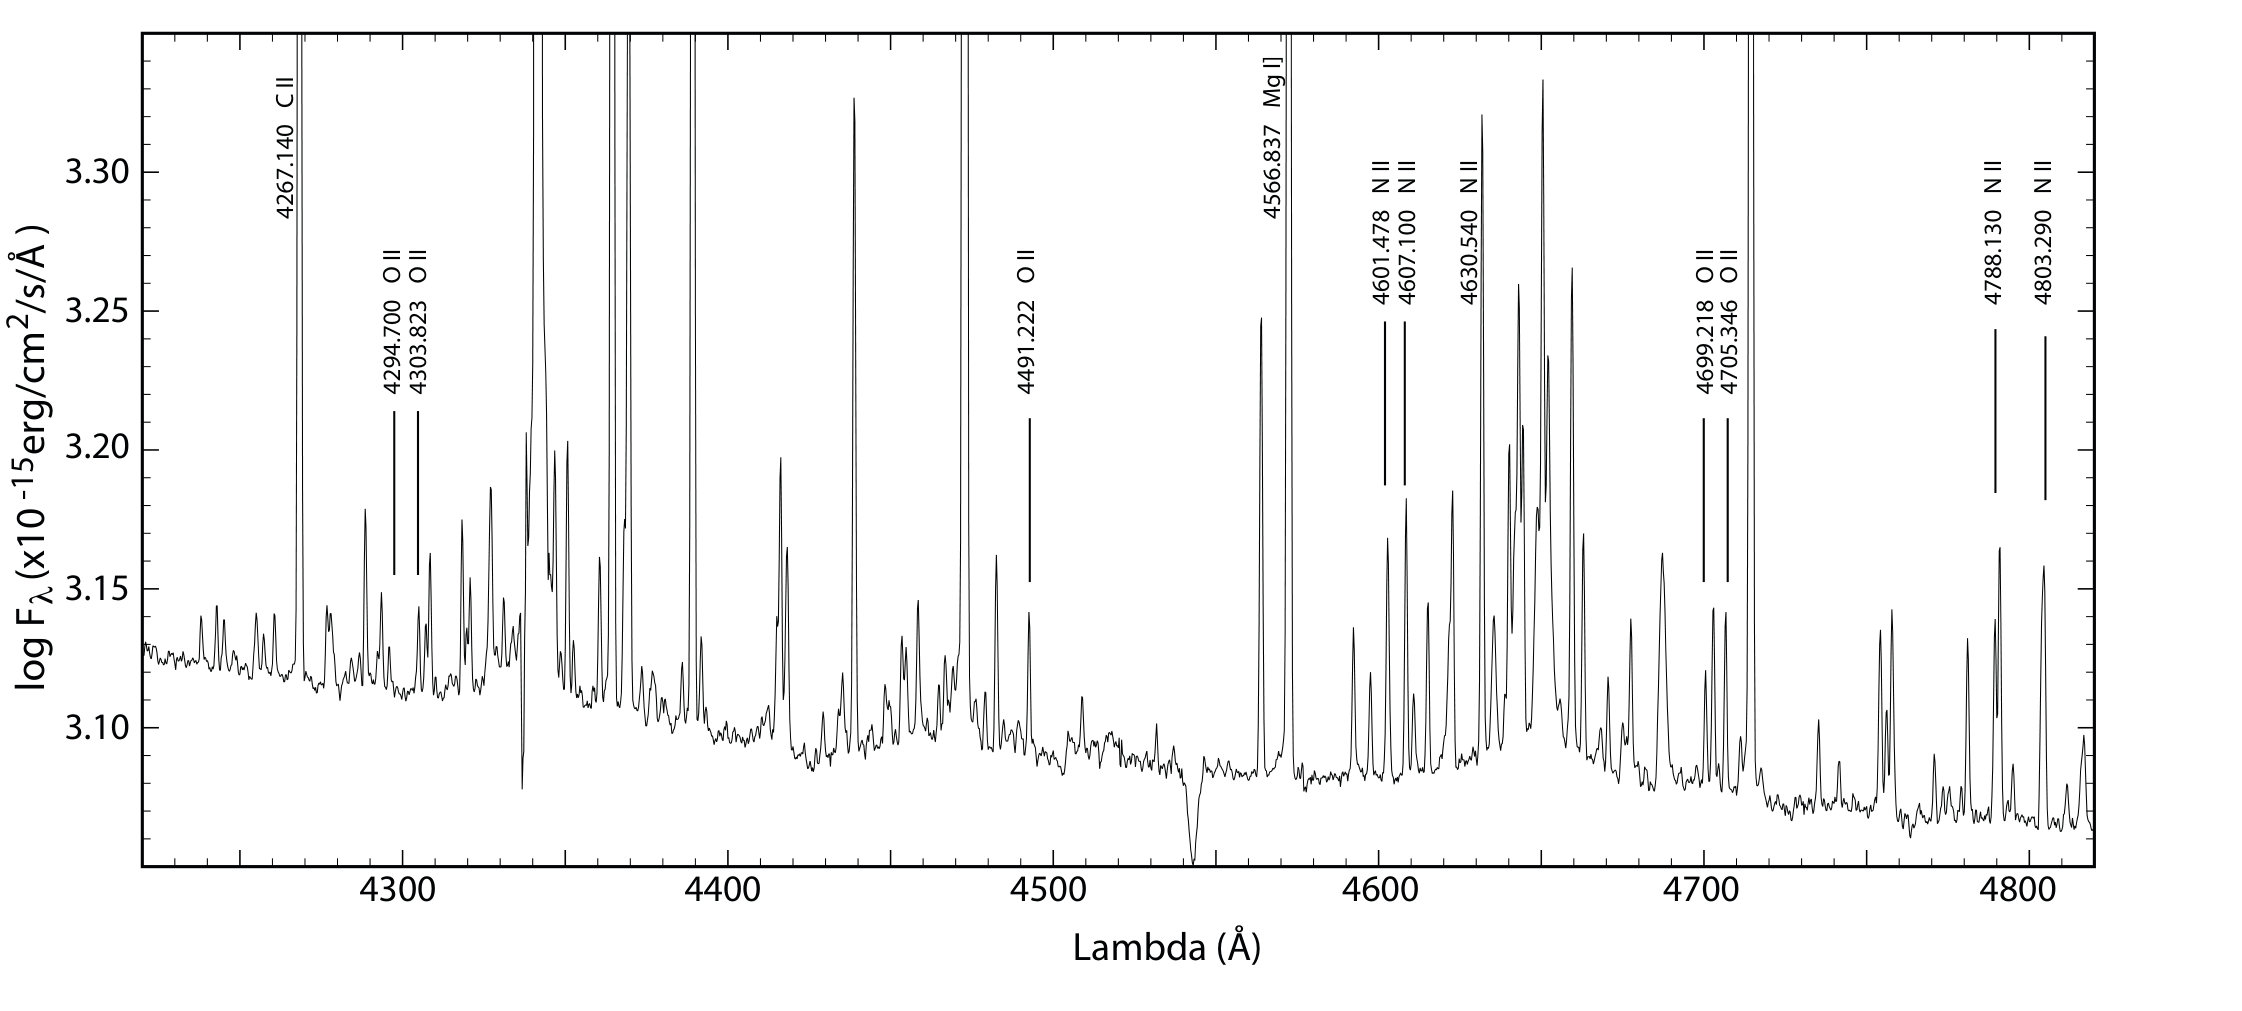 Figure 3
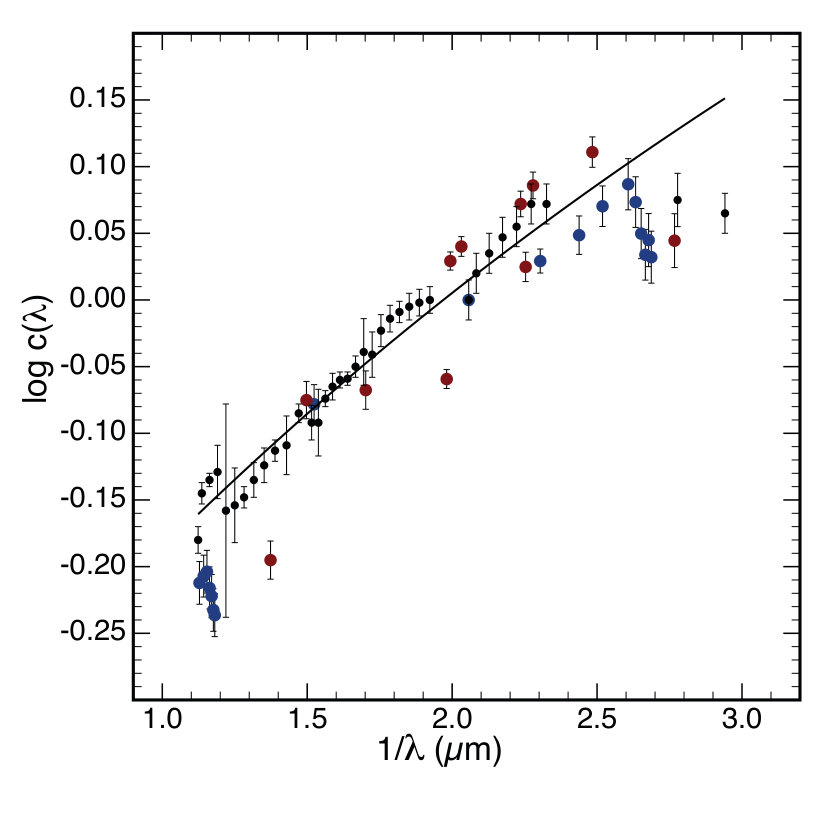 Figure 4
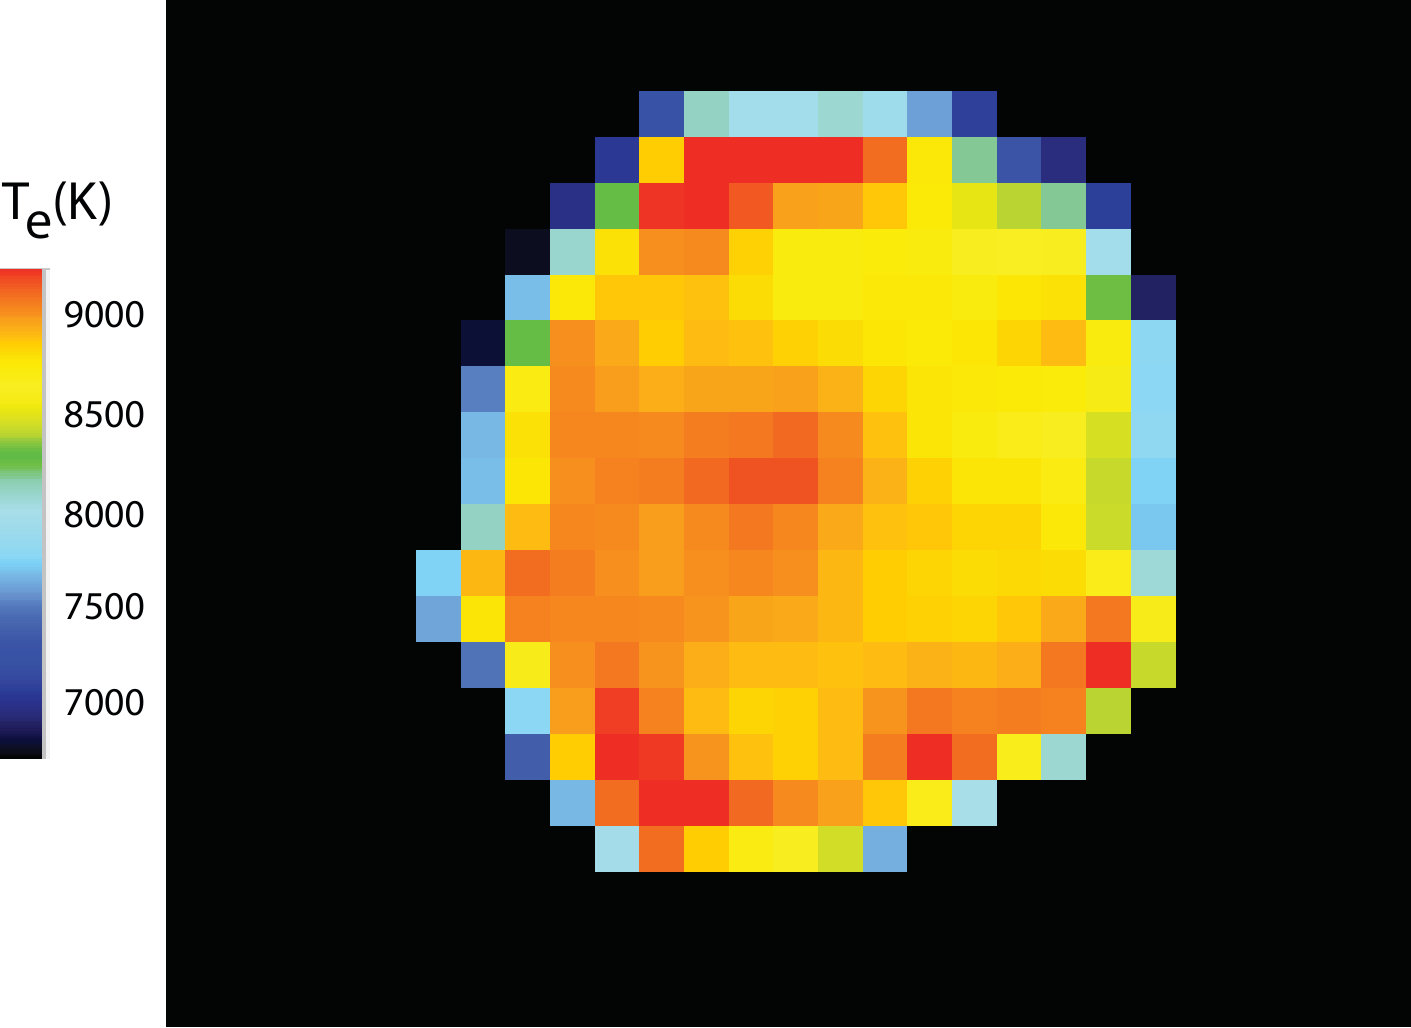 Figure 5
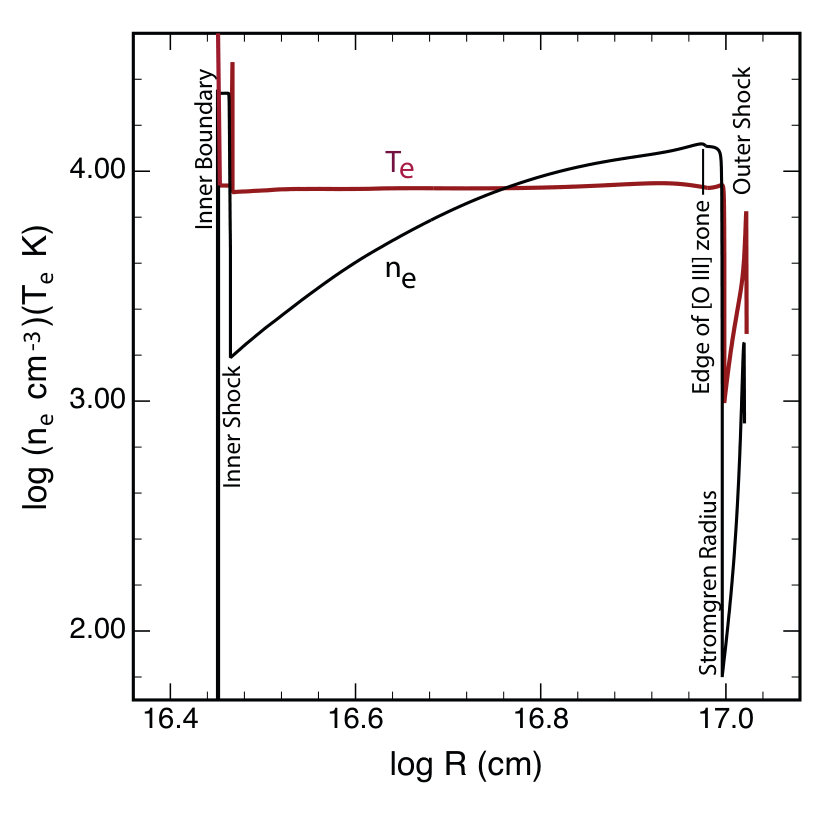 Figure 6
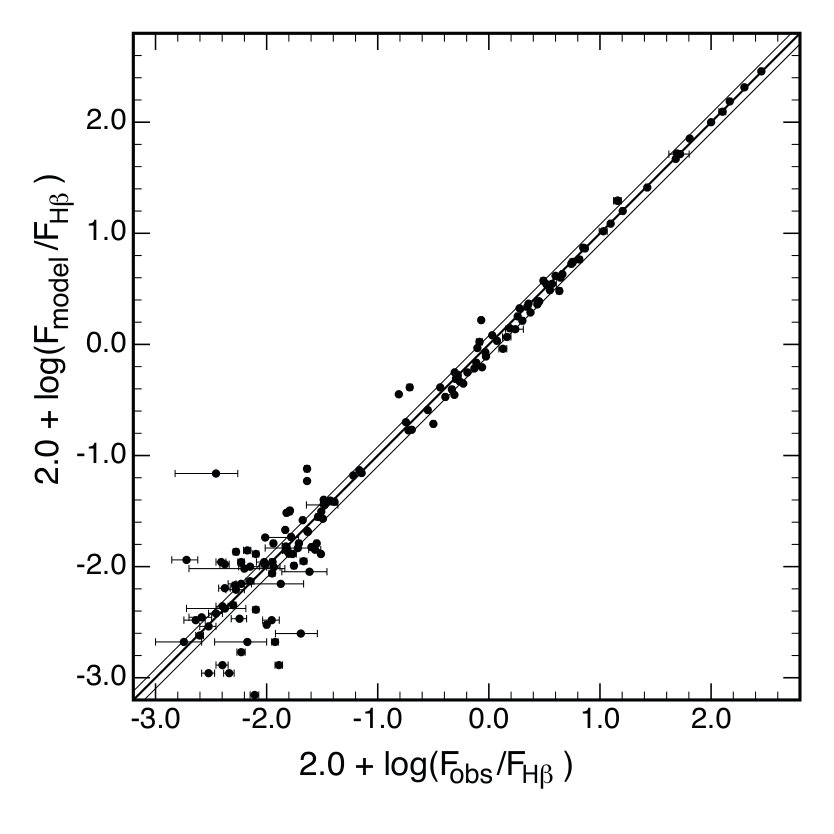 Figure 7
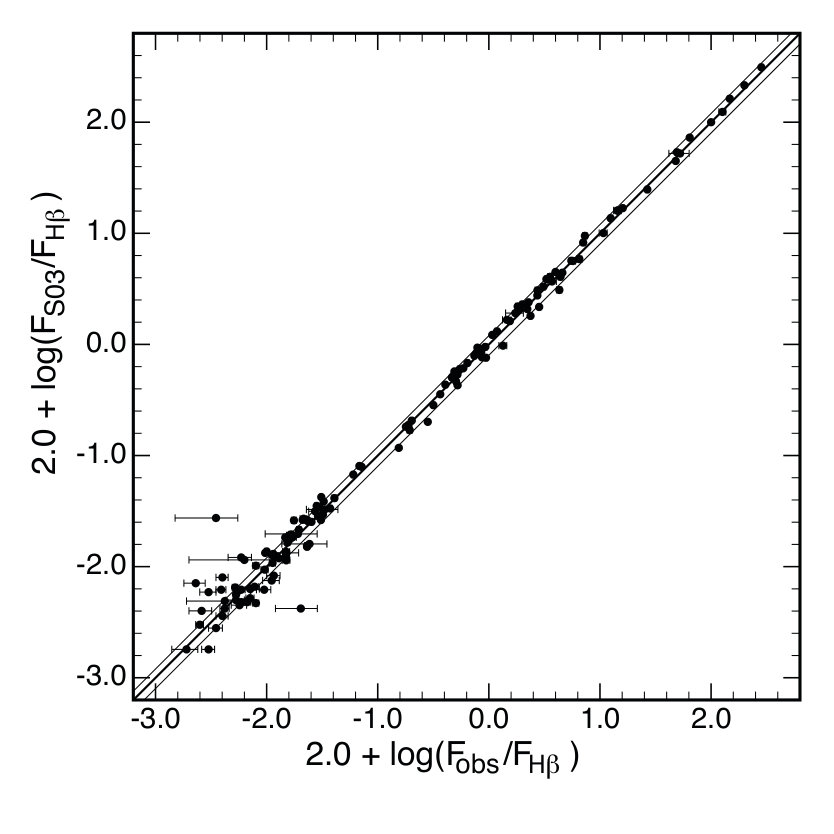 Figure 8
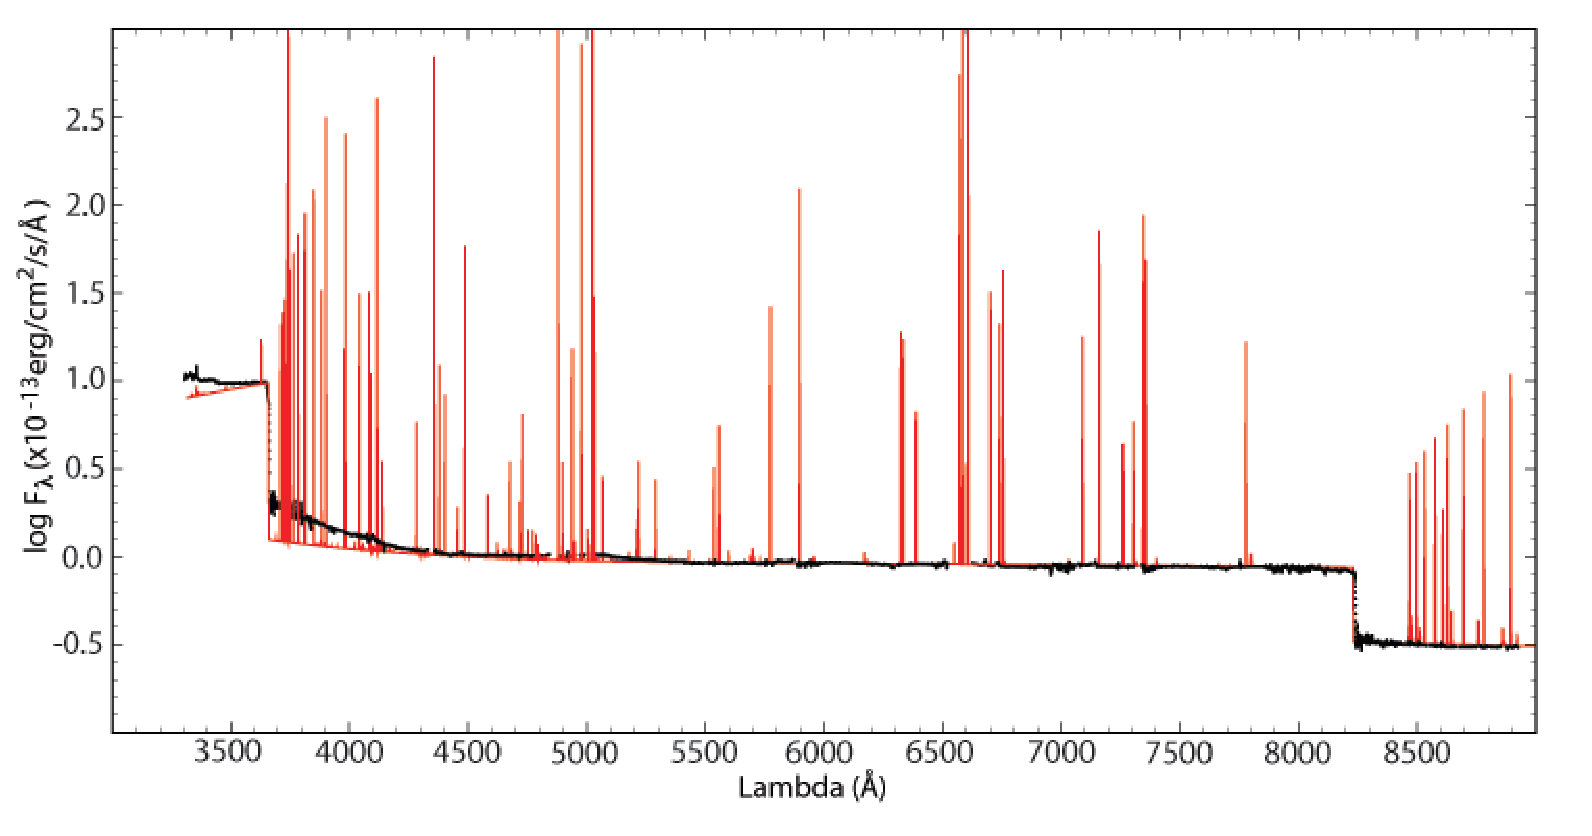 Figure 9
| Gratings | No. of | PA | Exposure | Date | Standard & Telluric Stars |
|---|---|---|---|---|---|
| frames | () | time (s) | |||
| IC 418: | |||||
| U7000 & R7000 | 3 | 90 | 3 | 09/01/2016 | HD 009051, HD 074000 & HIP 14898 (telluric) |
| U7000 & R7000 | 3 | 90 | 10 | 09/01/2016 | ” |
| U7000 & R7000 | 3 | 90 | 30 | 09/01/2016 | ” |
| U7000 & R7000 | 3 | 90 | 100 | 09/01/2016 | ” |
| Sky Reference: | |||||
| U7000 & R7000 | 3 | 0 | 300 | 09/01/2016 | ” |
| IC 418: | |||||
| B7000 & I7000 | 6 | 90 | 3 | 09/01/2016 | HD 009051, HD 074000 & HIP 14898 (telluric) |
| B7000 & I7000 | 3 | 90 | 10 | 09/01/2016 | ” |
| B7000 & I7000 | 3 | 90 | 30 | 09/01/2016 | ” |
| B7000 & I7000 | 3 | 90 | 100 | 09/01/2016 | ” |
| Sky Reference: | |||||
| B7000 & I7000 | 3 | 0 | 300 | 09/01/2016 | ” |
| Object | Temperature (K) | Density (cm-3) | |||||||
|---|---|---|---|---|---|---|---|---|---|
| IC 418 | |||||||||
| Observed: | 8775 | 10008 | 9879 | 8489 | 9216 | 8374 | 11874 | 11178 | |
| Model: | 8800 | 8830 | 8680 | 8879 | 8856 | 11950 | 12120 | 11450 | |
| Ref (1) | 8780 | 9530 | 9100 | 15300 | 9000 | 10400 | |||
| Ref (2) | 8900 | 9400 | 7000 | 9000 | 10000 | 17000 | 10000 | 11000 | |
| Ref (3) | 9100 | 9400 | 9100 | 3100 | 5000 | 4300 | |||
| Abundances from NEAT | Abundances from literature | |||
|---|---|---|---|---|
| Element | ORLs | CELs | Ref 1 | Ref 2 |
| He/H | 7.97E-2 | – | 9.1E-02 | 7.20E-2 |
| C/H | 5.50E-4 | – | 6.17E-4 | 6.20E-4 |
| N/H | 3.10E-4 | 4.51E-5 | 6.61E-5 | 9.50E-5 |
| O/H | 9.97E-4 | 2 .20E-4 | 3.47E-4 | 3.50E-4 |
| Ne/H | 7.32E-5 | 3.16E-5 | 3.47E-5 | 8.8E-5 |
| Ar/H | – | 1.72E-6 | 1.12E-6 | 1.80E-6 |
| S/H | – | 1.89E-6 | – | 4.4E-6 |
| Cl/H | – | 8.92E-8 | 8.7E-8 | – |
| N/O | 0.31 | 0.21 | 0.19 | 0.27 |
| Lambda (Å) | Ion | Nebula | Inner Shell | Outer Shock | Sum |
|---|---|---|---|---|---|
| 3727,9 | [O II] | 171.2 | 15.0 | 4.2 | 168.3 |
| 3867 | [Ne III] | 2.4 | 65.0 | 0.0 | 2.9 |
| 4068 | [S II] | 1.9 | 0.04 | 2.8 | 1.9 |
| 4363 | [O III] | 0.87 | 7.2 | 0.0 | 0.91 |
| 4711 | [Ar IV] | 0.41 | 0.86 | 0.0 | 0.41 |
| 4861 | H | 100 | 100 | 100 | 100 |
| 5007 | [O III] | 197.6 | 1114 | 0.0 | 202.9 |
| 5200 | [N I] | 0.24 | 0.0 | 21.3 | 0.45 |
| 6300 | [O I] | 1.72 | 0.0 | 60.0 | 2.28 |
| Fractional | 0.9824 | 0.0100 | 0.0076 | 1.000 | |
| Flux (H =1): |
| Wavelength | ID | Observed Flux | Model | Sharpee03 | Wavelength | ID | Observed Flux | Model | Sharpee03 |
|---|---|---|---|---|---|---|---|---|---|
| (Å) | (H=100) | (Å) | (H=100) | ||||||
| 3613.642 | He I | 0.4892 | 0.5577 | 4890.856 | O II | 0.0030* | 0.0137 | ||
| 3697.158 | H I | 1.1670 | 1.6649 | 4921.931 | He I | 1.2085 | 1.2186 | ||
| 3703.859 | H I | 1.3710 | 1.9143 | 4931.227 | [O III],[Fe III] | 0.0270 | 0.0294 | ||
| 3711.977 | H I | 1.6340 | 2.2926 | 4958.911 | [O III] | 71.2760 | 72.7233 | ||
| 3721.750 | H I,[S III] | 3.7458 | 3.3082 | 4987.210 | [Fe III ] | 0.0140 | 0.0165 | ||
| 3726.032 | [O II ] | 124.316 | 123.7908 | 4906.830 | O II | 0.0045* | |||
| 3728.815 | [O II ] | 51.6340 | 52.3426 | 4924.529 | O II | 0.0070* | |||
| 3734.375 | H I | 2.4490 | 3.0689 | 4994.360 | N II | 0.0313* | 0.0423 | ||
| 3750.158 | H I | 3.0910 | 4.0585 | 5001.480 | N II | 0.0366* | |||
| 3770.637 | H I | 3.9970 | 4.0585 | 5006.843 | [O III] | 206.0137 | 214.935 | ||
| 3777.134 | Ne II | 0.0062 | 0.0050 | 5015.678 | He I | 2.3269 | 2.3922 | ||
| 3797.904 | H I | 5.3170 | 5.6643 | 5047.739 | He I | 0.1685 | 0.1887 | ||
| 3835.391 | H I | 7.3130 | 9.4921 | 5158.792 | [Fe II] | 0.0041 | 0.0102 | ||
| 3864.431 | O II | 0.0021* | 5191.822 | [Ar III] | 0.0400 | 0.0386 | |||
| 3868.764 | Ne III ] | 3.0320 | 3.0916 | 5197.902 | [N I ] | 0.2568 | 0.2011 | ||
| 3882.194 | O II | 0.0100* | 0.0063 | 5200.257 | [N I] | 0.3560 | 0.1173 | ||
| 3888.800 | H I, He I | 19.6500 | 16.0294 | 5261.633 | [Fe II] | 0.0017 | 0.0062 | ||
| 3933.663 | Ca II | 0.0064 | 5270.403 | [Fe III] | 0.0590 | 0.0151 | |||
| 3888.800 | H I , He I | 19.6500 | 16.0294 | 5273.364 | [Fe II] | 0.0011 | 0.0018 | ||
| 3964.729 | He I | 1.0545 | 0.9220 | 5452.080 | N II | 0.0115* | 0.0018 | ||
| 3967.471 | [Ne III ] | 0.9133 | 0.9751 | 5462.590 | N II | 0.0105* | 0.0042 | ||
| 3970.079 | H I | 15.8730 | 16.8492 | 5478.086 | N II | 0.0024* | 0.003 | ||
| 4026.209 | He I | 2.1130 | 2.0978 | 5480.060 | N II | 0.0136* | 0.0056 | ||
| 4035.080 | N II | 0.0033 | 0.0071 | 5517.709 | [Cl III] | 0.1995 | 0.1819 | ||
| 4041.310 | N II | 0.0070 | 0.0121 | 5537.873 | [Cl III ] | 0.4104 | 0.3560 | ||
| 4068.600 | [S II],O II | 1.9391 | 1.8077 | 5577.339 | [O I] | 0.0130 | 0.0263 | ||
| 4072.152 | O II | 0.0359 | 0.0327* | 5666.630 | N II | 0.0384* | 0.0414 | ||
| 4076.349 | [S II] | 0.6228 | 0.7653 | 5676.020 | N II | 0.0147* | 0.0197 | ||
| 4087.153 | O II | 0.0034 | 0.0045 | 5679.560 | N II | 0.0661* | 0.0674 | ||
| 4089.288 | O II | 0.0150 | 0.0114 | 5686.210 | N II | 0.0087* | 0.0127 | ||
| 4095.644 | O II | 0.0025 | 0.0042 | 5710.780 | N II | 0.0140* | 0.0136 | ||
| 4097.257 | O II | 0.0096* | 0.0115 | 5754.595 | [N II] | 2.2960 | 2.7615 | ||
| 4101.742 | H I | 25.8480 | 24.8041 | 5875.664 | He I | 12.2260 | 13.6746 | ||
| 4104.723 | O II | 0.0090* | 0.0160 | 5927.810 | N II | 0.0313* | 0.0191 | ||
| 4110.786 | O II | 0.0032* | 0.0075 | 5931.790 | N II | 0.0112* | 0.0270 | ||
| 4120.835 | He I | 0.1707 | 0.2062 | 5941.650 | N II | 0.0142* | 0.0315 | ||
| 4132.800 | O II | 0.0099* | 0.0083 | 5952.390 | N II | 0.0074* | 0.0052 | ||
| 4153.298 | O II | 0.0129* | 0.0184 | 6149.298 | C II | 0.0150 | 0.0253 | ||
| 4267.140 | C II | 0.3520 | 0.5712 | 6300.304 | [O I] | 2.4365 | 2.1753 | ||
| 4275.551 | O II | 0.0068 | 0.0065 | 6312.063 | [S III] | 1.6550 | 0.8566 | ||
| 4277.894 | O II | 0.0012 | 0.0033 | 6363.776 | [O I] | 0.7793 | 0.7594 | ||
| 4294.700 | O II | 0.0029 | 0.0059 | 6527.231 | [N II] | 0.0280 | 0.0285 | ||
| 4303.823 | O II | 0.0007 | 0.0066 | 6548.052 | [N II] | 52.3040 | 53.6007 | ||
| 4307.232 | O II | 0.0013 | 0.0119 | 6562.819 | H I | 287.0080 | 312.043 | ||
| 4315.360 | O II | 0.0006 | 6578.053 | He I,C II | 0.5316 | 0.5374 | |||
| 4332.694 | O II | 0.0021* | 6583.454 | [N II] | 153.8852 | 162.9287 | |||
| 4340.471 | H I | 46.7602 | 44.8053 | 6678.152 | He I | 3.4798 | 3.8721 | ||
| 4363.209 | [O III] | 0.9280 | 0.9353 | 6716.440 | [S II] | 2.1834 | 2.0831 | ||
| 4387.929 | He I | 0.5603 | 0.5462 | 6730.816 | [S II] | 4.2908 | 4.4215 | ||
| 4437.553 | He I | 0.0696 | 0.0792 | 7135.792 | [Ar III] | 7.4260 | 8.2608 | ||
| 4471.502 | He I | 4.1424 | 4.4921 | 7231.327 | C II | 0.4112* | 0.1692 | ||
| 4491.222 | O II | 0.0021 | 0.0125 | 7236.416 | C II | 0.4915* | 0.4673 | ||
| 4566.837 | Mg I] | 0.5220 | 0.4291 | 7281.351 | He I | 0.6080 | 0.7911 | ||
| 4601.478 | N II | 0.0209* | 0.0263 | 7291.469 | Ca II | 0.0152 | 0.0123 | ||
| 4607.100 | N II | 0.0206* | 0.0257 | 7318.923 | [O II] | 3.5080 | 3.6886 | ||
| 4613.868 | N II | 0.0131* | 0.0182 | 7319.989 | [O II] | 10.4340 | 10.0586 | ||
| 4621.390 | N II | 0.0262* | 0.0264 | 7329.665 | [O II] | 5.8160 | 5.8617 | ||
| 4630.540 | N II | 0.0737* | 0.0805 | 7330.735 | [O II] | 5.5320 | 5.6377 | ||
| 4643.086 | N II | 0.0281* | 0.0344 | 7377.829 | [Ni II] | 0.0042 | 0.0049 | ||
| 4658.051 | [Fe III] | 0.0689 | 0.0274 | 7751.109 | [Ar III] | 1.7879 | 2.1967 | ||
| 4667.010 | [Fe III] | 0.0038 | 0.0028 | 7771.944 | O I | 0.0162 | 0.0352 | ||
| 4699.218 | O II | 0.0183* | 0.0133 | 7774.166 | O I | 0.0162 | 0.0215 | ||
| 4701.535 | [Fe III] | 0.0320 | 7775.388 | O I | 0.0162 | 0.0130 | |||
| 4705.346 | O II | 0.0214 | 0.0183 | 8433.661 | [Cl III] | 0.0110 | 0.0062 | ||
| 4713.171 | He I | 0.4445 | 0.6098 | 8437.955 | H I | 0.3370 | 0.4345 | ||
| 4733.906 | [Fe III] | 0.0140 | 0.0048 | 8467.254 | H I | 0.3940 | 0.5050 | ||
| 4740.123 | [Ar IV] | 0.0044 | 0.0036 | 8480.859 | [Cl III] | 0.0110 | 0.0108 | ||
| 4754.687 | [Fe III] | 0.0130 | 0.0047 | 8502.483 | H I | 0.4660 | 0.5983 | ||
| 4769.431 | [Fe III] | 0.0110 | 0.0062 | 8545.383 | H I | 0.5600 | 0.6807 | ||
| 4779.720 | N II | 0.0305* | 0.0179 | 8616.950 | [Fe II] | 0.0105 | 0.0094 | ||
| 4788.130 | N II | 0.0185* | 0.0195 | 8578.697 | [Cl II] | 0.1927 | 0.2844 | ||
| 4803.290 | N II | 0.0102* | 0.0261 | 8598.392 | H I | 0.6840 | 0.8362 | ||
| 4810.299 | N II | 0.0035* | 0.004 | 8665.018 | H I | 0.8500 | 0.9501 | ||
| 4814.544 | [Fe II] | 0.0013 | 0.008 | 8727.126 | [C I] | 0.0393 | 0.0334 | ||
| 4861.333 | H I | 100.000 | 100.000 | 8750.472 | H I | 1.0780 | 1.3112 | ||
| 4880.996 | [Fe III] | 0.0760 | 0.0154 | 8829.391 | [S III] | 0.0110 | 0.0048 | ||
| 4889.623 | [Fe II] | 0.0011 | 8862.783 | H I | 1.3990 | 1.6217 |
| Element | Gas Phase | Total | MG09 | NEAT |
|---|---|---|---|---|
| H | 12.00 | 12.00 | 12.00 | 12.00 |
| He | 11.04 | 11.04 | 11.08 | 10.90 |
| C | 8.71 | 8.92 | 8.90 | 8.74 |
| N | 7.98 | 8.08 | 8.00 | 7.65 |
| O | 8.62 | 8.86 | 8.60 | 8.34 |
| Ne | 8.14 | 8.14 | 8.00 | 7.50 |
| Mg | 7.04 | 8.32 | 7.05 | — |
| Si | 6.84 | 7.50 | 7.10 | — |
| S | 6.89 | 6.89 | 6.65 | 6.28 |
| Cl | 4.89 | 5.70 | 5.00 | 4.95 |
| Ar | 6.08 | 6.08 | 6.20 | 6.23 |
| Ca | 3.84 | 6.99 | — | — |
| Fe | 4.97 | 7.22 | 4.60 | — |
| Ni | 4.02 | 6.46 | — | — |
| Lambda (Å) | Ion | Flux | Model |
|---|---|---|---|
| 1663 | O III] | 0.71 | |
| 1750 | N III] | 0.58 | 0.87 |
| 1909 | C III] | 27.59 | 49.3 |
| 2325 | C II] | 81.2 | 44.5 |
| 2471 | [O II] | 19.2 | 19.8 |
| 2798 | Mg II | 16.3 | 21.57 |
| Lambda(m) | Ion | Flux | Model |
| 2.625 | H I | 4.7 | 4.68 |
| 4.052 | H I | 8.6 | 8.21 |
| 7.46 | H I | 2.7 | 2.61 |
| 8.99 | [Ar III] | 7.3 | 7.39 |
| 10.51 | [S IV] | 1.3 | 2.05 |
| 12.81 | [Ne II] | 53.1 | 82.7 |
| 15.55 | [Ne III] | 9.5 | 4.23 |
| 18.71 | [S III] | 15.2 | 24.4 |
| 33.47 | [S III] | 2.6 | 4.31 |
| 34.81 | [Si II] | 0.9 | 0.90 |
| 51.81 | [O III] | 14.7 | 14.6 |
| 57.34 | [N III] | 3.2 | 3.2 |
| 63.10 | [O I] | 10.1 | 0.34 |
| 88.36 | [O III] | 2.4 | 1.95 |
| 121.8 | [N II] | 0.16 | 0.21 |
| 145.6 | [O I] | 0.10 | 0.24 |
| 157.7 | [C II] | 0.99 | 0.37 |
Peer Reviews
No public reviews on file for this paper yet. If you reviewed it on a platform where reviews are public (OpenReview, ICLR, NeurIPS, ICML), you can paste yours below so the community can read it here.
Videos
No videos yet. Explain this paper in a talk, walkthrough, or lecture? Add one.
IFU spectroscopy of Southern Planetary Nebulae IV: A Physical Model for IC 418
M.A. Dopita,1 A. Ali,2,3 R.S. Sutherland,1 D.C. Nicholls,1 & M. A. Amer,2,3
1Research School of Astronomy and Astrophysics, Australian National University, Cotter Rd., Weston ACT 2611, Australia
2Astronomy Dept, Faculty of Science, King Abdulaziz University, Jeddah, Saudi Arabia
3Department of Astronomy, Faculty of Science, Cairo University, Egypt
(Released 2016 Xxxxx XX)
Abstract
We describe high spectral resolution, high dynamic range integral field spectroscopy of IC418 covering the spectral range 3300-8950Å and compare with earlier data. We determine line fluxes, derive chemical abundances, provide a spectrum of the central star, and determine the shape of the nebular continuum. Using photoionisation models, we derive the reddening function from the nebular continuum and recombination lines. The nebula has a very high inner ionisation parameter. Consequently, radiation pressure dominates the gas pressure and dust absorbs a large fraction of ionising photons. Radiation pressure induces increasing density with radius. From a photoionisation analysis we derive central star parameters; K, , and using stellar evolutionary models we estimate an initial mass of . The inner filamentary shell is shocked by the rapidly increasing stellar wind ram pressure, and we model this as an externally photoionised shock. In addition, a shock is driven into the pre-existing Asymptotic Giant Branch stellar wind by the strong D-Type ionisation front developed at the outer boundary of the nebula. From the dynamics of the inner mass-loss bubble, and from stellar evolutionary models we infer that the nebula became ionised in the last yr, but evolved structurally during the yr since the central star evolved off the AGB. The estimated current mass loss rate (yr*-1*) and terminal velocity ( km/s) is sufficient to excite the inner mass-loss bubble. While on the AGB, the central star lost mass at yr*-1* with outflow velocity km/s.
keywords:
line: identification – shock waves – stars: post AGB – ISM: abundances – planetary nebulae: individual: IC418
††pagerange: IFU spectroscopy of Southern Planetary Nebulae IV: A Physical Model for IC 418–LABEL:lastpage††pubyear: 2017
1 Introduction
Reviewing the literature as listed in the SIMBAD database, we find that a daunting number of articles () have studied the compact, young, high surface brightness, and low excitation class planetary nebula (PN) IC 418. These cover the entire accessible electromagnetic spectrum. Indeed, at first glance, it is difficult to imagine what can be contributed to the discussion on that object that is new.
The narrow band HST emission line images of this so-called “Spirograph nebula” show a well-defined oval shape with a simple radial ionization stratification andquasi-regular delicate filamentation. The HST color composite image (H+[O III]) displays a clearly enhanced filamentary [O III] shell emission in the inner bubble region (Sahai et al., 2011). These authors suggested that this inner bubble represents emission from very hot gas in the reverse shock generated by the spherical, radiatively driven, fast wind from the central star (CS). Here we present a somewhat different model. To investigate the occurrence of shocks in planetary nebulae (PNe), Guerrero et al. (2013) have built [O III]/H ratio maps which show a decrease at the outer edge in case of IC 418. The optical, near, and mid-IR images probe the presence of different structures around the bright main nebular shell including radial filaments/rays, a system of three concentric rings and two detached haloes (Ramos-Larios et al., 2012). Some of these features can be ascribed to enhanced mass-loss during thermal pulses occurring at the end of the AGB phase of stellar evolution (Vassiliadis & Wood, 1993). Furthermore, they noticed that the progression of the ionization front through the nebula is not homogenous, with the development of instabilities at the outer regions of the ionized shell (which give rise to the “spirograph” appearance), and the formation of radial structures probably caused by UV photons leaking from the less opaque regions of the ionised shell.
The central star (CS) of IC 418 (HD 35914) has been classified as an Of (H-rich) type (Acker et al., 1992) . It has a relatively a low temperature as determined from the Zanstra ((H I) = 34kK) and energy balance (TEB = 36 kK) methods (Pottasch & Bernard-Salas, 2010). Due to the marginally detected He II 4686 emission of IC 418, which (as shown here) seems to originate mainly in the central star , it is hard to derive a realistic He II Zanstra temperature. Presumably, it was this central star HeII emission which led Phillips (2003) to derive the much higher He II Zanstra temperature ((He II) = 44.5 kK).
Evidence for a hot shocked stellar wind and possible electron conduction region in the inner region of IC 418 has been found by Ruiz et al. (2013) (see the Chandra and HST color composite image of IC 418 in their Figure 3). These authors find diffuse X-rays in a number of nebulae showing O VI nebular emission in the UV. In the specific case of IC 418, the Chandra data is consistent with thermal emission from a hot plasma confined within the inner [O III] bright filamentary shell at a temperature of 0.26 keV ( K).
Time-variability structure in the fast winds of the IC 418 CS was detected by Prinja et al. (2012). They reported that the UV resonance line in the IC 418 CS are variable primarily due to the occurrence of blue-ward migrating discrete absorption components. Polarimetric spectra of the CS indicate mean longitudinal magnetic fields of G (Steffen et al., 2014).
Among recent significant works we note the superb échelle spectrum by Sharpee et al. (2003); Sharpee et al. (2004), which provided accurate line identifications and fluxes over a wide wavelength base, and down to very faint levels. This work enables a comparison of line fluxes with those from our own IFU observations and with those derived from the model which we present in this paper. Both the Sharpee et al. (2003) work and the UV and IR spectrophotometry published by Pottasch et al. (2004) were used by Morisset & Georgiev (2009) to construct a self-consistent stellar and 3D nebular model for IC418 which reproduces the optical and UV stellar observations as well as the nebular IR, deep optical, UV observations, and HST images. The model provides an effective temperature, kK and a luminosity of 7700 L*☉* for the CS. Further, the model shows that the abundances of O, Ne, and Ar elements are close to solar values, while the elements Si, S, Cl, Mg, and Fe are under-abundant relative to their solar values, indicating trapping of an appreciable fraction of these elements on to dust grains. This work was expanded later by Escalante et al. (2012) to show that many of the faint permitted lines of the heavy elements are predominantly excited by fluorescence rather than by recombination.
Delgado-Inglada et al. (2015) have classified IC 418 as a carbon-rich dust PN due to the presence of the infrared broad features at 11 and/or 30 associated with SiC and MgS. From the comparison of He/H, C/O, and N/O abundance ratios derived from the PNe with predictions of nucleosynthesis models, they suggest that PNe with carbon-rich dust descend from stars with masses in the range 1.5-3.0 solar masses. Otsuka et al. (2014) confirmed the presence of the broad PAH 3.3 emission band and measured the total flux of the 17.4 and 18.9 emission F(C60 - fullerenes) and its fraction with respect to the integrated dust continuum. Díaz-Luis et al. (2015) identified 11 diffuse interstellar bands in IC 418, but they found no evidence for the strongest electronic transition of neutral C60. The first detection of the isotope 3He in IC 418 was reported by Guzman-Ramirez et al. (2016). They derived abundance in the range to for 3He/H. Such a discovery clearly has impact in the fields of astrophysics and cosmology.
The integral field unit (IFU) technique (as applied to PNe) was pioneered by Monreal-Ibero et al. (2005) and Tsamis et al. (2007). Recently, detailed physical and morpho-kinematical studies using optical IFU data have been obtained by Danehkar & Parker (2015), Danehkar (2015) and Danehkar et al. (2016) using the Wide Field Spectrograph (WiFeS) instrument (Dopita et al., 2007; Dopita et al., 2010) to study the PNe Hen 3-1333, Hen 2-113, Th 2-A and M2-42. The advantages of using the integral field unit (IFU) spectroscopy compared to the long slit spectroscopic technique in the field of planetary nebulae, were given by Ali et al. (2016). This paper is the fourth in the series examining PNe using the unique capabilities of the WiFeS instrument, which is uniquely well-suited to integral field spectroscopy of compact PNe. In the first paper in this series, Ali et al. (2015) used WiFeS to study the large, evolved and interacting planetary nebula PNG 342.0-01.7, generating an IFU mosaic to cover the full spatial extent of the object. The second paper, (Basurah et al., 2016) provided a detailed analysis of four highly excited non-type I PNe which casts doubt on the general applicability of the WELS classification. The third paper (Ali et al., 2016) presented excitation maps, integral field spectroscopy and an abundance analysis of the four PNe: M3-4; M3-6; Hen2-29; Hen2-37. In addition we demonstrated that the CS of M3-6 is another example for the mis-classified WELS group of nebulae.
These earlier papers used a resolution of in the red out to 7200Å and a resolution of in the blue region of the spectrum (Å). In this paper we provide emission line modelling of integral field data covering whole nebula over the full wavelength range of the WiFeS instrument (3300–8950Å), and at the highest resolution available (). This modelling includes both the effect of the inner [O III] - bright shock, driven into the ionised plasma by the overpressure of the hot shocked stellar wind bubble, and the shock at the outer boundary of the ionised region propagating into the AGB wind, which must be driven by the strong D-type ionisation front formed as both the effective temperature and number of ionising photons produced by the central star rapidly increase with time (Kahn, 1954; Mendis, 1969; Garcia-Segura & Franco, 1996).
In Section 2, we describe the observations and data reduction, while the nebular and stellar spectra in addition to reddening corrections are discussed in Section 3. The basic parameters of the three zones in a self-consistent model of IC 418, and the details of the model are given in Sections 4 and 5, respectively. Section 6, is dedicated to the results of the nebular model, while Section 7 provides the discussion and conclusions.
2 Observations & data reduction
The integral field spectra of IC 418 were obtained on January 9, 2016 using the WiFeS instrument (Dopita et al., 2007; Dopita et al., 2010) mounted on the 2.3-m ANU telescope at Siding Spring Observatory. This instrument delivers a field of view of 25″ 38″at a spatial resolution of either 1.0″ 0.5″or 1.0″ 1.0″, depending on the binning on the CCD. In these observations, we operated in the binned 1.0″x 1.0″mode. The data were obtained in the high resolution mode (FWHM of km/s) using all four high-resolution gratings. Observations are made simultaneously in two gratings, as indicated in Table 1. For the U7000 & R7000 gratings, the dichroic cuts at 480nm (RT480), while for the B7000 & I7000 gratings, the dichroic cuts at 615nm (RT615). Thus each waveband is observed in a region of high dichroic efficiency, and an adequate overlap in wavelength coverage is obtained between each of the gratings. For details on this, see Dopita et al. (2007).
The wavelength scale was calibrated using the Ne-Ar arc Lamp throughout the night. Arc exposure times are 180s for the U7000 grating, 100s at B7000, 9s for the R7000, and 1s for the I7000 grating. Flux calibration was performed using the STIS spectrophotometric standard stars HD 009051 & HD 074000 111Available at :
www.mso.anu.edu.au/~bessell/FTP/Bohlin2013/GO12813.html. In addition, a B-type telluric standard HIP 14898 was observed to better correct for the OH and H2O telluric absorption features in the red. The separation of these features by molecular species allows for a more accurate telluric correction by accounting for night to night variations in the column density of these two species. All data cubes were reduced using the PyWiFeS 222http://www.mso.anu.edu.au/pywifes/doku.php. data reduction pipeline (Childress et al. (2014)). A summary of the spectroscopic observations is given in Table 1.
The global spectra of each of the objects were extracted from their respective reduced data cubes using a circular aperture matching the observed extent of the PNe using QFitsView v3.1 rev.741333QFitsView v3.1 is a FITS file viewer using the QT widget library and was developed at the Max Planck Institute for Extraterrestrial Physics by Thomas Ott.. This procedure allows for sub-arcsec. differences in the extraction apertures caused by differential atmospheric dispersion. All spectra are sky subtracted using the sky reference exposures listed in Table 1. In the I7000 and R7000 wavebands, any residual night sky lines were removed using an annular region outside the observed extent of the PNe.
Except in the shortest exposures, the strong lines are saturated on the CCD. Even in the shortest exposure the [O III] Å line is marginally saturated, and for this line the flux was determined from the [O III] Å line, multiplied by its theoretical ratio with respect to [O III] Å .
The continuum levels and the faint emission lines are determined from the longest exposures in each grating. For the stronger lines, saturation on the CCD is detected by comparison of the measured peak flux between two exposures. If the measured peak flux in the longer exposure is lower, then the line is saturated. The data in the saturated region was then replaced by the unsaturated data in the corresponding region.
Finally emission-line fluxes, their uncertainties, the velocity FWHMs and the continuum levels were measured, from the final combined, flux-calibrated spectra, using the interactive routines in Graf 444Graf is written by R. S. Sutherland and is available at: https://miocene.anu.edu.au/graf and in Lines 555Lines is written by R. S. Sutherland and is available at: https://miocene.anu.edu.au/lines. Each line is fit with a single Gaussian, which at this resolution provides a sufficient description of the line profile. The local continuum is fit either side of the line using a linear or a quadratic interpolation. The measured wavelength, the wavelength corrected to rest, and the NIST wavelength of all the identified lines are listed in Table LABEL:Table:fluxes in the Appendix. The mean wavelength error on the identification can be estimated for each grating as a function of wavelength from Fig 1. The identification of the lines in common with this study can be made by comparing Table LABEL:Table:fluxes with Table 3 of Sharpee et al. (2003).
3 Results
3.1 Nebular and Stellar Spectra
In Figure 2 we show the extracted spectra of the IC 418 nebula, and of its central star, and in Figure 3 we show the nebular spectrum in the spectral region 4240-4840Å amplified to bring out the fainter lines and to show the noise in the continuum determination. A number of O II and N II recombination lines are marked. The signal to noise in the nebular continuum is better than 100:1, except in regions of strong residual telluric absorption. These regions show up clearly in the spectrum of the central star. Nonetheless, the quality of the telluric correction is very high, as these residual features only amount to a few percent. Table LABEL:Table:fluxes in the Appendix lists the measured line fluxes with respect to H, the estimated flux error and the reddening corrected fluxes (see below for the derivation of these). We also measured line FWHM in velocity, without correction for the instrumental profile ( km/s).
The observed H flux for the full ionised nebula is , in agreement with Pottasch et al. (1977). Previously published values range from -9.52 to -9.71 (Capriotti & Daub, 1960; O’Dell, 1962; Perek, 1971; Kaler, 1973; Carrasco et al., 1983). Using a logarithmic reddening correction of based on the ratio of H to H, we deduce a reddening corrected flux of .
3.2 Reddening Corrections
The standard way to infer the reddening correction is from measurement of the Balmer Decrement. On this basis we infer a logarithmic reddening correction of for IC 418. This is very similar to the extinction inferred from the Å dip by Pottasch et al. (1977) ; . However, given the high quality spectrophotometric data presented here, we can also use Balmer to Paschen ratios, the recombination lines of He I, and/or the shape of the nebular continuum, (Groves et al., 2002). However, to do this, we first need a nebular model against which we can compare our observations. The details of the final model are given below. However, for the purpose of deriving the reddening, we first produced an approximate model to fit the observed line intensities using our estimated logarithmic reddening correction of . We then inferred an empirical reddening function on the basis of the model line intensities compared with the observations, and using the model nebular continuum compared with the observations. We then used the revised line intensities to obtain an improved model, and repeated the process. Two iterations are sufficient for the process to converge satisfactorily.
The resultant differential reddening function is shown in Figure 4. The continuum and the He I lines agree well, as does the Balmer decrement for the well-separated lines. However, the closely spaced Balmer and Paschen lines systematically deviate from the smooth reddening function. A comparison with the Sharpee et al. (2003) line intensities suggests that these overlapping lines are not well measured in our line fitting procedure, and should be discounted from the fit.
The derived de-reddened line fluxes are presented in Table LABEL:Table:fluxes in the Appendix. A total of 636 emission lines have been identified.
3.3 Basic Temperature and Density Diagnostics
We have used the emission line fluxes measured from the global nebular spectrum, and listed in Table LABEL:Table:fluxes in the Appendix to determine electron temperatures, densities and ionic abundances using the Nebular Empirical Abundance Tool (NEAT; Wesson et al. (2012) to derive the electron temperature and density from the low and medium-ionization zones. The NEAT code use the Monte Carlo technique to propagate the statistical uncertainties from the line fluxes to the temperature, density, ionic, and elemental abundances. The NEAT temperatures and electron densities are given in Table 2, where we also include the values derived from our detailed photoionisation modelling described below as well as those previously derived in the literature.
In Table 3 we provide the derived elemental abundances from this work, and from the literature. Note that the optical recombination lines (ORLs) of both N and O give a much larger abundance than the coliisionally excited lines (CELs). This difference has been shown by Escalante et al. (2012) to be mainly caused by fluorescent effects caused by the UV continuum of the central star, and is discussed in detail in Section 6.3 below.
4 A physical model for IC418
We aim to construct a self-consistent model for IC 418 consisting of three separate zones:
An inner photoionised shock driven by the accelerating stellar wind of the central star, 2. 2.
A photoionised nebular shell, and 3. 3.
An outer shock in the AGB wind driven by the over-pressure of the strong D-Type ionisation front.
Here, we estimate the basic parameters of these three zones.
4.1 The inner stellar wind bubble shock
The inner photoionised shocked shell is expected to exist from the theory of mass-loss bubbles (Dyson & de Vries, 1972; Weaver et al., 1977; Schmidt-Voigt & Koeppen, 1987; Schmidt-Voigt & Koppen, 1987; Marten & Schoenberner, 1991) and is clearly visible in the HST Hubble Heritage image (http://heritage.stsci.edu/2000/28/big.html) as an elliptical filamentary ring, enhanced in [O III] emission. This ring, approximately 0.01 pc in diameter, is coincident with the extent of the diffuse X-ray emission seen with Chandra (Ruiz et al., 2013). The X-ray emission arises from a thermal plasma at K. This temperature would be produced by a shocked stellar wind from the central star, provided that the terminal velocity of this wind is km/s – or somewhat faster if cooling of the hot plasma by thermal conduction is important. This compares with the value of estimated from the UV observations of the central star by Morisset & Georgiev (2009); 450 km/s.
The pressure driving the outer stellar wind shock can be estimated from the properties of the stellar wind itself. From Morisset & Georgiev (2009), the stellar mass-loss rate yr*-1*. The momentum flux in the stellar wind is converted to thermal pressure at the edge of the free-wind region, which theoretical models indicate lies between 0.5–0.7 of the radius of the shock in the swept up AGB wind. At a distance of 1.0 kpc, derived below, this [O III] - bright stellar wind shock lies at a radius of pc. Using a stellar wind velocity of km/s, we find that both the hot X-ray bubble and the shocked [O III] bubble has cm*-3*K. We will use this estimate later to compute the velocity of the stellar wind bubble shock in the photoionised nebula.
4.2 The photoionised nebula
A self-consistent model of the photoionised region of IC 418 has been presented by Morisset & Georgiev (2009). In order to reproduce the surface brightness distribution, a particular density distribution was imposed for both the inner photoionised stellar wind shock and for the photoionised nebula as a whole. However, this distribution may be a natural consequence of the somewhat unusual parameters of the nebula. Based on an inner radius of 0.01 pc, and depending upon the density at this inner radius, we estimate that the ionisation parameter at the inner boundary of the photoionised nebula is in the range . This puts IC 418 very firmly into the category of nebulae in which radiation pressure exceeds the gas pressure (Dopita et al., 2002; Dopita et al., 2006; Davies et al., 2016). In this regime, dust competes very successfully with the ionised plasma to absorb photons in the Lyman continuum, reducing the extent of the photoionised nebula (Dopita et al., 2003), while at the same time, radiation pressure induces a steeply increasing density gradient though the photoionised nebula, as the radiation field is absorbed and its pressure adds to the initial gas pressure. Such a density gradient is observed in IC 418, and our modelling seeks to discover whether this is simply due to the action of radiation pressure.
4.3 The outer shock in the AGB wind
As a consequence of the pressure in the photoionised region, which includes both the gas pressure, and the pressure associated with the absorbed fraction of the radiation field at the outer ionised boundary, a strong D-type ionisation front is formed (Kahn, 1954; Mendis, 1969; Garcia-Segura & Franco, 1996). The structure of this is as follows. Immediately beyond the photoionised region, lies a strongly compressed un-ionised shell. The pressure in this shell matches the sum of the gas pressure and radiation pressure in the ionised region, plus the pressure associated with the recoil momentum of the newly-ionised gas flowing into the photoionised region. Because this un-ionised shell has a much higher pressure than the surrounding undisturbed AGB wind, an expanding shock (assumed isothermal) is located at its outer boundary, such that the ram pressure of the AGB wind being swept up by the shock is equal to the internal pressure of the shell.
The dense shell of un-ionised gas around the strong D-Type ionisation front is Rayleigh-Taylor unstable (Frieman, 1954; Spitzer, 1954). However, even if the shell is accelerating, these instabilities can be stabilised by recombination (Kahn, 1958; Axford, 1964; Williams, 1999), and in this case, the ionisation front may oscillate about its mean instantaneous radius with time (Mizuta et al., 2005). A full 3-D treatment for the specific case of an ionisation front propagating into a density distribution (which is particularly applicable to PNe) has been made by Whalen & Norman (2008). This work shows that fine perturbations or crinkles in the D-Type ionisation front grow, merge and ultimately break out to form “elephant trunks” along with isolated neutral inclusions remaining from the dense shell. It would appear that the “spirograph” appearance of the outermost parts of IC 418 are an early manifestation of this ionisation front instability.
The velocity of the outer shock in the AGB wind can be estimated by combining the angular expansion rate measured by Guzmán et al. (2009) with the HI absorption velocity determined by Taylor & Pottasch (1987). Adopting a distance of kpc derived from the model presented below, and the angular expansion rate of the ionization front in IC 418 from Guzmán et al. (2009) ( mas/yr), gives a shell expansion velocity of 27.4 km/s. However, the H I absorption feature detected by Taylor & Pottasch (1987) is at -13.2 km/s with respect to the systemic velocity. This implies that the outer shock has a velocity equal to the difference between these numbers; km/s. This is strongly supersonic with respect to the cool AGB wind, and such a shock is still capable of producing some optical emission.
5 Details of the Model
5.1 The Photoionised Nebula
To model IC 418, we have used the Mappings V version 5.1.12 code (Sutherland et al. 2017, submitted) 666Available at https://miocene.anu.edu.au/mappings. Earlier versions of this code have been used to construct photoionisation models of H II regions, PNe, Herbig-Haro Objects, supernova remnants and narrow-line regions excited by AGN. This code is the latest version of the Mappings 4.0 code earlier described in (Dopita et al., 2013), and includes many upgrades to both the input atomic physics and the methods of solution.
We choose as the initial abundance set the local galactic concordance (LGC) abundances (Nicholls et al., 2017) based upon the Nieva & Przybilla (2012) data on local galactic main sequence B stars. This provides the abundances of the main coolants, H, He, C, N. O, Ne, Mg, Si and Fe and the ratios of N/O and C/O as a function of abundance. For the light elements we use the Lodders et al. (2009) abundance, while for all other elements the abundances are based upon Scott et al. (2015a); Scott et al. (2015b) and Grevesse et al. (2010). The individual elemental abundances are then iterated from this initial set in order to minimise the offset of the model with respect to the observations for all the lines of any given element.
In the modelling, dust physics is very important. Not only do dust grains remove coolants from the nebular gas, but they are also an important source of photoelectric heating (Dopita & Sutherland, 2000). Furthermore, the pressure of the radiation field is primarily coupled to the dust absorption, and in objects such as IC 418, the effect of competition by dust grains with the gas for the absorption Lyman continuum photons is fierce. IC 418 shows a large depletion of the heavy elements onto dust, as evidenced by the depletion of Ca, Mg, and Fe (see below). This suggests the presence of silicates, since we have no physical mechanism to deplete these elements in the stellar envelope.
The detailed dust physics as currently implemented in the Mappings V code has been described in detail by Dopita et al. (2005). Briefly, this consists of PAHs (not included in the IC 418 model), amorphous carbon and silicate grains. For the latter two categories, we use 80 bins in the size distribution, usually taken as a standard Mathis et al. (1977) distribution. We allow for grain charging, photoelectron emission and grain temperature fluctuations in the computation of the IR emission. An improved version of this dust physics has been implemented by Morisset et al. (2012) for the specific case of IC 418, and these authors succeed in reproducing the IR spectrum of the dust thermal emission. As a consequence, we do not attempt to emulate this work here. For the initial depletion factors we use the Jenkins (2009) scheme, with a base depletion of Fe of 2.25 dex, but these are adjusted by individual element to best fit the observations. We obtain a final dust to gas mass ratio of . The carbon rich nature of the nebula naturally gives rise to a carbon grain dominant dust composition in the models. The dust to gas mass ratio for the carbon grains alone is . This should be compared to the value of derived by Hoare (1990) and Meixner et al. (1996). It should be noted that these works provide a reasonable fit to the cool dust emission, but fail by a factor of 3 or so to explain the hot dust emission seen by Omont et al. (1995) which peaks at m, and which is ascribed by these latter authors as possibly due to MgS.
For the central star, we follow Morisset & Georgiev (2009) in using the CMFGEN model atmospheres from Hillier & Miller (1998). Morisset & Georgiev (2009) used the detailed profiles of the hydrogen absorption lines to constrain the effective gravity of the star () and used the excitation of the nebula to constrain the effective temperature (kK). Here we have iterated the effective temperature to match the observed excitation of the nebula, once the density structure has been fixed to reproduce the density sensitive line ratios, with the exception of [Ar IV] which is produced in the inner photoionised shock produced by the stellar wind. We find kK, somewhat lower than that obtained by Morisset & Georgiev (2009), probably because of the different nebular dust physics used here. As mentioned above, for this nebula the radiation pressure acting mainly on dust produces a strong positive radial density gradient. In our models, at the inner radius of 0.01 pc., the ionisation parameter is and the gas pressure is . As the radiation field is absorbed in the ionised shell, the pressure rises to cm*-3K. As a result, the inner electron density is only cm-3*, but it peaks at cm*-3*. This causes the steep increase in surface brightness empirically modelled by Morisset & Georgiev (2009). This is discussed further below.
Although the nebula is mildly elliptical (outer diameter arc sec. and inner diameter arc sec.), we model it as a spherical shell with filling factor unity. Our model aims to match both the observed mean diameter and the absolute H flux at the assumed distance. Because of the competition of dust for the ionising photons, the method used by Basurah et al. (2016) to estimate the distance does not work. For a given luminosity of the central star, the computed absolute H luminosity hardly changes with distance, because, for smaller assumed distances, the ionisation parameter at the inner radius of the shell rises, and the fraction of ionising photons absorbed by dust rises. However, a solution which matches both the observed mean diameter and the absolute H flux can still be obtained. With this we find and a distance, kpc. At assumed distances of 0.9, 1.0 and 1.1 kpc, the corresponding computed absolute H fluxes are and 34.80. The observed absolute H fluxes corrected for reddening and using these same assumed distances are and 34.87, respectively.
In order to measure the goodness of fit of any particular photoionisation model, we measure the degree to which it reproduces the density-sensitive line ratios, and we also seek to minimise the L1-norm for the fit for the main coolant lines, and for the H and He recombination lines - for a total of 34 lines. That is to say that we measure the modulus of the mean logarithmic difference in flux (relative to H) between the model and the observations viz.;
[TABLE]
This procedure weights fainter lines equally with stronger lines, and is therefore more sensitive to the values of the input parameters of the model. Once a satisfactory best-fit is obtained (), we adjust the abundances of the species which are unimportant in the thermal balance of the nebula, or for species for which only one or two emission lines are observed in the optical.
A detailed description of the photoionisation model fit is deferred until later, in order to also include the shocked zones of the nebular model.
5.2 The inner stellar wind bubble shock
In section 4.1 we estimated that the driving pressure of the shock driven by the X-ray bubble into the photoionised PNe material lies in the range cm*-3K. However, in the previous section, we found that the pre-shock pressure in the photoionised shell is only cm-3K, and the total hydrogen particle density is cm-3*. Adopting cm*-3K, we find that the resultant ram pressure can drive a km/s (Mach number = 3) shock, which heats the immediate post-shock gas to K. As the gas cools, it is compressed, and reaches a computed electron density of cm-3* where it is in equilibrium with the stellar radiation field. The computed equilibrium temperature is K, somewhat higher than the equilibrium temperature in the inner photoionised shell ( K). From the model, the time taken for the shocked gas to reach photoionisation equilibrium is only yr.
The H flux from the shocked shell is only a small fraction of the total luminosity of the PNe. This fraction is roughly proportional to the mean age of the shocked shell. For an assumed age of 100 yr, it only accounts for % of the total H flux. However, this shock contributes appreciably to the [O III] emission, since its [O III] /H ratio is 11.44. The shock contributes even more to the highest excitation lines. For example, the [Ne III]/H ratio in the shocked shell is 0.66, while in the nebula as a whole it is only 0.024. This shock contribution to the high excitation lines is a further reason why we derive a lower effective temperature for the central star than Morisset & Georgiev (2009).
The inner shock should manifest itself as a region of enhanced electron temperature. This is seen clearly in the WiFeS [O III] line ratio map; see Figure 5.
5.3 The outer shock in the AGB wind
The outer shock is a very slow shock proceeding into a medium with a low degree of ionisation. As such, it bears some resemblance to the Herbig-Haro shocks modelled by Dopita & Sutherland (2017, in press). Such shocks produce much enhanced [O I] and [N I] emission, and also enhanced [S II] emission. We model the shock with a velocity of 14 km/s, derived from the arguments presented in Section 4.3. The post-shock pressure is , which, with this shock velocity implies a pre-shock density of cm*-3*, at a fractional ionisation of a few percent.
The resulting shock is very feeble in its optical emission, accounting to only about 1.0% of the H emission of the photoionised shell. However, the computed [N I] /H ratio is high, about 0.6, as is the [O I] /H ratio; . As a consequence, the shock provides more than 50% of the total flux of these lines in the model. This accounts for the shortfall in [N I] and [O I] noted by the authors in the pure photoionisation model of Morisset & Georgiev (2009).
5.4 Overall Structure of Model
The overall structure of the resulting model is shown in Figure 6, where we show the run of temperature and electron density as a function of radius. The inner shocked and photoionised shell is very thin with the post-shock temperature excursion appearing almost as a delta function. The steep rise in electron density though the main nebula is very evident, although the density variations are more subtle. The outer boundary of the [O III] –emitting zone is marked by small discontinuities in both temperature and density. The boundary of the Strömgren sphere is marked by a sharp drop in temperature and electron density. The outer shock produces a spike in both temperature and electron density.
InTable 4 we show the relative contributions of the inner and outer shocks to the total line fluxes of some key lines. These lines are the most sensitive to the presence of the shocks. The change in relative intensity for the model with and without shocks is at most a factor of two.
6 Results of the model
6.1 Emission Line Intensities
Our model provides predictions for a total of 154 emission lines in the optical spectrum of IC 418. For the permitted lines of heavy elements, the model only accounts for the recombination contribution to the line. As Escalante et al. (2012) demonstrated, the intensity of most of these lines are dominated by fluorescence. We have therefore used the ratio of fluorescence to recombination computed by these authors to correct our predictions for these lines. In Table 5 we present the list of modelled emission lines with their predicted fluxes relative to H, the measured de-reddened line intensities and errors, as well as the de-reddened line intensities given by Sharpee et al. (2003) from their échelle observations. The lines marked with an asterix (*) have been corrected for the fluorescent process.
Overall the fit of the model with the observations is very good, with most of the predicted line strengths falling within % of the observed value. Strong lines which are poorly modelled are [Ne III] (% low) and [S III] (overestimated by a factor of two – but this line is very sensitive to the electron temperature). The [Fe II]/[Fe III] ratios are poorly reproduced – but this ratio is very sensitive to the adopted charge-exchange reaction rates.
In Figure 7 we show the fit of the model versus the observations. Perfect agreement is represented by the central solid line, while the lines on each size represent a difference of % in the relative flux.
It is of interest to compare our measured line intensities with those given by Sharpee et al. (2003). These observations were made at much higher resolution than ours, and the integration times were much longer, which facilitates the detection of fainter lines. Against this, however, is the notorious difficulty of flux calibrating échelle data due to the strong variation in grating efficiency as one goes off-blaze in each order. Furthermore, the Sharpee et al. (2003) data covers only a portion of the nebula, which could cause problems associated with sampling the excitation structure of the nebula.
In Figure 8 we compare our own de-reddened data with the de-reddened fluxes given by Sharpee et al. (2003) for the same lines we used in the model fit. Perfect agreement is represented by the thick solid line, while the thinner lines on each size represent a difference of %. The agreement between these two independent data sets is remarkable, and bears testament to the both the quality of the observations and data reduction procedures. Furthermore, it is clear that the observing strategy of Sharpee et al. (2003) enabled them to obtain a good approximation to the integral spectrum of the nebula.
6.2 The Nebular Continuum
The fit of the measured (de-reddened) nebular continuum (black points) with the theoretical (continuum + emission line) spectrum of the PNe (blue line) is shown in Figure 9. It is clear that the theoretical continuum provides a good description of the observations except in the region Å. This difference is due to either mis-measurement of the underlying continuum in the presence of many faint overlapping lines – many lines are fit with a fixed width in this wavelength region – or else scattering of the stellar UV by dust in and around the nebula. The size of both the Paschen and Balmer jumps are well simulated, as is the overall slope of the continuum, indicating that the mean nebular temperature characterising the model is close to that prevailing in the nebula itself.
6.3 Chemical Abundances
The abundances derived in the model are listed in Table 6. Here we give separately the messured gas phase abundances, and the implied total abundances using the dust depletion pattern for the local interstellar medium from Jenkins (2009) for a base depletion of -2.25. Clearly, we do not expect the dust in IC 418 to share this depletion pattern, so the total (Gas + Dust) abundances given in the table should be treated as indicative only. Table 6 also compares our results with the gas phase abundances derived by Morisset & Georgiev (2009). This paper also presents the comparison with earlier work. Considering that we are using an independent data set, different analysis techniques, and different modelling codes, we find that the mutual agreement for the important coolants is very good, generally better than 0.1 dex.
As described above, we have used the Nebular Empirical Abundance Tool (NEAT; Wesson et al. (2012) to derive the electron temperature and density from the low and medium-ionization zones. In Table 6, we also present the elemental abundances of nitrogen, oxygen, neon, argon, sulfur, and chlorine that determined from collisionally excited lines (CELs) and those of hydrogen, helium, carbon derived from optical recombination lines (ORLs). The ionization correction factors of Delgado-Inglada et al. (2014) were used to correct for unseen ions. The chemical abundances are found to be in agreement with that of Delgado-Inglada et al. (2015) and Pottasch et al. (2004). However, in general, the chemical abundances are generally systematically lower than those derived by the detailed modelling presented here, and those derived in a similar manner by Morisset & Georgiev (2009). This illustrates once again the perennial problem of differences between –derived abundances, and those delivered by detailed photoionisation modelling. Abundances delivered by ICF calibration are systematically lower than those used in the photoionisation models. This is mainly caused by regions of higher than average temperature over-weighting temperature-sensitive lines such as [O III] . The ICFs do not seem to be playing a major role, since the computed ICFs agree are in broad agreement with the photoionisation model (for OI:OII:OII we have the ratios 0.024 : 0.490 : 0.486 from the ICFs given by NEAT, while the ionic column densities from the model are in the ratio 0.018 : 0.496 : 0.486. At least part of the disagreement between the two techniques is due to real temperature gradients we have demonstrated to exist in IC 418 (c.f. Figure 5). These large-scale temperature gradients play a role analogous to the smaller-scale temperature fluctuations first introduced by Peimbert (1967) and used by very many others since, e.g. Esteban et al. (2002); García-Rojas & Esteban (2007); Peña-Guerrero et al. (2012). In particular, Kingdon & Ferland (1995) has attempted to reproduce temperature fluctuations in the context of temperature variations produced in detailed phototionisation models.
The fluorescent corrections given by Escalante et al. (2012) work rather well to remove the abundance discrepancy, which is often inferred to exist in other PNe, between the permitted and the forbidden lines. In Figure 10 we show the comparison of the model predictions for the forbidden lines (filled circles) and the fluorescent - corrected “recombination” lines of N II and O II (open circles). The error bars refer to the line measurement errors only.
6.4 Comparison with the UV and IR spectrum
Although we have not specifically modelled the UV and IR spectrum of IC 418, nonetheless it is of interest to see how well the model performs in reproducing the de-reddened UV and IR line intensities given by Pottasch et al. (2004) and by Liu et al. (2001), who used the LWS on the ISO observatory to measure the longer wavelength (43-198m) lines. The comparison between the model and these observations is given in Table 7. Overall, for the IR lines, the fit is satisfactory – with the exception of [O I] and [C II] lines the L1-norm is 0.12. For the UV lines (with their larger and more uncertain reddening corrections) the L1-norm is 0.17. All the oxygen lines fit the observations very closely.
As Liu et al. (2001) point out, IC 418 is blessed with an exceptionally strong photo-dissociation region (PDR) which provides a large contribution to the observed intensity of the [O I]) and [C II] lines. However, since the MAPPINGS code does no include a molecular formation/destruction chemical matrix, but only deals with atomic phases, we cannot model the temperature, density and molecular / ion balance in PDRs with any accuracy. Any prediction of the [O I] and [C II] lines would therefore be completely unreliable. This is clear from Table 7. All we can do with reasonable accuracy is to compute the dust temperature distribution in these regions.
The 35.81m [Si II] line is the only line of this element observed, and this has been used to determine the Si abundance shown in Table 7, although this line might be dominated by the contribution of emission from the PDR. The Mg abundance was obtained from only one line in the optical spectrum, so it is pleasing to see how well the modelled Mg II 2798Å line matches the observations. The carbon lines provide a useful further constraint on the abundance estimated from the [C I] line, and from the four CII permitted lines which are observed in the optical.
6.5 Surface Brightness Distribution
As described above, the radiation pressure induces a steep density gradient in the ionised plasma, which leads to an increase in the projected surface brightness with radius. In addition, the inner shock contributes appreciably to the H surface brightness. On the basis of our idealised spherical model, we have computed the surface brightness as a function of radius. This is shown in Figure 11.
This surface brightness distribution can be compared with that shown by Morisset & Georgiev (2009). The inner shock appears sharper here because it is represented by a smooth spherical shock, rather than the more filamentary structure seen in the HST data.
7 Discussion & Conclusions
We have presented a physical model for IC 418 which provides a good description of the emission line spectrum, while at the same time matching the density sensitive line ratios, the inferred absolute H flux and the observed angular diameter of the nebula. From the photoionisation model we estimate a distance of kpc, slightly less than the value usually adopted. This result is due to the strong competition of dust for the ionising photons in a nebula in which radiation pressure exceeds the static gas pressure. The absorption of the UV radiation field leads to steeply increasing pressure and density with nebular radius.
We estimate the stellar parameters to be K, and . From the hydrogen-burning Vassiliadis & Wood (1994) evolutionary tracks, we find that this corresponds to an initial stellar mass of . This derived mass of the parent star is consistent with the mass range () reported by Delgado-Inglada et al. (2015) for the PNe which give rise to carbon-rich dust (see the introduction). Interpolating the hydrogen-burning Vassiliadis & Wood (1994) evolutionary tracks, we also find that the star has had only yr since it passed through an effective temperature of , which can be taken effectively as the time since the nebula first became ionised. Very similar results are obtained if we use the more recent models of Miller Bertolami (2016). For , the precursor would have had an initial mass of , while for , the estimated initial mass rises to . In both cases the transition time from an effective temperature K is yr.
Integrating the density throughout the nebula in the model, we find that the total mass inside the ionised nebula out to where hydrogen is less than 1% ionised is . Since the nebula is composed of the gas ejected during the last gasp of the AGB stellar evolution, this mass represents the integrated mass loss over the last 2350 yr, using the outer radius of cm, and taking the velocity of the AGB wind to be 13.2 km/s from Taylor & Pottasch (1987). From the previous paragraph, we can infer that the time that the central star actually spent on the AGB during this period was only 2270 yr, which implies a mean AGB mass-loss rate of /yr. This is entirely consistent with recent mass-loss rates inferred directly from the 1612 MHz circum-stellar OH maser emission for a large sample of AGB stars by Goldman et al. (2017).
The age of the nebula can also be inferred from the properties of the central mass-loss bubble. Currently, according to the model, the shock in the nebular gas is propagating at km/s. The radius of the shocked [O III] - bright bubble is pc. Using the theory of such bubbles (Dyson & de Vries, 1972; Weaver et al., 1977), we derive an age of 150 yr for the mass-loss bubble, which agrees well with the age inferred above from stellar evolutionary considerations (100–180 yr).
Based upon the stellar wind velocity derived from the X-ray temperature of the hot inner bubble ( km/s), and the pressure in the hot bubble equated to the ram pressure driving the mass-loss bubble shock in the nebular gas ( cm*-3K), and assuming that the free wind region from the central star is terminated at 60% of the radius of the inner mass-loss bubble, we infer that the current mass loss rate from the central star is yr-1*, which agrees well with that obtained by Morisset & Georgiev (2009) on the basis of the absorption line profiles of the central star (yr*-1*).
The ionised structure appears to be very young; 150–200 yr. This presents something of a problem, since the sound-crossing timescale of the current ionised structure is yr, yet the internal density distribution has already been set up as a radiation-dominated nebula. This would seem to indicate that the radiation-pressure dominated profile is actually set up during the transition from the tip of the AGB to the point where the central star started to produce ionising photons. According to the Miller Bertolami (2016) models cited above, for , this transition time is yr, while for , it is yr. Both of these are comparable with the inferred sound crossing timescale.
In conclusion, we have obtained a high-quality integral field spectrum of IC 418, and have built a self-consistent model for the nebula which includes both the effects of the inner mass-loss bubble, and the outer shock in the AGB wind. Consequently we have been able to derive reliable abundances for 14 elements, which agree well with the earlier careful modelling by Morisset & Georgiev (2009). In addition, our measured line fluxes relative to H agree very closely, typically within 10%, with those of Sharpee et al. (2003), despite the differences in the instruments used, the area over which the spectrum is integrated and the differences in both the reduction and calibration procedures. IC 418 is both dusty and carbon-rich, and its central star appears to have been a fairly massive carbon star with an initial mass in the range and an AGB mass-loss rate of /yr before it made its excursion across the HR Diagram to become a PNe central star with mass-loss rate of /yr.
Acknowledgements
The authors wish to thank the referee, Christophe Morisset for his physical insights, and his careful and constructive critique, which has appreciable improved the paper. M.D. and R.S. acknowledge the support of the Australian Research Council (ARC) through Discovery project DP130103925.
The reference list from the paper itself. Each links out to its DOI / PubMed record.
- 1Acker et al. (1992) Acker A., Marcout J., Ochsenbein F., Stenholm B., Tylenda R., Schohn C., 1992, The Strasbourg-ESO Catalogue of Galactic Planetary Nebulae. Parts I, II.. European Southern Observatory, Garching (Germany), 1992, 1047 p., ISBN 3-923524-41-2,
- 2Ali et al. (2015) Ali A., Amer M. A., Dopita M. A., Vogt F. P. A., Basurah H. M., 2015, A&A , 583, A 83 · doi ↗
- 3Ali et al. (2016) Ali A., Dopita M. A., Basurah H. M., Amer M. A., Alsulami R., Alruhaili A., 2016, MNRAS , 462, 1393 · doi ↗
- 4Axford (1964) Axford W. I., 1964, Ap J , 140, 112 · doi ↗
- 5Basurah et al. (2016) Basurah H. M., Ali A., Dopita M. A., Alsulami R., Amer M. A., Alruhaili A., 2016, MNRAS , · doi ↗
- 6Capriotti & Daub (1960) Capriotti E. R., Daub C. T., 1960, Ap J , 132, 677 · doi ↗
- 7Carrasco et al. (1983) Carrasco L., Serrano A., Costero R., 1983, Rev. Mex. Astron. Astrofis., 8, 187
- 8Childress et al. (2014) Childress M. J., Vogt F. P. A., Nielsen J., Sharp R. G., 2014, Ap&SS , 349, 617 · doi ↗