ALMA Images of the Orion Hot Core at 349 GHz
M.C.H. Wright, R.L. Plambeck

TL;DR
This paper presents high-resolution ALMA images of the Orion Hot Core at 349 GHz, revealing complex filamentary structures, outflows, and a molecular ring, suggesting shock heating from outflows and explosions.
Contribution
First high-resolution ALMA imaging of the Orion Hot Core at 349 GHz, unveiling detailed filamentary structures, outflows, and a molecular ring, advancing understanding of hot core dynamics.
Findings
Filamentary structures trace SiO outflows from Source I.
Detection of a molecular ring ~600 AU in diameter.
Evidence of shock heating from outflows and explosions.
Abstract
We present ALMA images of the dust and molecular line emission in the Orion Hot Core at 349 GHz. At 0.2" angular resolution the images reveal multiple clumps in an arc ~ 1" east of Orion Source I, the protostar at the center of the Kleinmann-Low Nebula, and another chain of peaks from IRc7 towards the southwest. The molecular line images show narrow filamentary structures at velocities > 10 km/s away from the heavily resolved ambient cloud velocity ~5 km/s. Many of these filaments trace the SiO outflow from Source I, and lie along the edges of the dust emission. Molecular line emission at excitation temperatures 300--2000 K, and velocities > 10 km/s from the ambient cloud, suggest that the Hot Core may be heated in shocks by the outflow from Source I or from the BN/Source I explosion. The spectral line observations also reveal a remarkable molecular ring, ~ 2" south of Source I, with a…
Click any figure to enlarge with its caption.
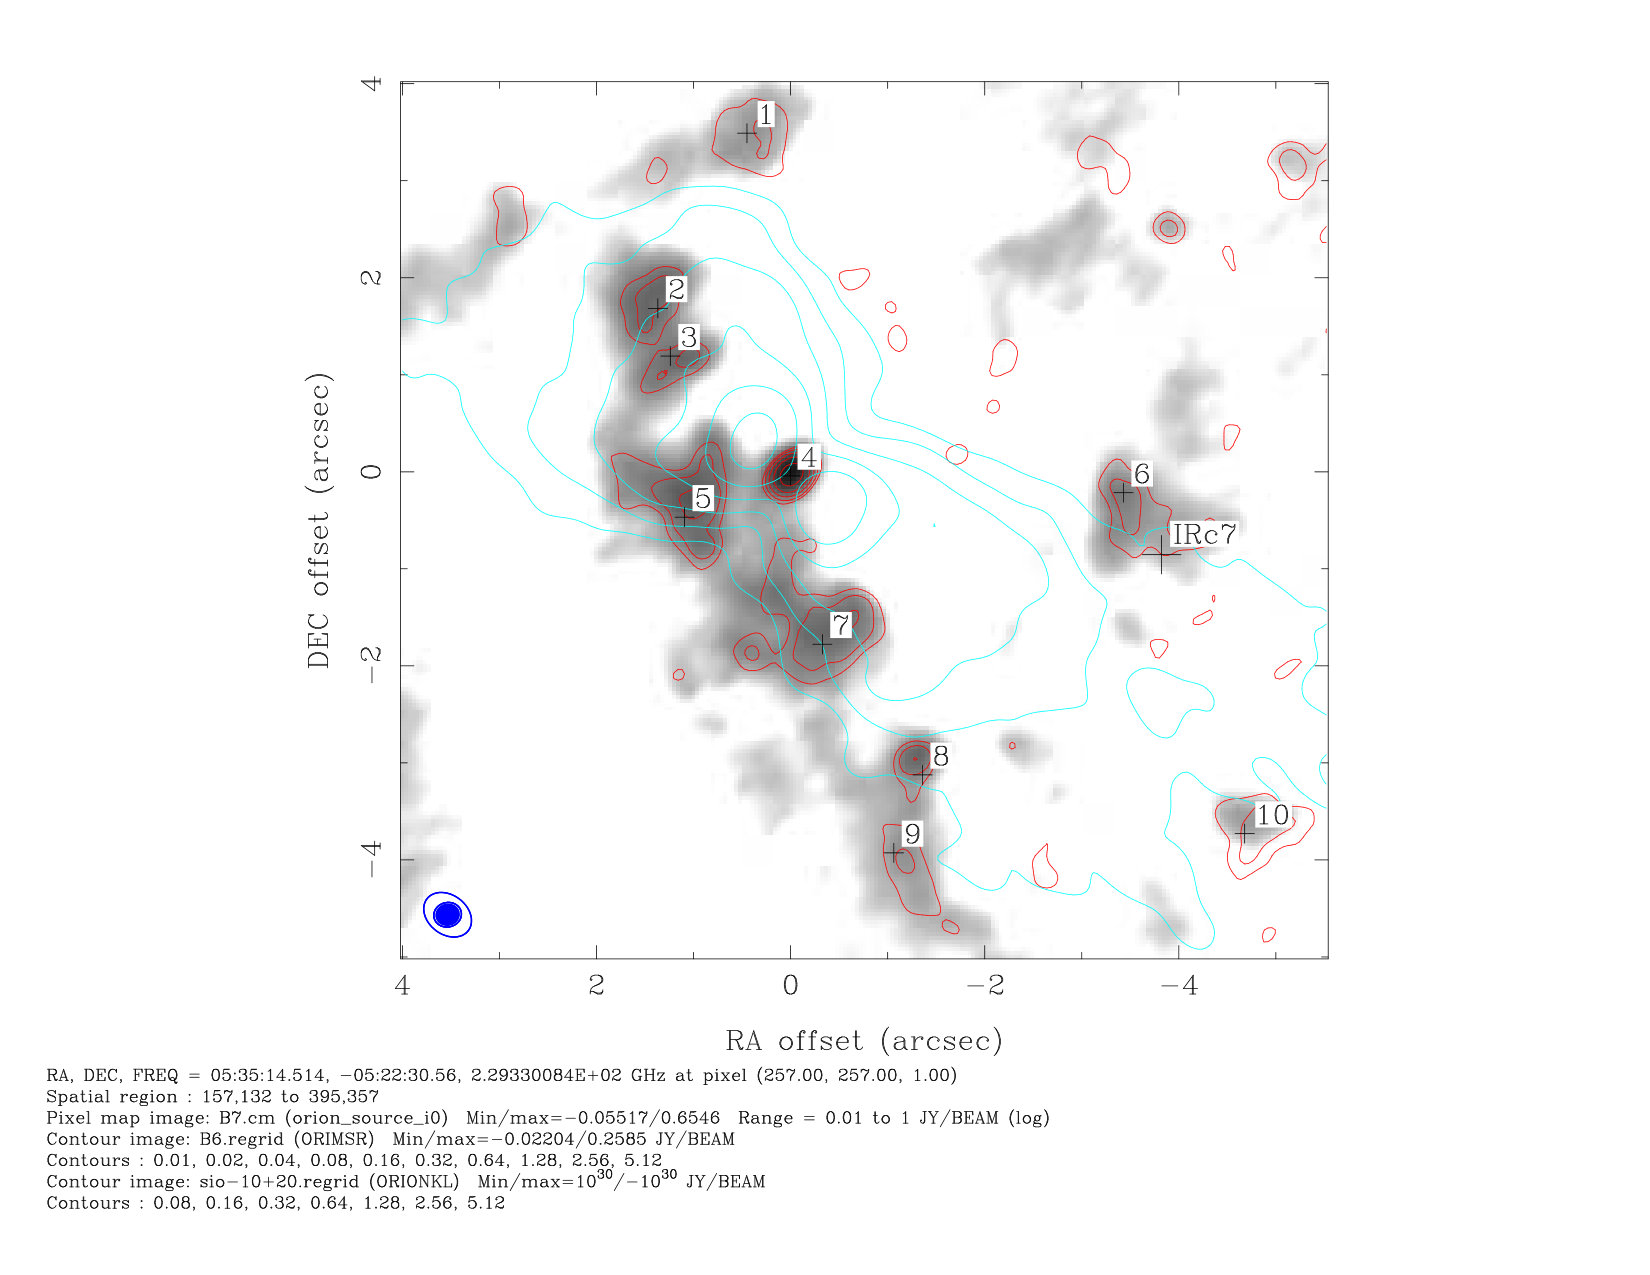 Figure 1
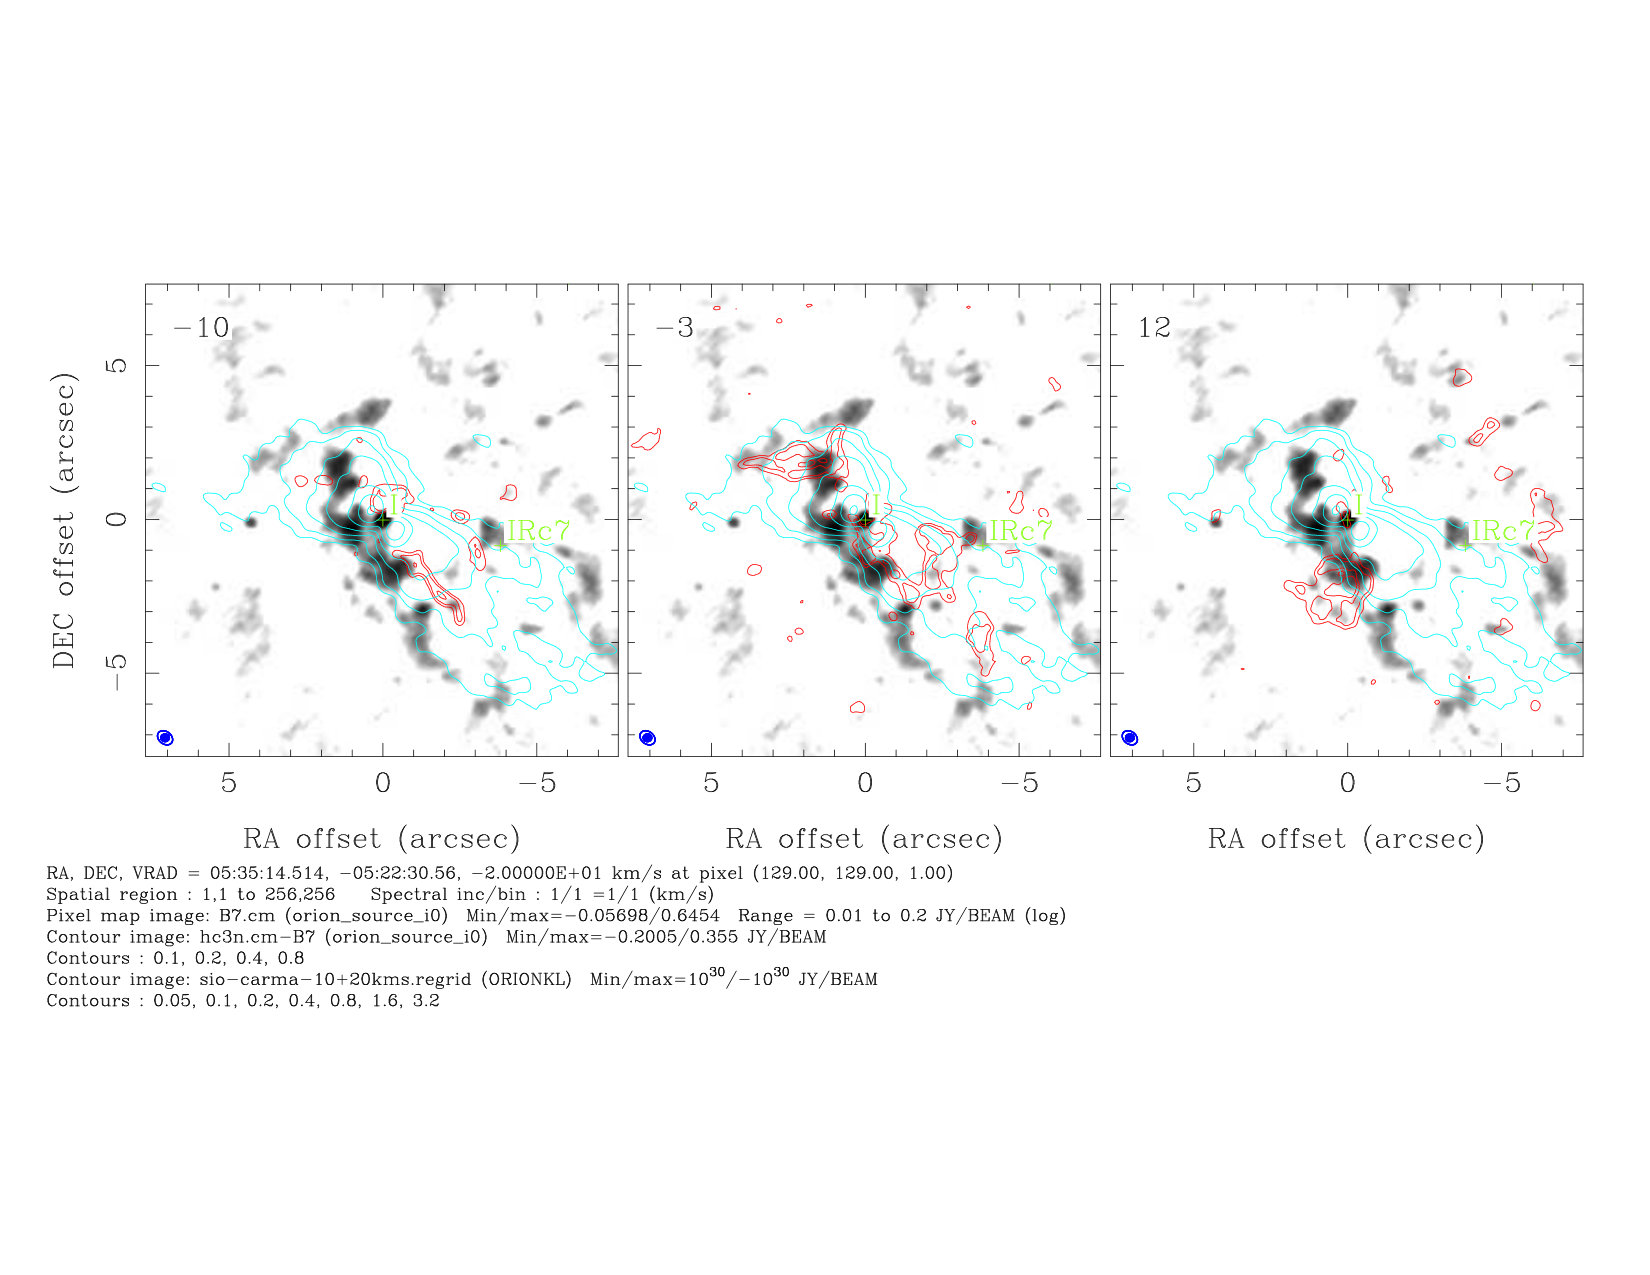 Figure 2
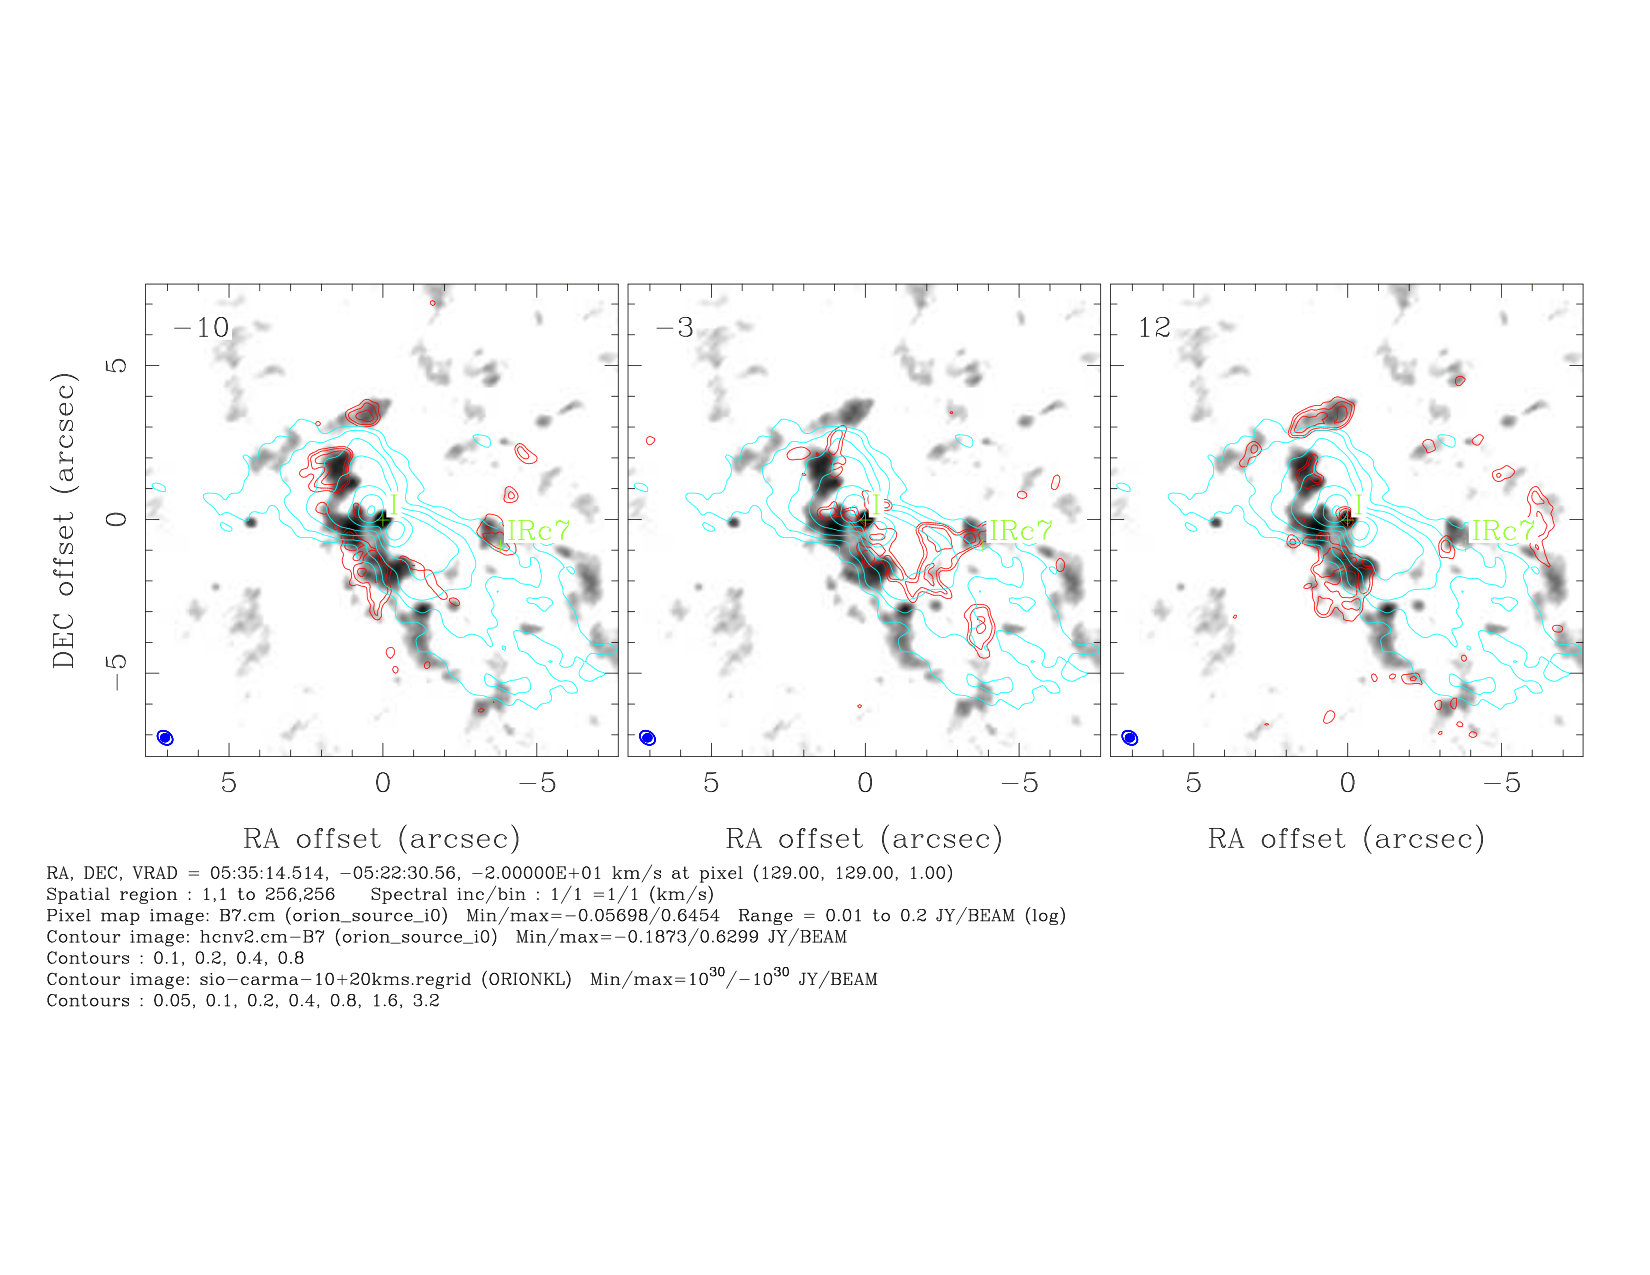 Figure 3
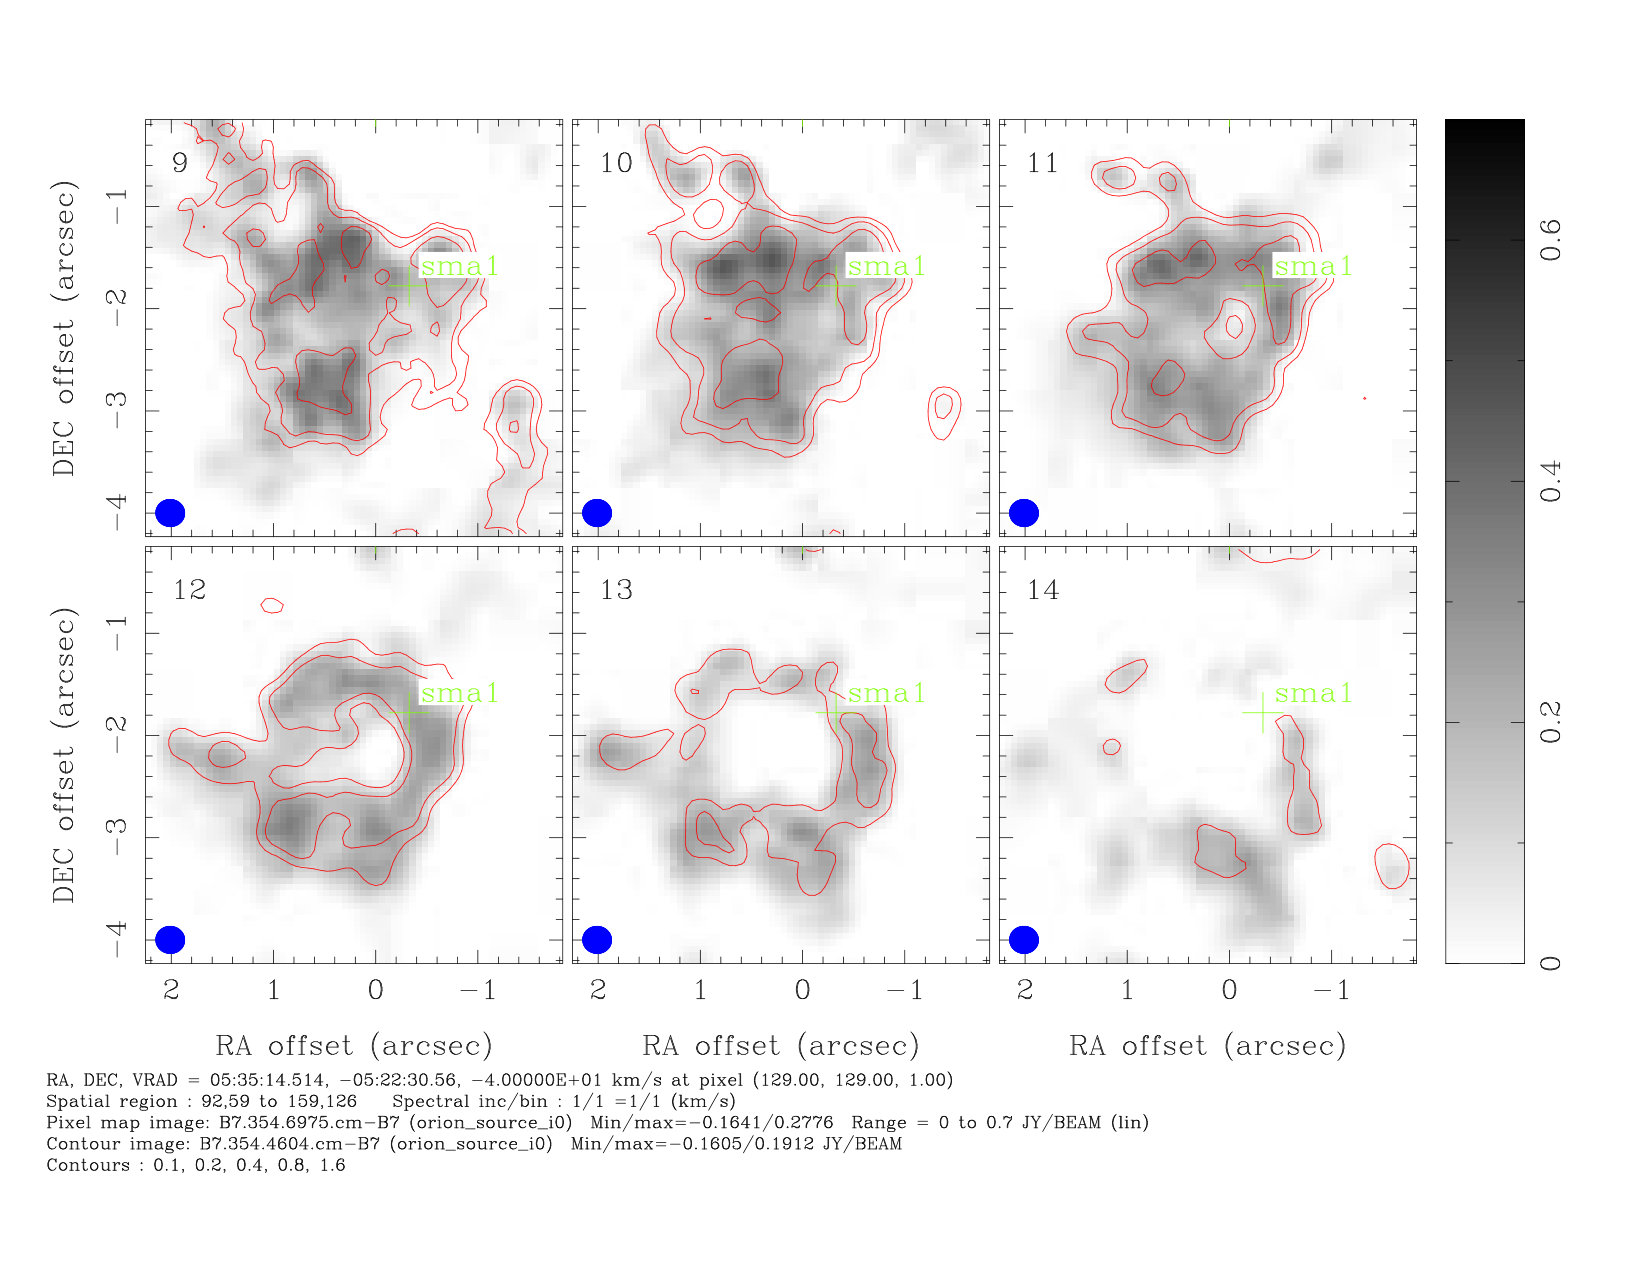 Figure 4
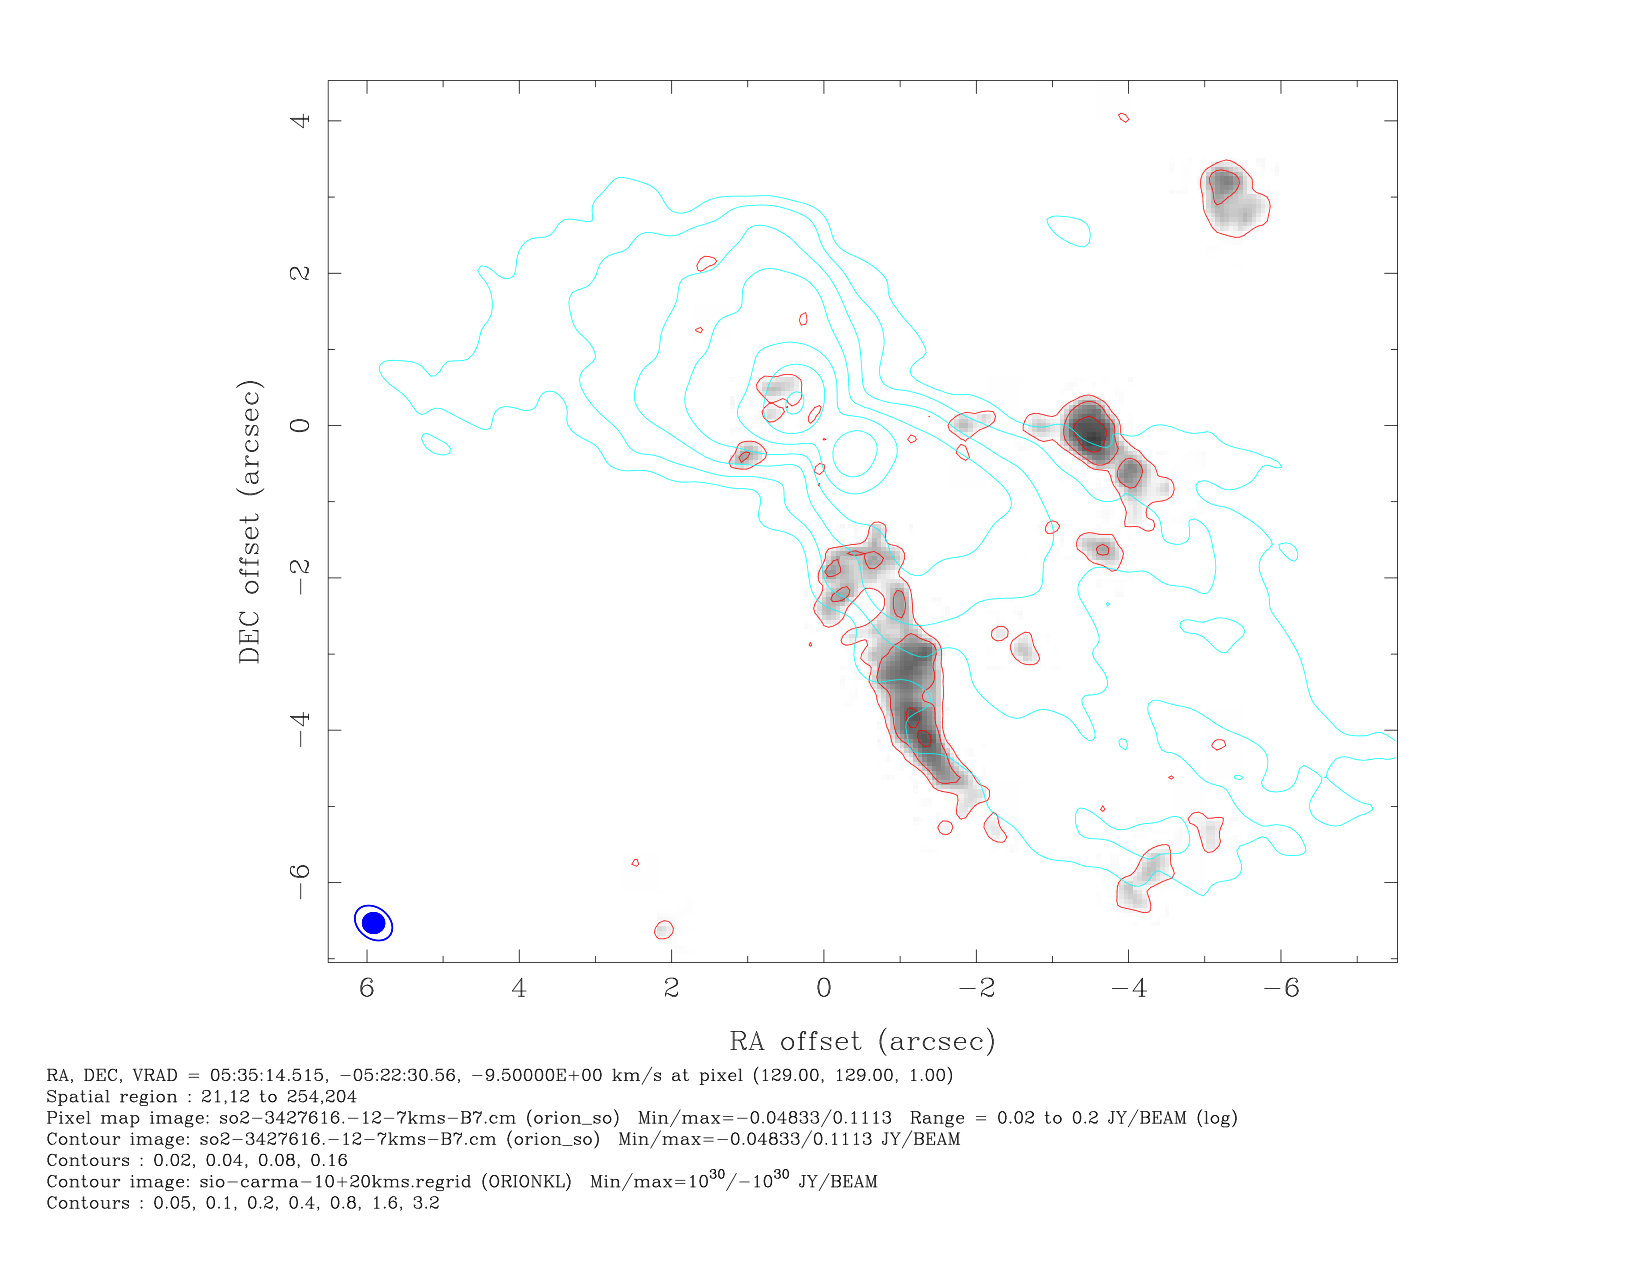 Figure 5
| freq | molecule | EU |
|---|---|---|
| 340.7142 | SO | 81 |
| 340.8387 | 33SO | 87 |
| 355.0455 | SO2 | 111 |
| 355.1865 | SO2 | 180 |
| 356.0406 | SO2 | 230 |
| 341.2755 | SO2 | 369 |
| 342.7616 | SO2 | 582 |
| 341.6740 | SO2 | 679 |
| 341.4031 | SO2 | 808 |
| 354.8000 | SO2 v2=1 | 928 |
| 342.4359 | SO2 v2=1 | 1041 |
| 343.9237 | SO2 v2=1 | 1058 |
| 341.3233 | SO2 | 1412 |
| 341.5594 | SO v=1 | 1686 |
| 354.6975 | HC3N | 341 |
| 354.4604 | HCN v2=1 | 1067 |
| 356.2556 | HCN v2=1 | 1067 |
Peer Reviews
No public reviews on file for this paper yet. If you reviewed it on a platform where reviews are public (OpenReview, ICLR, NeurIPS, ICML), you can paste yours below so the community can read it here.
Videos
No videos yet. Explain this paper in a talk, walkthrough, or lecture? Add one.
ALMA Images of the Orion Hot Core at 349 GHz
M. C. H. Wright, R. L. Plambeck
Radio Astronomy Laboratory, University of California, Berkeley, CA 94720, USA
Abstract
We present ALMA images of the dust and molecular line emission in the Orion Hot Core at 349 GHz. At 0.2″ angular resolution the images reveal multiple clumps in an arc 1″ east of Orion Source I, the protostar at the center of the Kleinmann-Low Nebula, and another chain of peaks from IRc7 towards the southwest. The molecular line images show narrow filamentary structures at velocities away from the heavily resolved ambient cloud velocity . Many of these filaments trace the SiO outflow from Source I, and lie along the edges of the dust emission. Molecular line emission at excitation temperatures 300–2000 K, and velocities from the ambient cloud, suggest that the Hot Core may be heated in shocks by the outflow from Source I or from the BN/SrcI explosion. The spectral line observations also reveal a remarkable molecular ring, south of SrcI, with a diameter 600 AU. The ring is seen in high excitation transitions of HC3N, HCN v2=1, and SO2. An impact of ejecta from the BN/SrcI explosion with a dense dust clump could result in the observed ring of shocked material.
Subject headings:
ISM: individual(Orion-KL) — radio continuum: stars — radio lines: stars — stars: formation — stars: individual (Hot Core)
††slugcomment: submitted
1. INTRODUCTION
The Kleinmann-Low (KL) Nebula in Orion, at a distance of 415 pc (Menten et al., 2007; Kim et al., 2008), is the closest region in which high mass stars (M ) are forming. The two most massive stars in the region, the Becklin-Neugebauer Object (BN) and radio Source I (hereafter, “SrcI”) appear to be recoiling from one another at 40 , argued to be the result of a dynamic interaction between them 500 years ago that also launched an explosive outflow of at least 8 of material with velocities of 10 to 100 (Gómez et al., 2008; Zapata et al., 2009; Goddi et al., 2011b; Bally et al., 2011, 2017). SiO emission also traces a lower velocity outflow from SrcI that extends 1000 AU into the surrounding medium along a NE-SW axis (Plambeck et al., 2009; Matthews et al., 2010; Greenhill et al., 2013), roughly perpendicular to SrcI’s proper motion.
Observations at many wavelengths, from cm to IR, reveal a dense Hot Core 10″ in diameter adjacent to SrcI. The Hot Core does not appear to be internally heated; no known protostars are embedded within it. Goddi et al. (2011a) mapped the Hot Core in 7 NH3 lines with energy levels up to 1500 K, and suggest that it is heated by the outflow from ScrI and by the impact of SrcI’s proper motion towards it.
In this paper, we present 349 GHz, 0.2″ resolution ALMA images of the dust and molecular line emission from the Hot Core, comparing these with CARMA images of the 229 GHz dust emission and the 86 GHz SiO v=0 outflow (Plambeck et al., 2013, 2009). These data suggest that both shocks from the SrcI outflow and ejecta from the BN/SrcI explosion play a role in heating the Hot Core.
2. OBSERVATIONS AND DATA REDUCTION
The ALMA observations at 349 GHz, made in 2014 July, were designed to image the continuum emission from SrcI, but were obtained in spectral line mode so that line free portions of the spectrum could be identified. Details of the ALMA observations are given in Plambeck & Wright (2016) Table 1. Spectral line data were obtained with MHz channels in 2 polarizations in each of 4 spectral windows.
The visibility data were calibrated using ALMA-supplied scripts and the CASA software package. The calibrated CASA measurement sets then were written out in FITS format and imported into Miriad. All further processing was done with Miriad, which took about 10% of the time required by CASA.
As described in Plambeck & Wright (2016), the data were then self calibrated using continuum images generated from the line-free spectral channels. The antenna-based phase corrections were derived only from visibilities with projected baselines greater than 250 k in order to avoid confusion from extended emission. These images were dominated by emission from SrcI at the center. Visibilities measured on shorter spacings sample low spatial frequency Fourier components of the source brightness distribution, primarily thermal dust emission from large scale structures like the Orion Hot Core.
3. CONTINUUM IMAGES
The channel-averaged visibilities for the 4 separate ALMA spectral windows were combined using multifrequency synthesis to avoid bandwidth smearing at the edge of the images. The image was deconvolved using the CLEAN algorithm. Uncertainties in the fluxes are dominated by the absolute calibration uncertainties of % for Band 7, as given by the ALMA Cycle 1 Technical Handbook.
We compare the ALMA 349 GHz continuum image with a CARMA 229 GHz image with similar angular resolution. The 229 GHz data were obtained in the CARMA A- and B-configurations in 2009 and 2011. The 229 GHz calibration is described in Plambeck et al. (2013). The uv-coverage of the 229 and 349 GHz data is shown in Plambeck & Wright (2016), Figure 2.
Figure 1 displays 349 GHz and 229 GHz continuum images that were generated from the self-calibrated data using all baselines 40 k, with robust=0.5 weighting.
There is good agreement between the 229 and 349 GHz emission, even though the uv-coverage is quite different between these 2 radio telescope arrays. Although our data do not fully sample the short spacings, the images at 349 and 229 GHz reveal a series of clumps of emission from the Hot Core in an arc 1″ east of SrcI, and another chain of peaks to the west, near the infrared source IRc7. These images are in good agreement with those presented by Hirota et al. (2015). The compact sources identified by Hirota et al. (2015) are marked by crosses in Figure 1.
Also shown in Figure 1 is the CARMA image of the 86 GHz SiO line in the ground vibrational state (Plambeck et al., 2009), which traces the bipolar outflow from SrcI. The Hot Core continuum peaks lie along the SE edge of the outflow, whilst IRc7 and several other continuum peaks trace the W boundary of the outflow.
4. SPECTRAL LINES
Spectral line images were generated from the self-calibrated visibility data using all baselines k and robust=0.5 weighting. We made spectral line images for each of the 4 spectral windows; 4 3840 channels in total. A multitude of molecular lines are evident in the spectra. Plambeck & Wright (2016) show the spectra at the position of SrcI, and present tables of the strongest spectral lines. Sulfur- and silicon-rich molecules such as SiO, SO, SO2, SiS, and H2S are particularly prominent toward SrcI. Examination of a wider field reveals a very confused picture with deep sidelobes resulting from the poorly sampled large scale structures in molecular line emission from the ambient molecular cloud. However, away from the ambient cloud velocity many of the spectral lines show narrow filamentary structures which appear to trace the dust clumps and the edges of the SiO outflow from SrcI.
We made spectral line images at 1 resolution in the velocity range -40 to +40 to image stuctures associated with the Orion Hot Core. Spectral features which are relatively clear of confusing structure from other spectral lines are listed in Table 1. In Figure 2 we show emission in the HC3N and HCN v=2 transitions at 354.6975 and 356.2556 GHz in 1 channels at velocities -10, -3, and +12 superposed on the SiO v=0 outflow.
5. DISCUSSION
The images in Figures 1 and 2 provide important clues to the interaction of the outflow from SrcI with the ambient molecular cloud, and to heating of the Hot Core. Dust emission seems to trace the periphery of the SiO outflow. The Hot Core peaks lie along an arc east of SrcI where the SiO emission drops off steeply (note the log contours). Other ridges of dust emission are found along the NE, SE, and SW boundaries of the outflow. These observations suggest that the dust emission originates from the walls of a cavity formed by the outflow.
The HC3N and HCN v=2 molecular transitions shown in Figure 2 have upper state energy levels of 341 and 1067 K. Often the peak molecular emission is offset slightly from the dust clumps, suggesting that the molecular gas may be heated by the interaction of the outflow from SrcI with these clumps. Many SO and SO2 spectral lines with EU from 180 to 1058 K also trace the boundaries of the outflow. The clearest example of this is shown in Figure 3 where we show the SO2 line at 342.7616 GHz averaged over LSR velocities -12 to -7 , overlayed on the the SiO image.
Goddi et al. (2011a) imaged the Hot Core in NH3 transitions with upper energy levels 408 to 1456 K. Their observations show that the hottest gas lies in a ridge to the SE of SrcI. They suggest that the Hot Core may be heated in C-type shocks driven by the outflow from SrcI, and by the proper motion of SrcI to the SE at 12 . Peng et al. (2017) imaged the Hot Core in 64 transitions of HC3N and 13C isotopologues. Their images of vibrationally excited HC3N lines also show that the excitation peaks lie along the edge of the SiO outflow adjacent to the Hot Core. Both of these studies argue for an external source of heating for the Hot Core. Although some of the continuum peaks could contain embedded stars or protostars, spectral energy distributions for most of them suggest masses of only 0.02 to 0.2 (Hirota et al., 2015). Other observations in the radio and infrared find no evidence for excitation peaks within the Hot Core (Menten & Reid, 1995; Greenhill et al., 2004). Together, these observations suggest that the outflow from SrcI may be heating the Hot Core and a shell of material tracing the boundaries of the SiO outflow.
5.1. Energetics
SrcI is the dominant source of luminosity in KL. At mm wavelengths SrcI appears to be an optically thick dust disk with radius and temperature 500-700 K (Plambeck & Wright, 2016; Hirota et al., 2016). A 100 AU diameter disk with temperature 700 K has a luminosity of . The Hot Core is a clumpy structure with diameter and a dust temperature K, optically thick in the far infrared. Modeling it as a spherical black body with AU radius, its luminosity is (0.4-2) . Thus, it appears that SrcI is capable of heating the Hot Core to its observed temperature.
Thermal excitation in 100-150 K gas does not, however, easily account for the high excitation (E K) HCN and SO2 transitions in Figures 2 and 3, or the HC3N and NH3 lines imaged by Peng et al. (2017) and Goddi et al. (2011a). Goddi et al. (2011a) suggest that the Hot Core is heated by shocks from the impact of the outflow from ScrI and its proper motion towards dense clumps in the Hot Core. The prominent abundance of SO and SO2 transitions also is indicative of shock chemistry. Models of C-type shocks with velocites 5-40 can enhance SO and SO2 abundance by 2 orders of magnitude in the shock and extensively in the post shocked gas (Pineau des Forets et al., 1993).
We now consider whether the mechanical luminosity of the SrcI outflow is sufficient to account for these shock-excited transitions. Wright et al. (1995) estimate the mass outflow from the J=2-1, v=0 SiO outflow y*-1*. A similar value () was obtained for the SiO J=1-0 v=1 masers by Greenhill et al. (2013). With a velocity 18 , the outflow luminosity is of order 1 . Assuming isotropic radiation and a velocity width of 20 , the luminosity of the high excitation HCN and SO2 lines in Figures 2 and 3 is 1-10 . Hundreds, or perhaps thousands, of such lines are emitted by the Hot Core. Although it appears that the outflow does have sufficient mechanical luminosity to power these lines, a rather high conversion efficiency would be required.
5.2. Co-moving gas with SrcI
The explosive outflow associated with the dynamic interaction of BN and SrcI may also play a role in heating the Hot Core. Several studies suggest that the BN/KL outflow traced by fast moving CO and H2 bullets is associated with a wide angle outflow of 5–10 of gas with velocities \sim 20~{}$$\rm km~{}s^{-1} and may have a common origin in a dynamic interaction which ejected BN to the NW and SrcI to the SE years ago (Gómez et al., 2008; Zapata et al., 2009; Goddi et al., 2011b; Bally et al., 2011, 2017). The kinetic energy of the BN/KL outflow is estimated as (Snell et al., 1984) to erg (Kwan & Scoville, 1976). The \sim 20~{}$$\rm km~{}s^{-1} outflow and the fast moving bullets appear to be blocked by the Hot Core (Chernin & Wright, 1996; Zapata et al., 2011).
The impact of this outflow on the Hot Core may also be responsible for shock heating of high excitation molecules (Zapata et al., 2011; Goddi et al., 2011a). Zapata et al. (2011) note that the high excitation lines HC3N 37-36 v7=1 and CH3OH appear to form a shell around the Hot Core peaks, as is also observed for HC3N and HCN in our ALMA observations. It may be possible to identify the origin of the molecular material: apparently oxygen-rich material (SiO, H2O, OH, SO, SO2), from the SrcI outflow, and NH3, HC3N, HCN, CH3CN, etc. from the Hot Core.
If the motion of SrcI is accompanied by co-moving gas, this helps to explain why the SiO outflow from SrcI is not swept back by its motion though the ambient gas. Magnetic support has been invoked to explain the collimation of the SrcI outflow into a straight bipolar flow (e.g., Greenhill et al., 2013; Vaidya & Goddi, 2013), and millimeter wavelength polarization observations (Tsuboi et al., 1996; Plambeck et al., 2003) suggest a polarization parallel to the SrcI outflow, but the field strength is as yet undetermined, and it is not clear if magnetic fields control the direction of the outflow, or vice versa.
Any original disk around SrcI was stripped off in the BN/SrcI encounter (Bally et al., 2017). Co-moving gas also helps re-formation of a disk around SrcI through Bondi-Hoyle, B-H, accretion. The B-H radius . The accretion rate so and B-H accretion could re-form a disk around SrcI if the relative velocity of SrcI w.r.t. the ambient gas is only a few . For example, with a relative velocity of 2 through an ambient density cm*-3*, SrcI could accrete a disk mass , consistent with an estimated 0.02 - 0.2 for the dusty disk model in (Plambeck & Wright, 2016).
5.3. Molecular Ring
Figure 4 shows a molecular ring, south of SrcI and centered at RA = 05:35:14.535 DEC= -05:22:32.7 in HC3N at 354.6975 GHz and HCN v=2 at 354.4606 GHz in 1 channels at velocities from 9 to 14 . The ring presents an almost complete shell with a diameter in position angle -30 to -50 . The shell width decreases from 10 to 14 with a velocity gradient across the minor axis in PA . The ring can also be seen in the SO and SO2 lines listed in Table 1 with EU from 180 to 678 K. It is not apparent in the lower excitation SO2 lines where the emission may be optically thick, or in the higher excitation lines with E800 K. The high energy levels suggest shock excitation, perhaps from high velocity ejecta from the BN/SrcI explosion. A rotating, expanding shell model is possible. There is no evidence for the red-shifted cap of the ring at velocities 14 , but this could have been dispersed by shear motions of the outflow from SrcI. An expansion velocity 2 with a ring radius 300 AU gives a dynamical age 700 yr; a rotation velocity 2 gives an equilibrium mass 0.2 . If the ring resulted from an impact on a dust clump with ejecta from the BN/SrcI explosion 500 years ago then the ring has been decelerated by swept up material. C-type shocks with velocities as low as 10 can completely remove the grain mantles and produce gas kinetic temperatures to 500 K (Flower & Pineau des Forets, 1994). Some of the compact features in the Hot Core identified by Hirota et al. (2015) might be ejecta from the BN/SrcI explosion. We did not detect any continuum emission at the center of the ring in any of the observations reported here. The dust source SMA1, Hirota source number 7, is at the edge of the ring as shown in Figure 4.
6. SUMMARY
The Orion Hot Core was imaged with ALMA at 349 GHz with 02 angular resolution. Our observations offer support for a model where the Hot Core is heated by shocks produced by the outflow from SrcI and from the BN/KL explosive event. A measurement of the proper motion of the most compact features in the Hot Core clumps w.r.t. SrcI, if technically feasible, could reveal whether the Hot Core itself is party to the expansion resulting from the BN/SrcI encounter.
We would like to thank an anonymous referee for helpful comments which have improved this paper. This paper makes use of the following ALMA data: ADS/JAO.ALMA#2012.1.00123.S. ALMA is a partnership of ESO (representing its member states), NSF (USA) and NINS (Japan), together with NRC (Canada) and NSC and ASIAA (Taiwan), in cooperation with the Republic of Chile. The Joint ALMA Observatory is operated by ESO, AUI/NRAO and NAOJ. The National Radio Astronomy Observatory is a facility of the National Science Foundation operated under cooperative agreement by Associated Universities, Inc.” Support for CARMA construction was derived from the states of California, Illinois, and Maryland, the James S. McDonnell Foundation, the Gordon and Betty Moore Foundation, the Kenneth T. and Eileen L. Norris Foundation, the University of Chicago, the Associates of the California Institute of Technology, and the National Science Foundation. Facilities: CARMA, ALMA.
The reference list from the paper itself. Each links out to its DOI / PubMed record.
- 1Bally et al. (2011) Bally, J., Cunningham, N. J., Moeckel, N., et al. 2011, Ap J, 727, 113
- 2Bally et al. (2017) Bally, J., Ginsburg, A., Arce, H., et al. 2017, Ap J, 837, 60
- 3Chernin & Wright (1996) Chernin, L. M., & Wright, M. C. H. 1996, Ap J, 467, 676
- 4Flower & Pineau des Forets (1994) Flower, D. R., & Pineau des Forets, G. 1994, MNRAS, 268, 724
- 5Goddi et al. (2011 a) Goddi, C., Greenhill, L. J., Humphreys, E. M. L., Chandler, C. J., & Matthews, L. D. 2011 a, Ap J, 739, L 13
- 6Goddi et al. (2011 b) Goddi, C., Humphreys, E. M. L., Greenhill, L. J., Chandler, C. J., & Matthews, L. D. 2011 b, Ap J, 728, 15
- 7Gómez et al. (2008) Gómez, L., Rodríguez, L. F., Loinard, L., et al. 2008, Ap J, 685, 333
- 8Greenhill et al. (2004) Greenhill, L. J., Gezari, D. Y., Danchi, W. C., et al. 2004, Ap J, 605, L 57