Characterization of the warm--hot intergalactic medium near the Coma cluster through high--resolution spectroscopy of X Comae
M. Bonamente, J. Ahoranta, E. Tilton, E. Tempel, A. Morandi

TL;DR
This study investigates the warm-hot intergalactic medium near the Coma cluster using high-resolution X-ray spectroscopy, finding constraints on its properties and questioning the reality of some absorption features.
Contribution
It provides new constraints on the density and extent of the warm-hot intergalactic medium near Coma using combined emission and absorption data.
Findings
Possible Ne IX absorption line detected but with limited significance.
Upper limits on O VII and O VIII absorption lines set constraints.
The warm-hot medium near Coma is consistent with expected properties.
Abstract
We have analyzed all available archival XMM-Newton observations of X Comae, a bright X-ray quasar behind the Coma cluster, to study the properties of the warm-hot intergalactic medium in the vicinity of the nearest massive galaxy cluster. The RGS observations confirm the possible presence of a Ne IX K-alpha absorption line at the redshift of Coma, although with a limited statistical significance. This analysis is therefore in line with the earlier analysis by Takei et al. (2007) based on a sub-set of these data. Its large column density and optical depth, however, point to implausible conditions for the absorbing medium, thereby casting serious doubts to its reality. Chandra has never observed X Comae and therefore cannot provide additional information on this source. We combine upper limits to the presence of other X-ray absorption lines (notably from O VII and O VIII) at the redshift…
Click any figure to enlarge with its caption.
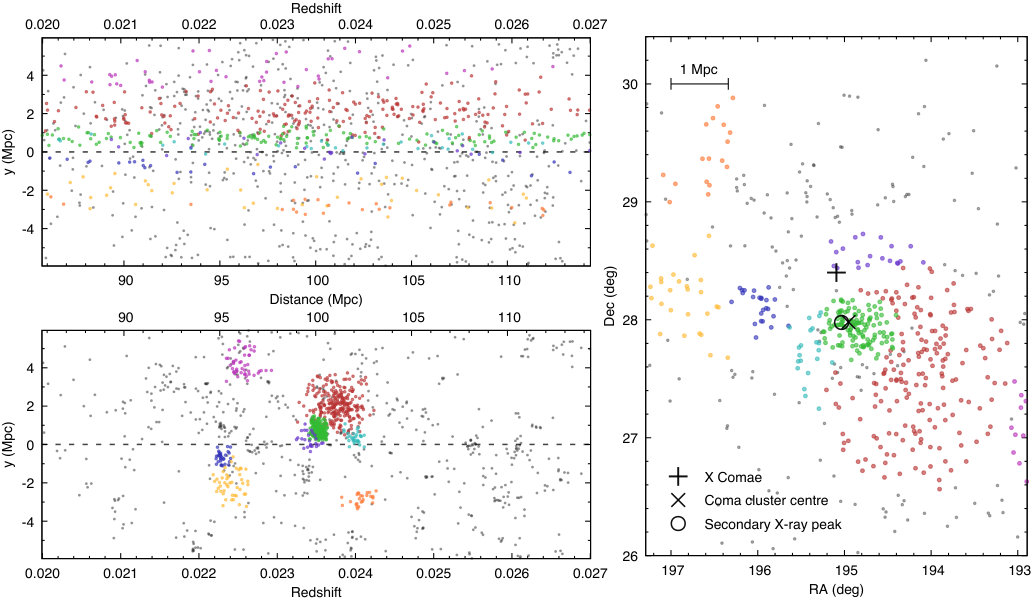 Figure 1
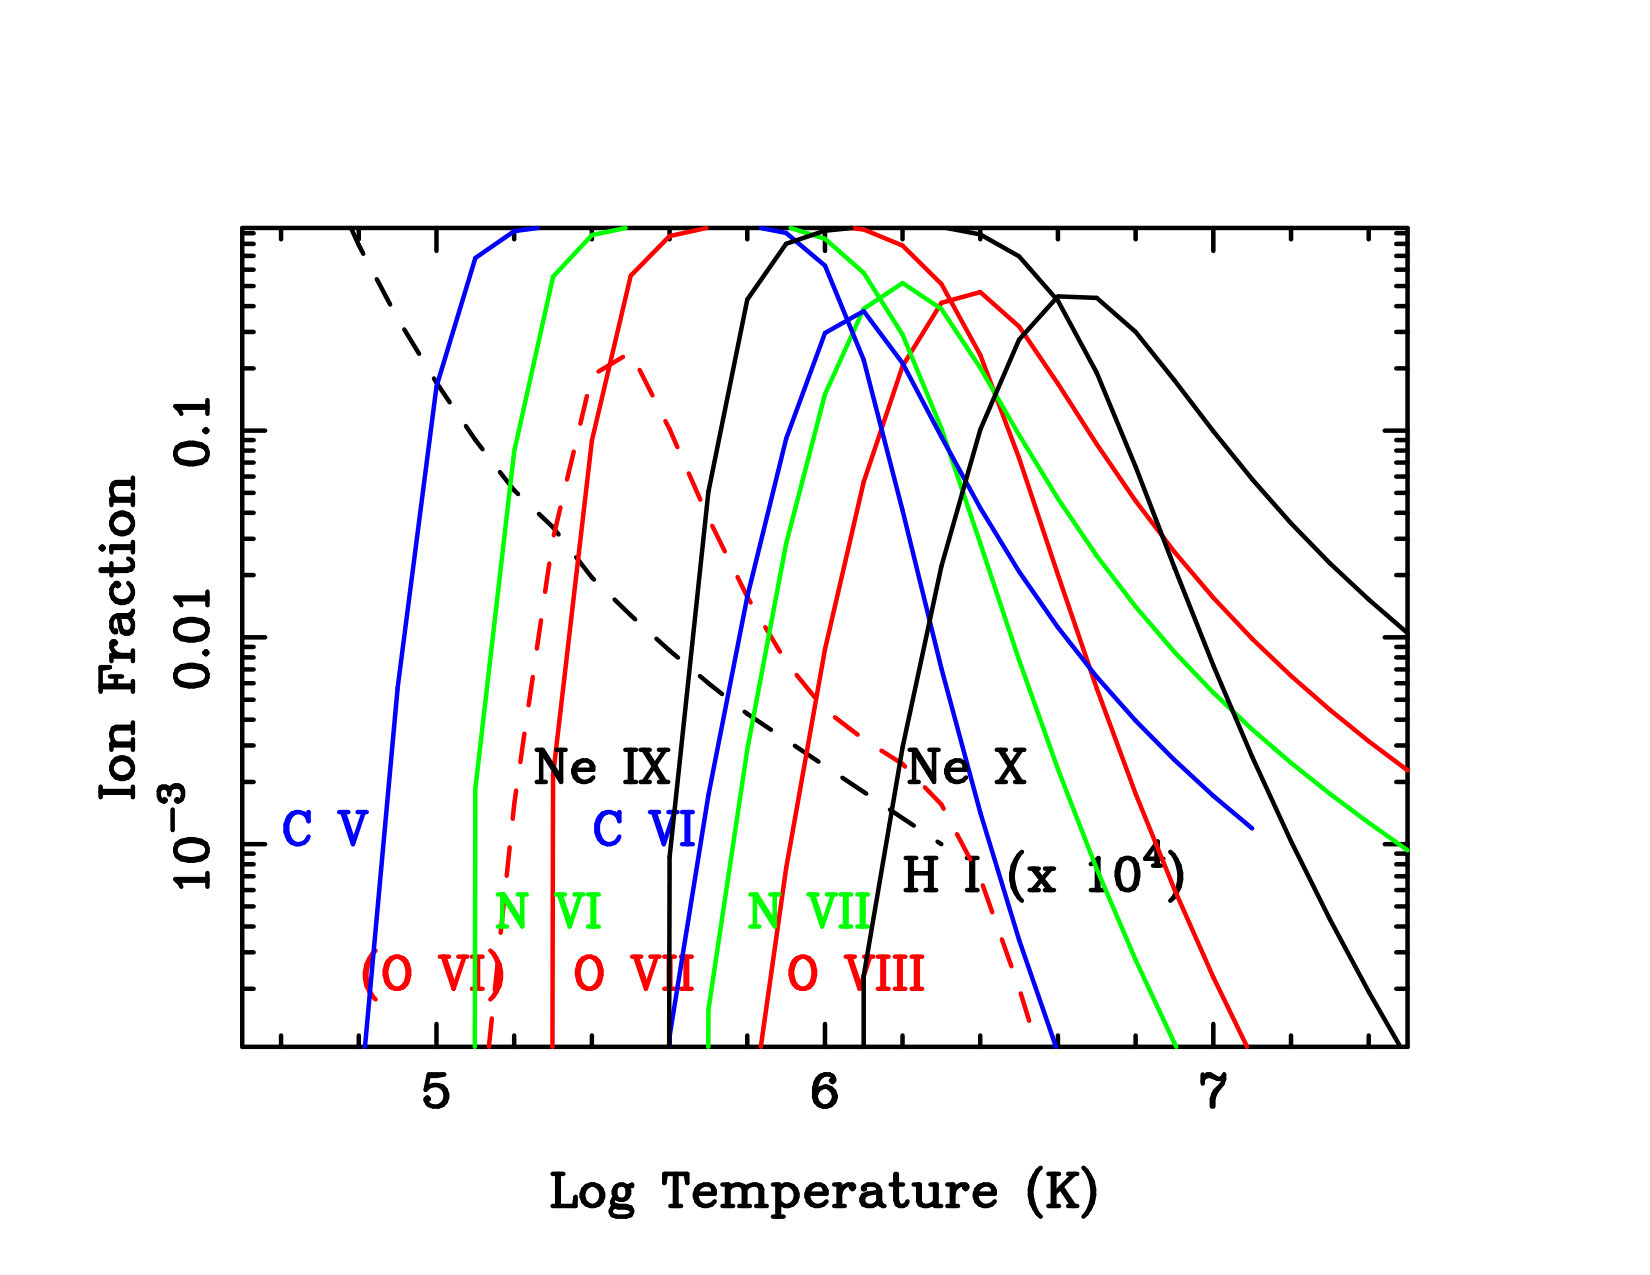 Figure 2
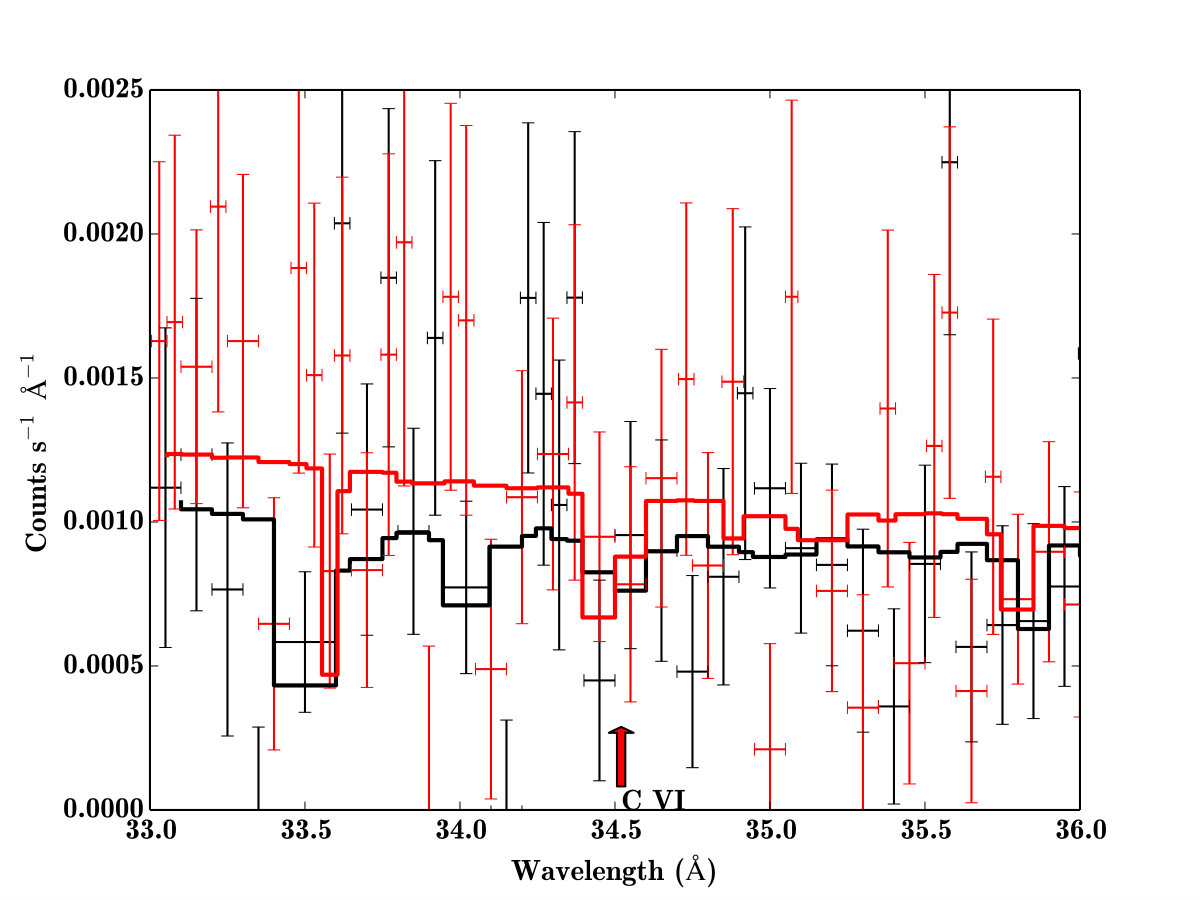 Figure 3
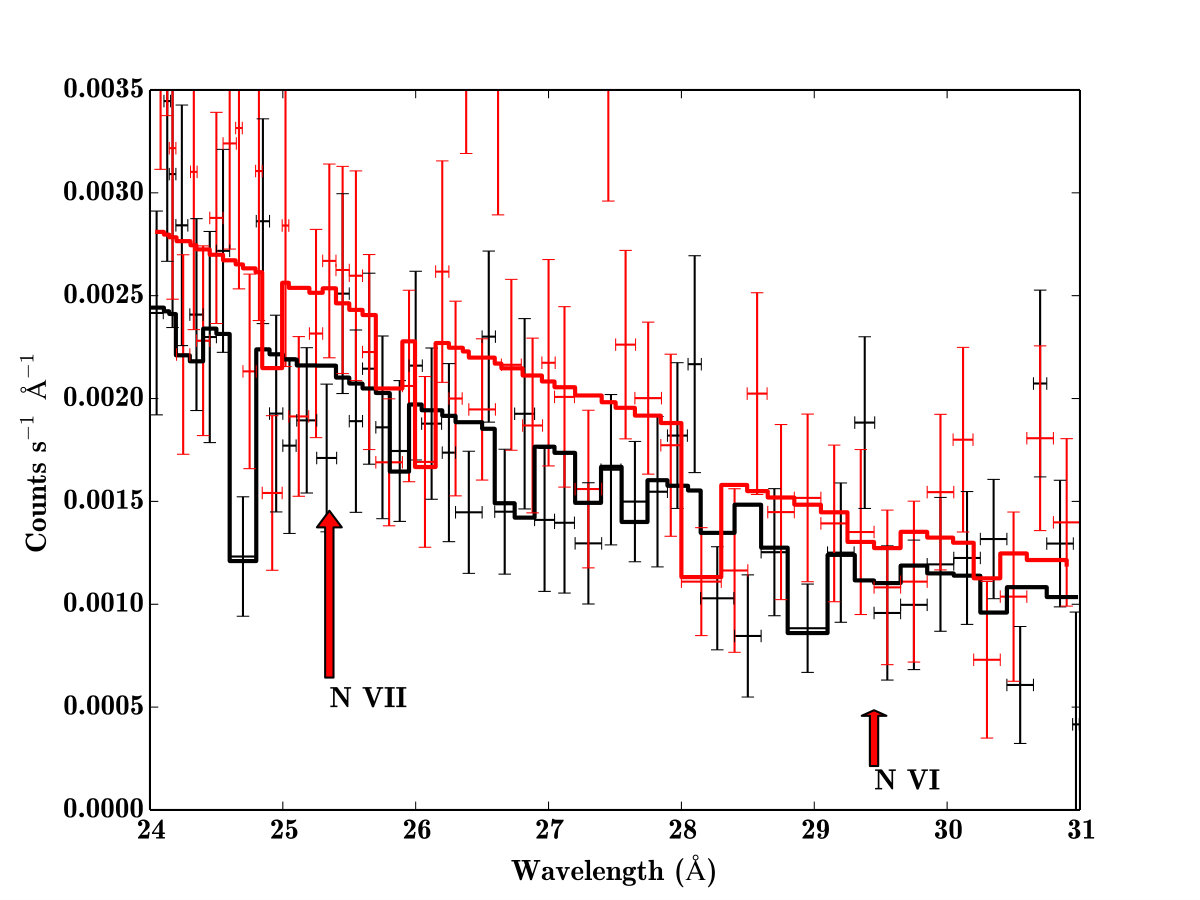 Figure 4
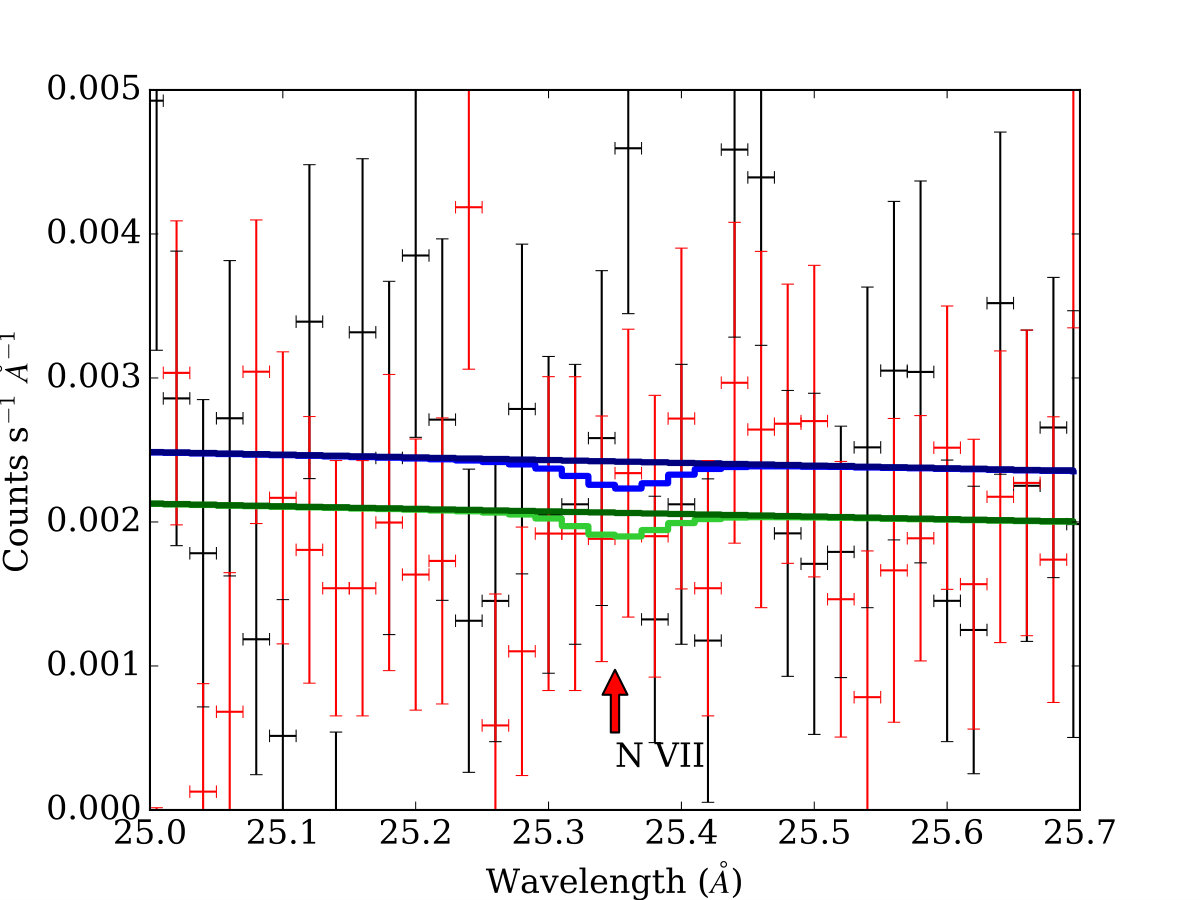 Figure 5
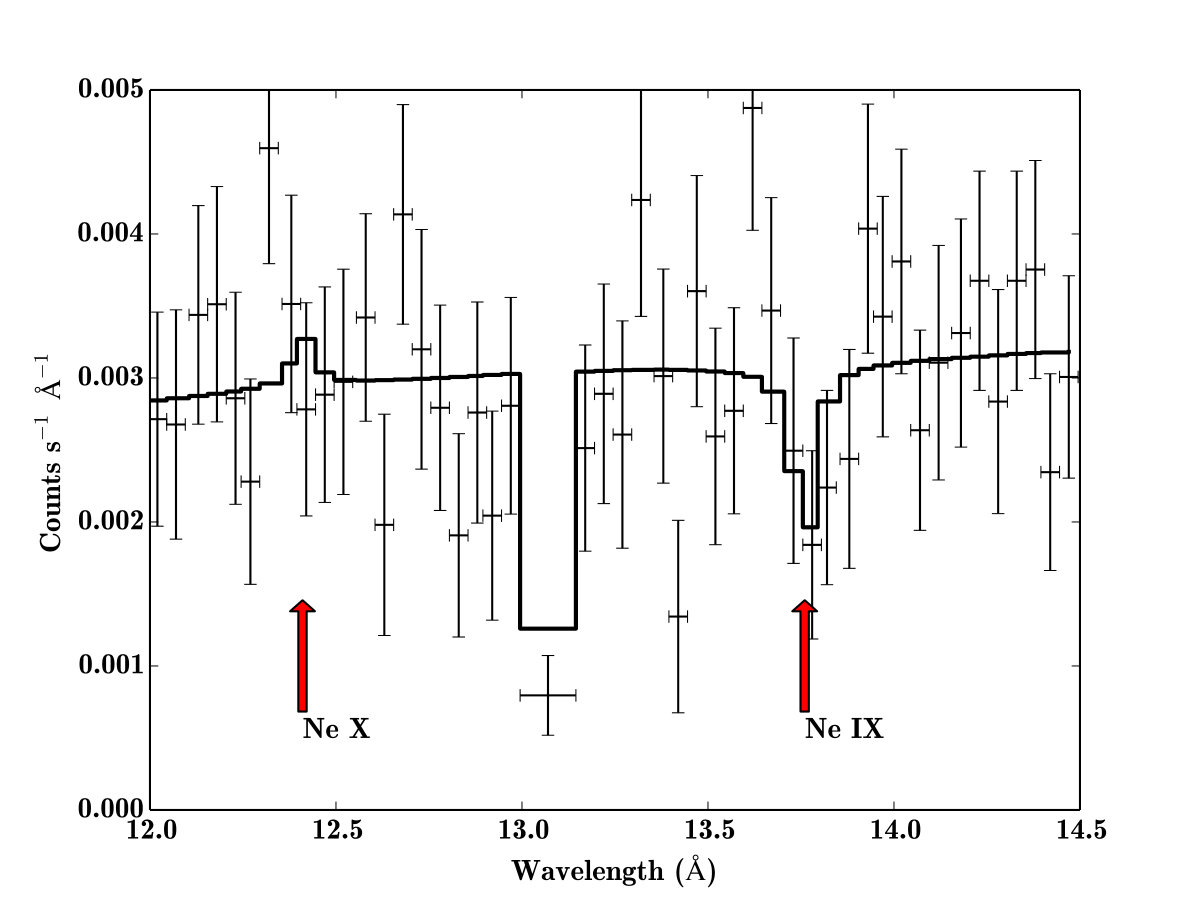 Figure 6
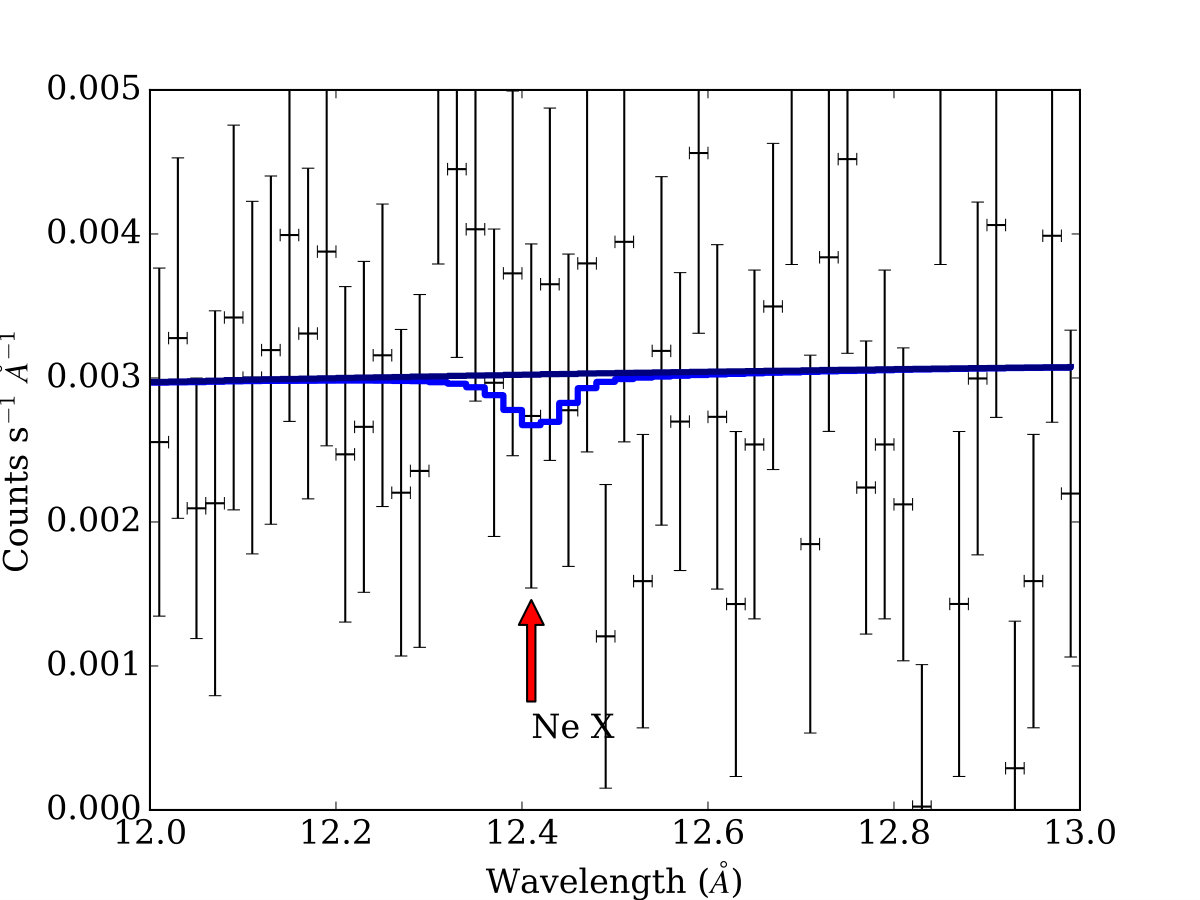 Figure 7
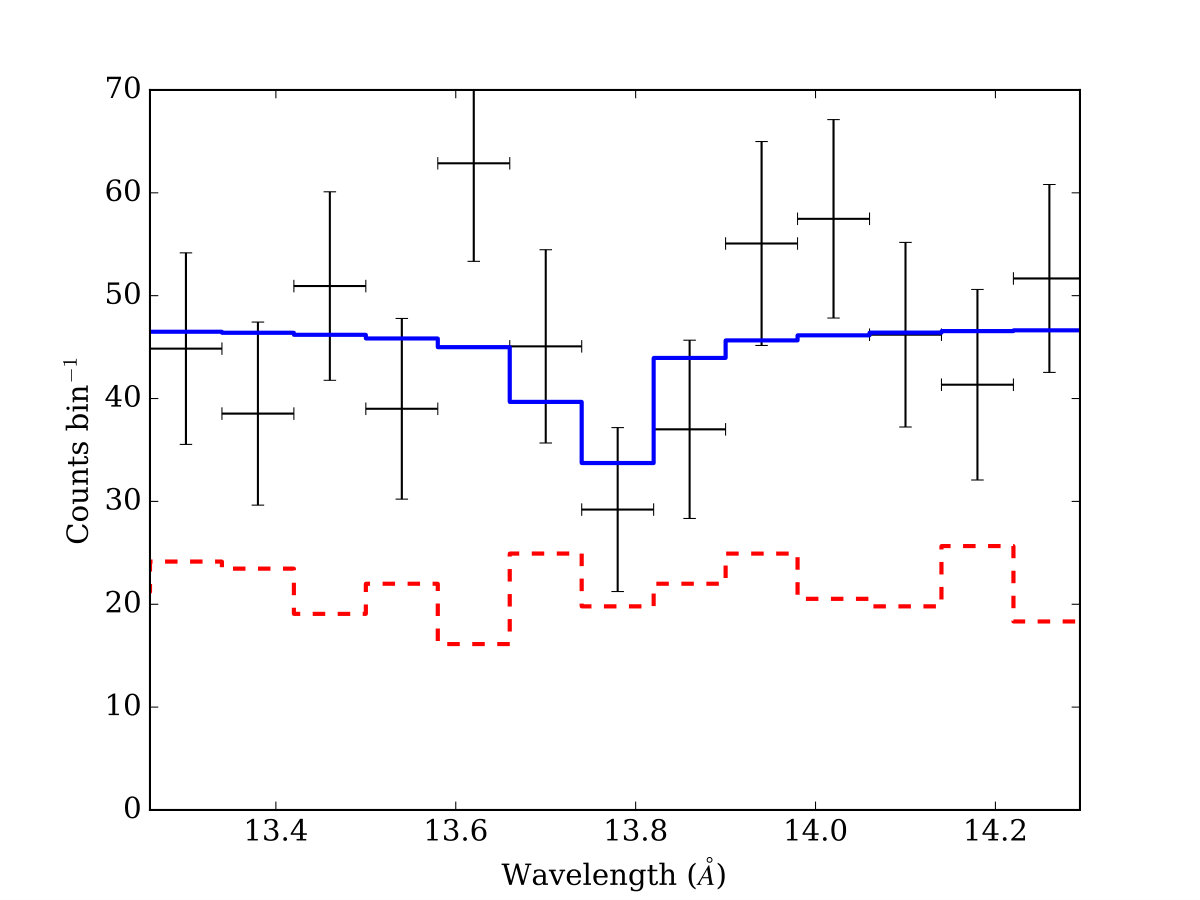 Figure 8
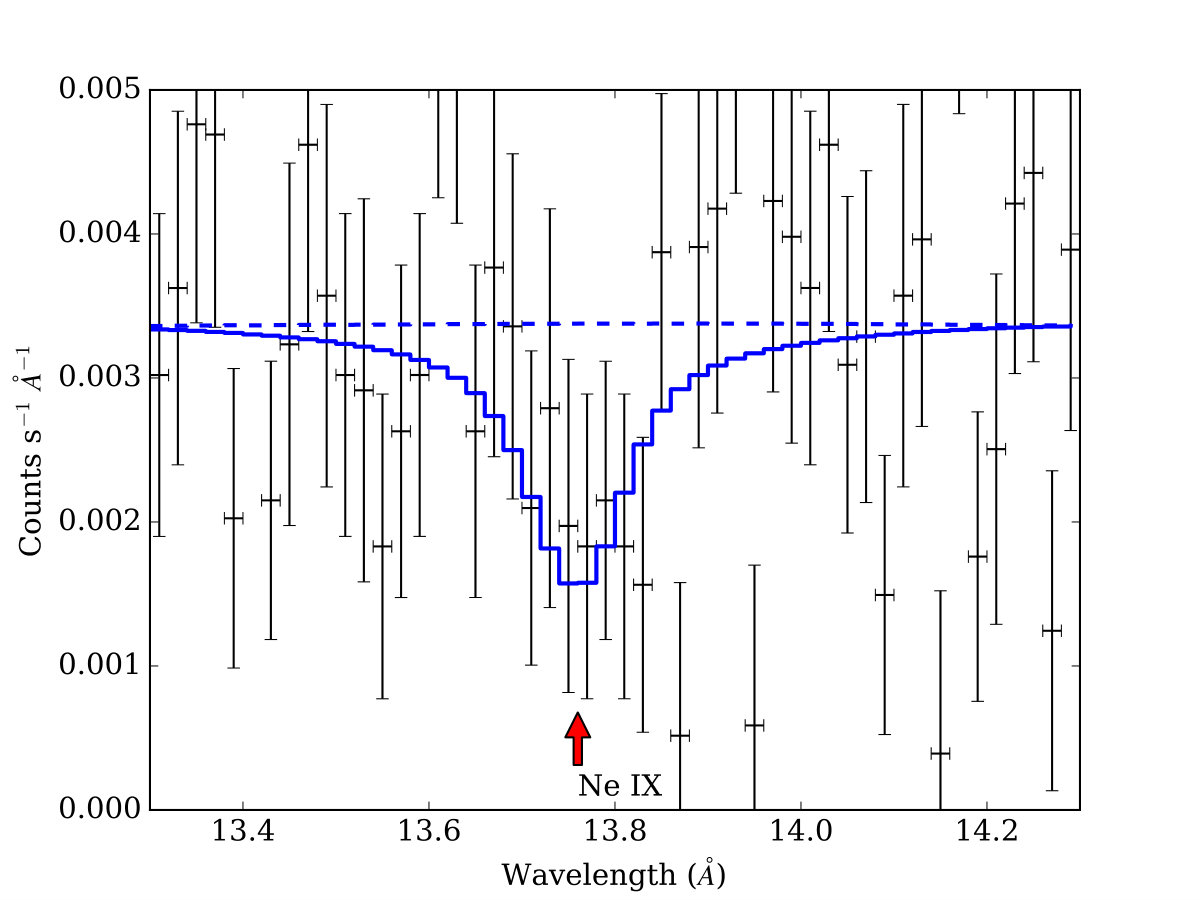 Figure 9
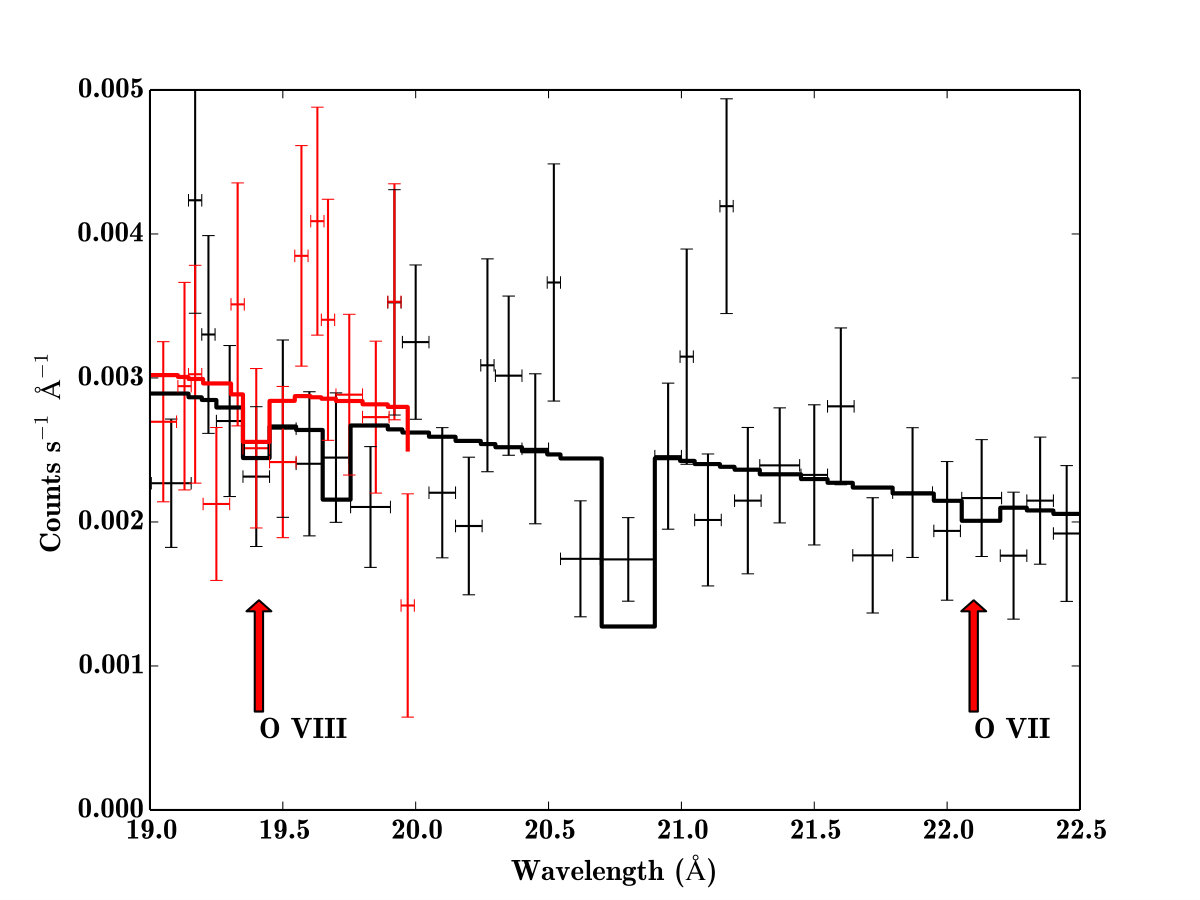 Figure 10
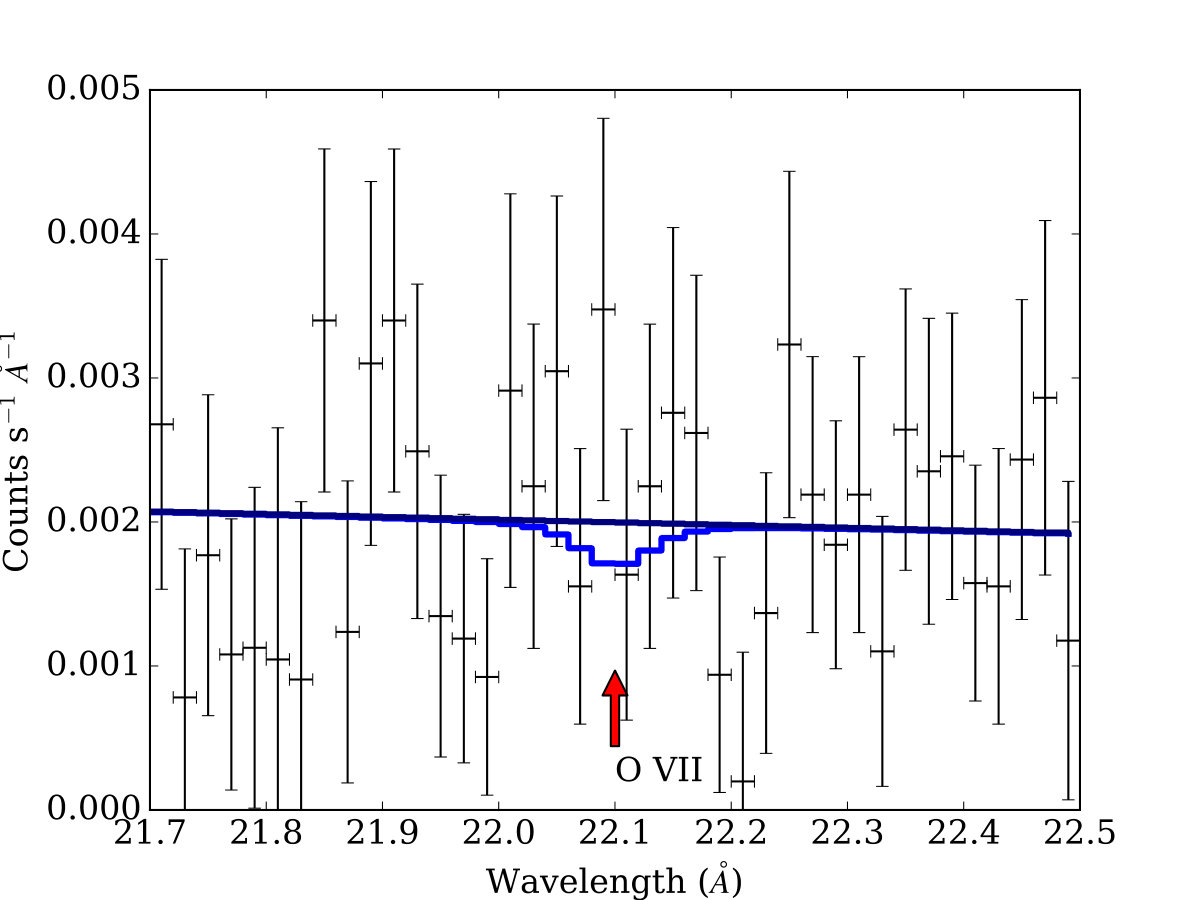 Figure 11
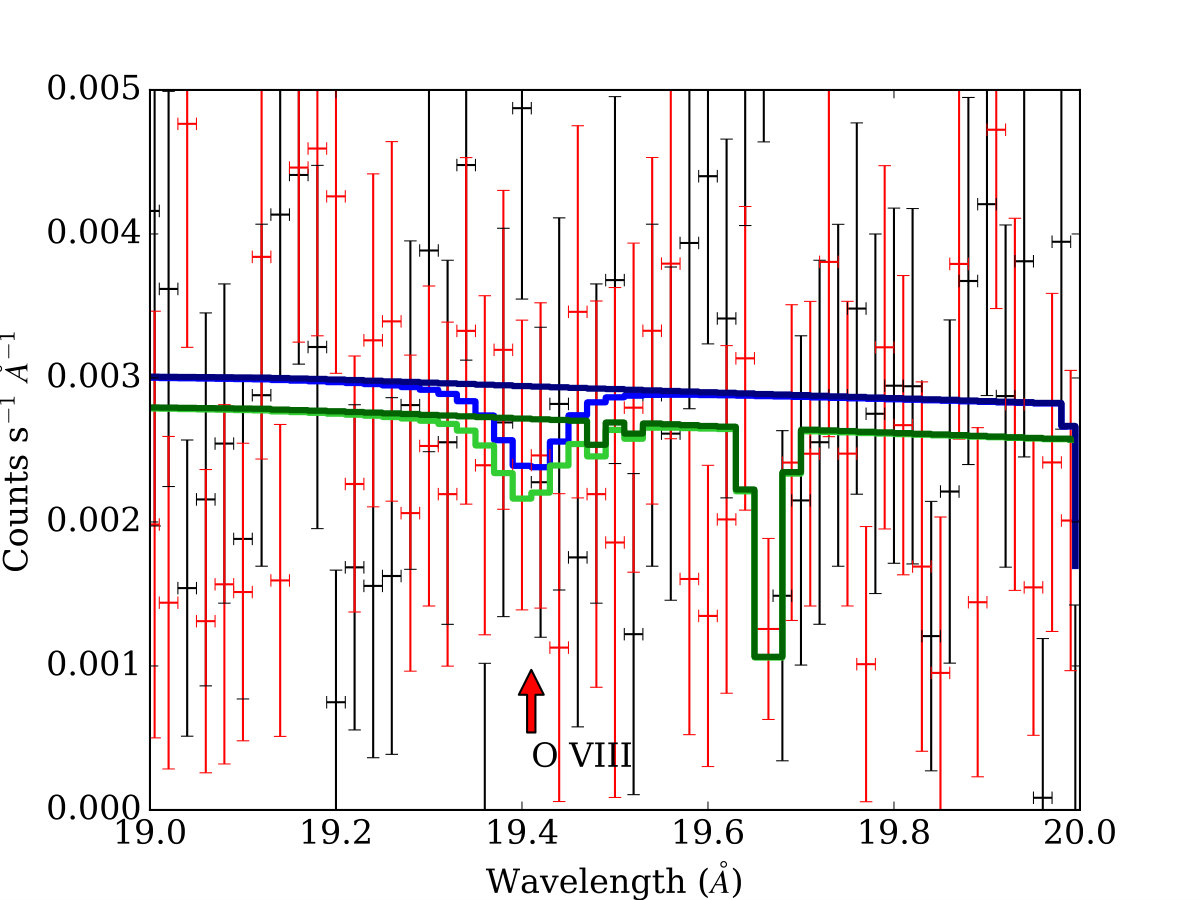 Figure 12
| Obs. ID | Start Date | Exp. Time | Clean Exp. Time |
|---|---|---|---|
| 0204040101 | 2004-06-06 | 101655.8 | 51698.2 |
| 0204040201 | 2004-06-18 | 101857.4 | 37854.3 |
| 0204040301 | 2004-07-12 | 99486.3 | 26708.7 |
| 0304320201 | 2005-06-28 | 80647.4 | 40404.7 |
| 030432030 | 2005-06-27 | 55227.5 | 13762.7 |
| 0304320801 | 2006-06-06 | 63751.9 | 16946.5 |
| Total | 502626.3 | 187375.4 |
| Ion | Wavelength (Å) | Osc. strength | Log Solar | |
|---|---|---|---|---|
| Rest | Abundance | |||
| Ne X | 12.134 | 12.41 | 0.416 | -3.91 |
| Ne IX | 13.447 | 13.76 | 0.724 | |
| O VIII | 18.969 | 19.41 | 0.416 | -3.07 |
| O VII | 21.602 | 22.19 | 0.696 | |
| N VII | 24.781 | 25.35 | 0.416 | -3.95 |
| N VI | 28.787 | 29.45 | 0.675 | |
| C VI | 33.736 | 34.52 | 0.416 | -3.44 |
| C V | 40.267 | 41.20 | 0.648 | |
| Ion | XSPEC Fit Results | Measurements of column density | ||||||
| S/N () | stat. (d.o.f) | (mÅ) | N ( cm-2) | |||||
| Ne X | +0.7 | 184.6 (170) | — | — | ||||
| Ne IX | -2.0 | |||||||
| (Using combined first– and second–order spectra) | ||||||||
| Ne X | -0.3 | 526.6 (507) | — | — | ||||
| Ne IX | -2.1 | |||||||
| O VIII | -0.3 | 193.2 (219) | — | — | ||||
| O VII | -0.0 | — | — | |||||
| N VII | -0.2 | 748.5 (675) | — | — | ||||
| N VI | -1.0 | — | — | |||||
| C VI | -0.9 | 271.0 (285) | — | — | ||||
| C V | — | |||||||
| Ion | Band (Å) | stat (d.o.f) | SPEX Fit Results | ||
|---|---|---|---|---|---|
| (mÅ) | |||||
| Ne X | 12.0-13.0 | 56.5(47) | 17.0 | ||
| Ne IX | 13.2-14.4 | 95.0(57) | |||
| O VIII | 19.0-20.0 | 116.6(98) | 29.1 | ||
| O VII | 21.7-22.5 | 32.2(37) | 16.1 | ||
| N VII | 25.0-25.7 | 89.0(69) | 9.2 | ||
| Constraints on WHIM Filament Properties | ||||||
| Ion | Length | Density | ||||
| (cm-2) | (Mpc) | (cm-3) | ||||
| Ne X | -4.91 | (Uninteresting limits) | ||||
| Ne IX | -4.91 | |||||
| O VIII | -4.07 | |||||
| O VII | -4.07 | |||||
| N VII | -4.95 | (Uninteresting limits) | ||||
Peer Reviews
No public reviews on file for this paper yet. If you reviewed it on a platform where reviews are public (OpenReview, ICLR, NeurIPS, ICML), you can paste yours below so the community can read it here.
Videos
No videos yet. Explain this paper in a talk, walkthrough, or lecture? Add one.
Characterization of the warm–hot intergalactic medium near the Coma cluster
through high–resolution spectroscopy of X Comae
M. Bonamente11affiliation: Department of Physics, University of Alabama in Huntsville, Huntsville, Al 22affiliation: NASA National Space Science and Technology Center, Huntsville, Al , J. Ahoranta33affiliation: University of Helsinki, FI-00014 Helsinki, Finland , E. Tilton44affiliation: CASA, Department of Astrophysical & Planetary Sciences, University of Colorado, Boulder, CO 80309 , E. Tempel55affiliation: Tartu Observatory, Observatooriumi 1, 61602 Tõravere, Estonia 66affiliation: Leibniz-Institut für Astrophysik Potsdam (AIP), An der Sternwarte 16, D-14482 Potsdam, Germany , and A. Morandi11affiliation: Department of Physics, University of Alabama in Huntsville, Huntsville, Al
Abstract
We have analyzed all available archival XMM-Newton observations of X Comae, a bright X–ray quasar behind the Coma cluster, to study the properties of the warm–hot intergalactic medium in the vicinity of the nearest massive galaxy cluster. The RGS observations confirm the possible presence of a Ne IX K absorption line at the redshift of Coma, although with a limited statistical significance. This analysis is therefore in line with the earlier analysis by Takei et al. (2007) based on a sub–set of these data. Its large column density and optical depth, however, point to implausible conditions for the absorbing medium, thereby casting serious doubts to its reality. Chandra has never observed X Comae and therefore cannot provide additional information on this source. We combine upper limits to the presence of other X–ray absorption lines (notably from O VII and O VIII) at the redshift of Coma with positive measurements of the soft excess emission from Coma measured by ROSAT (Bonamente et al., 2003). The combination of emission from warm–hot gas at keV and upper limits from absorption lines provide useful constraints on the density and the sightline length of the putative WHIM towards Coma. We conclude that the putative warm–hot medium towards Coma is consistent with expected properties, with a baryon overdensity and a sightline extent of order of tens of Mpc.
quasars: individual: X Comae, large-scale structure of Universe, intergalactic medium, quasars: absorption lines, X-rays: galaxies
1 The search for missing baryons
The diffuse intergalatic medium contains the majority of the universe’s baryons at all redshifts (Shull et al., 2012, and references therein). At high redshift, the bulk of this mass is in the photoionized phase that gives rise to the Lyman- forest (e.g., Penton et al., 2000). At lower redshift, numerical simulations predict that a diffuse warm–hot intergalactic medium (WHIM) at temperatures contain approximately 50% of the baryons in the universe (e.g. Cen & Ostriker, 1999; Davé et al., 2001). Far ultraviolet (FUV) absorption-line spectroscopy, probing the lower–temperature phase of the WHIM () with transitions from species such as O VI, has so far detected only a fraction of the expected baryons (e.g., Danforth & Shull, 2008; Tripp et al., 2008; Tilton et al., 2012; Shull et al., 2012; Danforth et al., 2016). The remaining low–redshift baryons are likely to be found at higher temperature () where X–ray observations can be used to detect their high–ionization absorption lines (e.g., O VII and O VIII K).
Of particular interest are sightlines near massive galaxy groups and clusters (e.g., Werner et al., 2008). During the formation of galaxy groups, baryons accrete from large–scale filamentary structures towards their gravitational potential and the infall heats them by loss of gravitational energy. A portion of these baryons form the virialized, high–temperature () and relatively high–density ( cm*-3*) intra–cluster medium. A significant amount of baryons, however, is expected to remain at sub–virial temperatures near the outskirts of clusters. These sub–virial baryons are harder to observe because of their lower temperature and density, and may provide a significant reservoir of low–density WHIM baryons.
2 The sightline towards X Comae and the Coma cluster
In this paper we examine the XMM-Newton high–resolution RGS spectra of X Comae, a Seyfert galaxy at redshift (Branduardi-Raymont et al., 1985), in the background of the massive, low–redshift Coma cluster at (Struble & Rood, 1999). X Comae is the brightest X–ray source behind the Coma cluster, at a projected distance of approximately 28.4’ (or 790 kpc) and located to the north of the cluster core. The projected position of X Comae falls well within the Coma virial radius (e.g., Mpc, Kubo et al., 2007). We use a distance scale of 27.8 kpc arcmin*-1* at the redshift of the Coma cluster, for km s*-1* Mpc*-1*, and a flat universe. Our goal is to examine the presence of absorption lines from the putative WHIM at the redshift of Coma with the analysis of all available optical and RGS data.
{comment}
2.1 Galaxy confusion
We first study the distribution of galaxies from optical SDSS data to investigate galaxy confusion along the sightline towards X Comae. Coma is a massive cluster (, Geller et al. 1999) with hundreds of galaxies within a radius of a few Mpc. Fig. 7 shows the distribution of galaxies around the X Comae sightline. Galaxies are selected from the SDSS main spectroscopic sample with apparent magnitudes brighter than 17.77 in the –band. To suppress the Fingers-of-God effect, a redshift–space distortion in which the observed galaxy distribution appears elongated in redshift space along the line of sight (Jackson, 1972; Tully & Fisher, 1978), we applied the modified Friends–of–Friends algorithm (Tempel et al., 2016) and detected systems of galaxies with at least two members. We then calculated the velocity dispersion along the line of sight and the group extent on the sky plane. These quantities were used to spherize the galaxy groups while altering the distances of galaxies (see Tempel et al. 2014b for more details). Left panels in Fig. 7 illustrate the Fingers–of–God correction. The sightline towards X Comae therefore interesects a number of galaxies and groups that are members of the Coma cluster.
In Nevalainen et al. (2015) we showed that a galaxy of –band luminosity similar to the Milky Way () requires an impact parameter of 10 kpc to produce a column density of within the sightline. Our analysis of the SDSS data show that there are no galaxies closer than 70 kpc to the X Comae sight line at the redshift of the absorber. Thus, spirals in the sample are not dense and close enough to produce the measured upper limit of (these limits are presented in Section 4). There are four bright elliptical galaxies with along the sightline. For these, we used Kim et al. (2013), Fig.2, to estimate their X–ray luminosity in the range \log L_{X}(\text{erg s{}^{-1}})=40-41, based on the –band luminosity. We then use Fukazawa et al. (2006), Fig. 3, to estimate their gas density from the X–ray luminosity, which we find to be in the range \log n_{H}(\text{cm{}^{-3}})=(-4,-5), at the impact parameters of these galaxies. Such densities would require a pathlength in excess of 1 Mpc, i.e., larger than the virial radii of the galaxies, to produce a column density of the order of . We conclude that there is no suitable elliptical galaxy that can provide a comparable column density to the measured upper limits.
The Coma cluster has a very diffuse halo of hot X–ray emitting intra–cluster medium (ICM). The hot ICM has an integrated temperature of keV (Hughes et al., 1993) and a temperature of keV in the central 20’ region (Arnaud et al., 2001). Simionescu et al. (2013) measures a radial profile of the hot ICM temperature from Suzaku, with a temperature of keV at radii 20-40’ (the projected distance of X Comae). In peripheral regions at degree from the center, Finoguenov et al. (2003) measured temperatures varying from 3 to keV with XMM-Newton. Takei et al. (2007) also reported a temperature of keV for the region in the foreground of X Comae also with XMM-Newton, using a sub–set of the observations presented in this paper.
The Coma cluster also features a large–scale halo of warm gas at sub–virial temperatures that was discovered from ROSAT and EUVE (Lieu et al., 1996; Bonamente et al., 2003, 2009). Pointed ROSAT observations that cover the entire Coma cluster measured a temperature of keV for the warm gas, in addition to the well–known hot intra–cluster medium. The warm gas temperature measured by ROSAT varies slightly with radius and azimuth with a typical uncertainty of order keV and an abundance of approximately Solar (see Table 3 in Bonamente et al. 2003). The analysis of XMM-Newton CCD imaging spectrometer data by Finoguenov et al. (2003) also detected soft X–ray emission at keV in several peripheral regions of Coma (fields named Coma-0, 3, 7 11 and 13). The analysis of the Suzaku data of field Coma-11 by Takei et al. (2008), however, failed to detect the presence of oxygen emission lines from the WHIM. A possibility for the discrepancy between the Finoguenov et al. (2003) and Takei et al. (2008) results on Coma-11 is the presence of solar wind charge-exchange (SWCX) radiation. This soft X–ray radiation from the local Solar enviroment may be mis–identified as WHIM emission in low–resolution CCD spectra, if not properly subtracted. The Suzaku data does not address the presence of the soft excess continuum detected with ROSAT because Suzaku does not cover the keV energy band available with ROSAT. The ROSAT data of Bonamente et al. (2003, 2009) are not affected by SWCX radiation problems because we used in situ simultaneous background, thanks to the large field of view of the Position–Sensitive Proportional Counter (PSPC) detector of ROSAT.
Takei et al. (2007) also analyzed a sub–set of the XMM-Newton data presented in this paper, in search of both emission and absorption lines from the putative WHIM near Coma. Their analysis of the higher–resolution RGS spectra of X Comae resulted in the detection of absorption lines at the wavelengths of the redshifted Ne IX line (2.3 confidence) and O VIII line (1.9 ). In addition, from the analysis of low–resolution EPIC CCD spectra they report a 3.4 detection of excess flux that corresponds to a redshifted Ne IX K line. In this paper we do not re–analyze the XMM-Newton EPIC data towards X Comae, since our aim is to study lines from the WHIM and the spectral resolution of EPIC is insufficient to separate accurately the strong Galactic lines from those at the redshift of Coma. Moreover, the ROSAT data we use to constrain the continuum emission from the WHIM have a number of advantages over the available EPIC data, including a full azimuthal coverage, low background and insensitivity to local particle background. More importantly, ROSAT covers directly the keV band where the WHIM emission is expected to be strongest, and the effective area of ROSAT is well calibrated at these energies (e.g. Snowden et al., 1994). At the end of Section 5.2 we compare our constraints on the properties of the WHIM based on our analysis to the Takei et al. (2007) detection of Ne IX emission.
This soft X–ray emission around Coma is part of the soft excess phenomenon detected in a number of low–redshift clusters, consisting of substantial amounts of soft X–ray emission in excess of the amount expected as the low–energy tail of the hot ICM (e.g. Bonamente et al., 2002). A possible explanation for the soft excess is precisely the presence of sub–virial gas near the cluster outskirts, likely converging towards the massive gravitational potential from large–scale filaments. As WHIM filaments intersect galaxy clusters, we expect that the WHIM becomes more dense and therefore more readily observable towards clusters. This re–analysis of X Comae in search for absorption lines is therefore useful to constrain the presence of keV WHIM gas at the redshift of Coma.
3 XMM-Newton observations of X Comae and data analysis
XMM-Newton observed X Comae in six separate observations for a total of approximately 500 ksec (Table 1). The reduction of the RGS data follow the standard rgsproc pipeline with the SAS software, as described in Bonamente et al. (2016). One of the key steps in the analysis of these data is filtering times of high background, which are quite common for XMM-Newton. This step is achived by choosing a level for the quiescent background rate from the analysis of lightcurves of the standard RGS spectral extraction regions. In our analysis we chose a quiescent background level of counts s*-1*. There are clear enhancements (flares) in the background level that need to be filtered out to improve the quality of the resulting source spectrum. All of the six observations of X Comae are significantly affected by background flares. As a result, the clean exposure time is reduced to a fraction of the total exposure time (Table 1). In Section 4.2 we discuss the impact of this choice by using a less conservative background level.
Each observation is reduced individually to apply the relevant calibration information. For each observation we generate a spectrum with its background and response function, and combine all six spectra into one spectrum with the rgscombine tool. The spectrum is rebinned by a factor of 2 over the initial resolution of 10 mÅ to a bin size of 20 mÅ. This bin size oversamples the approximate resolution of the XMM-Newton RGS instrument by a factor of approximately three, therefore optimizing the resolving power and the ability to measure narrow line features.
The goal of this analysis is to place constraints on the presence of WHIM absorption lines at the redshift of Coma. In the temperature range and assuming collisional ionization equilibrium, the most abundant ions are expected to be the -like and –like ions of neon, oxygen, nitrogen and carbon, as shown in Figure 2 and Table 2 (calculations are from Mazzotta et al. 1998 and Gnat & Sternberg 2007 and atomic data of the lines from Verner et al. 1996). For example, if the WHIM is at keV (i.e., ), consistent with the temperature measured by Bonamente et al. (2003), we expect the K lines of O VIII and Ne IX to be particularly prominent.
The analysis of the coadded first–order spectra (one for RGS1 and one for RGS2) is performed in SPEX (Kaastra et al., 1996) using the Cash statistic (also known as statistic or cstat, from Cash 1979) as the fit statistic. In fact, in most 20–mÅ bins the number of counts is , especially at wavelengths Å, and the Gaussian approximation to the Poisson counting statistic would not be accurate. The background subtraction in the spectra analysis is achieved with the use of a local background that is obtained, from the same observations, as part of the standard data reduction process. In SPEX, the Poisson–based Cash statistic for background–subtracted spectra is implemented in the following way: the observed background–subtracted spectrum , the measured background and the model are combined so that is the data and is the model used in the calculation of the Cash statistic (Jelle Kaastra, private communication). This method enables the use of the Poisson distribution for the Cash statistic even in the presence of a subtracted background. For the spectral region near the Ne IX and Ne X lines we have successfully checked that the statistic gives results that are consistent with the Cash statistic (see Section 4.2).
To ensure an accurate modelling of the source’s continuum, we model narrow wavelength ranges in the neighborhood of each line of interest. We use the physically–motivated slab model that calculates all transmission properties of the selected lines including their optical depth and a consistent calculation of the resulting column density based on each line’s curve of growth. One of the model parameters is the line broadening parameter , which includes all sources of broadening. As shown in Bonamente et al. (2016), a large value of keeps absorption lines in the linear portion of their curves of growth for larger values of the column density. Since we seek upper limits to the non–detection of absorption lines, we used a purely thermal broadening velocity of km s*-1*, which approximately corresponds to the thermal velocity of neon, oxygen and nitrogen at . Broadening of the lines cannot be directly constrained using the available data. The presence of non–thermal broadening would reduce the optical depth of the line, leading to lower upper limits to the column density. In Table 4 we report the parameters of the slab SPEX fit. Although the RGS instrument covers the band where N VI, C VI and C V X–ray lines may be present, the quality of our data is poor at those longer wavelengths. We therefore do not report measurements for these lines. The RGS spectra near the Ne IX line is shown in Fig. 4 and the spectra near the other lines in Fig. 5.
{comment}
For each fit, we use a power–law model for the continuum and the slab model Gaussians of fixed wavelength and width. Given the narrow bands used in the fits, the properties of the absorption lines are unaffected by the use of a model for the Galactic absorption. Each absorption line is therefore measured by a single parameter, the line’s normalization, which is proportional to the total number of counts in the line. The statistical significance of the normalizations of the Gaussian line model, reported in Table 3, are used to determine the significance of detection. Errors are determined from the criterion, which is equivalent to the for Gaussian variables (bonamente2013book). We also extracted the second–order RGS1 and RGS2 spectra that cover the wavelength range of the possible Ne IX line, given that the combined effective area of the second–order spectra is similar to that of the first–order RGS2 spectrum at those wavelengths. These best–fit normalization of the Gaussian model for the Ne IX line in the second–order spectra alone is , i.e., the line is not detected at a statistically significant level. We also fit the first– and second–order spectra together to obtain the combined constraints on the Ne IX and Ne X lines and report these results in Table 3.
As noted in Section 2, Takei et al. (2007) analyzed a sub–set of these observations. Their method of analysis differs from ours in a number of ways. First, a number of updates to the calibration of the data have occurred since the Takei et al. (2007) paper was published. In this paper we apply the available XMM-Newton calibration as of 2016 through the use of the SAS software and current calibration files (CCF). Another critical point in the analysis is the exclusions of periods of high background. Our analysis results in a substantially shorter clean exposure time, despite the availability of additional observations. Also, they assess the presence of absorption using the apparent deficit of photons from a fit to the continuum without lines, using a so–called ‘ratio method’, whereas we use a more physically–motivated line fitting method.
4 Results of the RGS spectral analysis
In this section we first describe the measurements of the line parameters, then provide an assessment of the robustness of these measurements with respect to certain aspects of the analysis.
4.1 Detection and upper limits of X–ray absorption lines
The spectral analysis reported in Table 4 shows that the RGS spectra towards X Comae are consistent with the presence of a redshifted Ne IX absorption line, as reported by Takei et al. (2007). The feature remains significant at the 90% confidence level () with a column density of but it is not significant at the 99% level (), with an upper limit of . Given the limited significance of detection, we cannot prove conclusively the presence of Ne IX absorption lines from the WHIM at the redshift of Coma. In Section 5.2 we further discuss whether a putative Ne IX with the parameters of Table 4 may be due to WHIM absorption, based on a joint analysis with the emission detected by ROSAT (Bonamente et al., 2003). At the wavelengths of Ne IX, RGS2 is the only detector with effective area in our observations. Follow–up observations with both XMM-Newton and Chandra are required to establish conclusively the reality of this absorption feature, and that of any additional X–ray absorption lines.
{comment}
The column density and upper limits to their measurements can be obtained by converting the normalization of the Gaussian line model to an equivalent width via , where is the normalization of the Gaussian line model (proportional to the photons in the line, see Table 3) and the flux of the source in the relevant wavelength range (Table 3). The equivalent width is used to measure the ion’s column density according to
[TABLE]
where we assume that the lines are optically thin.
We therefore focus on the upper limits of WHIM absorption lines allowed by our analysis of the XMM-Newton observations. The upper limits to column densities and optical depths (Table 4) indicate that our sensitivity limits are consistent with lines that may in fact be saturated (). In the calculation of these limits, we have assumed a purely thermal broadening of the lines with km s*-1*, with SPEX taking into account all the atomic physics required to determine the appropriate line profile, including the effects of RMS speeds on the line profile (i.e., the presence of saturation). The WHIM may become turbulent due to accretion shocks that occur during the infall into the deep gravitational well of clusters. As a result, the WHIM may feature substantially higher non–thermal speeds up to 1,000 km s*-1* (e.g. Schmidt et al., 2016). If the plasma has RMS speeds that are significantly higher than the thermal speeds assumed in our measurements of Table 4, the lines would become less saturated, leading to lower upper limits to their column density, as also shown for the extragalactic source PG 1116+215 in Bonamente et al. (2016). The upper limits of Table 4 are therefore strict (i.e., the highest) upper limits allowed by the available X–ray data. In Sect. 4.2 we discuss further the sensitivity of our measurements to the value of the assumed parameter.
4.2 Systematics
One of the sources of systematic errors in the analysis of grating spectra is the uncertainty in the background level for the spectra.
To address systematic errors associated with the background level, we performed the test of changing the background level by %, as in Bonamente et al. (2016). Near the wavelength of the Ne IX line, the background is approximately 50% of the source count rate. For the main absorption feature (Ne IX), we find that the best–fit parameters of the line are effectively unchanged when the background is changed by this amount, same as we found in Bonamente et al. (2016). We therefore conclude that the results of Table 4, including the upper–limits to non detection, are insensitive to reasonable variations of background levels.
Another key choice in the reduction of RGS data is the level of the quiescent background. Our choice for the quiescent level (see Section 3) was somewhat conservative, leading to substantially shorter exposure times (for the same observations) than in the reduction of Takei et al. (2007). We re–reduced the data using a higher value for the quiescent background, counts s*-1*, leading to a new clean exposure time of 325.1 ks (versus the 187.4 ks of the standard reduction used throughout the paper). With these new spectra, the best–fit column density for the Ne IX line becomes , consistent with the value of Table 4. For the same high–background data, we also confirmed that the line is not significant at the 99% confidence level, same as for the results with the low–background reduction. We therefore conclude that our results are robust with regards to changes in the level of the quiescent background.
We also tested the robustness of the significance of detection of the Ne IX line with respect to the value of the redshift assumed. In our analysis we fixed the central wavelength of the lines, according to the redshift of the Coma cluster. It is however possible that infall or peculiar velocities of WHIM filaments will result in small deviations from these nominal wavelengths. For this purpose, we re–analyze the spectra at the wavelengths of the Ne IX line allowing the redshift to be a free parameter. We obtain a best–fit redshift of , which is consistent with the nominal redshift of Coma () used throughout this paper. For this redshift value, the fit statistic is reduced to for one fewer degree of freedom, and the column density is measured at . Using this redshift, the feature becomes just significant even at the 99% confidence level ( for one interesting parameter), with a column density constrained to . In Fig. 4 we show a close–up of the RGS2 spectrum near the wavelengths of the putative Ne IX absorption line.
The significance of detection of the putative Ne IX line was tested also by rebinning the spectrum by a factor of 8 (or 80 mÅ), so that each bin has at least 20 counts, and using the statistic in the fit. With this coarser binning, the spectrum in the vicinity of the redshifted line (see Figure 6) yields a best–fit statistic of for 11 degrees of freedom, and the best–fit Ne IX column density is (68% error), consistent with the results obtained with the Cash statistic and the spectra binned by a factor of two. Even with this coarser binning, the feature remains consistent at the 90% level (or for one degree of freedom), with a confidence interval of . The feature is not significant at the 99% level, also consistent with the Cash statistic analysis.
Finally, we address the sensitivity of our measurements to the choice of the velocity parameter, which we have set to a value km s*-1*, corresponding to purely thermal broadening of the lines. As discussed in Sect. 4.1, a larger value for is in principle possible if the WHIM has a significant non–thermal velocity structure. To discuss the effect of on our measurements, we fit the spectra in the neighborhood of the Ne IX line with a fiducial value of km s*-1*. The goodness of fit is unchanged relative to the fit with thermal broadening only, since RGS does not have sufficient spectral resolution to detect this level of line broadening. As a result, the line’s equivalent width is nearly unchanged ( mÅ), but the best–fit column density and optical depth are both significantly reduced, respectively to a value of and . This is due to the fact that a larger velocity structure keeps the line on the linear portion of its curve of growth for larger values of the column density. Likewise, upper limits to other lines would be correspondingly reduced by the assumption of a larger parameter. For example, a value of km s*-1* results in an upper limit to the O VII line of , corresponding to and mÅ. This reduction in the column density of O VII, if significant non–thermal velocities are present, is more modest than that for Ne IX. In fact, the values in Table 4 indicated that even for a purely thermal velocity, there is only mild saturation of O VII K lines.
5 Interpretation
In this section we discuss the findings of our analysis of the RGS spectra of X Comae. First we analyze the distribution of galaxies along the sightline, and conclude that there is no individual galactic halo with a column density that is consistent with our measured upper limits. We then provide a joint interpretation for the upper limits to the non–detection of X–ray absorption lines and the X–ray emission detected by ROSAT to constrain the physical parameters of putative WHIM near the Coma cluster. We also discuss whether a Ne IX absorption line with the characteristics of Table 4 (i.e., highly saturated and with large column density) is consistent with a WHIM origin.
5.1 Galaxy Confusion
We first study the distribution of galaxies from optical SDSS data to investigate galaxy confusion along the sightline towards X Comae. Coma is a massive cluster (, Geller et al. 1999) with hundreds of galaxies within a radius of a few Mpc. Fig. 7 shows the distribution of galaxies around the X Comae sightline. Galaxies are selected from the SDSS main spectroscopic sample with apparent magnitudes brighter than 17.77 in the –band. To suppress the Fingers-of-God effect, a redshift–space distortion in which the observed galaxy distribution appears elongated in redshift space along the line of sight (Jackson, 1972; Tully & Fisher, 1978), we applied the modified Friends–of–Friends algorithm (Tempel et al., 2016) and detected systems of galaxies with at least two members. We then calculated the velocity dispersion along the line of sight and the group extent on the sky plane. These quantities were used to spherize the galaxy groups while altering the distances of galaxies (see Tempel et al. 2014b for more details). Left panels in Fig. 7 illustrate the Fingers–of–God correction. The sightline towards X Comae therefore interesects a number of galaxies and groups that are members of the Coma cluster.
In Nevalainen et al. (2015) we showed that a galaxy of –band luminosity similar to the Milky Way () requires an impact parameter of 10 kpc to produce a column density of within the sightline. Our analysis of the SDSS data show that there are no galaxies closer than 70 kpc to the X Comae sight line at the redshift of the absorber. Thus, spirals in the sample are not dense and close enough to produce the measured upper limit of (see Section 4). There are four bright elliptical galaxies with along the sightline. For these, we used Kim et al. (2013), Fig. 2, to estimate their X–ray luminosity in the range \log L_{X}(\text{erg s{}^{-1}})=40-41, based on the –band luminosity. We then use Fukazawa et al. (2006), Fig. 3, to estimate their gas density from the X–ray luminosity, which we find to be in the range \log n_{H}(\text{cm{}^{-3}})=(-4,-5), at the impact parameters of these galaxies. Such densities would require a pathlength in excess of 1 Mpc, i.e., larger than the virial radii of the galaxies, to produce a column density of the order of . We conclude that there is no suitable elliptical galaxy that can provide a comparable column density to the measured upper limits.
5.2 Constraints on the presence of WHIM filaments near the Coma cluster
The sightline towards X Comae is rendered particularly interesting by the presence of an excess of soft X–ray radiation around the Coma cluster. In Bonamente et al. (2003) we have found evidence for the presence of keV plasma that extends well beyond the projected radius of the X Comae sightline (see also Bonamente et al., 2009). This soft X–ray emission detected by ROSAT can be interpreted with the presence of WHIM filaments converging towards Coma. In this section we combine the upper limits to the X–ray absorption lines with the positive detection of emission near Coma we obtained with ROSAT to derive properties of the putative WHIM near the Coma cluster.
5.2.1 Constraints from ROSAT emission and RGS absorption lines upper limits
Assuming a filament of uniform density and length along the sightline, its soft X–ray emission integral is given by
[TABLE]
where the right–hand side term in parenthesis is referred to as the constant , and the emission integral was measured in Bonamente et al. (2003) for a quadrant between radii 20–40’, corresponding to the projected radial distance of X Comae from the cluster’s center. The measurement was in units (see Table 3 of Bonamente et al. 2003). For our simple uniform–density filament model this equation becomes
[TABLE]
where is the surface area of the filament (so that is the volume), . The redshift and the angular distance are those of the Coma cluster. The surface area of the filament, for the chosen emission region, is , where the angles of respectively 40’ and 20’ are measured in radians, and the factor of accounts for the shape of the region (a quadrant of an annulus). Equation 3 thus links the density and length of the putative WHIM filament.
From upper limits to the presence of absorption lines we can further set
[TABLE]
where the temperature–dependent upper limits to the hydrogen column density can be obtained from the measured upper limits for the various ions of Table 4. Such upper limits are obtained by assuming a chemical abundance (e.g., Solar) and the temperature–dependent ionization fractions calculated in ionization equilibrium, via
[TABLE]
The ionization fractions are very sensitive to the choice of temperature. To account for uncertainties in the WHIM temperature towards X Comae, we use a temperature of keV ( K), corresponding to the best–fit value and a conservative 3– error bar from the ROSAT analysis of Bonamente et al. (2003). We calculate the ionization fractions of Ne X, Ne IX, O VIII, O VII and N VII assuming collisional ionization equilibrium at this temperature (Gnat & Sternberg, 2007). We report the ionization fractions and constraints to the hydrogen column density in Table 5, mindful of the fact that these limits are inversely proportional to the value of the chemical abundance (assumed 0.1 Solar).
Using Eq. 3 into Eq. 4, the combination of soft X–ray emission from the WHIM and upper limits to absorption lines leads to upper limits to the filament’s lenght,
[TABLE]
and lower limits to the WHIM density,
[TABLE]
These limits are reported in Table 5. We interpret the density constraints also in terms of the critical density of matter of the universe, calculated as
[TABLE]
where is the Hubble parameter and is the gravitational constant. For a flat universe with km s*-1* Mpc, the critical density at present epoch corresponds to H atoms cm*-3*. For a baryon density of , the baryon overdensity associated with the WHIM densities measured from Eq. 6 is , also reported in Table 5.
For lines with upper limits, the most stringent constraints on the properties of the WHIM filaments are obtained from the measurements of the O VII and O VIII K lines. These limits assume a WHIM temperature of keV (as measured by Bonamente et al. 2003) and a chemical abundance of 0.1 Solar. The results indicate that the WHIM in the neighborhood of Coma may be relatively dense ( cm*-3* or ) and spread over a line–of–sight distance of tens of Mpc. Both constraints are consistent with the expected properties of the WHIM. Upper limits from Ne X and N VII provide less stringent constraints because of the assumed temperature. Implications of the Ne IX measurements for the WHIM scenario are discussed below in Sect. 5.2.2.
5.2.2 Is the Ne IX RGS absorption real?
In Table 5 we also reported the WHIM filament constrains from the Ne IX absorption line, based on the assumption of a positive detection of highly–saturated Ne IX, as obtained from our SPEX analysis (Table 4). Such constraints on filament length and density are obtained by replacing the inequality signs with equal signs in both Eq. 5 and 6. The constraints on filament length exceed the size of the universe, i.e., clearly a Ne IX absorption line with the parameters of Table 4 is untenable. This analysis therefore excludes the possibility that there exists highly–saturated Ne IX absorption (at km s*-1*) that originates from the WHIM medium at and that is responsible for the ROSAT emission.
A simple explanation for this interpretational problem is that the Ne IX is not real, and the absorption is a statistical fluctuation. It is nonetheless possible that there is a significant column density of Ne IX along the sightline to X Comae, as suggested by the Takei et al. (2007) study of both emission and absorption. If the putative absorbing plasma has a very large non–thermal velocity, the Ne IX column density of Table 4 would be significantly reduced, as the Ne IX K– line would be less saturated. We have analyzed this possibility in Sect. 4.2, where we found that using a fiducial value of km s*-1* for the broadening of the line, the column density is reduced to . Even with this lower value, however, the required WHIM filament length (calculated in Table 5 for the larger column density) remains in excess of 1 Gpc. The WHIM explanation for the RGS/ROSAT data appears not tenable for any reasonable value of the line broadening paramater.
5.2.3 Consistency between the RGS Ne IX absorption and the
EPIC Ne IX emission of Takei et al. (2007)
In this section we investigate the consistency between the measurements of the redshifted RGS Ne IX line presented in this paper, with the possible detection of Ne IX emission based on the analysis of the lower–resolution XMM-Newton EPIC data by Takei et al. (2007).
If the Takei et al. (2007) excess of photons near the Ne IX line is interpreted as an emission line at the Coma redshit, the measured surface brightness photons cm*-2* s*-1* arcmin*-2* of the putative Ne IX line is proportional to the average WHIM density and length according to
[TABLE]
where is a temperature–dependent coefficient that equals photons cm3 s*-1* arcmin*-2* for a temperature of K (see Eq. 9 in Takei et al., 2007). Assuming 10% Solar abundances of neon, this converts to the following constraint between WHIM density and length,
[TABLE]
i.e., for a density slightly of , the emitting region would have a length of order Mpc for a neon abundance of 10% Solar, or a lenght of Mpc for Solar neon abundance.
We now investigate the consistency between the Takei et al. (2007) Ne IX emission line (e.g., the constraints from Eq. 7) and our RGS absorption line measurements. For this purpose, the constraints in space from the RGS absorption can be obtained from
[TABLE]
where is the column density of the ion of interest (in this case Ne IX), and respectively the ion fraction and the corresponding chemical abundance (i.e., 10% Solar). For a value of , obtained for the case of a purely thermal line broadening, the constraints according to Eq. 8 are
[TABLE]
The combination of Eq. 7 (constraints from the emission line) and 9 (constraints from the saturated absorption line) yields a solution for both density and filament length of
[TABLE]
It is clear that for any plausible value of the metallicity and the Ne IX ion fraction, the solution is not tenable. The ionization fraction is in fact at all temperatures, and only implausibly large abundances of neon would reduce the required filament length.
We next repeat the same calculations assuming the larger value of the line broadening ( km s*-1*), for which we measured an absorbing column of . In this case we obtain a constraint from absorption of
[TABLE]
with a solution for both emission and absorption of
[TABLE]
The density of the filaments becomes reasonable, but the values of the length remain extreme, unless there is a significantly super–Solar abundance of neon.
An additional consideration for this WHIM interpretation is provided by the possible clumpiness of the WHIM. If the WHIM is not homogeneous, as assumed in our calculations, the emission is boosted by the clumpiness factor , with , while the properties of the absorption would remain unaffected. This results in a factor of in the left–hand side of Eq. 7, a factor of in the solution for density and a factor of in the solution for length. In other words, a clumpy medium will require smaller densities and even longer filaments to explain the emission and absorption measurements. Clumpiness will therefore exacerbate the interpretational problems within the contest of a WHIM origin. Given the challeges in the intepretation of the emission and absorption from the WHIM, we conclude that it is unlikely that both features (Ne IX absorption and Ne IX emission) are real.
5.2.4 Other considerations
Studies of a possible filamentary structure containing WHIM from the distribution of galaxies, e.g., from the SDSS, is limited, since our filament-finding algorithm (Tempel et al., 2014a) is not optimised to work in complicated cluster environments (e.g., Fig. 7). Thus, the task of identifying the WHIM absorber with a large scale galaxy filament from the available SDSS data was inconclusive.
A filament with these properties will only contribute marginally to the Sunyaev–Zeldovich effect (SZE) towards Coma, which is proportional to the integrated pressure along the sightline. In fact, a 20 Mpc filament with an overdensity of and temperature keV has a Compton- parameter of just , approximately two orders of magnitude smaller than what Planck measured at the projected radius of X Comae (Planck Collaboration et al., 2013).
Nicastro et al. (2016b) pointed out that some redshifted absorption lines from the WHIM may instead be lines from lower–ionization ions such as O I or O II at zero redshift, i.e., located in the Galaxy. Recently, there has been much interest in the calculation of cross–sections for the inner–shell absorption of low–ionization atoms of cosmological interest, such as oxygen and neon (e.g. Gatuzz et al., 2013, 2015; Müller et al., 2017). The Lyman–series lines from oxygen ions (O I through O VIII) reported in Nicastro et al. (2016a) and also in Gatuzz et al. (2013) are not relevant to the present Ne IX K absorption line, since they are much lonwgards of this putative redshifted Ne IX line. The works of Gatuzz et al. (2015) and Müller et al. (2017) also indicate a Ne II K line at Å and Ne III K line at Å, with a edge at Å (also reported in Gatuzz et al. 2013). It therefore appears that low–ionization neon atoms in the Galaxy would not likely be responsible for any absorption near 13.8Å in the spectrum of X Comae.
6 Conclusions
XMM-Newton observations of X Comae with the RGS spectrometers, combined with measurements of the soft X–ray emission from ROSAT, have provided useful constraints to the properteis of the WHIM near the Coma cluster. First, we have searched for the presence of absorption lines from several ions that are expected to be abundant at , following the earlier study of Takei et al. (2007) based on a sub–set of these observations. We do not find significant absorption from any of the prominent X–ray ions. We do find an absorption signal that is consistent with Ne IX at the redshift of Coma, statistically significant between the 90% and 99% confidence level. It is therefore in principle possible that there are significant amounts of warm–hot absorbing plasma along this sightline, but our analysis cannot confirm their presence with high statistical significance.
Ne IX, O VIII and O VII are the most prominent ions for a WHIM temperature of keV, the temperature indicated by the Bonamente et al. (2003) observations of the soft X–ray emission towards Coma. We have therefore combined the RGS absorption line measurements with ROSAT measurements of the soft X–ray emission from Coma (Bonamente et al., 2003) to study the overall characteristics of the WHIM towards Coma. We used the measured upper limits to place constraints on the density and the length along the sightline of the WHIM filaments, and find that the WHIM towards Coma has properties that are typical for the WHIM, with a sightline distance of less than a few hundred Mpc and with a baryon overdensity in excess of approximately 10. The soft X–ray emission and absorption line spectroscopy presented in this paper are generally consistent with the scenario that Coma may host a WHIM that converges to the cluster from nearby filaments. Our search for galaxy filaments with SDSS data however proved inconclusive. We showed that the galaxy confusion does not take place, i.e. that galactic halos along the sightline towards X Comae would not be able to produce an absorption at the level of the measured upper limits.
Our analysis of the physical properties of WHIM towards the X Comae sight line is necessarily driven by the available observations. Limited by marginal constraints on only a few ionic species, our model assumes a single-phase gas, but cosmological simulations suggest that multi-temperature structure is likely (e.g., Yoshida et al., 2005). Addressing these limitations and leveraging X Comae’s position behind the Coma cluster will require further observations. Independent Chandra observations could confirm and further constrain the X-ray transitions discussed above. Additionally, simulations predict substantial gas around Coma-like clusters in phases detectable via FUV transitions (e.g., Emerick et al., 2015). As X Comae has only been observed in the FUV with Hubble Space Telescope’s (HST) FOS/G130H at very low signal-to-noise insufficient for detailed absorption line studies, new observations with the Cosmic Origins Spectrograph on HST could directly confirm multi-temperature WHIM along the line of sight. X Comae’s unique position on the sky offers a unique probe of the WHIM near galaxy clusters, which can only be fully exploited if such additional observations are undertaken.
Acknowledgements: We thank prof. A. Finoguenov for help in the interpretation of the data. We thank L. Liivamägi for help in the analysis of the data. TF was partially supported by the National Natural Science Foundation of China under grant No. 11273021 E. Tempel acknowledges the support by the ETAg grants IUT26-2, IUT40-2, and by the European Regional Development Fund (TK133). E. Tilton acknowledges support from NASA Earth and Space Science Fellowship grant NNX14-AO18H
The reference list from the paper itself. Each links out to its DOI / PubMed record.
- 1Anders & Grevesse (1989) Anders E., Grevesse N., 1989, Geochim. Cosmochim. Acta, 53, 197
- 2Arnaud et al . (2001) Arnaud M. et al., 2001, A&A, 365, L 67
- 3Bonamente et al . (2003) Bonamente M., Joy M. K., Lieu R., 2003, Ap J, 585, 722
- 4Bonamente et al . (2009) Bonamente M., Lieu R., Bulbul E., 2009, Ap J, 696, 1886
- 5Bonamente et al . (2002) Bonamente M., Lieu R., Joy M. K., Nevalainen J. H., 2002, Ap J, 576, 688
- 6Bonamente et al . (2016) Bonamente M., Nevalainen J., Tilton E., Liivamägi J., Tempel E., Heinämäki P., Fang T., 2016, MNRAS, 457, 4236
- 7Branduardi-Raymont et al . (1985) Branduardi-Raymont G., Mason K. O., Murdin P. G., Martin C., 1985, MNRAS, 216, 1043
- 8Cash (1979) Cash W., 1979, Ap J, 228, 939