Joint estimation of genetic and parent-of-origin effects using RNA-seq data from human
Vasyl Zhabotynsky, Wei Sun, Kaoru Inoue, Terry Magnuson, Mauro, Calabrese

TL;DR
This paper introduces a new statistical framework for jointly estimating genetic and parent-of-origin effects on gene expression using RNA-seq data from human family trios, addressing the challenge of disentangling these effects in outbred populations.
Contribution
The authors develop a novel method combining experimental design and statistical modeling to estimate genetic and parent-of-origin effects simultaneously in humans.
Findings
Supported previous imprinted gene findings
Identified new candidate imprinted genes
Validated approach with HapMap trio data
Abstract
RNA sequencing allows one to study allelic imbalance of gene expression, which may be due to genetic factors or genomic imprinting. It is desirable to model both genetic and parent-of-origin effects simultaneously to avoid confounding and to improve the power to detect either effect. In a study of experimental cross, separation of genetic and parent-of-origin effects can be achieved by studying reciprocal cross of two inbred strains. In contrast, this task is much more challenging for an outbred population such as human population. To address this challenge, we propose a new framework to combine experimental strategies and novel statistical methods. Specifically, we propose to collect genotype data from family trios as well as RNA-seq data from the children of family trios. We have developed a new statistical method to estimate both genetic and parent-of-origin effects from such data…
Click any figure to enlarge with its caption.
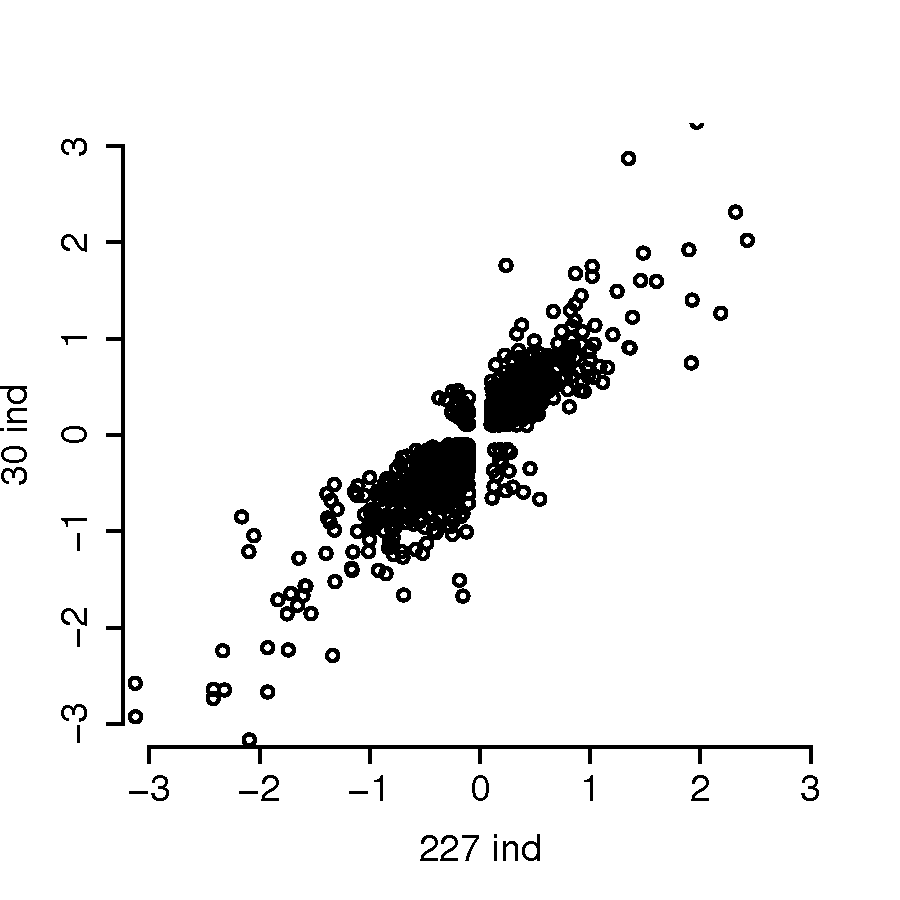 Figure 1
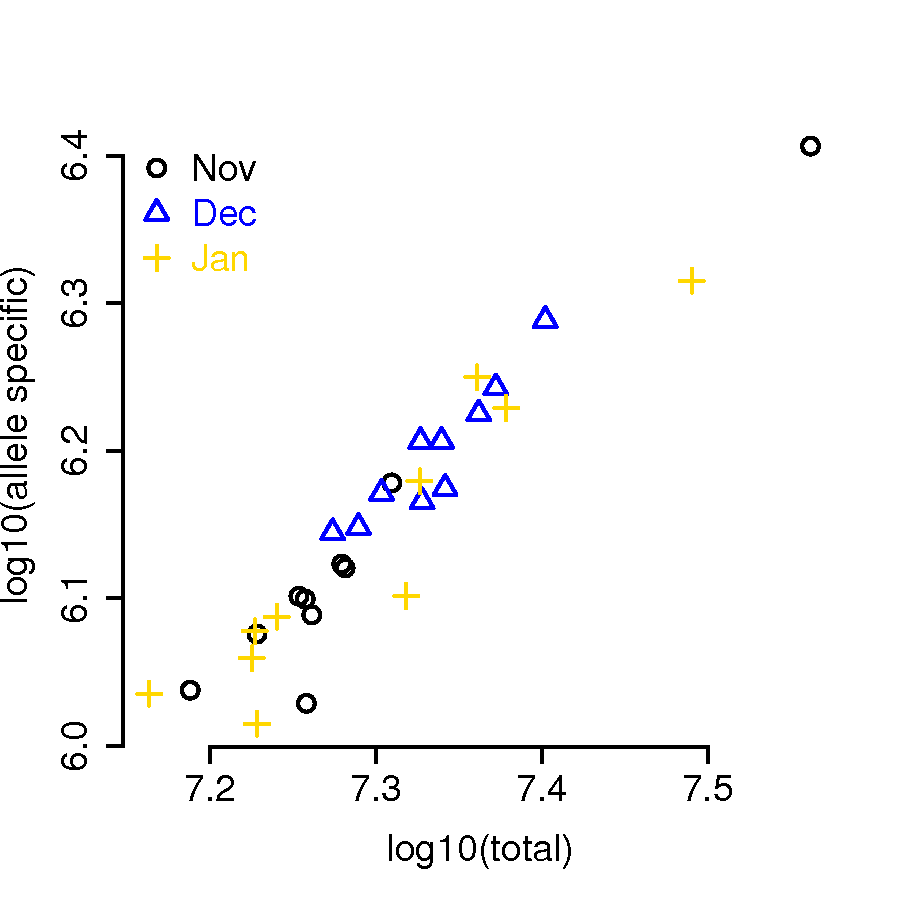 Figure 2
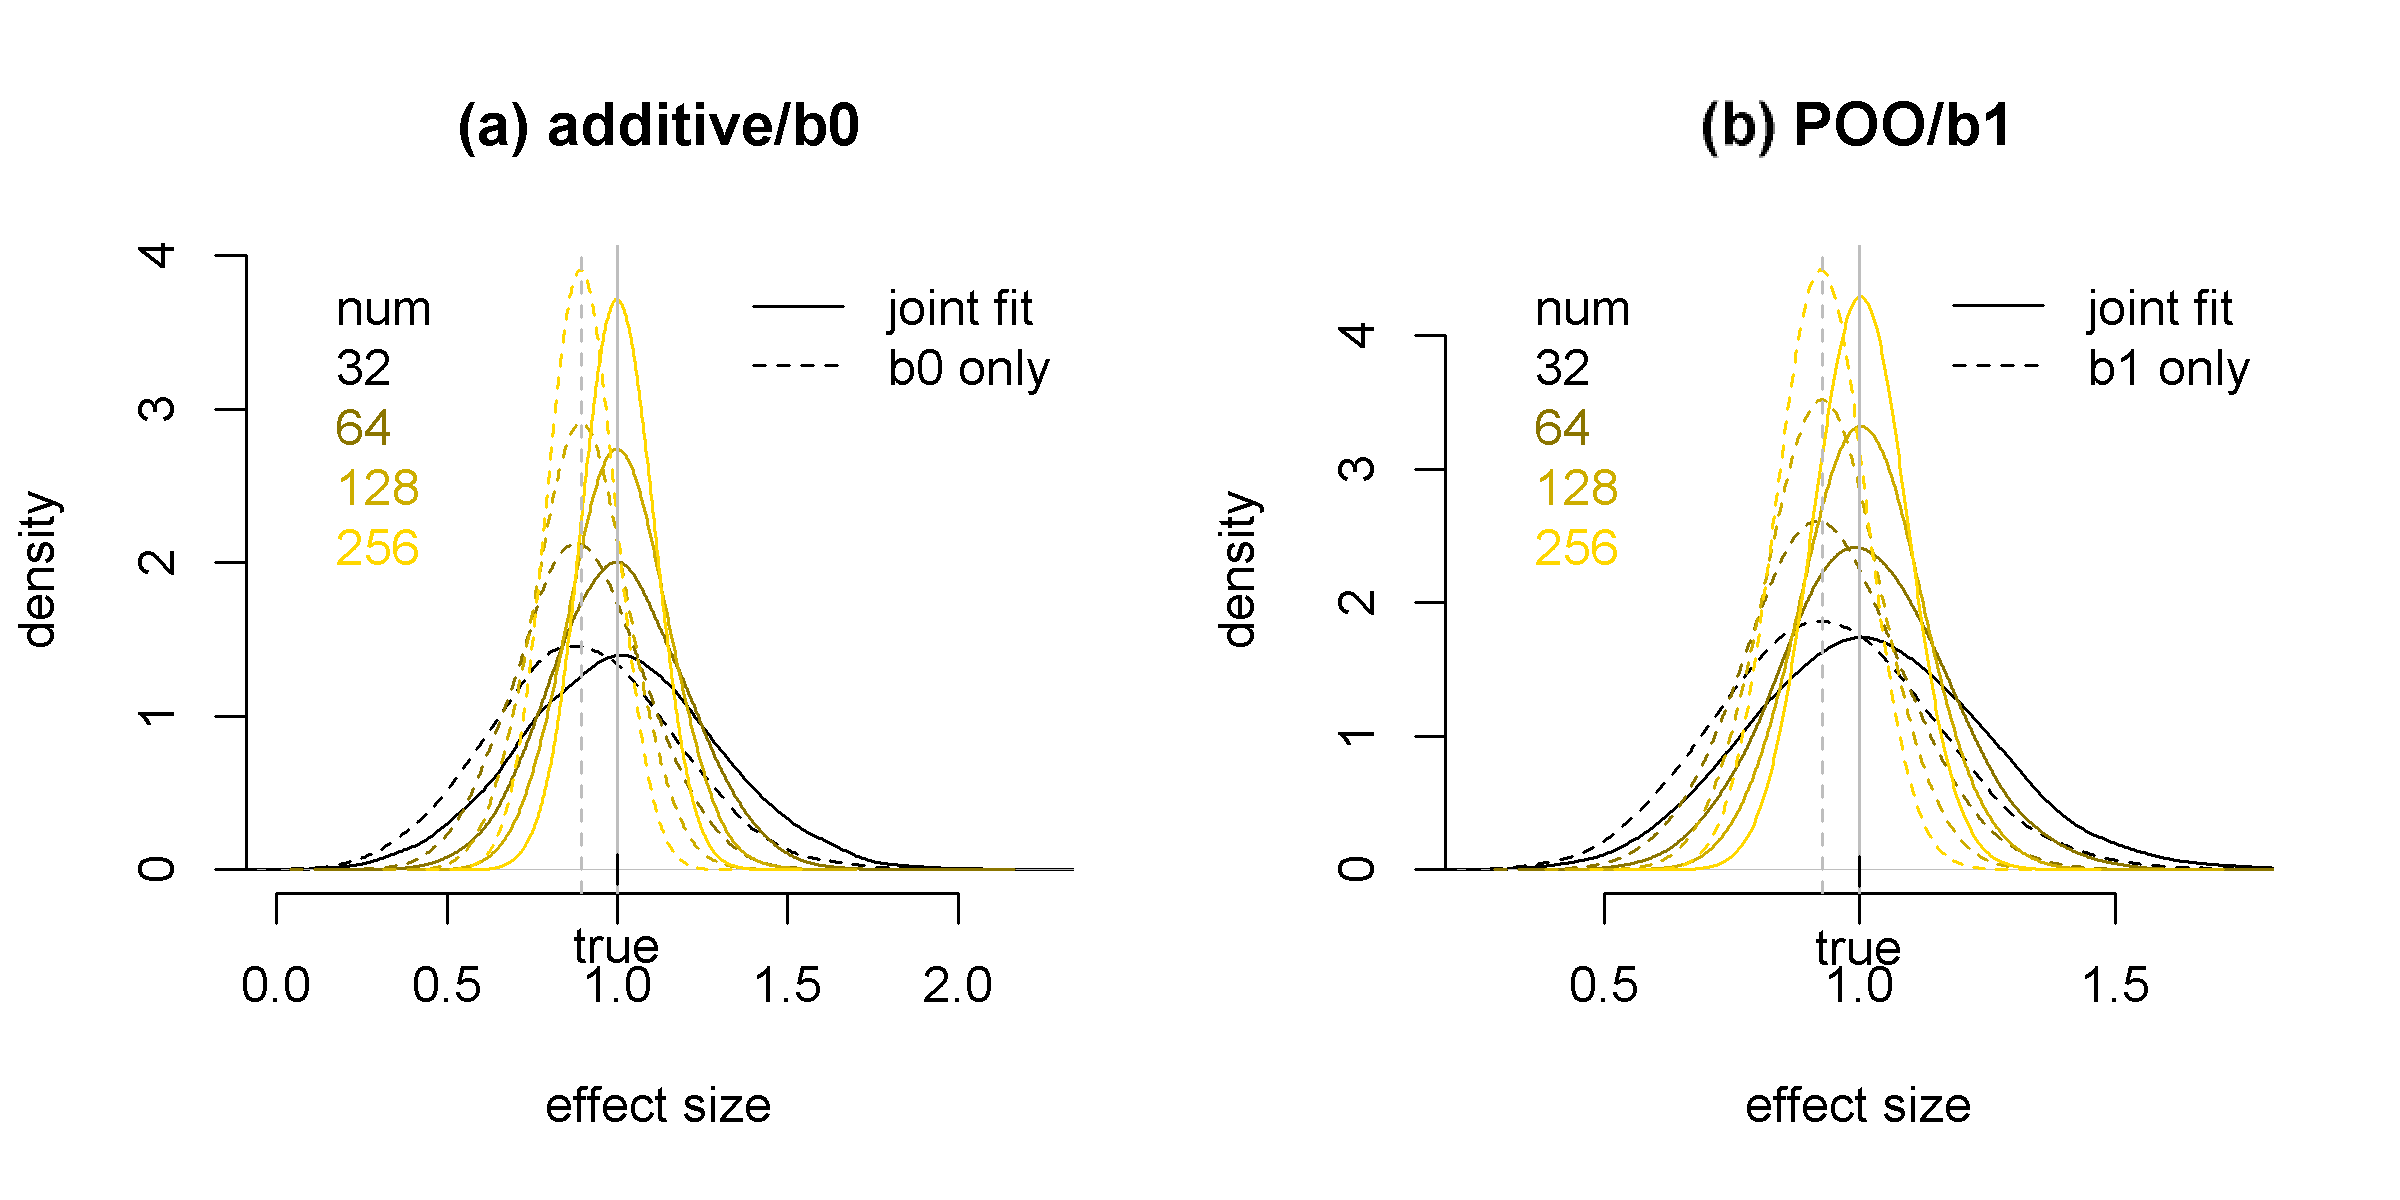 Figure 3
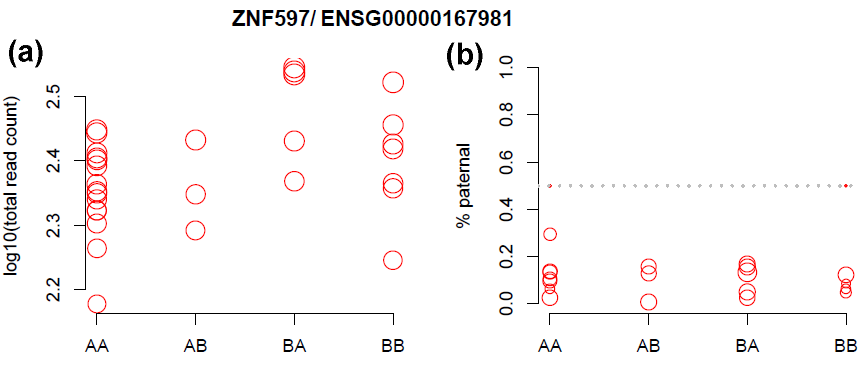 Figure 4
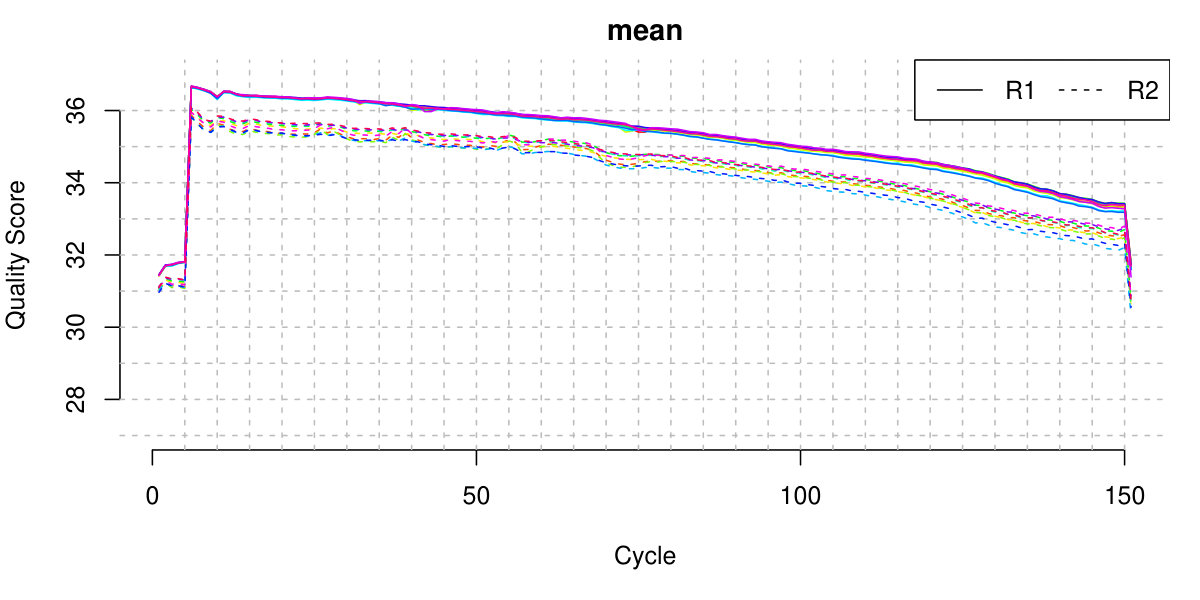 Figure 5
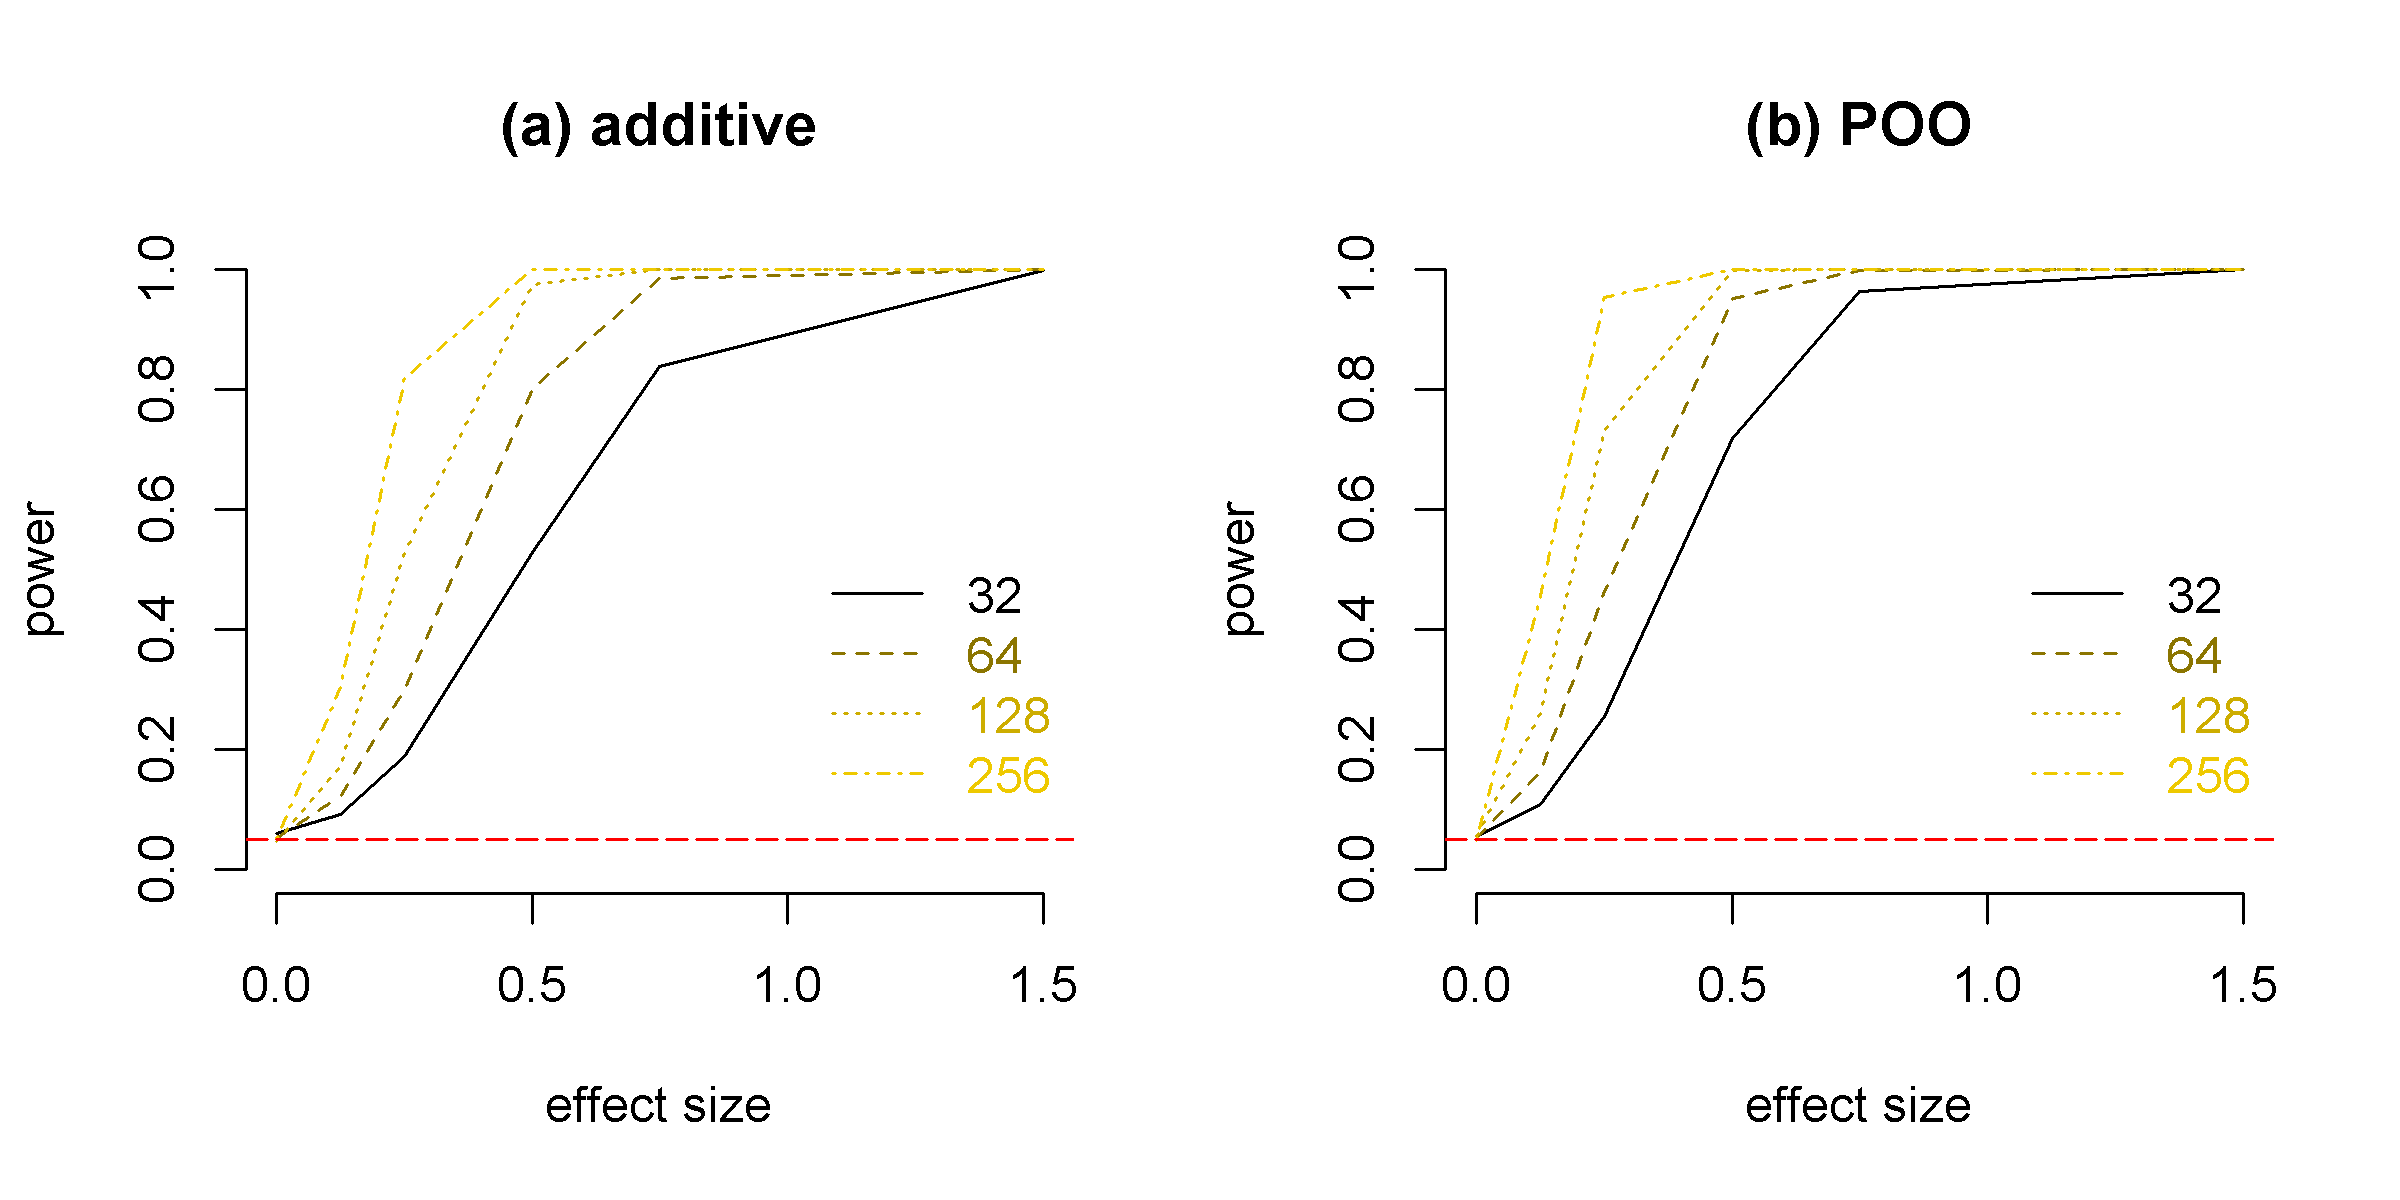 Figure 6
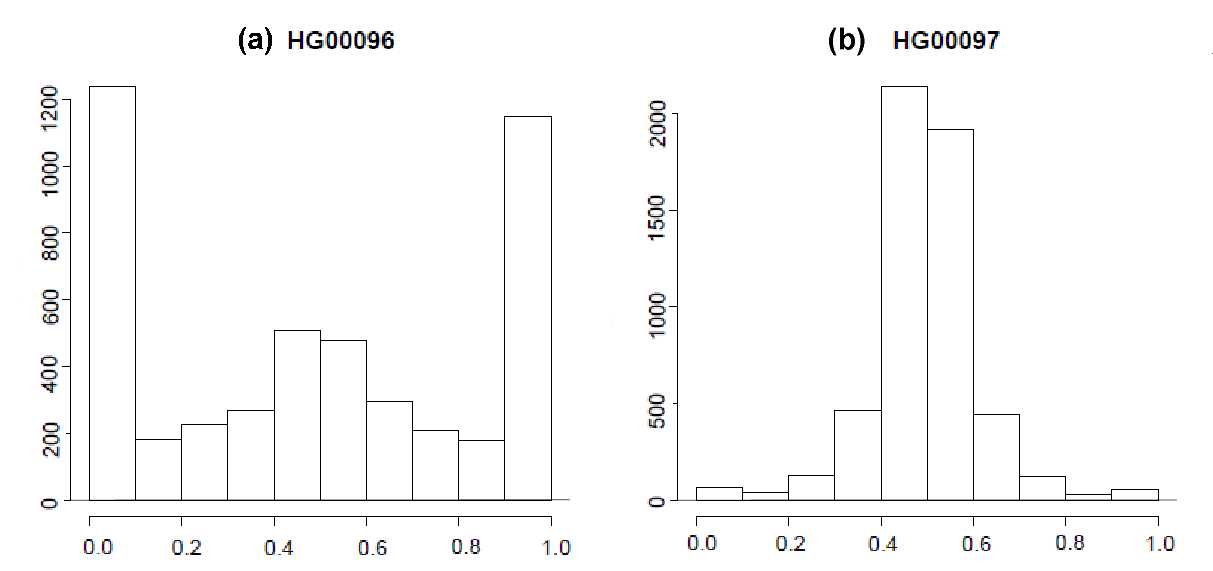 Figure 7
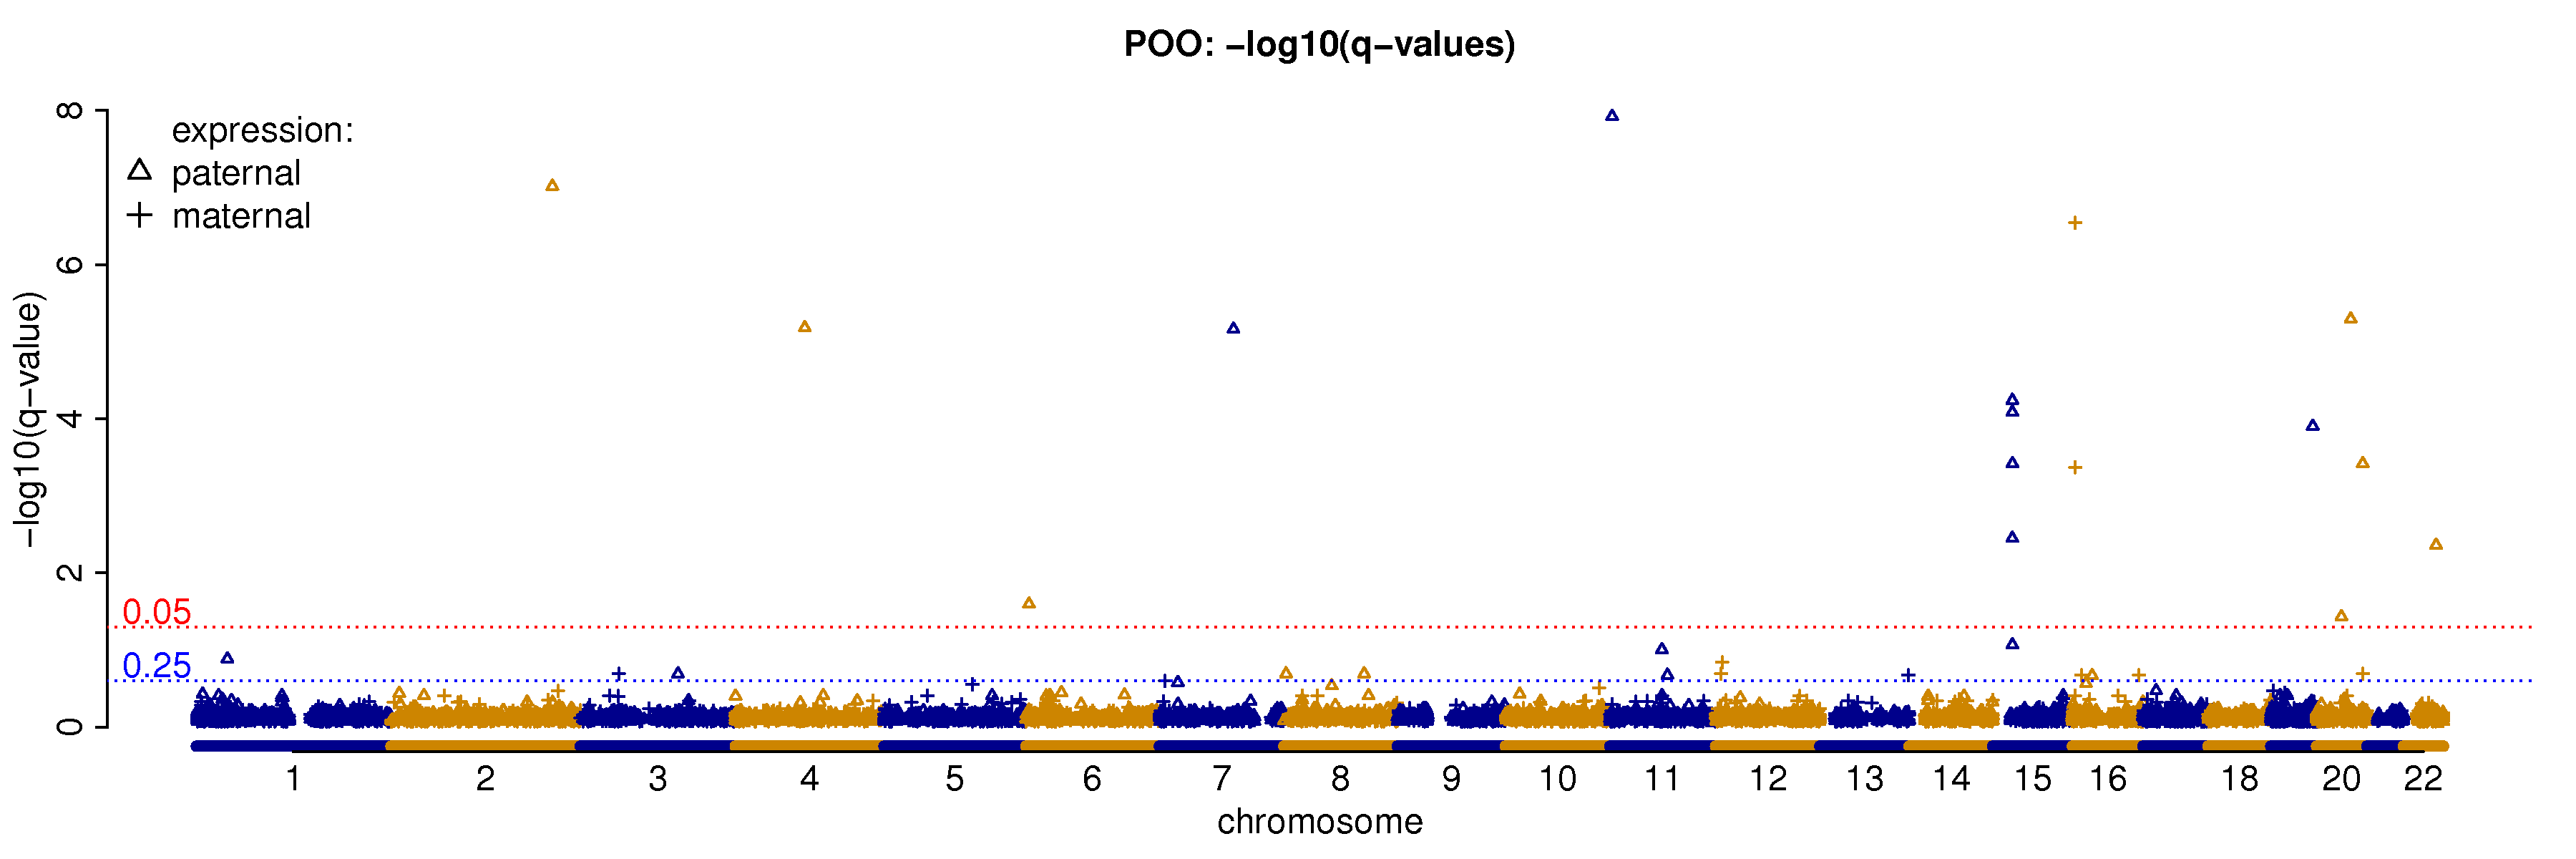 Figure 8
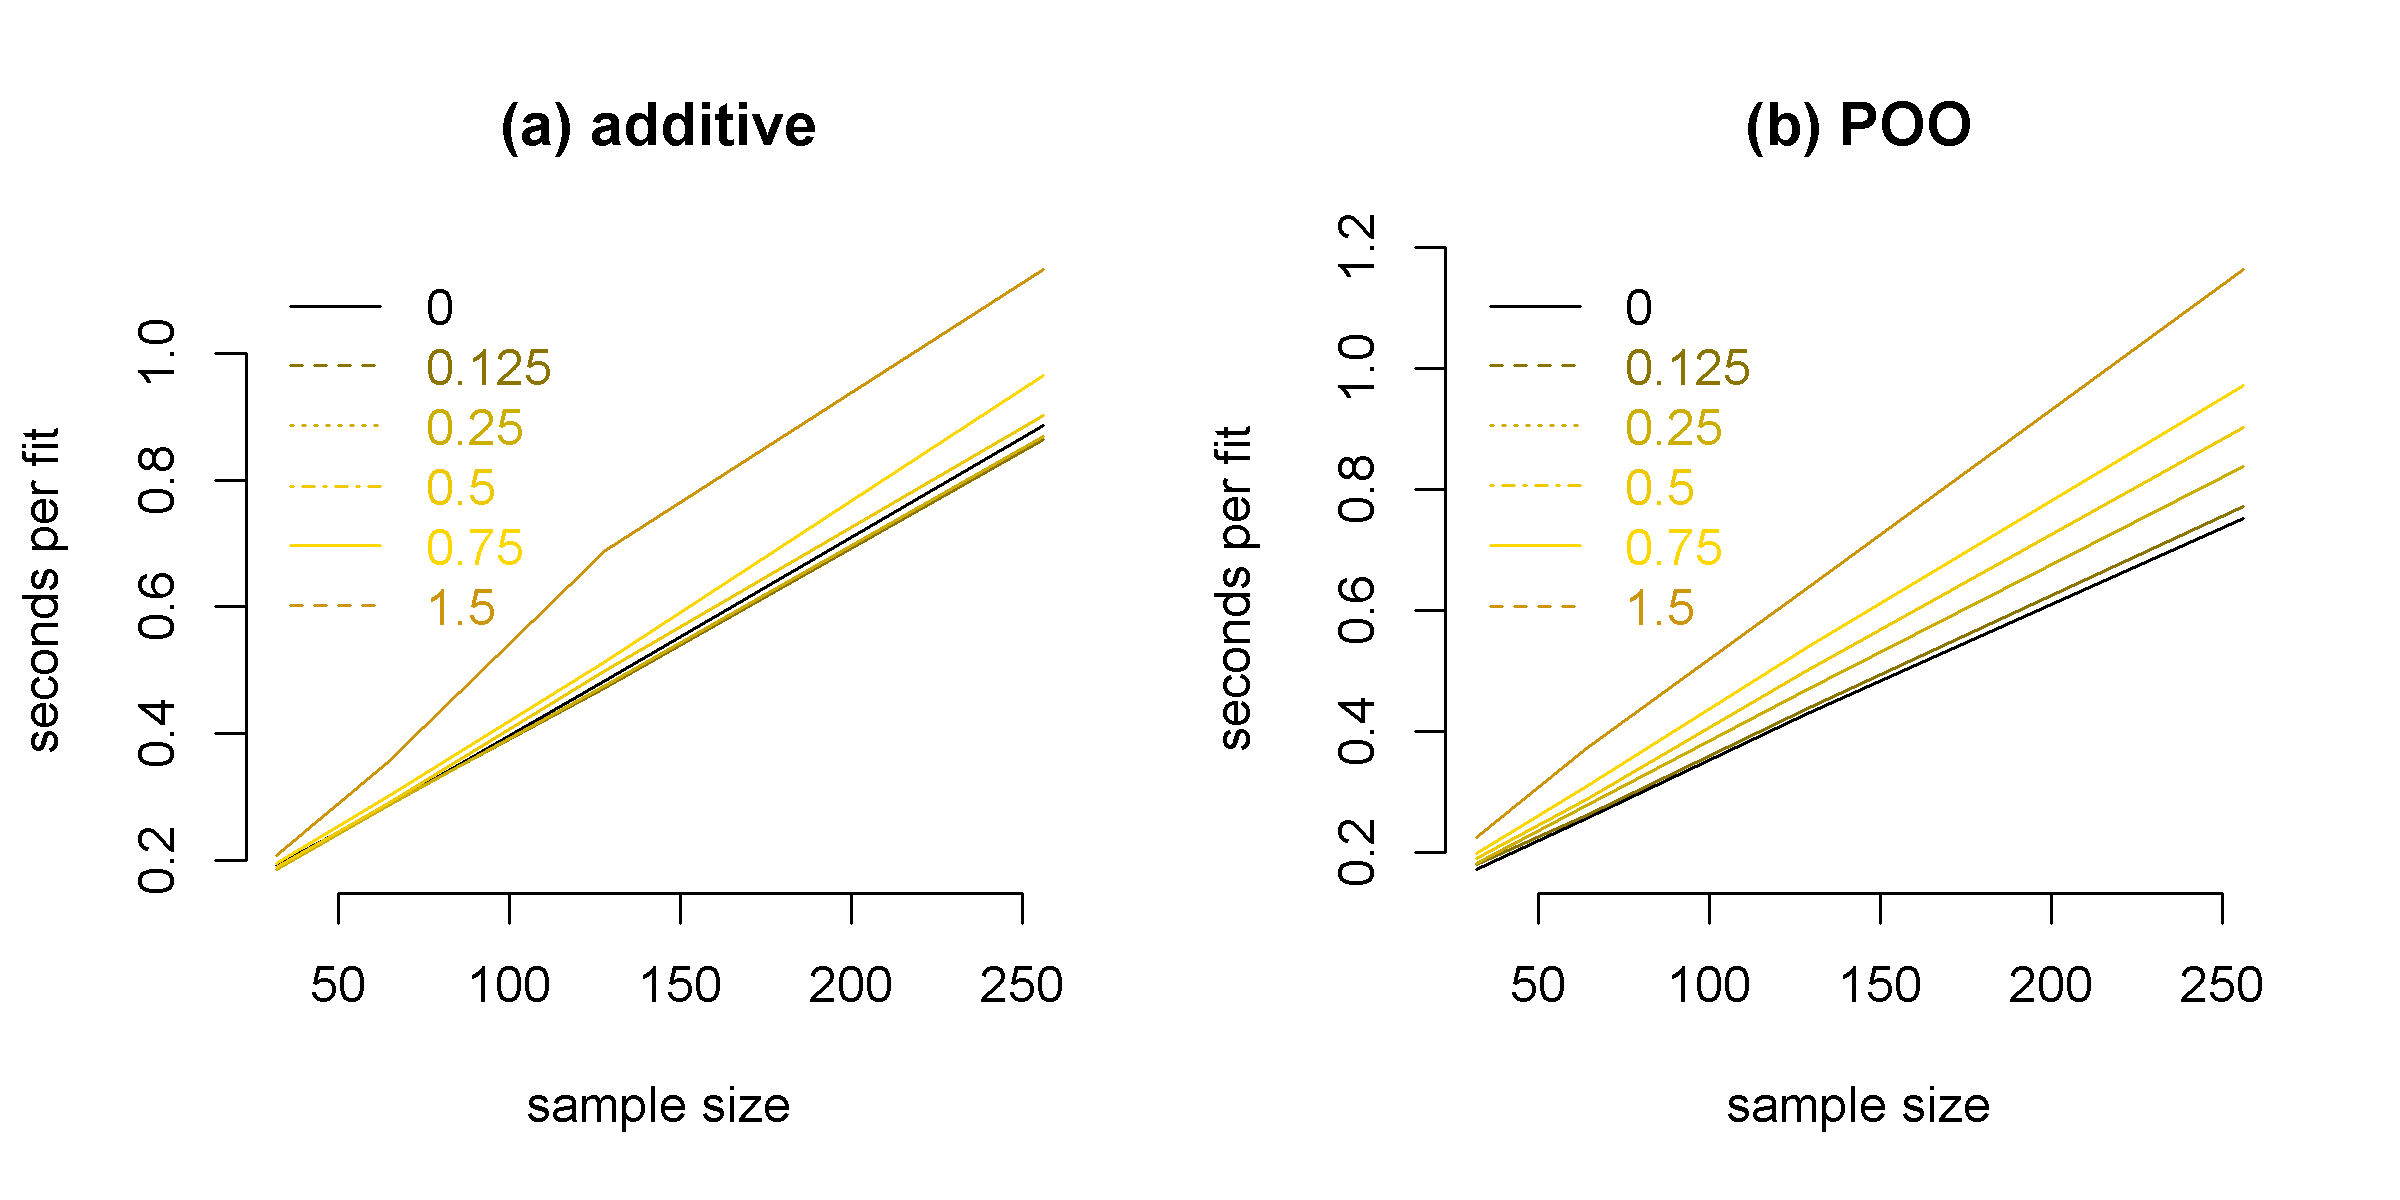 Figure 9
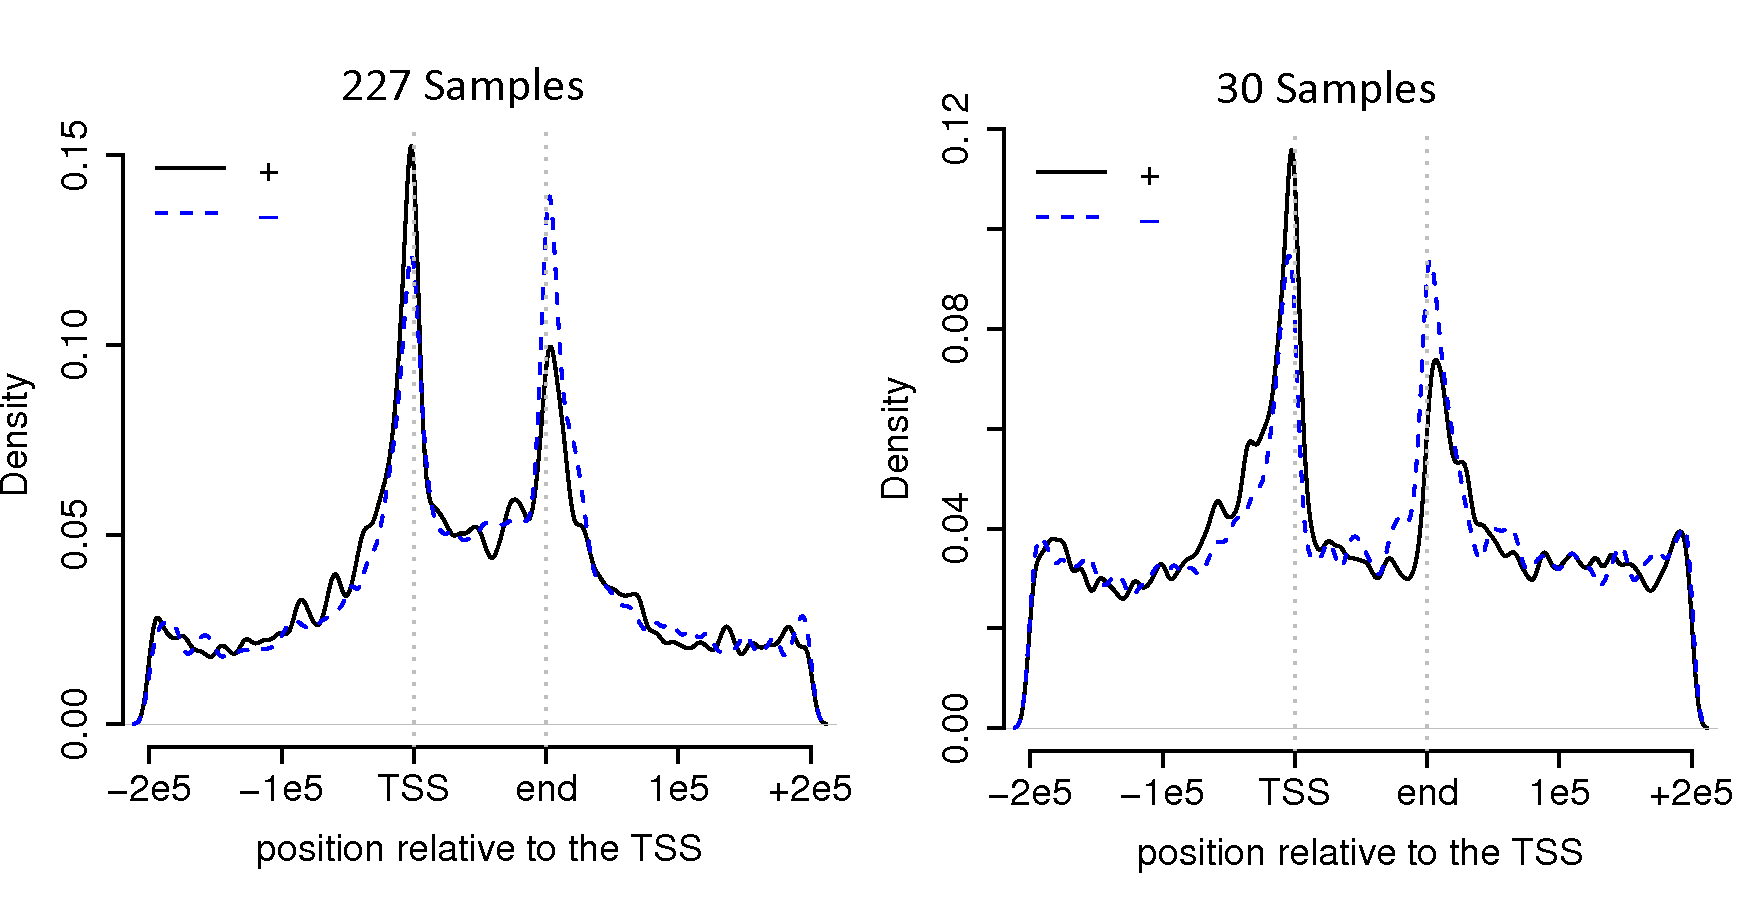 Figure 10
| Parameters | Genetic | Parent of Origin | |||||
|---|---|---|---|---|---|---|---|
| Joint | Negative | Beta | Joint | Negative | Beta | ||
| Model | Binomial | Binomial | Model | Binomial | Binomial | ||
| 0.00 | 0.00 | 0.06 | 0.11 | 0.07 | 0.06 | 0.12 | 0.07 |
| 0.13 | 0.13 | 0.09 | 0.12 | 0.08 | 0.11 | 0.11 | 0.10 |
| 0.25 | 0.25 | 0.19 | 0.14 | 0.11 | 0.27 | 0.11 | 0.18 |
| 0.50 | 0.50 | 0.53 | 0.21 | 0.21 | 0.72 | 0.12 | 0.46 |
| 0.75 | 0.75 | 0.83 | 0.32 | 0.33 | 0.96 | 0.14 | 0.76 |
| 1.50 | 1.50 | 1.00 | 0.76 | 0.49 | 1.00 | 0.39 | 0.93 |
| ID | Name | q-value | Expression | Is Known |
|---|---|---|---|---|
| ENSG00000269821 | KCNQ1OT1 | 1.2e-08 | paternally | yes |
| ENSG00000204186 | ZDBF2 | 9.6e-08 | paternally | yes |
| ENSG00000167981 | ZNF597 | 2.9e-07 | maternally | yes |
| ENSG00000185513 | L3MBTL1 | 5.1e-06 | paternally | yes |
| ENSG00000177432 | NAP1L5 | 6.6e-06 | paternally | yes |
| ENSG00000242265 | PEG10 | 6.9e-06 | paternally | yes |
| ENSG00000257151 | PWAR6 | 5.8e-05 | paternally | no |
| ENSG00000224078 | SNHG14 | 8.2e-05 | paternally | no |
| ENSG00000130844 | ZNF331 | 1.2e-04 | paternally | no |
| ENSG00000261069 | RP11-701H24.4 | 3.8e-04 | paternally | no |
| ENSG00000225806 | RP1-309F20.3 | 3.8e-04 | paternally | no |
| ENSG00000122390 | NAA60 | 4.3e-04 | maternally | yes |
| ENSG00000128739 | SNRPN | 3.6e-03 | paternally | yes |
| ENSG00000100138 | SNU13 | 4.4e-03 | paternally | no |
| ENSG00000145945 | FAM50B | 2.5e-02 | paternally | yes |
| ENSG00000101898 | MCTS2P | 3.7e-02 | paternally | yes |
| ENSG000002791921 | PWAR5 | 8.6e-02 | paternally | no |
| ENSG000001748512 | YIF1A | 9.9e-02 | paternally | no |
| ENSG000001821091 | RP11-69E11.4 | 1.3e-01 | paternally | no |
| ENSG000001718471 | FAM90A1 | 1.5e-01 | maternally | no |
| ENSG000000827811 | ITGB5 | 2e-01 | paternally | no |
| ENSG000001780571 | NDUFAF3 | 2e-01 | maternally | no |
| ENSG000002543191 | RP11-134O21.1 | 2e-01 | paternally | no |
| ENSG000002536332 | KB-1980E6.3 | 2e-01 | paternally | no |
| ENSG000001116781 | C12orf57 | 2e-01 | maternally | no |
| ENSG00000101160 | CTSZ | 2e-01 | maternally | no |
| ENSG000000549672 | RELT | 2.1e-01 | paternally | no |
| ENSG000001262262 | PCID2 | 2.1e-01 | maternally | no |
| ENSG00000135709 | KIAA0513 | 2.1e-01 | maternally | no |
| ENSG00000175643 | RMI2 | 2.1e-01 | maternally | no |
| ENSG000002621551 | RP11-266L9.5 | 2.2e-01 | paternally | no |
| q-value | q-value | |||
|---|---|---|---|---|
| chr | pat/tot | p-value | pat/tot | p-value |
| 1 | 1/1 | 7/11 | 0.36 | |
| 2 | 1/1 | 5/11 | 1.00 | |
| 3 | 1/2 | 2/6 | 0.68 | |
| 4 | 1/1 | 6/7 | 0.06 | |
| 5 | 0/0 | 1/8 | 0.06 | |
| 6 | 1/1 | 5/8 | 0.49 | |
| 7 | 1/1 | 3/5 | 0.68 | |
| 8 | 2/2 | 5/8 | 0.49 | |
| 9 | 0/0 | 1/1 | ||
| 10 | 0/0 | 2/6 | 0.68 | |
| 11 | 3/3 | 5/10 | 1.00 | |
| 12 | 0/2 | 1/8 | 0.06 | |
| 13 | 0/1 | 0/4 | ||
| 14 | 0/0 | 5/10 | 1.00 | |
| 15 | 5/5 | 0.29 | 7/8 | 0.03 |
| 16 | 1/5 | 0.02 | 3/11 | 0.21 |
| 17 | 0/0 | 5/8 | 0.49 | |
| 18 | 0/0 | 2/3 | ||
| 19 | 1/1 | 5/11 | 1.00 | |
| 20 | 3/4 | 5/8 | 0.49 | |
| 21 | 0/0 | 0/0 | ||
| 22 | 1/1 | 1/3 | ||
| 12386 | 531735 | 508232 | 7551 | 15424873 | 6.7% | 0.05% | Nov |
| 07349 | 1170915 | 1216844 | 17937 | 36471875 | 6.5% | 0.05% | Nov |
| 10855 | 549410 | 553054 | 9853 | 16920863 | 6.5% | 0.06% | Nov |
| 10856 | 614655 | 619313 | 10258 | 19030106 | 6.5% | 0.05% | Nov |
| 10857 | 573787 | 589056 | 9100 | 17933576 | 6.5% | 0.05% | Nov |
| 10860 | 526271 | 518571 | 8804 | 18122047 | 5.8% | 0.05% | Nov |
| 10864 | 601558 | 612843 | 9985 | 19123476 | 6.4% | 0.05% | Nov |
| 12335 | 726865 | 664370 | 10215 | 20396307 | 6.8% | 0.05% | Nov |
| 12344 | 575986 | 567731 | 8277 | 18256805 | 6.3% | 0.05% | Nov |
| 12376 | 580297 | 581345 | 9352 | 18093944 | 6.4% | 0.05% | Nov |
| 10831 | 687568 | 683270 | 7854 | 21967310 | 6.2% | 0.04% | Dec |
| 10837 | 808867 | 810355 | 9829 | 23568960 | 6.9% | 0.04% | Dec |
| 10839 | 646210 | 638965 | 6174 | 19480573 | 6.6% | 0.03% | Dec |
| 10840 | 770903 | 767830 | 9354 | 23016699 | 6.7% | 0.04% | Dec |
| 10845 | 700172 | 683873 | 7286 | 20112291 | 6.9% | 0.04% | Dec |
| 10861 | 645650 | 655743 | 8762 | 18791340 | 6.9% | 0.05% | Dec |
| 12707 | 691861 | 770957 | 7185 | 21231491 | 6.9% | 0.03% | Dec |
| 12740 | 886096 | 898011 | 10693 | 25241951 | 7.1% | 0.04% | Dec |
| 12766 | 727328 | 751223 | 8373 | 21859216 | 6.8% | 0.04% | Dec |
| 12767 | 686563 | 678695 | 7300 | 21279339 | 6.4% | 0.03% | Dec |
| 10847 | 110414 | 108922 | 1086 | 5236664 | 4.2% | 0.02% | Jan |
| 10851 | 104600 | 103799 | 1099 | 4431665 | 4.7% | 0.02% | Jan |
| 12752 | 117984 | 125960 | 1333 | 6632011 | 3.7% | 0.02% | Jan |
| 12753 | 196200 | 200245 | 1841 | 9581273 | 4.1% | 0.02% | Jan |
| 12801 | 101874 | 99410 | 908 | 5246099 | 3.8% | 0.02% | Jan |
| 12802 | 172863 | 169508 | 1659 | 7640589 | 4.5% | 0.02% | Jan |
| 12818 | 146227 | 145745 | 1612 | 6461376 | 4.5% | 0.02% | Jan |
| 12832 | 154141 | 165334 | 1668 | 6917632 | 4.6% | 0.02% | Jan |
| 12864 | 117679 | 118731 | 1038 | 5389998 | 4.4% | 0.02% | Jan |
| 12877 | 111281 | 109520 | 1012 | 5203301 | 4.2% | 0.02% | Jan |
Peer Reviews
No public reviews on file for this paper yet. If you reviewed it on a platform where reviews are public (OpenReview, ICLR, NeurIPS, ICML), you can paste yours below so the community can read it here.
Videos
No videos yet. Explain this paper in a talk, walkthrough, or lecture? Add one.
Taxonomy
TopicsGenetic Syndromes and Imprinting
\pagerange
Joint estimation of genetic and parent-of-origin effects using RNA-seq data from human–LABEL:lastpage
\artmonthOctober
Joint estimation of genetic and parent-of-origin effects using RNA-seq data from human
Vasyl Zhabotynsky
Department of Biostatistics
University of North Carolina at Chapel Hill
Chapel Hill
North Carolina
U.S.A
Wei Sun\[email protected]
Public Health Sciences Division
Fred Hutchinson Cancer Research Center
Seattle
Washington
U.S.A
Kaoru Inoue
Department of Pharmacology
University of North Carolina at Chapel Hill
Chapel Hill
North Carolina
U.S.A
Terry Magnuson
Department of Genetics
University of North Carolina at Chapel Hill
Chapel Hill
North Carolina
U.S.A
Mauro Calabrese
Department of Pharmacology
University of North Carolina at Chapel Hill
Chapel Hill
North Carolina
U.S.A
(2016)
Abstract
RNA sequencing allows one to study allelic imbalance of gene expression, which may be due to genetic factors or genomic imprinting. It is desirable to model both genetic and parent-of-origin effects simultaneously to avoid confounding and to improve the power to detect either effect. In a study of experimental cross, separation of genetic and parent-of-origin effects can be achieved by studying reciprocal cross of two inbred strains. In contrast, this task is much more challenging for an outbred population such as human population. To address this challenge, we propose a new framework to combine experimental strategies and novel statistical methods. Specifically, we propose to collect genotype data from family trios as well as RNA-seq data from the children of family trios. We have developed a new statistical method to estimate both genetic and parent-of-origin effects from such data sets. We demonstrated this approach by studying 30 trios of HapMap samples. Our results support some of previous finding of imprinted genes and also recover new candidate imprinted genes.
keywords:
RNA-seq; imprinting; allele-specific expression; expression Quantitative Trait Loci (eQTL)
1 Introduction
By combining RNA-seq data and phased genotype of a diploid genome, one can estimate allele-specific expression (ASE). Allelic imbalance of gene expression (i.e., the ASE of the two alleles are different) may be controlled by genetic factors or genomic imprinting. Genetic loci that affect gene expression variation are often referred to as gene expression quantitative trait loci (eQTLs). Sophisticated statistical methods have been developed to identify eQTLs using both ASE and total expression (sun2012asSeq; sun2013eqtl; hu2015proper). Genomic imprinting is a phenomenon in which the expression of a gene depends whether an allele has maternal or paternal origin. Some genes are (completely) imprinted in the sense that they are exclusively expressed from one of the two parental alleles. However, recent studies have shown that many genes are partially imprinted, i.e., both alleles are expressed while the allele from one parent has higher expression the other allele (crowley2015analyses). Although only a small percentage of human genes are (completely or partially) imprinted, studying of imprinting is of great importance for at least two reasons. First, the imprinted genes play important roles in many common diseases such as obesity or psychiatric disorders (peters2014role). Second, genomic imprinting is also a great model to study epigenetic regulation of gene expression (barlow2011genomic).
It is important to jointly estimate genetic and parent-of-origin effects on allelic imbalance of gene expression in order to avoid confounding of these two factors and to improve the power to detect either effect. This goal can be achieved by studying RNA-seq data from reciprocal cross of two inbred strains, e.g., F1 mouse population (zou2014novel; crowley2015analyses). Specifically, denote two inbred strains by and , a reciprocal cross refers to two crosses and . Following standard naming convention, a cross is written as maternal strain paternal strain, and thus in a cross , is the maternal strain and is the paternal strain. To make it more clear, we write the two crosses as and , where the superscript indicates maternal or paternal origin. In one cross , if the expression of allele is larger than allele, it is not clear whether it is due to genetic effect (i.e., allele to higher expression) or parent-of-origin effect (i.e., the maternal allele has higher expression). However, given a reciprocal cross, such confounding can be resolved.
In an outbred population such as the human population, separation of genetic and parent-of-origin effect becomes much more challenging. Previous studies have employed genotyping arrays to assess allelic imbalance using both RNA and genomic DNA (gDNA) samples and identify potential imprinted genes if the degrees of allelic imbalance is significantly different between RNA and gDNA samples. Those potential imprinted genes are then screened using family pedigree (morcos2011genome) or experimental validation (barbaux2012genome). A more direct approach is to collect RNA-seq data from the children of family trios (a family trio includes both parents and one child) and collect genotype data from all three family members of each trio. The genotype can be phased and imputed to a larger number of SNPs. Then ASE can be quantified based on phased genotype data. In this work, we developed a new statistical method to separate genetic and parent-of-origin effect while jointly modeling ASE and total read count (TReC) across a group of family trios.
2 Method
We assume genetic effects can be captured by a small number of cis-acting eQTLs. Here we define cis-eQTLs as those eQTLs that influence allelic-imbalance of gene expression (sun2013eqtl). This assumption can be justified by the following rationales. First, by definition, only cis-acting eQTLs are relevant for ASE study. Second, the number of cis-acting eQTLs is limited because most cis-acting eQTLs are local eQTLs that are close to the gene of interest, and due to linkage dis-equilibrium (LD) structure around a gene, the number of independent cis-eQTLs of a gene is relatively small. In the following, we assume there is only one cis-eQTL to simplify the discussion. Our method can be easily extended to the cases with multiple cis-eQTLs.
2.1 Allele specific read counts (ASReCs)
To simplify the notation, we assume the haplotypes connecting a candidate eQTL and the gene of interest are known. Let and be the two haplotypes of a gene of interest in the -th individual (for ), and let the and be the allele-specific read counts of these haplotypes and , respectively. Let . Denote the two alleles of the candidate eQTL as and , and denote its genotype in the -th individual as . We assign different meanings to genotypes and such that means haplotypes and harbor the and alleles, respectively, and means haplotypes and harbor the and , respectively. We model by a beta-binomial distribution (denoted by ):
[TABLE]
where is over-dispersion parameter, and and are defined as follows:
[TABLE]
[TABLE]
2.2 Total read counts (TReCs)
The TReC of the gene of interest in the -th individual, denoted by , is modeled by a negative binomial distribution with mean and over-dispersion parameter , denoted by . We can write the mean structure for negative binomial distribution as:
[TABLE]
where , , is the regression coefficient for the -th covariate (e.g., age, gender, batch effects). is defined as:
[TABLE]
Note that the additive genetic and parent-of-origin effects are parametrized by and , which are the same as the and in equation (1) for allele-specific read counts.
2.3 Joint likelihood
The joint likelihood of total read count (TReC) and allele-specific read count (ASReC) is
[TABLE]
where . In this model we assume common genetic and parent-of-origin effect for TReC and ASReC. We test the genetic and parent-of-origin effects by testing whether or equals to 0, respectively, with the likelihood ratio test.
2.4 Optimization Algorithm
For a given initial values for non-linear terms (, , , ), our optimization algorithm includes the following steps.
Step 1: Optimize linear terms given the initial values of non-linear terms:
[TABLE]
where is a diagonal matrix.
Step 2: Iteratively estimate and . Note that the following two steps are redundant, but improves the robustness of the algorithm.
Optimize and together using BFGS method. 2. 2.
Optimize and separately using Brent algorithm.
Step 3: optimize over-dispersion parameter and separately using Brent algorithm. For stability we limit range of over-dispersion to be between and .
Step 4: If likelihood change is larger than a small number , go to step 1, otherwise finish the estimation process.
3 Simulations
We simulated ASE and TReC from the model described by joint likelihood in equation (3). We chose the smallest sample size to be 32, which is similar to the sample size we have for real data analysis. To demonstrate the asymptotic properties, we also simulated data of larger sample sizes of 64, 128, and 256. We set the over-dispersion parameters for beta-binomial () and negative binomial () distributions to be 1/4, and 4/3, respectively, which are fairly typical in real data. We further scale the expected counts so that mean total read count was about 250. We set the proportion of counts that are allele-specific to be 10% which is reasonably close to observed value in our real data.
Our simulation results show that the estimates of and from our method are unbiased. In contrast, if a model is fit with only genetic or parent-of-origin effect while in fact both effects are present, the parameter estimates have significant bias (Figure 1).
We also compared the type I error and the power of our joint model versus naive fit using function to fit Negative-Binomial model using total read counts only and function to fit Beta-Binomial model using allele specific counts only. As shown in Table 1, the simple models don’t control type I error as well as the joint model and that the joint model has higher power to detect both genetic and parent-of-origin effects.
The statistical power of the joint model is illustrates in Figure 2. Even at sample size of 32, our method has around 80% of power to detect either genetic or parent-of-origin effect at two-fold change, which corresponds to effect size . The power to detect parent-of-origin effect is higher than the power to detect genetic effect. This is because the ASE of all samples can be used to quantify parent-of-origin effect (i.e., comparing paternal vs. maternal allele). In contrast, ASE can be used to quantify genetic effect only if the genotype of the candidate eQTL is heterozygous, which only happen in a subset of the samples.
The computational time of our method scales well with the sample size. The time per gene remains under a second for sample sizes under 200 individuals: see Figure 6 in Supplementary Materials .
4 Application
4.1 Data collection
We collected RNA-seq data from 30 HapMap CEU (Caucasian) samples (15 males + 15 females). All of these samples are children of family trios, where the genotypes/haplotypes of three family members have been reported in the HapMap project, and their lymphoblastoid cell lines are available through Coriell (http://www.coriell.org/). For most of these samples, the RNA reads were 150 bp paired-end reads, with an additional smaller run of 75 bp paired-end reads. The median of the total number of reads for these 30 samples is about 20 million. These reads were mapped to hg38 human reference genome using Tophat2. Hapmap project genotyped about 3.9 million SNPs for these 30 trios. We phased and imputed the genotypes of these 30 trios using shapeit2 (shapeit2) and impute2 (howie2012fast), against 1000 Genome reference panel containing 2,504 individuals with 82 million SNPs. Finally, based on phased and imputed genotype, we extracted allele-specific reads (i.e., those RNA-seq reads that overlap with at least one heterozygous SNP), and counted the number of allele-specific reads for each haplotype of a gene.
4.2 Identification of candidate cis-eQTLs
The parents of these 30 HapMap family trios are part of the samples included in the 1000 Genomes project (10002012integrated). To improve the power and precision for eQTL mapping, we first mapped cis-acting eQTLs using the Caucasian samples of the 1000 Genome Project. Then given the eQTLs, we jointly estimated genetic and parent-of-origin effects in the 30 children of HapMap trios. We downloaded fastq files for 462 samples from the Geuvadis consortium (lappalainen2013transcriptome). We mapped all the reads to hg38 reference, and then performed the same process of phasing and imputation of the genotypes of these samples. Then we calculated total read counts and allele-specific read counts per gene and per sample. After filtering out non-European samples as well as samples with low quality in terms of systematic bias of allele-specific expression (see section A.9 in Supplementary Materials for details), we performed eQTL mapping for 227 samples using the TReCASE method (hu2015proper). For each gene, we identified one candidate cis-acting eQTL by selecting the one with the smallest p-value. Note that some genes do not have any cis-acting eQTL because all the nearby SNPs show certain evidence of trans-acting eQTL, i.e., the eQTL genotype is associated with total expression, but not allele-specific expression. The eQTL effect sizes estimated from these 227 samples are consistent with the estimates from the 30 children of HapMap trios (see section B.1 in Supplementary Materials for details).
4.3 Identification of imprinted genes
We used our method to estimate genetic (eQTL) and imprinting effects for 12,386 genes in the 30 children of the family trios. These genes were selected because they had enough expression in the 30 samples and they had at least one candidate cis-eQTL based on eQTL mapping results from the 227 samples of 1000 Genome Project. For the negative binomial model of total read count (TReC), we fit our model with additional covariates to capture batch effect (the RNA-seq data were collected through 3 batches with 10 samples per batch) and read-depth. No additional covariate is needed for the analysis of allele-specific read counts (ASReC) because our model for ASE compared the expression of one allele versus another allele, and thus the effects of such covariates are canceled. We found 16 genes with significant imprinting effects at q-value cutoff 0.05 (Table 2).
Out of these 16 genes, 10 were known to be imprinted from previous studies and 6 were novel candidates for imprinting. For 14 of these 16 genes, the paternal allele had higher expression than the maternal allele. For all of those 10 known imprinted genes, our estimates of allelic imbalance agree with what were reported before. At a more liberal cutoff of q-value 0.25, we identified 15 additional candidates of imprinted genes. By manually examining the expression pattern of these 15 genes, we suggest that 9 of them missed the q-value cutoff 0.05 due to power - either because parent-of-origin effect was smaller (3 genes) or the number of allele-specific reads was small (6 genes). The other 6 are likely false discoveries, because there is no apparent pattern of allelic imbalance for one parental allele.
We illustrate the read count data of a clearly imprinted gene, ZNF497, which has higher expression on maternal allele (Figure 3).
The imprinting effect can be observed from both TReC and ASReC. We denote the genotype such as the first allele is maternal allele, i.e., genotype AB means A and B are from maternal and paternal allele, respectively. For TReC, the two groups with genotype AA and AB have similar expression because they share the same maternal allele and maternal allele has higher expression. Similarly, the two groups BA and BB have similar expression. The effect of imprinting is more apparent in allele-specific reads where we observe the proportion of reads from paternal allele is far below 50%.
We selected known imprinted genes based on the list reported by morison2005census or those genes recorded in the Geneimprint database (geneimprint2016). There is a total of 90 genes classified as imprinted. Out of those, 32 were expressed in our dataset and had a candidate eQTL. Of those 32 genes 10 were found to be significant (q-value 0.05) by our method. For several genes (such as RB1, KCNQ1, PEG3, and PLAGL1), we observed signal of imprinting, but the signal was too weak to produce significant q-value. In general, though, we observed that even for insignificant results, those with relatively smaller q-value tend to have estimated imprinting direction matched with the reported imprinting direction.
4.4 Locations of genes with parent-of-origin effect
The imprinted genes in mouse genome tend to form clusters. It is interesting to check whether this is true for human genome. Based on the findings from our study, the imprinted genes on chromosomes 15 and 16 form two clusters (Figure 4 and Table 3). However, the total number of imprinted genes is small and thus it is difficult to formally assess the statistical significance of such spatial clusters. On the other hand, while most imprinted genes have higher expression on the paternal allele, there is some variation at chromosome level. We can test whether the proportion of paternally imprinted (or equivalently maternally imprinted) genes is uniform across all chromosomes. In order to have enough genes for testing, we define potential imprinted genes at very liberal q-value cutoffs 0.25 or 0.5, and only consider the chromosomes with at least 2 imprinted genes. At q-value cutoff and , the p-values for Fisher’s exact test are and , respectively, suggesting that genes within one chromosome have more consistent pattern of parent-of-origin expression than expected by chance. Next, for each chromosome, we assess whether the proportion of paternally imprinted genes of this chromosome is different from all the other chromosomes. We performed a test only if there are at least 5 imprinted genes in a chromosome (Table 3). These formal tests confirm the clusters at chromosome 16 and 15, at imprinting q-value cutoff 0.25 and 0.5, respectively; although at the q-value cutoff 0.5, the p-value for chromosome 15 is not significant after multiple testing correction.
5 Discussion
We developed a systematic approach to jointly estimate genetic and parent-of-origin effect in human. Our results recovered about one third of known imprinted genes, and if we excluded genes with low expression and included weaker, but non-contradicting cases, there was a good overall consistency. None of the genes classified as “predicted imprinting” instead of “imprinting” in Geneimprint database were detected as high confidence in our short list. One possible reason is that most of these genes were selected based on a screening paper (luedi2007computational) and were false positives in that work. We also noted that for these “predicted imprinting” genes, the proportion of genes with predominantly paternal expression roughly 50%, while this proportion is about 68% (61/90) for known imprinting genes. Several imprinted genes that we found are non-coding RNAs, such as RP11-701H24.4 and RP1-309F20.3, which warrants further studies to elucidate the functional consequence if imprinted non-coding RNAs.
The raw RNA-seq data were submitted to NCI SRA database. The R package of our method will be submitted to CRAN and posted at http://research.fhcrc.org/sun/en/software.html.
Supplementary Materials
Web Appendix, referenced in Section 2-4, is attached below.
6 RNA-seq data of 30 children of HapMap family trios
6.1 Data collection and mapping
RNA-seq data were collected from 30 children of HapMap family trios (15 males + 15 females) in five runs: 10 individuals sequenced in November 2014 with 150 bp paired-end reads (batch 1), 10 sequenced twice in December 2014 with 150 bp paired-end reads (batch 2), and 10 sequenced twice in January 2015 with most of the reads sequenced with 150bp paired-end reads and another smaller run with 75 bp paired-end reads (batch 3). RNA-seq reads were mapped to hg38 reference assembly using TopHat v2 trapnell2009tophat, filtered with the following criteria: 3 read mismatches, read gap length 3, read edit distance 3, and read realign edit distance equals to 0.
6.2 Quality control
We further filtered RNA-seq reads with average base quality 30, mapping quality 20, and keeping only those uniquely mapped reads, by the prepareBAM function from R package asSeq. In a typical sample, most of the RNA-seq reads pass these filters. Figure 5 illustrates mean base quality for the first batch (November 2014).
6.3 Matching genotype coordinates to hg19
During phasing and imputation we worked with the reference panel mapped to hg19. Therefore the available genotype data was mapped to hg19 coordinates using liftover tool rhead2009ucsc. After phasing and imputation was done, the resulting SNPs were mapped to hg38 coordinates, because the RNAseq data were mapped to hg38.
6.4 Phasing
For this phasing step and the next imputation step, we used the 1000 Genome reference panel howie2011genotype (as of summer 2015) containing 2,504 individuals with 82 million SNPs. For the 90 individuals from 30 family trios, phasing was done using shapeit v.2. Family information of the 30 trios was used to improve the phasing accuracy. We started with 3.9 million SNPs of these 30 trios obtained from HapMap project, 1.3 million of which were filtered out due to following reasons: 30% of them were absent in the reference panel, 70% had mismatching information. Effective size of the population was set to the suggested value --effective-size 20000 and random seed was set to .
6.5 Imputation
The results of phasing can be directly used as input for impute2, with imputation done using the latest reference available at impute2 web page howie2009flexible. Imputation was done by splitting the genome into blocks of 5 Mb (no more than 7 Mb according to the instruction). We also used the same population size option as the one used in phasing step (-Ne 20,000), other options used: -align_by_maf_g and -seed 12345.
6.6 Creating the lists of heterozygous SNPs for each individual
We obtained the list of heterozygous SNPs for each sample from the results of imputation. The main output file (other files have additional extensions to the name as _haps, _allele_probs etc) has 3 columns with genotype probabilities per SNP. This file represents probability of observing respectively. We selected heterozygous locations (i.e. with high probability of ) to output phased genotypes of these locations.
6.7 Finding allele specific reads
Once we got a list of heterozygous SNPs, we extracted allele-specific reads for two haplotypes using R function extractASReads from R package asSeq sun2012asSeq. The extracted reads were saved in two additional bam files. We assigned the parent of origin of the two haplotypes based on how well they match the paternal and maternal haplotypes.
6.8 Gene level summarization
Finally, we summarized main bam file as well as the parent-specific bam files using R function summarizeOverlaps from R package GenomicAlignments lawrence2013software with option “mode = Union” and “yieldSize = 1,000,000”. Across all the 30 samples, the percentage of reads being allele-specific are consistent (Figure 6). Approximately of the reads can be classified as allele specific. Comparing with percent of allele-specific counts from unrelated population we conclude that having a family structure allowed to increase the percentage of allele-specific reads by about . Additionally we can see that the proportion of reads with conflicting haplotype information is quite low in all samples (Table 4).
6.9 Processing of 462 lymphoblastoid cell lines from the 1000 Genomes samples
A similar process as in previous subsections was applied on RNA-seq data of 462 lymphoblastoid cell lines from the 1000 Genomes lappalainen2013transcriptome: unrelated human lymphoblastoid cell line samples from the CEU, FIN, GBR, TSI and YRI populations (see E-GEUV-1 data link below) were sequenced with Illumina HiSeq2000 platform, with paired-end 75-bp reads. We mapped these reads to the hg38 reference with the same options as for original 30 individuals. To produce allele specific reads we started with 2,123 individuals of African or European descent with 2.2 million SNPs per individual produced by the Omni Array data originally from delaneau2012linear. Since African sub-population is quite different from Western European sub-population, we removed this sub-population and also removed samples, for which we observed many genes having extreme proportions of reads attributed to one haplotype - this is likely due to the fact of having a notable proportion of SNPs with problematic genotypes. Figure 7 shows typical samples we classify bad/good samples. A principal component analysis of total expression for the remaining 227 European samples suggested that western European individuals (CEU), which are the most comparable to our 30 samples, are also comparable to other sub-European populations. Thus we used these 227 samples for eQTL mapping.
7 eQTL analysis for 227 Caucasian samples from 1000 genome project
7.1 Comparing 227 Caucasian samples versus our 30 HapMap samples
We mapped cis-eQTLs using TReCASE model for the 227 Caucasian samples as well as our 30 samples (30 children of family trios). Figure 8 shows the location distribution of these cis-eQTLs relative to the transcription starting site of the corresponding genes. The distributions derived from the 227 Caucasian samples and our 30 samples are very similar.
In addition, the estimates of genetic effects using 227 individuals vs. 30 children at the same SNP (considering only SNPs declared significant at were also consistent (Figure 9).
8 Additional simulations
8.1 Timing
We define one model fit as the following. First fit a TReC only model with to obtain reasonable initial estimate of , and then fitting full TReCASE model estimating and , as well as two short models for additive genetic effect or parent-of-origin effect only. The computational time needed for one model fit (i.e., for one gene) is linearly dependent on sample size and increases for parameters being farther away from zero (Figure 10). For the sample size of around 200 the computation time is about 1 second per gene.
9 Software and Data
RNA-seq data from 1000G samples (E-GEUV-1 data) lappalainen2013transcriptome is available from http://www.ebi.ac.uk/arrayexpress/experiments/E-GEUV-1/samples/
Liftover rhead2009ucsc: https://genome.ucsc.edu/util.html
Shapeit v2 shapeit2: https://mathgen.stats.ox.ac.uk/genetics_software/shapeit/shapeit.html
IMPUTE v2 howie2009flexible: http://www.stats.ox.ac.uk/~marchini/software/gwas/gwas.html
1000 Genome Reference Panel howie2011genotype: https://mathgen.stats.ox.ac.uk/impute/impute_v2.html#reference
TopHat V2 trapnell2009tophat: https://ccb.jhu.edu/software/tophat/index.shtml
R/GenomicAlignments lawrence2013software: https://bioconductor.org/packages/release/bioc/html/GenomicAlignments.html
R/asSeq sun2012asSeq: http://research.fhcrc.org/sun/en/software/asSeq.html