Application of Finite Element, Phase-field, and CALPHAD-based Methods to Additive Manufacturing of Ni-based Superalloys
Trevor Keller, Greta Lindwall, Supriyo Ghosh, Li Ma, Brandon M. Lane,, Fan Zhang, Ursula R. Kattner, Eric A. Lass, Jarred C. Heigel, Yaakov Idell,, Maureen E. Williams, Andrew J. Allen, Jonathan E. Guyer, Lyle E. Levine

TL;DR
This study combines finite element, phase-field, and CALPHAD-based simulations to analyze microstructure formation and microsegregation during rapid solidification in laser powder bed fusion of Ni-based superalloys, validated by experimental data.
Contribution
It integrates multiple simulation methods to predict microstructure and segregation in additive manufacturing of Ni superalloys, providing insights validated by experiments.
Findings
Finite element thermal models match thermographic measurements.
Phase-field simulations agree with observed microstructures.
Microsegregation is less severe than DICTRA predictions.
Abstract
Numerical simulations are used in this work to investigate aspects of microstructure and microsegregation during rapid solidification of a Ni-based superalloy in a laser powder bed fusion additive manufacturing process. Thermal modeling by finite element analysis simulates the laser melt pool, with surface temperatures in agreement with in situ thermographic measurements on Inconel 625. Geometric and thermal features of the simulated melt pools are extracted and used in subsequent mesoscale simulations. Solidification in the melt pool is simulated on two length scales. For the multicomponent alloy Inconel 625, microsegregation between dendrite arms is calculated using the Scheil-Gulliver solidification model and DICTRA software. Phase-field simulations, using Ni-Nb as a binary analogue to Inconel 625, produced microstructures with primary cellular/dendritic arm spacings in agreement…
Click any figure to enlarge with its caption.
 Figure 1
 Figure 10
 Figure 2
 Figure 3
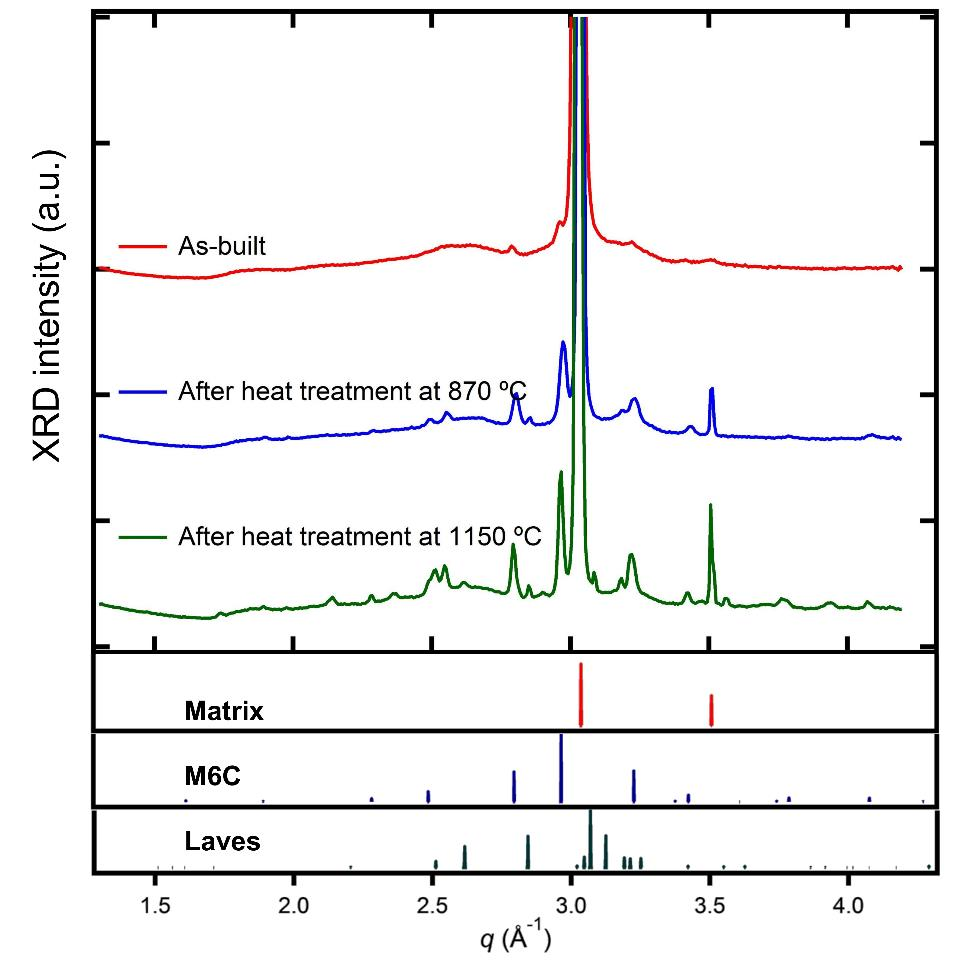 Figure 4
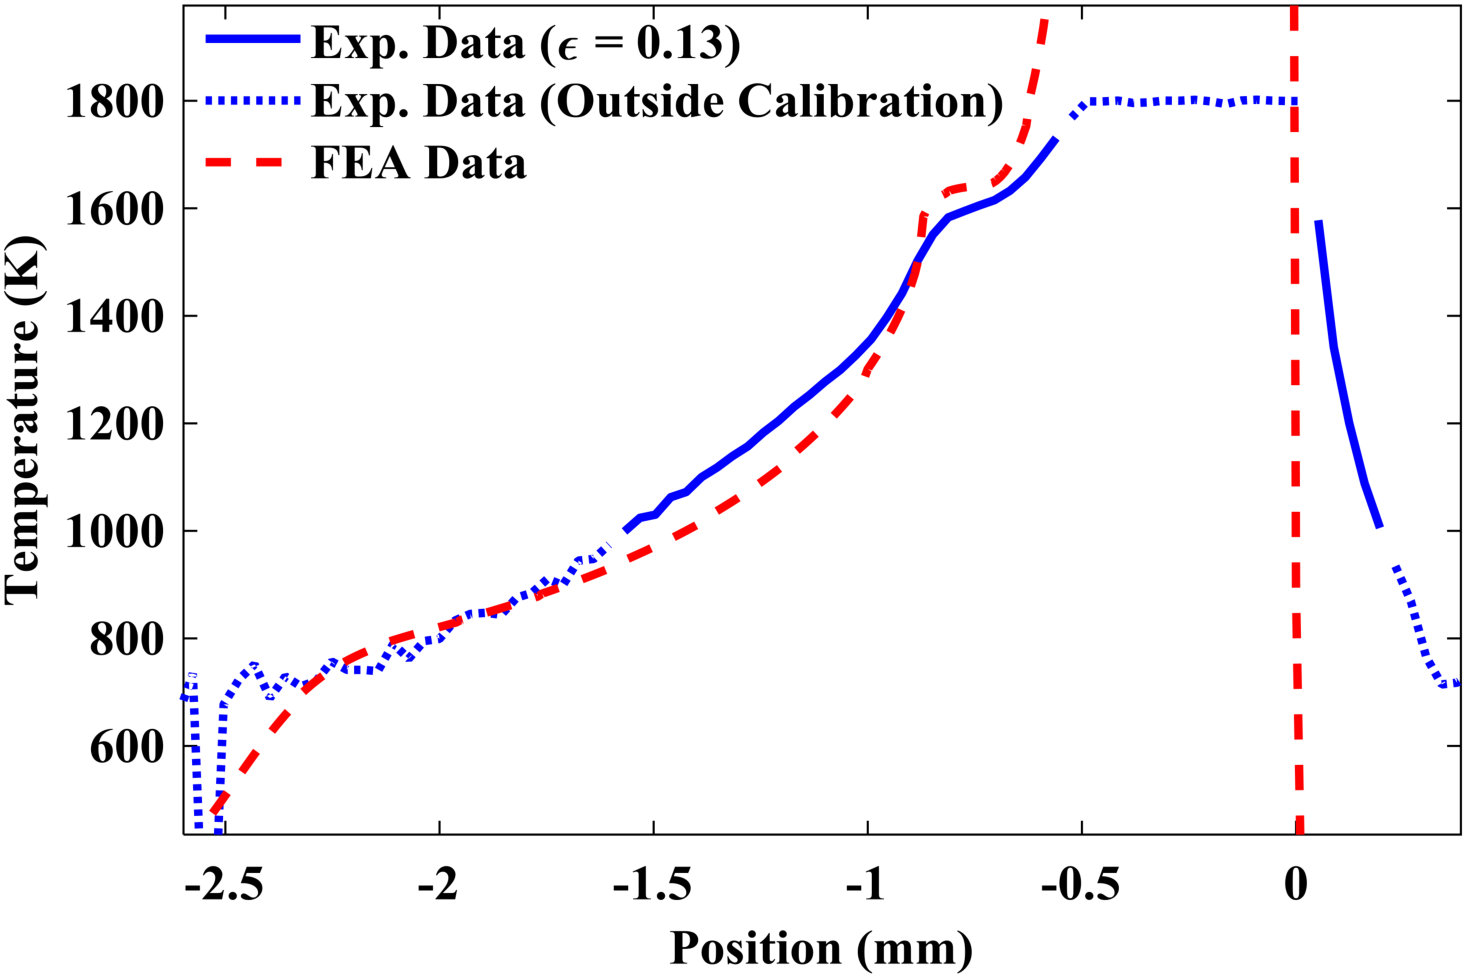 Figure 5
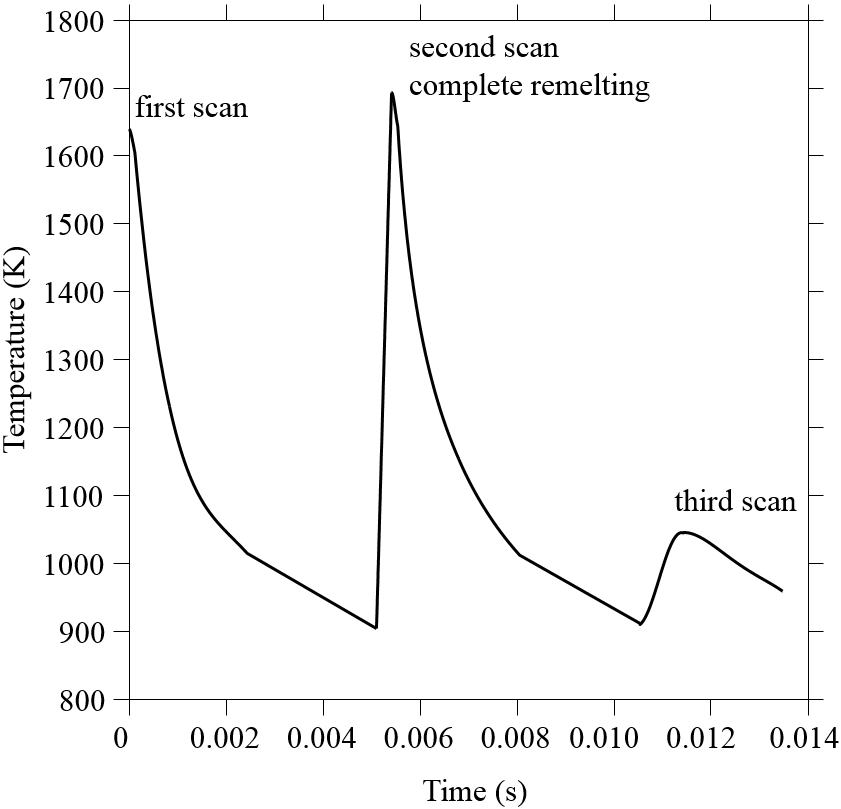 Figure 6
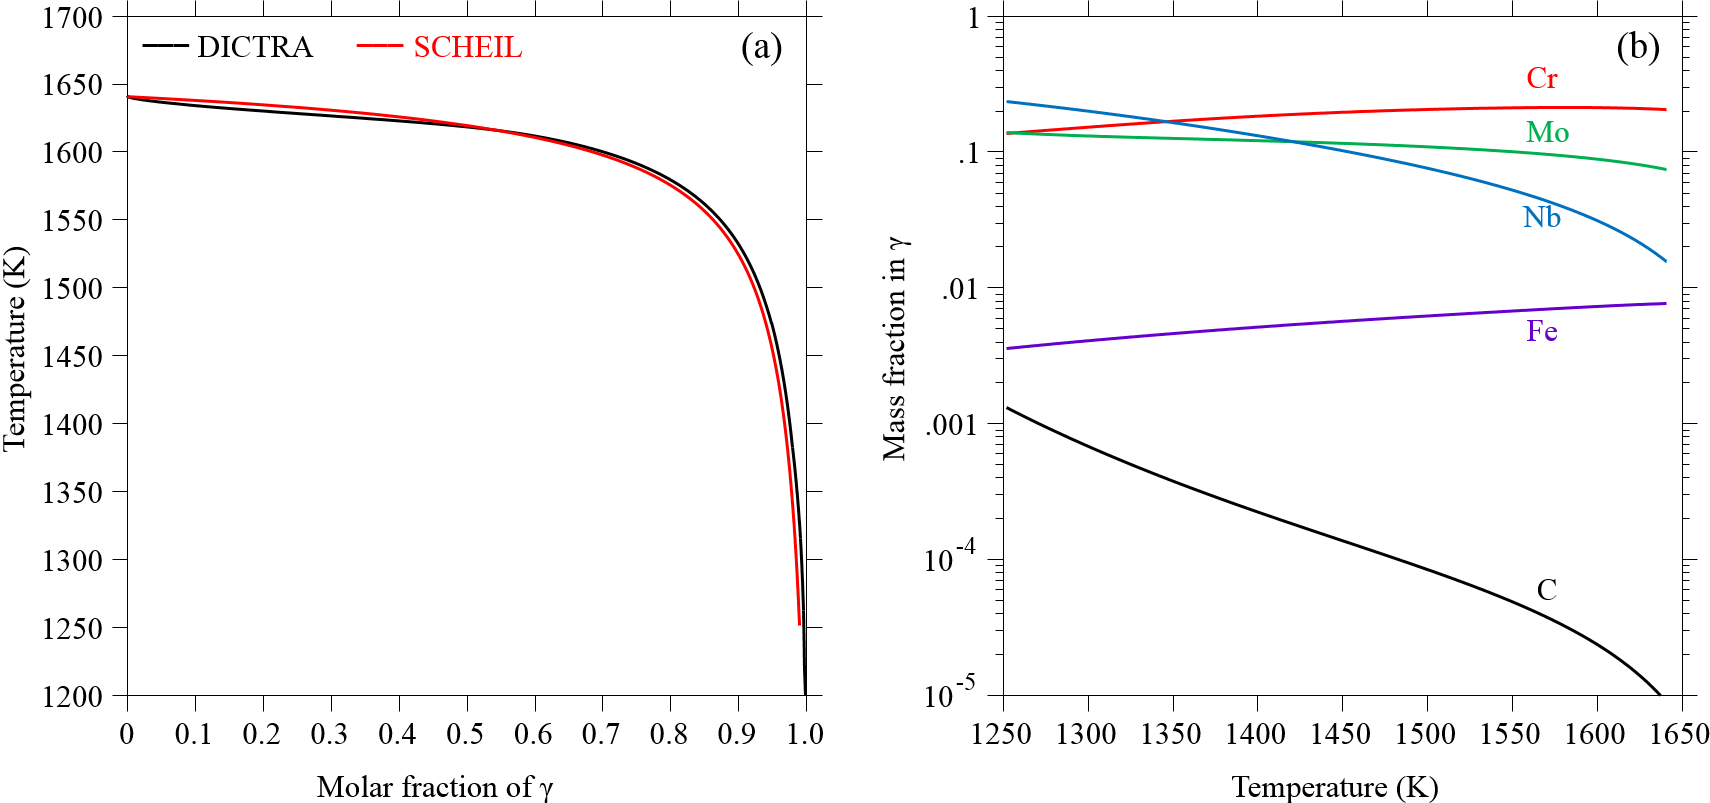 Figure 7
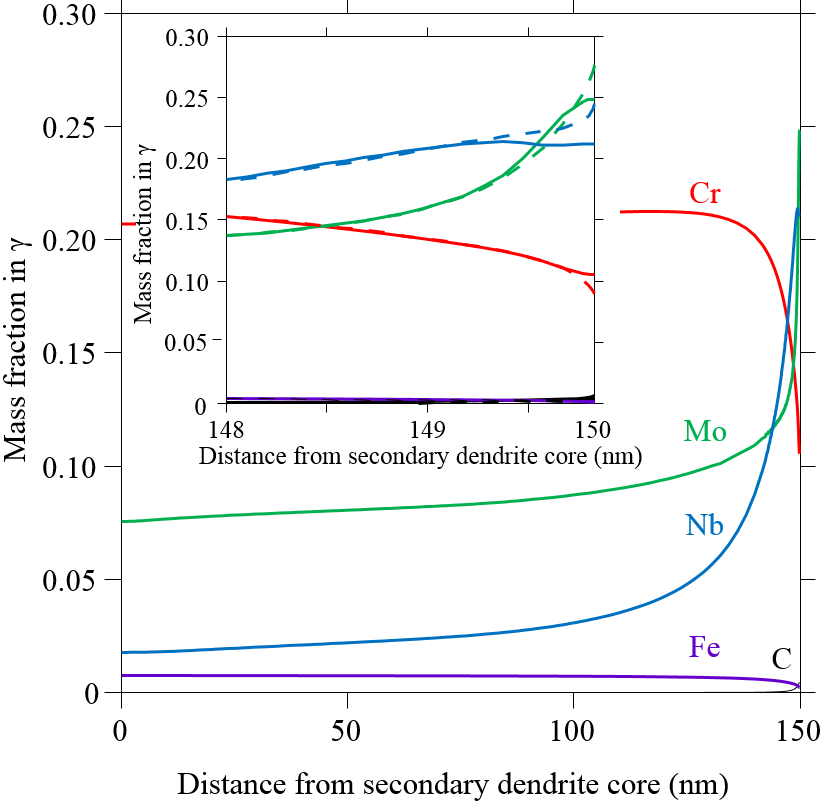 Figure 8
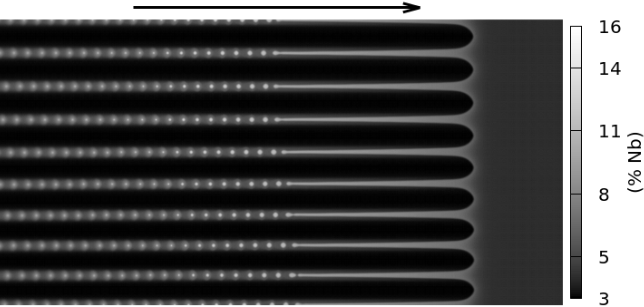 Figure 9
| Element | Standard Range | Supplied (ICP) | Supplied (XRF) |
|---|---|---|---|
| \ceNi | minimum | balance | balance |
| \ceCr | to | ||
| \ceMo | to | ||
| \ceNb | to | ||
| \ceFe | maximum | maximum | |
| \ceTi | maximum | maximum | |
| \ceAl | maximum | ||
| \ceCo | maximum | maximum | |
| \ceSi | maximum | ||
| \ceMn | maximum | ||
| \ceC∗ | maximum | ||
| \ceP∗ | maximum | maximum | maximum |
| \ceS∗ | maximum |
| Phase | Phase | ||
| \ceM2C | \ceM2C | ||
| \ceM6C | |||
| \ceM6C | BCC | ||
| BCC | |||
| Laves | liquid | ||
| \ceM23C6 | |||
Peer Reviews
No public reviews on file for this paper yet. If you reviewed it on a platform where reviews are public (OpenReview, ICLR, NeurIPS, ICML), you can paste yours below so the community can read it here.
Videos
No videos yet. Explain this paper in a talk, walkthrough, or lecture? Add one.
Application of Finite Element, Phase-field, and CALPHAD-based Methods to Additive Manufacturing of \ceNi-based Superalloys
Trevor Keller
Greta Lindwall
Supriyo Ghosh
Li Ma
Brandon M. Lane
Fan Zhang
Ursula R. Kattner
Eric A. Lass
Jarred C. Heigel
Yaakov Idell
Maureen E. Williams
Andrew J. Allen
Jonathan E. Guyer
Lyle E. Levine
Materials Science and Engineering Division, Material Measurement Laboratory, National Institute of Standards and Technology, 100 Bureau Drive, Gaithersburg, Maryland 20899, U. S. A.
Theiss Research, 7411 Eads Avenue, La Jolla, CA 92037
Intelligent Systems Division, Engineering Laboratory,
National Institute of Standards and Technology, 100 Bureau Drive, Gaithersburg, Maryland 20899, U. S. A.
Materials Measurement Science Division, Material Measurement Laboratory, National Institute of Standards and Technology, 100 Bureau Drive, Gaithersburg, Maryland 20899, U. S. A.
(May 1, 2017)
Abstract
Numerical simulations are used in this work to investigate aspects of microstructure and microsegregation during rapid solidification of a \ceNi-based superalloy in a laser powder bed fusion additive manufacturing process. Thermal modeling by finite element analysis simulates the laser melt pool, with surface temperatures in agreement with in situ thermographic measurements on Inconel 625. Geometric and thermal features of the simulated melt pools are extracted and used in subsequent mesoscale simulations. Solidification in the melt pool is simulated on two length scales. For the multicomponent alloy Inconel 625, microsegregation between dendrite arms is calculated using the Scheil-Gulliver solidification model and DICTRA software.111 Certain commercial entities, equipment, or materials may be identified in this document in order to describe an experimental procedure or concept adequately. Such identification is not intended to imply recommendation or endorsement by the National Institute of Standards and Technology (NIST), nor is it intended to imply that the entities, materials, or equipment are necessarily the best available for the purpose. Phase-field simulations, using \ceNi–\ceNb as a binary analogue to Inconel 625, produced microstructures with primary cellular/dendritic arm spacings in agreement with measured spacings in experimentally observed microstructures and a lesser extent of microsegregation than predicted by DICTRA simulations. The composition profiles are used to compare thermodynamic driving forces for nucleation against experimentally observed precipitates identified by electron and X-ray diffraction analyses. Our analysis lists the precipitates that may form from FCC phase of enriched interdendritic compositions and compares these against experimentally observed phases from heat treatments at two temperatures: stress relief at () or homogenization at ().
keywords:
Additive manufacturing; Finite element analysis (FEA); CALPHAD; Phase-field simulations; Microsegregation
1 Introduction
Inconel 625 (IN625) is a \ceNi-based superalloy used for turbine parts that is strengthened by substitutional alloying elements such as \ceCr, \ceMo, and \ceNb. Laser powder bed fusion (L-PBF), an additive manufacturing technique, presents opportunities to reduce the cost of making IN625 parts with appropriate geometries and internal cooling channels for high-temperature applications. Heat treatment is often necessary following additive manufacturing to relieve residual stress [1, 2], and to homogenize the microstructure [3, 4]. Recent work shows that common heat treatments promote precipitation of secondary phases [5], which degrade mechanical properties (such as indentation hardness) in IN625 [6]. Heat treatment schedules for wrought IN625 were designed to avoid these same precipitates [7]; however, there are substantial microstructural differences between wrought and L-PBF material [8], with significant microsegregation of as-solidified material of particular interest here. IN625 processed by welding, casting, or directional solidification exhibits less homogeneity than wrought material, and typically contains \ceNbC and Laves phase precipitates [9, 10]. Finding suitable stress-relieving and homogenizing heat treatments without sacrificing strength is an iterative process, but numerical modeling can help narrow the search.
3D finite element modeling has been crucial to understanding the L-PBF process. Models describing single laser tracks across the powder bed surface are routinely used to simulate heat dissipation through the solid substrate [11, 12]. Multi-track models allow for coupling residual stress evolution to these thermal profiles [13, 14, 15]. Recent models improve the thermal modeling using coupled Calculation of Phase Diagrams (CALPHAD) methods for accurate prediction of the melt pool boundary and solidification microstructure [16]. Such advances in modeling the L-PBF system configuration and relevant materials properties are critical to accurate finite element analysis (FEA) predictions of the real process under conditions of interest.
Phase-field methods are commonly used to simulate microstructural features, between atomistic and continuum length scales. A scalar-valued order parameter defined throughout a spatial domain is used in these methods to label the presence or absence of some phase, hence “phase field.” The best available phase-field models for solidification were performed in 2D for binary alloys [17, 18]. The simplified geometry and approximation of multicomponent alloys as binaries allows for efficient computation, and the models produce quantitatively correct mass redistribution across the solidifying interface. The model has been applied successfully to tungsten arc welding of \ceAl–\ceCu [19], laser powder forming of \ceTi–\ceNb [20] and \ceNi–\ceNb [21], and electron beam additive manufacturing of \ceTi– \ceAl– \ceV by combining \ceAl with \ceV as a virtual element with mass fraction [22].
A third approach to studying microsegregation during solidification uses DICTRA software [23], which implements a one-dimensional model for diffusion-controlled phase transformation. Despite its simplicity, this approach has the advantage of allowing for simulation of microsegregation and back-diffusion in multicomponent materials by combining CALPHAD thermodynamic and kinetic materials descriptions. DICTRA is routinely applied to multicomponent alloys, including \ceNi-based superalloys [24].
These modeling techniques—FEA, phase-field, and CALPHAD-based—are already in use studying various aspects of L-PBF, separately and increasingly in cooperation, for a variety of alloy systems. It is our goal to integrate all three models together to achieve high fidelity simulations of dendritic solidification in L-PBF IN625, with direct comparison against experimental results. This effort will improve the fundamental understanding of solidification in this system and produce input data for modeling solid state transformations in the future.
2 Numerical methods
2.1 Finite element thermal model
Using the commercial FEA code ABAQUS [25], a non-linear, transient, thermal model was designed and executed to obtain the global temperature history generated during laser irradiation of one layer of powder covering a solid substrate. The simulated powder layer thickness is , combining the nominal layer height with of underlayer densification. This matches the steady-state powder layer thickness observed in corresponding experimental builds. Both single-track and multiple-track laser scans across the metal powder layer were modeled, in which one “track” is a linear path to be followed by the laser separated by from adjacent laser pathways traversed in anti-parallel directions. The width of the molten pool in the transverse direction is , so material at the midpoint melts on adjacent scans. To reduce computation time, the elements that interact with the laser beam are finely meshed within the diameter of the laser, and a coarse mesh was used for the surrounding loose powder and substrate, visible in Figure 1. Ma et al. [26] described this model previously, with detailed discussion of appropriate parameter values.
Heat transfer in the L-PBF process was modeled using the energy balance equation with Fourier’s law of heat conduction and internal sources of heat [27],
[TABLE]
in which the evolution of temperature with time depends on material density , thermal conductivity , specific heat capacity which depends on latent heat, and internal heat which depends on radiative loss. The temperature-dependent bulk material density and specific heat were calculated from a Scheil-Gulliver simulation for the nominal IN625 composition and using the TCNI8 thermodynamic database [28] within the Thermo-Calc software [23]. The initial condition assumed a uniform temperature of throughout the specimen at time . Adiabatic conditions were applied to all boundaries except the top surface, on which the boundary condition is
[TABLE]
The three terms on the right-hand side represent heat input from the laser, heat convection due to flowing process gas, and radiation. Equation 2 depends on the surface normal , laser input heat , convective heat transfer coefficient , thermal radiation coefficient , the Stefan-Boltzmann constant , and ambient temperature . The laser input was modeled after the single-mode continuous wave \ceYb fiber laser (1070\text{,}\mathrm{nm}$$) used in our experimental L-PBF system (described in Sec. 3). Interaction between the laser and material is modeled using a Gaussian expression for surface heat flux [29],
[TABLE]
with power 195\text{,}\mathrm{W}, powder bed absorption coefficient $A=$0.50, laser beam radius 50\text{,}\mathrm{\SIUnitSymbolMicro m}$$, and radial distance to the beam centerline measured in . The simulated laser scanning speed was .
Each element stores its temperature and a Boolean variable indicating whether it has ever exceeded the liquidus temperature, . Elements in the powder layer are initialized with this variable set to “false,” indicating a powder state. Upon melting, the variable switches to “true,” indicating a bulk state. Substrate elements are initialized with this variable set to “true.” There is no mechanism for switching this melt-state variable from “true” to “false:” the fused material can never revert to powder. The materials parameters and for each element depend on both variables, and melt-state. In the powder state, depends on the packing fraction, particle size distribution, particle morphology, and thermal conductivity of the bulk material and process gas [30, 31]. In the simulations described in this work, was specified in the range from to after [32]. As rises during the first melting event, and linearly increase from their powder to bulk values when is above the solidus temperature and below the liquidus temperature given by the IN625 phase diagram [28, 23]. If exceeds , then the melt-state variable switches to “true;” and are thereafter functions of , only. Note that the bulk state variable does not differentiate between solid and liquid phases: the FEA model uses to choose phase-dependent materials properties appropriately. Latent heat effects are captured in the evaluation of [25].
2.2 CALPHAD-based solidification models
To estimate the extent of microsegregation during solidification of a material, the Scheil-Gulliver model [33, 34] is often applied. The model can be used for multicomponent materials, provided that a thermodynamic description for the multicomponent alloy is available. The model assumes perfect mixing in the liquid and no diffusion in the solid phase. These conditions are not found in nature, so the result is a theoretical limit: less segregation is expected during real solidification processes than the Scheil-Gulliver model predicts, since finite diffusion in both the liquid and solid phases will contribute to mass redistribution.
Microsegregation predictions may also be obtained using DICTRA software [23] that include the effect of diffusion in liquid and solid during solidification. Local equilibrium is assumed at the interface between phases, in this case liquid and , and flux-balance is maintained for each element. Solutions to the diffusion equation and the assumption of local equilibrium at the phase interface are used to determine the tie-line that satisfies flux-balance. Because the simulations are 1D, the effects of dendrite tip diffusion are not included.
For the IN625 segregation simulation, we used the commercial thermodynamic database TCNI8 [28] and the NIST \ceNi Superalloy mobility database [35]. The DICTRA simulation domain was , which is half of the secondary dendrite arm spacing measured from experimental microstructures (e.g., Figure 2). Temperature was specified as spatially uniform, but time-dependent, with values taken directly from the FEA thermal model. To reduce the computational complexity, metals contributing mass fractions below were excluded, producing a simplified system composition \ceNi– \ceC– \ceCr– \ceFe– \ceMo– \ceNb.
2.3 Phase-field solidification model
We used a quantitative phase-field model in 2D to study the cellular/dendritic nature of the solidification of the melt pool [18], with a simplified representation of IN625 as a \ceNi–\ceNb binary system with only FCC phase and liquid phase. The bulk composition has a mass fraction of \ceNb. The scalar phase parameter indicates whether a point in the 2D field is liquid , solid , or within the solid-liquid interface . The phase-field is not conserved, and evolves in time and space as
[TABLE]
The dimensionless interfacial energy , with four-fold anisotropy of magnitude , interface normal vector , and orientation angle . The non-dimensional deviation of chemical potential, , is defined with respect to the equilibrium chemical potential at a reference temperature and system composition . The frozen temperature approximation is applied such that a linear temperature profile with constant gradient translates along the growth axis with constant velocity [36, 37, 38, 39, 40]: . Interface thickness and relaxation time constant are related through the capillary length, . Asymptotic analysis, performed by enforcing local equilibrium at the interface as its width vanishes, also links these quantities through a dimensionless coupling parameter and diffusion constant in the liquid [41, 18]: . The fitting parameters and depend on the forms of the free energy functional and free energy density, respectively [17]. is therefore the only free parameter, chosen to be .
Composition is modeled with a conserved field , and evolves as
[TABLE]
This expression neglects the effect of thermal gradients on diffusion, or the Soret effect [42], which contributes to macrosegregation under low solidification velocities [43], but not microsegregation during rapid solidification. The phase diagram of the \ceNi–\ceNb system exhibits a practically linear liquidus with constant slope -10.5\text{,}\mathrm{K}\text{,}{\mathrm{\char 37\relax}}^{-1}$$, measured with respect to mass percentage \ceNb, and constant partition coefficient in this dilute region. Equations 4 and 5 were solved on a uniform rectilinear grid using a finite volume method and an explicit time marching scheme with zero-flux boundary conditions. Model parameters for a dilute solution of \ceNb in \ceNi were used directly from Nie et al. [21], summarized in their Table 1. Further analysis of solidification microstructures in dilute \ceNi–\ceNb alloys using this model are reported elsewhere [44].
3 Experimental methods and results
Test cubes of IN625 were additively manufactured by the NIST Engineering Laboratory using an EOSINT M270 (EOS GmbH, Krailling, Germany); for L-PBF system details, the interested reader may refer to [45]. The EOS NickelAlloy IN625 powder (EOS GmbH, Krailling, Germany) was supplied with compositions listed in Table 1, as measured by inductively coupled plasma atomic emission spectroscopy (ICP) and flame atomic absorption spectroscopy (FAAS), or by X-ray fluorescence spectroscopy (XRF, conforming to [46]). All measured values are within the standard ranges for IN625 [47]. For calibration of the FEA thermal model, multiple-track laser scans were made on () thick solutionized IN625 plate (High Performance Alloys, Inc. Windfall, IN, USA). For both IN625 media, the \ceYb fiber laser power was and scan speed was .
Scanning electron microscopy (SEM) specimens were polished to a surface finish using standard metallographic preparation techniques, then etched for in aqua regia.
Specimens for transmission electron microscopy (TEM) were prepared using electrical discharge machining to cut disks in diameter, which were then electropolished until electron-transparent with a perchloric acid, methanol, and butanol solution. Figure 2 provides a representative secondary electron micrograph from the as-built L-PBF IN625 specimen: the primary dendrite arms are spaced and the secondary arms are spaced . Regions without secondary arms are also present: the wide range of localized solidification conditions produced by L-PBF can produce regions of cellular growth, so we describe the experimental microstructures as “cellular/dendritic.” Figure 3 provides representative bright field scanning transmission electron micrographs (STEM) showing precipitates as light and dark circular spots, to in diameter. Precipitates are found near cell/dendrite boundaries in as-built material, but are not apparently localized to microstructural features after stress relief at for . Electron diffraction patterns confirm the presence of \ceMC, \ceM6C, and \ceM23C6 carbides in stress-relieved material, whereas diffraction patterns of precipitates in as-built material could not be indexed due to residual stress and high dislocation densities.
X-ray diffraction experiments were performed at the ultra-small angle X-ray scattering (USAXS) facility at the Advanced Photon Source at Argonne National Laboratory [48, 49], with specimen preparation and measurement conditions reported previously [5]. The relative distance and tilt between the specimen and detector are calibrated using \ceLaB6 powder. The sample was heated to and held at for , then cooled to , corresponding to the manufacturer’s recommended stress-relieving heat treatment for IN625 [50]. The sample was then heated to and held at for , then cooled back to , a treatment suggested by previous work [5]. The heating rates were , the cooling rates were , and the temperature stability was .
From the room temperature XRD patterns, Figure 4, only the FCC cubic lattice ( phase) with a lattice parameter of could be identified. The first annealing step to led to the formation of carbides, most of which are \ceM6C with a cubic lattice of group and a lattice parameter of . The second heating step to preserved the carbides and promoted the formation of an intermetallic Laves phase. The Laves phase has a hexagonal lattice of group, with lattice parameters and . The uncertainties in these values are reported with confidence. Hence, we conclude that from a statistical point of view, the dominant precipitates after this two-step heat treatment are \ceM6C carbides and the Laves phase.
4 Simulation results
4.1 Finite element thermal simulations
To validate our FEA thermal model, we compared its surface temperature prediction against in situ thermographic measurements. Details of the thermographic measurement setup were published in [45], and data used for the single-track comparison given here are described in [51]. The same thermal camera settings used in [45, 51] were used here: integration time, and to spectral range.
As described in [45], thermographic imaging of laser scans on metal powder produces highly stochastic temperature fields with localized gradients due to the varying surface structure and emissivity, which inhibit true temperature measurement. In contrast, scans on flat plates of bulk metal result in smooth temperature gradients, and single-line scans create steady-state melt pools that simplify comparisons to FEA simulations. Therefore, FEA simulation results are compared against experimental laser scans on bare plates, without powder. A representative temperature profile on IN625 plate was taken from one frame of the thermal video after the melt pool attained nominal steady state. Figure 5 compares the measured and predicted thermal profiles for a single track scan without powder using a scan speed of and laser power .
The emissivity of the surface of a real specimen—also known as emittivity—is highly dependent on processing, and values for the IN625 melt pool, rolled plate, and powder surfaces are unknown. Therefore, the thermal camera signal cannot be directly converted to temperature for comparisons to FEA model predictions. Instead, we scale thermographic data based on an observed solidification zone following a technique developed for analysis of \ceTi– \ceAl– \ceV powder [52]. A shoulder in the thermographic profile behind the melt pool is attributed to the solidification zone, apparent between to in Figure 5. The profile is scaled by an assumed emittivity and converted to temperature units such that the temperature in this zone matches the solidus temperature, 1587\text{,}\mathrm{K}$$, which we calculated for IN625 using the TCNI8 thermodynamic database [28]. This technique uses as a reference temperature, and results in emittivity of , which is a reasonable value for a semi-specular metallic surface at the same spectral range and viewing angle as the thermal imaging setup [53]. The calibrated range of the thermal camera was to . Temperatures above this range saturate the camera, and temperatures below approach the noise floor of the camera detector. Applying this emittivity maps the reportable temperature range to to , as shown by the solid blue line in Figure 5.
Figure 6 shows the predicted temperature as a function of time at a point on the surface located midway between the centers of two of three anti-parallel laser scan tracks. Full melting and re-melting occurs as the laser beam traverses the two nearest tracks, passing the same distance away from the measurement point both times. Heating without melting is observed as the laser scans material along the third track. This three-track temperature profile was used directly in DICTRA simulations of IN625 solidification.
Figure 1 shows the thermal profile of the melt pool in cross-section. The rectangular meshing elements near the surface measure 10\text{\,}\mathrm{\SIUnitSymbolMicro m}$\times$10\text{\,}\mathrm{\SIUnitSymbolMicro m}$\times$6\text{\,}\mathrm{\SIUnitSymbolMicro m}. Contours illustrate the temperature field, with the solid-liquid interface coinciding with the border between red and orange bands. The transformation angle between the melt pool boundary and laser scanning direction indicates the local solidification speed, [19].
FEA thermal model results were also used to determine solidification parameters to be employed for the phase-field simulations described in Section 4.3. Average cooling rate {10}^{5}\text{,}\mathrm{K}\text{,}{\mathrm{s}}^{-1} was calculated from Figure [6](#S4.F6), measuring the slope of the line connecting the maximum and minimum temperatures of the second peak to its subsequent valley. A constant value for thermal gradient $G=${10}^{7}\text{\,}\mathrm{K}\text{\,}{\mathrm{m}}^{-1} was chosen for the simulations. It is representative of the values along the solidus contour in Figure 1, 1587\text{,}\mathrm{K}: we computed $G=|\nabla T|$ in the range from $0.57\text{\times}{10}^{7}\text{\,}\mathrm{K}\text{\,}{\mathrm{m}}^{-1}$ to $2.2\text{\times}{10}^{7}\text{\,}\mathrm{K}\text{\,}{\mathrm{m}}^{-1}$, for mesh points to the left of the melt pool minimum. Values taken along the solidus contour behind the melt pool minimum yielded a range of angles $\alpha$ from $78\text{\,}\mathrm{\SIUnitSymbolDegree}$ to $89\text{\,}\mathrm{\SIUnitSymbolDegree}$ for $V_{b}=$0.8\text{\,}\mathrm{m}\text{\,}{\mathrm{s}}^{-1}, and ranged between and Note that the solidifying interface experiences localized thermal gradients and solidification speeds: the cooling rate in L-PBF processes is not constant.
4.2 CALPHAD-based solidification simulations
Figure 7a represents solidification of the interdendritic region as predicted by the Scheil-Gulliver model and by DICTRA for the thermal profile in Figure 5. Based on the low fraction of secondary phases observed in as-solidified experimental specimens (e.g., Figures 3 and 4), we made the simplifying assumption that liquid solidifies into phase, only. Due to the high cooling rate, the DICTRA results show solidification behavior very similar to the Scheil-Gulliver model (Figure 7a). Figure 7b shows the Scheil-Gulliver model prediction of liquid composition. Microsegregation occurs for all elements, with particularly high segregation of \ceMo and \ceNb into the liquid. In the last solidified liquid, 1250\text{,}\mathrm{K}$$, the \ceMo and \ceNb mass fractions are as high as and , respectively. The last solidified liquid is also enriched in \ceC whereas \ceCr and \ceFe are depleted.
Detailed DICTRA simulation results are shown in Figure 8, with an inset showing results near the centerline of interdendritic liquid. The composition profiles show microsegregation from the secondary dendrite core (0\text{,}\mathrm{nm}) to the interdendritic region ($x=$150\text{\,}\mathrm{nm}). Since applying the FEA thermal profile (Figure 6) for the DICTRA simulation leads to complete melting at the second scan temperature peak, the resulting segregation in Figure 8 occurs during this cooling. The third laser scan, centered from the FEA measurement point, leads to minor homogenization of the segregated profiles. This is, however, only notable over a distance less than (inset, Figure 8) and can have no significant effect on the microsegregation profile. Figure 8 shows most of the microsegregation occurs within the region near the last solidified liquid, in good agreement with a recent synchrotron SAXS study of the homogenization kinetics of L-PBF IN625 [5], where a novel analysis directly linked the length of X-ray streaks to the length scale of the segregation. It can further be concluded that the segregation is in the same range as in the Scheil-Gulliver simulation. The main difference is that the DICTRA simulation results in a greater amount of \ceMo and somewhat less \ceNb in the interdendritic region compared to the last solidified liquid composition obtained from the Scheil-Gulliver model, as expected.
4.3 Phase-field solidification simulations
Several phase-field simulations were performed with different values for , but constant , in order to study microstructural evolution under various cooling conditions of interest. Simulations were initialized with a planar solid-liquid interface with random perturbations up to one grid spacing in location, and using a hyperbolic tangent profile along the growth axis to smooth the step change over several grid spacings for numerical stability. The microstructures evolved according to Equations 4 and 5, and simulations ran until steady state was achieved. Depending on solidification conditions, interfacial instabilities can grow into dendrites (with secondary arms) or cells (without). For the parameters chosen in this work, only cellular domains resulted, as represented in Figure 9 with 25\text{,}\mathrm{mm}\text{,}{\mathrm{s}}^{-1}$$. In Figure 9, the steady-state mass fraction of \ceNb in the cell center line was . At the midpoint of the intercellular liquid, the mass fraction of \ceNb was . Intercellular liquid is shown pinching off at the root of intercellular grooves with \ceNb mass fraction of . This composition is below the eutectic composition of \ceNb. Thus secondary solid phases, which are not available to these simulations, are not expected to form. The main point is that the microsegregation found by this model is considerably less than is predicted by a Scheil-Gulliver analysis of binary \ceNi–\ceNb: such an analysis for predicts a mass fraction of \ceNb in the cell centerline, in solid formed when only liquid remains, and likely formation of secondary phases from the last liquid to solidify.
The primary dendrite arm spacing , a commonly reported metric for cellular/dendritic microstructures, was averaged from multiple simulations with the same by dividing the sum of simulation domain widths by the sum of the numbers of cells advancing at steady state. We measured in the range from to from our simulations, depending on the cooling rate which ranged from to , as shown in Figure 10. For reference, we compared our results with the analytical models of Hunt [54],
[TABLE]
with , and Kurz and Fisher [55],
[TABLE]
with , under the simplifying assumption that undercooling , measured from the equilibrium phase diagram at . 3.65\text{\times}{10}^{-7}\text{,}\mathrm{K}\text{,}\mathrm{m}$$ is the Gibbs-Thomson coefficient. The proportionality constants depend on the 3D geometry assumed for the dendrite arrays: Hunt assumed spherical dendrite tips and derived , while Kurz and Fisher assumed ellipsoidal tips and derived . From the line of best fit through our simulation data points, we calculate from Equation 6, and from Equation 7. Figure 10 shows that neither model provides an objectively good fit. The deviation is likely due to the combination of our reduced geometry (2D rather than 3D), rapid cooling , and more complex tip geometry than either simple model. This result is supported by a body of experimental evidence demonstrating large effects of , , and on dendrite tip geometries and [56, 57, 58].
5 Discussion
Experimental observations via TEM reveal significant precipitation near cell/dendrite boundaries in as-built L-PBF material (Figure 3). Stress relief at the manufacturer’s recommended temperature () was found to promote further growth of carbides, with \ceM6C precipitation and growth from the matrix observed by in situ synchrotron XRD (Figure 4). Further treatment at promoted \ceM6C growth and Laves phase precipitation: after at temperature, \ceM6C persisted and Laves phase grew to measurable levels. This growth is despite the fact that homogeneous IN625 of nominal composition is single-phase , as established experimentally and from thermodynamics [7, 28].
Investigation into the cause of the observed precipitation during heat treatments requires knowledge of the solidification rate, which can not be directly determined from the laser scan speed. In situ thermographic measurements on bare IN625 plate provided the melt pool width and thermal gradients on the surface. FEA simulations were calibrated against these surface data, then used to extract details of the full 3D melt pool shape during three-track L-PBF simulations (Figure 1 and Section 4.1). For a \ceYb fiber laser operating at and scanning a single powder layer at , the solidification rate is between at the bottom of the melt pool and at its trailing edge. The cooling rate along this interface was on the order of , a rapid solidification condition.
Experimentally, these conditions produce fine cellular dendrites. To assess the level of microsegregation, we performed modeling on three levels: Scheil-Gulliver, with no diffusion in and perfectly mixed liquid; DICTRA, with multicomponent diffusion in 1D for both and liquid; and phase-field, with 2D cells/dendrites of growing into liquid.
To assess how microsegregation correlates to the experimentally identified precipitates, we look at the thermodynamic contribution to the driving force for nucleation of various phases from the matrix [59], ignoring interfacial energy contributions and kinetic obstacles. The phase with largest driving force would be expected to nucleate first. Comparison of these driving force values may provide additional insight regarding the nucleation of precipitates in dendritically segregated material. In Table 2, the phases most likely to nucleate are listed in decreasing order of driving force for the composition of solid when liquid remains (mass fraction \ceNi– C– Cr– \ceFe– \ceMo– \ceNb). On this basis, we expect \ceNb-rich \ceMC carbide to nucleate first; if it cannot, we expect \ceM2C. If \ceM2C cannot form, a \ceMo-rich phase is expected, \ceM6C or BCC, followed by \ceCr-rich , , Laves, or \ceM23C6. As Table 2 demonstrates, the specific nucleation order depends on temperature. Note that this is a sequence of energetic favorability, not a predicted time-evolution: phases toward the bottom of the table can only precipitate if local conditions preclude any of the more-favorable phases from doing so. The favored precipitate is also not the same everywhere: local variations in composition and other materials properties will change the tabulated sequence. Competitive growth and coarsening may occur when time and diffusion are factored in, but these effects are beyond the scope of this paper.
The nucleation sequence suggested by the driving force calculations can be compared to the calculated equilibrium phases for these compositions at the stress relieving and homogenizing temperatures. Thermodynamic calculations show \ceMC, BCC, and phases to be stable at both temperatures, while phase is only stable at the lower temperature. Therefore, as the highly segregated profiles diffuse during long heat treatments, solid state transformations are to be expected—an active topic of research beyond the scope of this paper.
It is important to note that the nucleation sequence and the ability for a phase to form are dependent on several mechanisms and not only the nucleation driving force. A complete description of nucleation must include the interfacial energy between the matrix and secondary phase, which depends on the interfacial area and crystallographic details. For large or complex unit cells in particular, kinetic effects play an important role: a thermodynamically stable phase may be unable to nucleate or grow if its constituent elements are not sufficiently mobile in the matrix at the specified temperature and composition. This may explain, for example, the fact that BCC phase has not been observed in our experiments despite its apparently high driving force for nucleation. Furthermore, the thermodynamic database used for the driving force calculation may contain uncertainties and is also limited to a certain energy resolution. This could, in particular, be the case when different phases have similar driving forces, e.g. \ceM6C and BCC in our case.
Even if \ceM6C and Laves are not equilibrium phases at these conditions, their driving forces for nucleation are high enough to put them early in the nucleation sequence: earlier than the equilibrium phases and . This could explain the experimental observation of these phases. It is also interesting to note that the \ceNb-rich \ceMC carbide is an equilibrium phase at temperatures as high as , which could complicate the homogenization treatment.
The binary phase-field simulations clearly show microsegregation in the cellular growth pattern. The spherical droplets in Figure 9 form at high solidification speeds as the advancing cells pinch off liquid pockets to maintain the steady-state intercellular groove depth. These liquid droplets are enriched to more than twice the initial \ceNb composition, depending on cooling rate, with some loss to diffusion during solidification. Experiments involving rapid solidification of electron-beam melted \ceAl–\ceFe–\ceNi alloys produced morphologically similar droplets, which precipitated intermetallic compounds during solidification [60]. While our models did not consider secondary solid phases, and therefore could not simulate precipitation in the evolving microstructure, the microsegregation patterns are real and significant. It is interesting to note that even the highly concentrated droplets are enriched less than half as much as the microsegregation predicted by the DICTRA simulations. To some extent, this difference reflects model geometry: the phase-field simulations were performed in 2D with realistically curved dendrite tips, while DICTRA simulations represent 1D planar solidification. Curvature effects significantly affect diffusion. In addition, under rapid solidification conditions, local chemical equilibrium across the solid-liquid interface is not expected to hold, and results in the natural phenomenon known as solute trapping [61]. DICTRA enforces local equilibrium without accounting for solute trapping, and therefore over-estimates the extent of microsegregation in these simulations. While the phase-field model does not enforce local equilibrium, the diffuse interface artificially magnifies the effect. Our phase-field model includes an anti-trapping flux in Equation 5, to correct the spurious contribution [17]. The correction is accurate to second-order in , the dimensionless ratio of interface thickness to capillary length, and is exact for low solidification velocities. Under the rapid solidification conditions investigated here, this second-order expression does not cancel the spurious effect, which artificially decreases the simulated microsegregation. Under L-PBF conditions, which produce both curved interfaces and solute trapping in real material, the phase-field model produces a more accurate estimate of microsegregation than DICTRA for the the cellular/dendritic microstructure.
There are also confounding factors that affect the exact compositions predicted by our phase-field and DICTRA models. The real temperature-time cycle during L-PBF is more complex than the FEA model employed in this study: for example, the effects of building additional layers on the temperature profile are neglected here. This simplified thermal history may discount the influence of solid state diffusion, producing artificially high compositions in enriched regions of the microstructure. This work also models the laser input as a surface heat source, only, which neglects the effects of particle ejection on heat and mass transfer in the melt pool [62, 63]. Furthermore, thermophysical properties such as and depend on the solidification speed, and may deviate significantly from equilibrium values in the rapid solidification regime, a topic explored in greater detail elsewhere [44]. Finally, powder grains of somewhat different sizes and composition lead to compositional variations throughout the part, which may produce highly localized segregation patterns not captured in our models.
6 Conclusion
From this work, we conclude:
For additively manufactured Inconel 625, heat treatments of at and promote precipitation of secondary phases from the matrix.
- 2.
FEA simulations of the moving 3D melt pool shape predict maximum solidification rates only times the laser scan speed, accompanied by a cooling rate of . This L-PBF process occurs under rapid solidification conditions.
- 3.
The Scheil-Gulliver model was used to compute the maximum possible extent of microsegregation for the multicomponent alloy IN625. DICTRA simulations that include the role of diffusion in reduce the degree of microsegregation near the end of solidification. Phase-field simulations of cellular/dendritic microstructures further reduce microsegregation, finding \ceNb compositions times the Scheil-Gulliver prediction.
- 4.
Carbides (\ceMC, \ceM2C, and \ceM23C6), topologically close-packed (, , ), and Laves phases have negative thermodynamic driving forces for nucleation from the FCC phase under the conditions of microsegregation and temperature studied: these may spontaneously precipitate under the conditions of temperature and microsegregation investigated.
This effort demonstrates the viability of cooperatively modeling L-PBF processes using several techniques to assess microstructural phenomena in IN625. Work in progress will extend this tool chain to investigate the effects of interfacial energy and diffusion in microsegregated regions on competitive precipitation and solid state transformations. With a complete microstructure model, we plan to evaluate the whole process in order to find a better way to prepare this material for service.
Acknowledgment
Use of the Advanced Photon Source, an Office of Science User Facility operated for the U.S. Department of Energy (DOE) Office of Science by Argonne National Laboratory, was supported by the U.S. DOE under Contract No. DE-AC02-06CH11357.
The reference list from the paper itself. Each links out to its DOI / PubMed record.
- 1[1] E. R. Denlinger, J. C. Heigel, P. Michaleris, T. Palmer, Effect of inter-layer dwell time on distortion and residual stress in additive manufacturing of titanium and nickel alloys, J. Mater. Process. Technol. 215 (2015) 123–131. doi:10.1016/j.jmatprotec.2014.07.030 . · doi ↗
- 2[2] A. S. Tremsin, Y. Gao, L. C. Dial, F. Grazzi, T. Shinohara, Investigation of microstructure in additive manufactured Inconel 625 by spatially resolved neutron transmission spectroscopy, Sci. Technol. Adv. Mater. 17 (1) (2016) 324–336. doi:10.1080/14686996.2016.1190261 . · doi ↗
- 3[3] F. Xu, Y. Lv, Y. Liu, B. Xu, P. He, Effect of heat treatment on microstructure and mechanical properties of Inconel 625 alloy fabricated by pulsed plasma arc deposition, Phys. Procedia 50 (2013) 48–54. doi:10.1016/j.phpro.2013.11.010 . · doi ↗
- 4[4] A. Mostafaei, Y. Behnamian, Y. L. Krimer, E. L. Stevens, J. L. Luo, M. Chmielus, Brief data overview of differently heat treated binder jet printed samples made from argon atomized Alloy 625 powder, Data Brief 9 (2016) 556–562. doi:10.1016/j.dib.2016.09.042 . · doi ↗
- 5[5] F. Zhang, L. E. Levine, A. J. Allen, C. E. Campbell, E. A. Lass, S. Cheruvathur, M. R. Stoudt, M. E. Williams, Y. Idell, Homogenization kinetics of a nickel-based superalloy produced by powder bed fusion laser sintering, Scripta Mater. 131 (2017) 98–102. doi:10.1016/j.scriptamat.2016.12.037 . · doi ↗
- 6[6] L. M. Suave, J. Cormier, P. Villechaise, A. Soula, Z. Hervier, D. Bertheau, J. Laigo, Microstructural evolutions during thermal aging of Alloy 625: Impact of temperature and forming process, Metall. Mater. Trans. A 45 (7) (2014) 2963–2982. doi:10.1007/s 11661-014-2256-7 . · doi ↗
- 7[7] S. Floreen, G. E. Fuchs, W. J. Yang, The metallurgy of Alloy 625, in: E. A. Loria (Ed.), Superalloys 718, 625, 706 Var. Deriv., The Minerals, Metals & Materials Society, Warrendale, PA, 1994, pp. 13–37.
- 8[8] Y. Idell, L. E. Levine, A. J. Allen, F. Zhang, C. E. Campbell, G. B. Olson, J. Gong, D. R. Snyder, H. Z. Deutchman, Unexpected δ 𝛿 \delta -phase formation in additive-manufactured Ni-based superalloy, JOM 68 (3) (2016) 950–959. doi:10.1007/s 11837-015-1772-2 . · doi ↗