Radio emission of air showers with extremely high energy measured by the Yakutsk radio array
S.P. Knurenko, Z.E. Petrov, I.S. Petrov

TL;DR
This paper reports on the Yakutsk Array's measurements of radio emissions from high-energy air showers, establishing empirical relations and detecting the highest energy cosmic ray events at the array.
Contribution
It provides the first measurements of radio emission from air showers with energies exceeding 10^{19} eV at Yakutsk, including the highest energy event recorded there.
Findings
Lateral distribution function of radio emission established.
Empirical relation between radio amplitude and air shower energy derived.
First detection of radio emission from air showers above 10^{19} eV at Yakutsk.
Abstract
The Yakutsk Array is designed to study cosmic rays at energy 10-10 eV. It consists several independent arrays that register charged particles, muons with energy E1 GeV, Cherenkov light and radio emission. The paper presents a technical description of the Yakutsk Radio Array and some preliminary results obtained from measurements of radio emission at 30-35 MHz frequency induced by air shower particles with energy 110 eV. The data obtained at the Yakutsk array in 1986-1989 (first set of measurements) and 2009-2014 (new set of measurements). Based on the obtained results we determined: Lateral distribution function (LDF) of air showers radio emission with energy 10 eV. Radio emission amplitude empirical connection with air shower energy. Determination of depth of maximum by the ratio of amplitude at different distances…
Click any figure to enlarge with its caption.
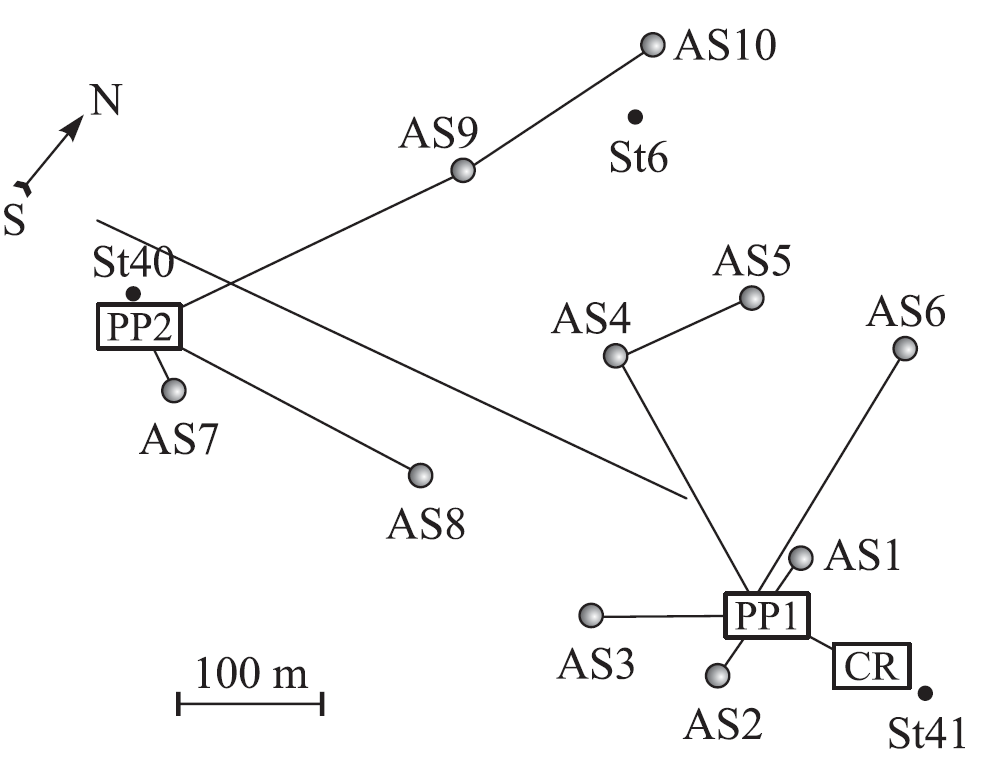 Figure 1
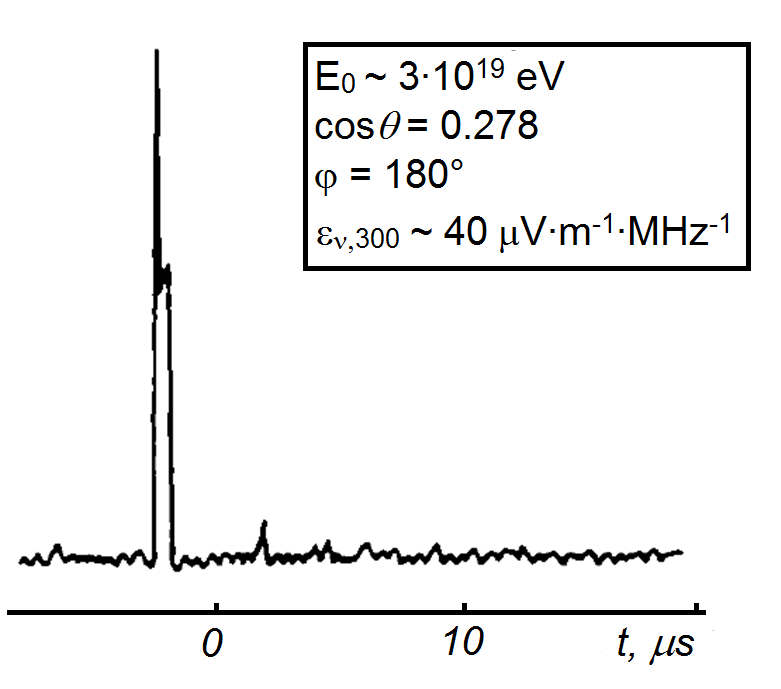 Figure 10
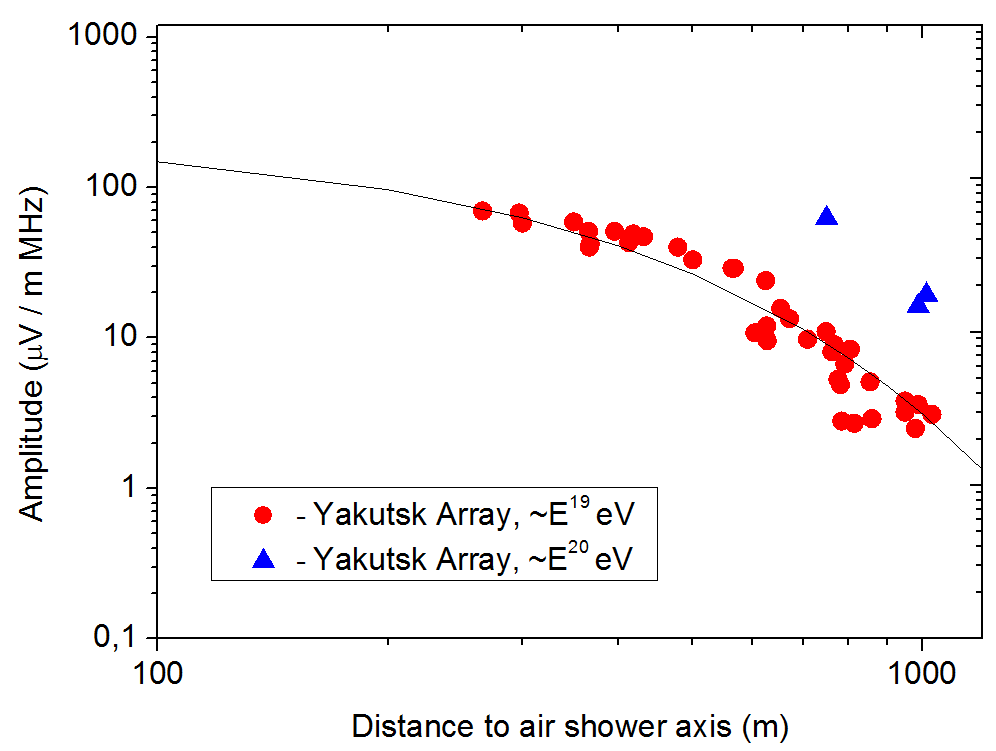 Figure 11
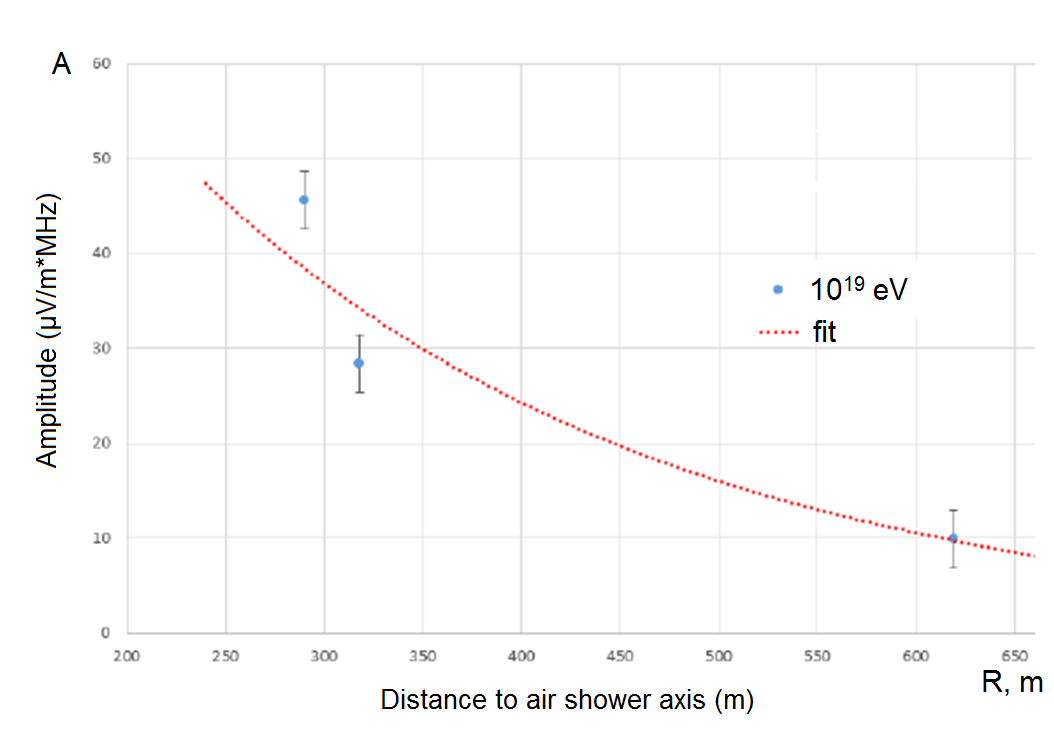 Figure 12
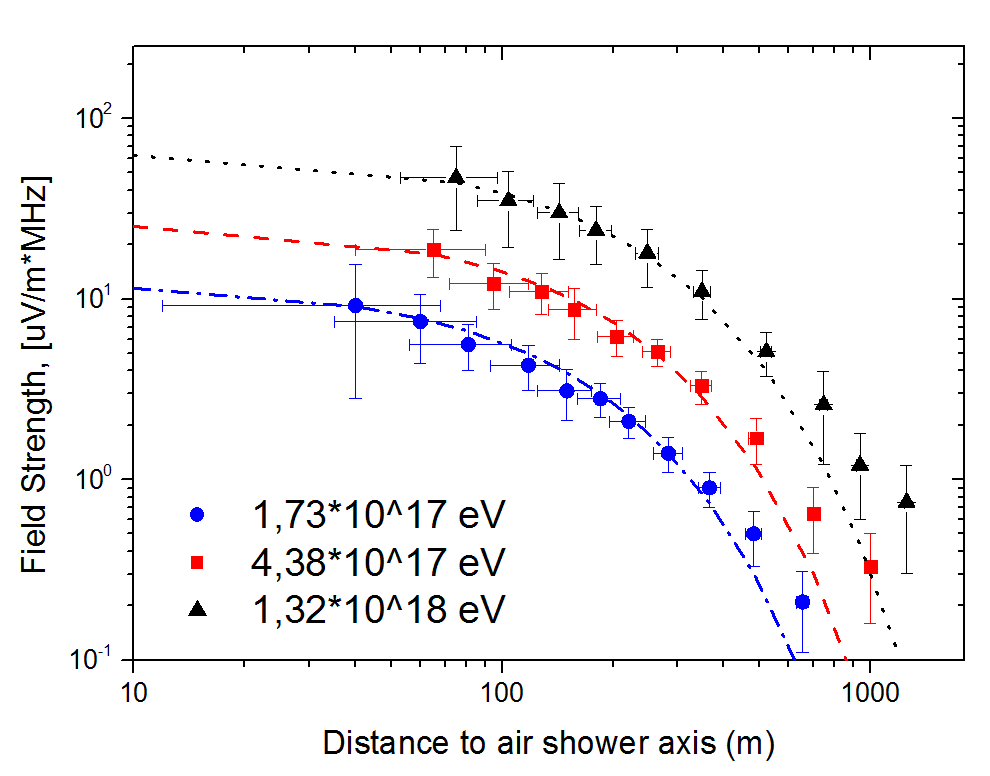 Figure 13
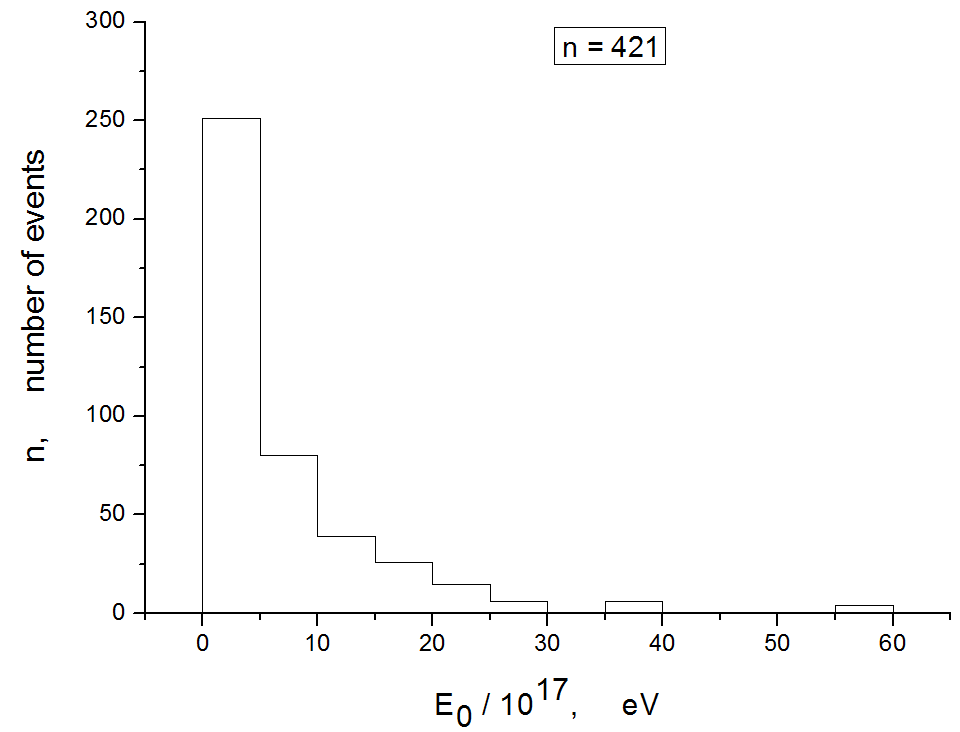 Figure 13
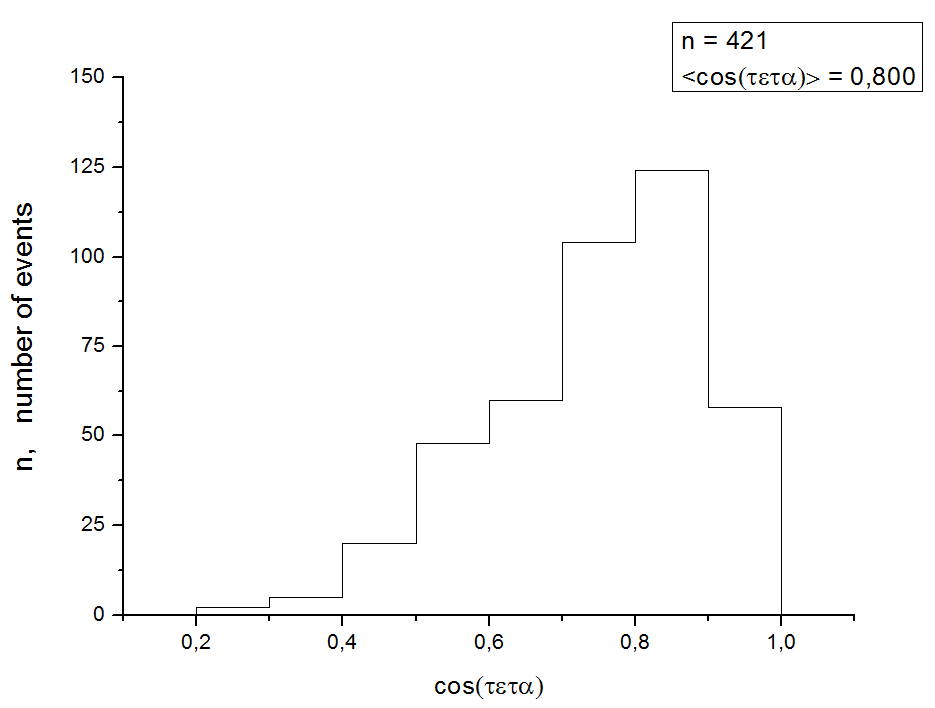 Figure 13
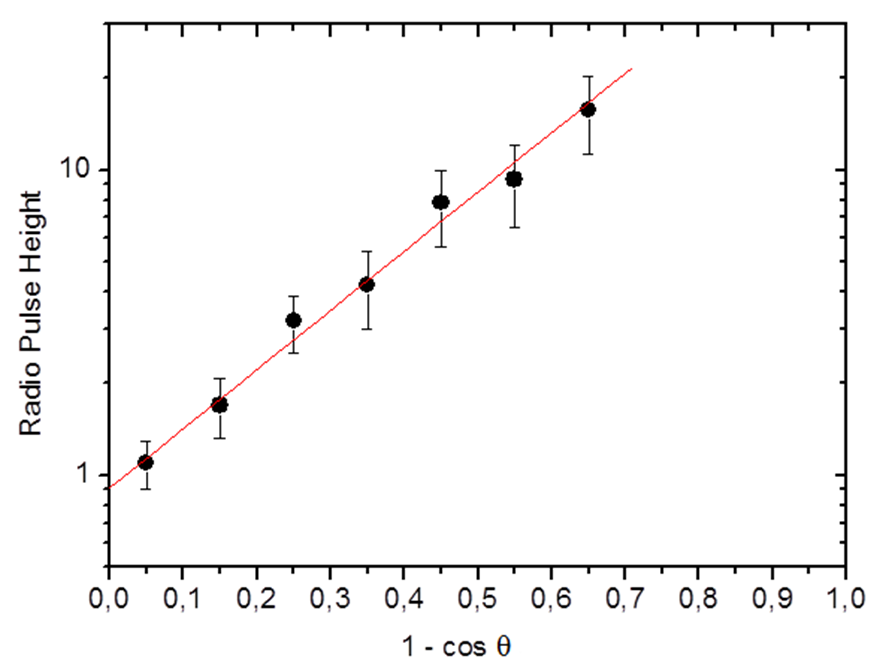 Figure 13
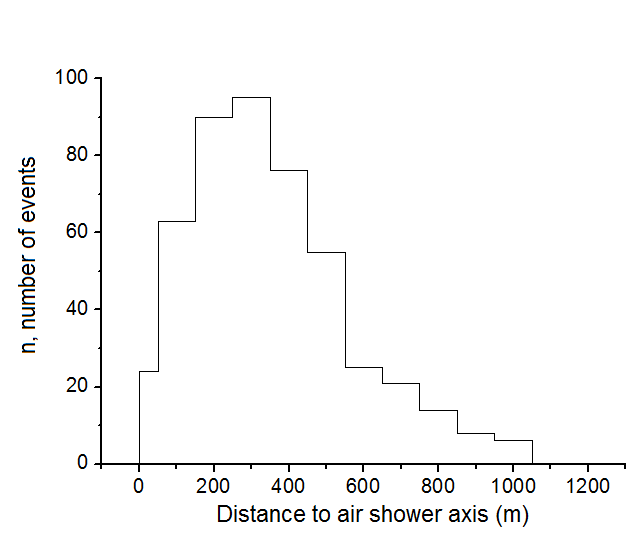 Figure 14
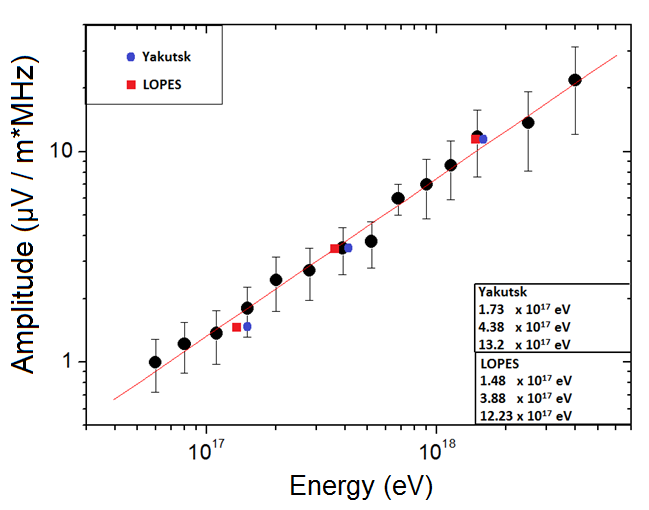 Figure 15
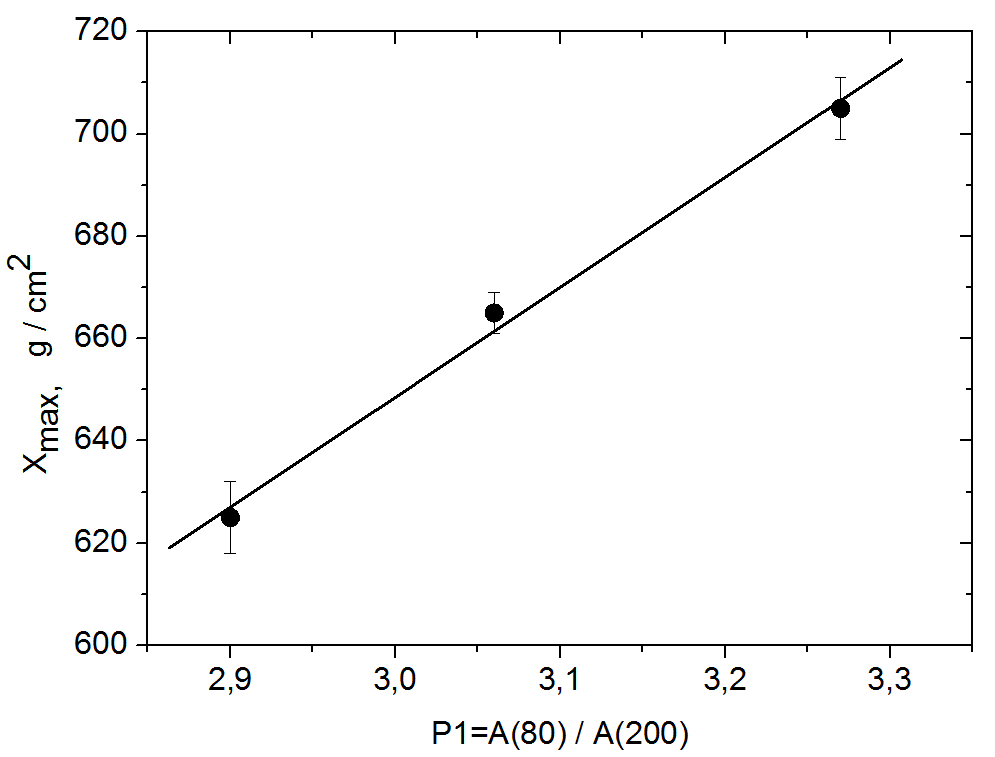 Figure 16
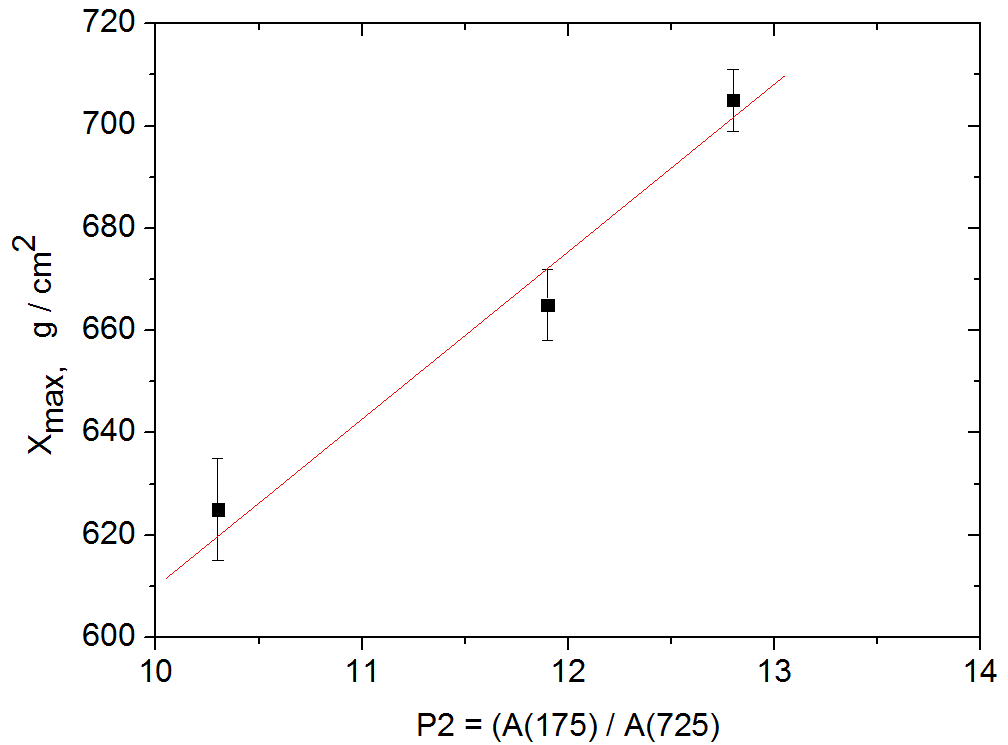 Figure 16
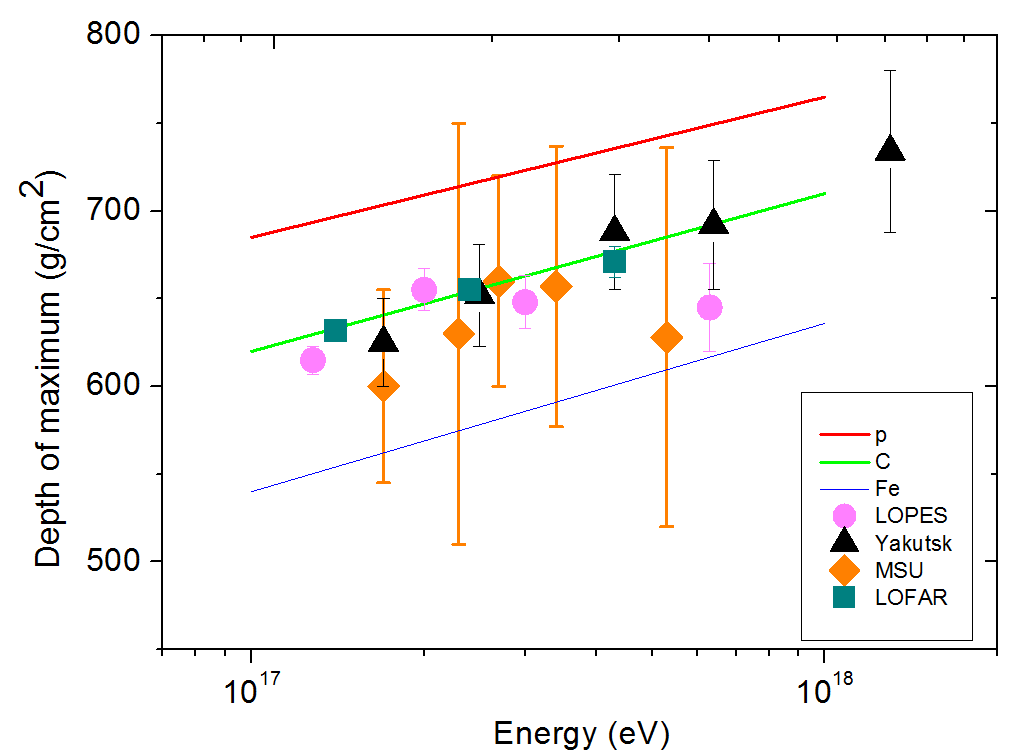 Figure 17
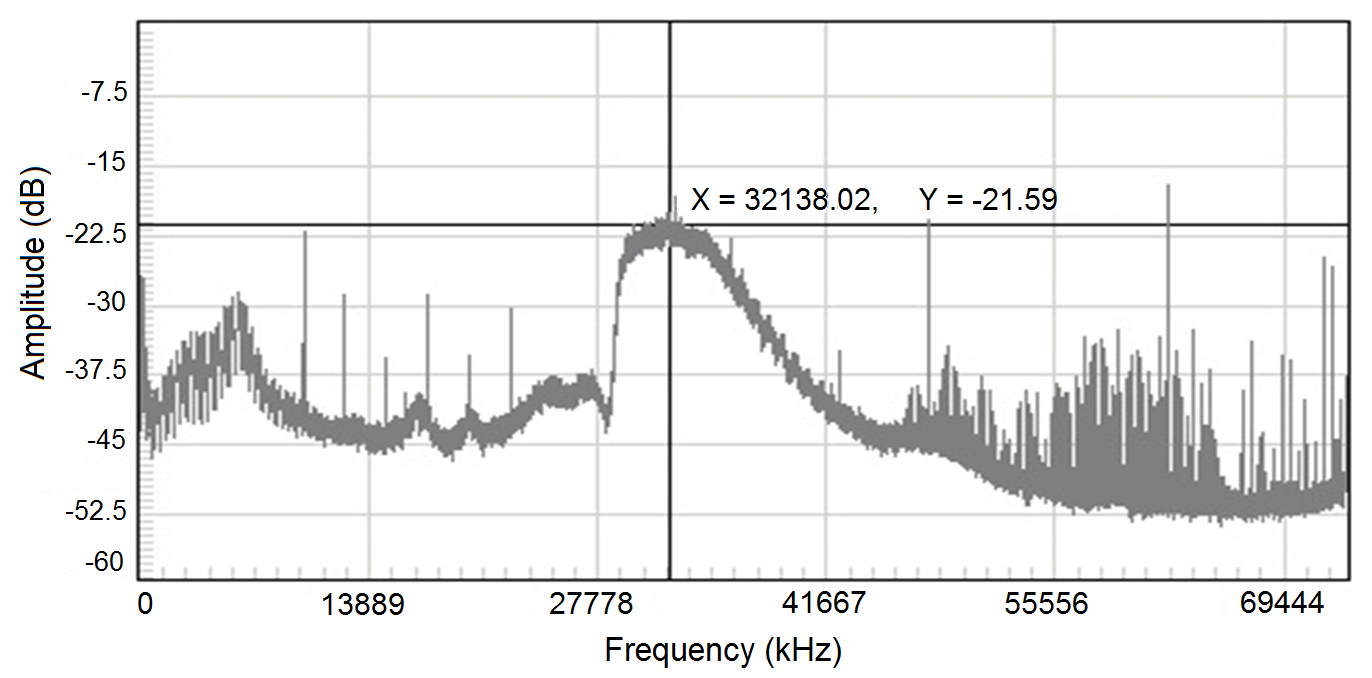 Figure 2
 Figure 3
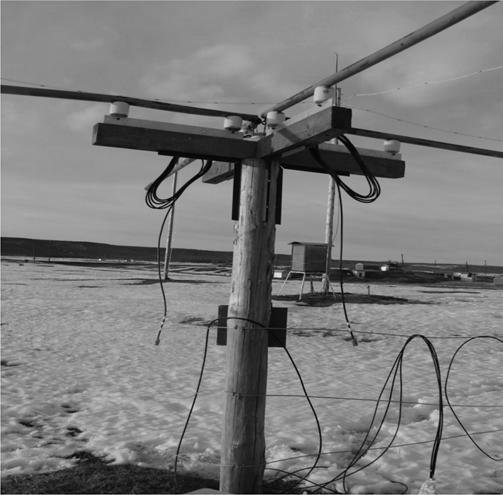 Figure 3
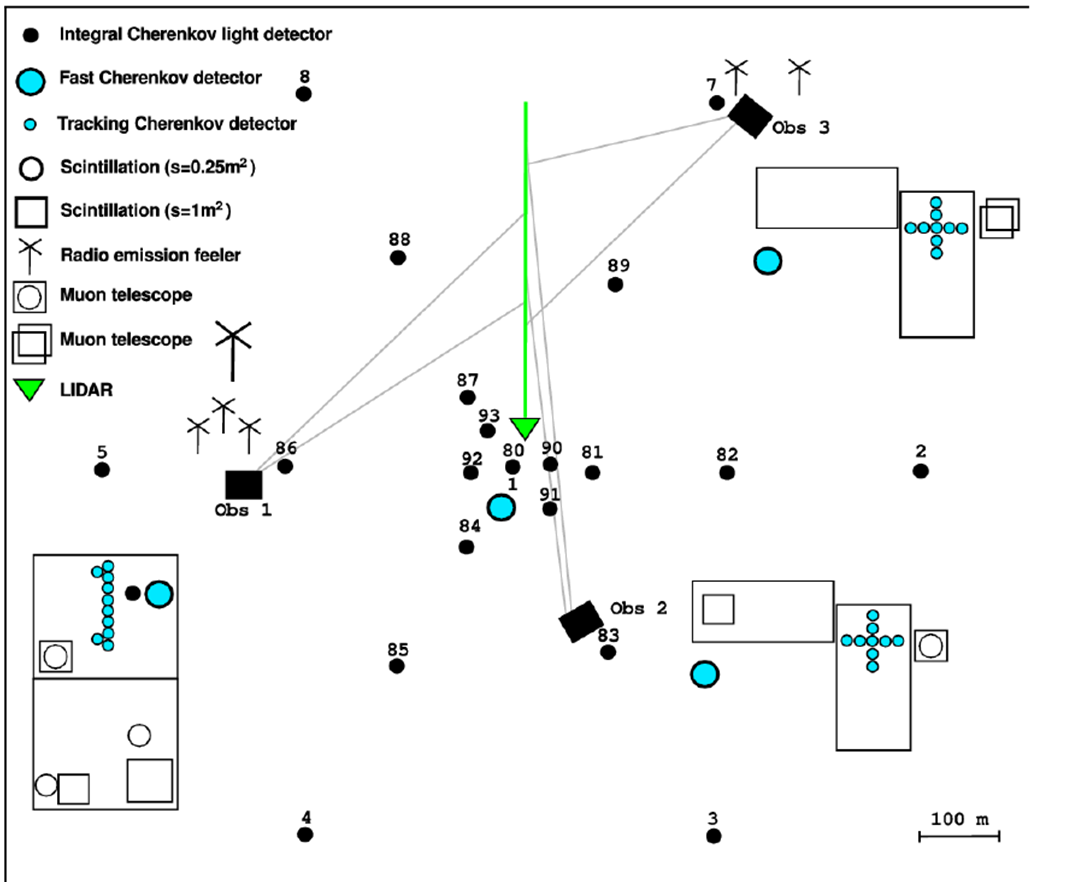 Figure 4
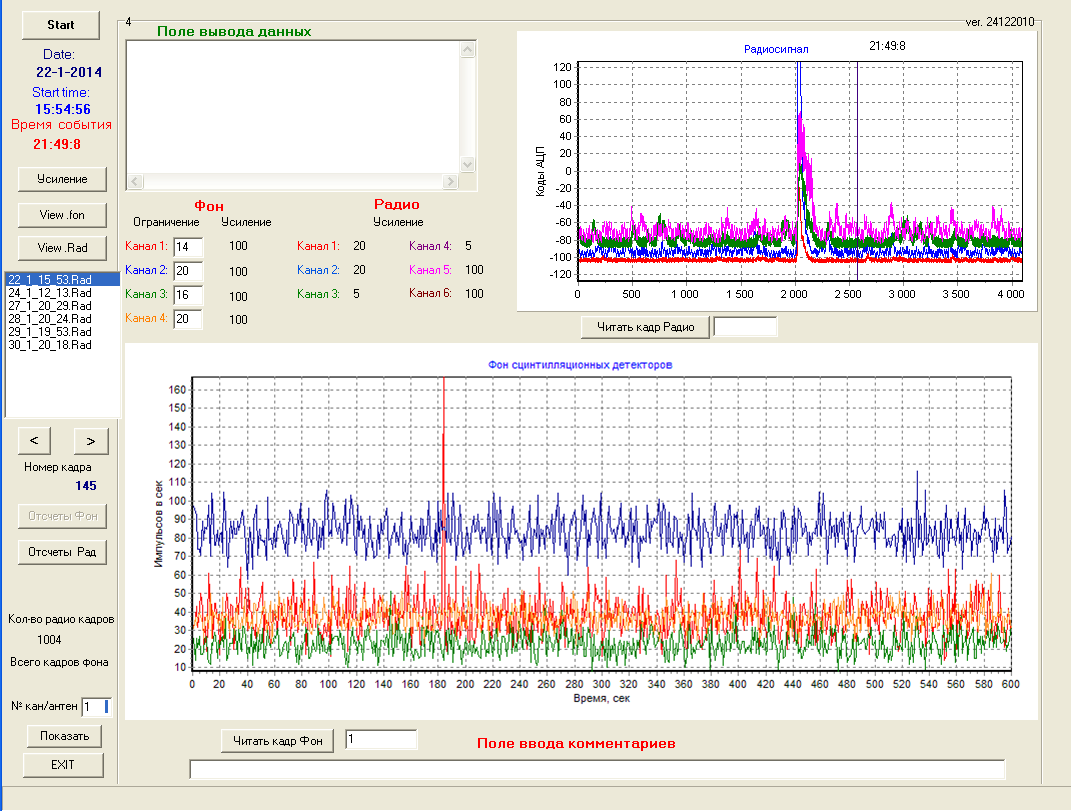 Figure 5
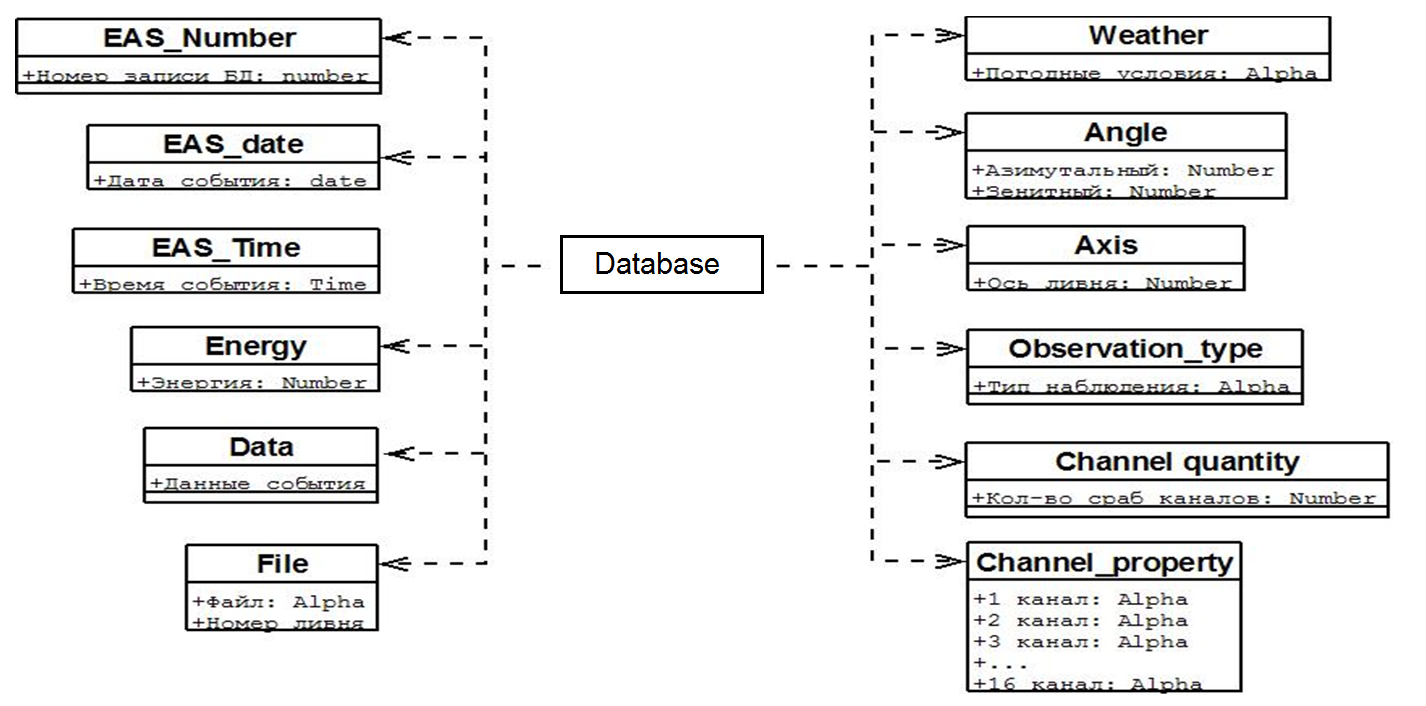 Figure 6
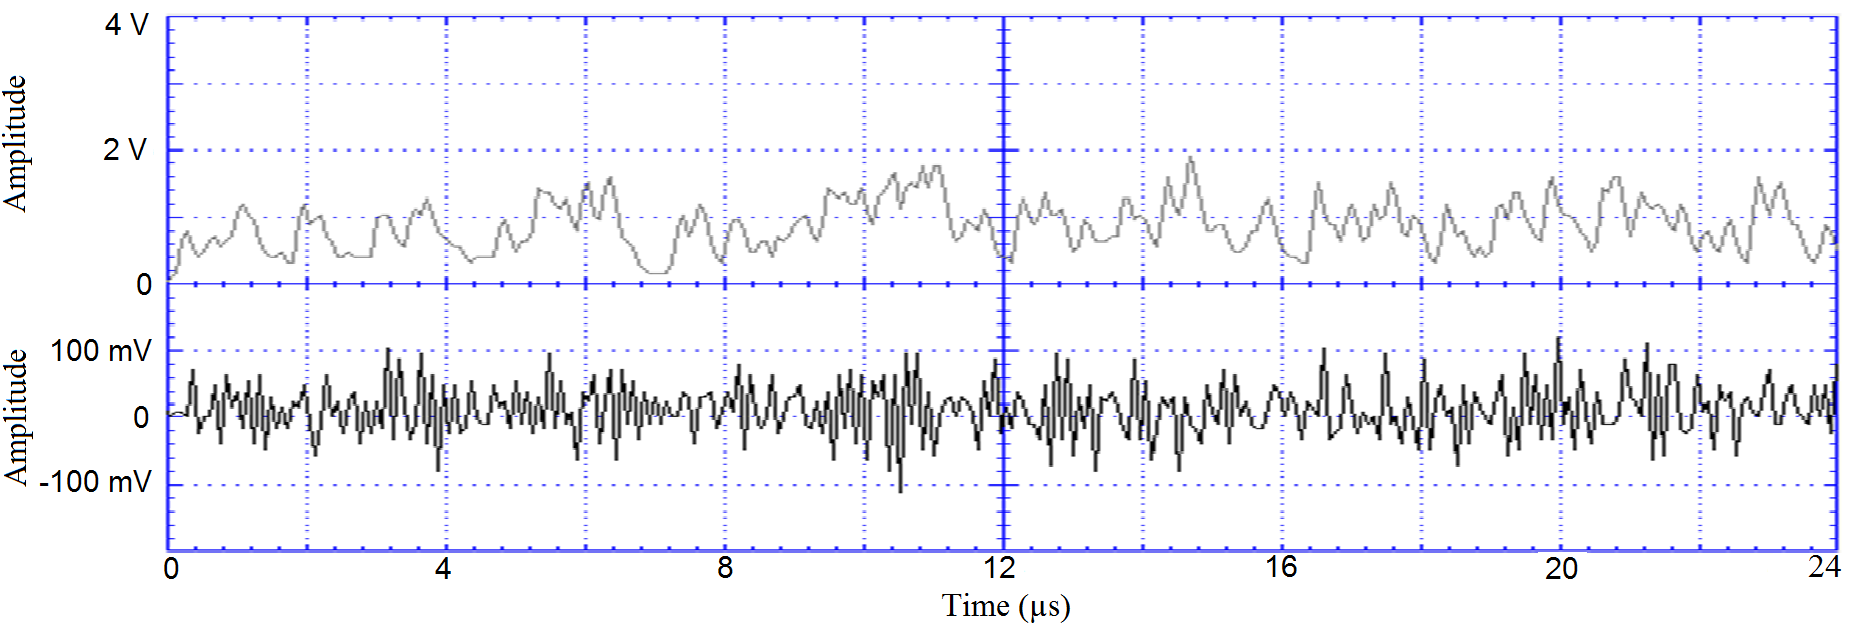 Figure 7
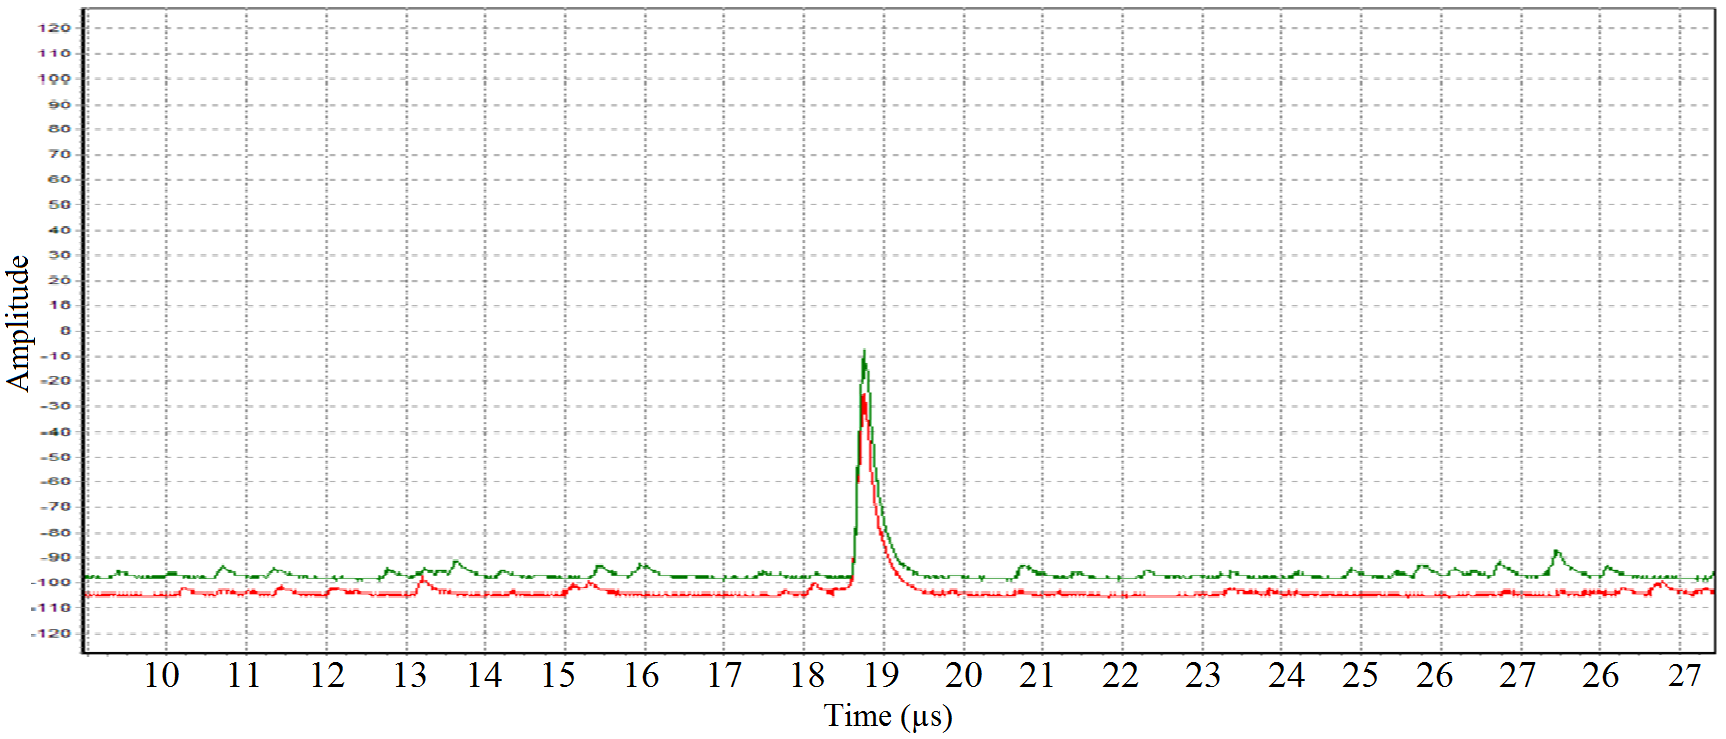 Figure 7
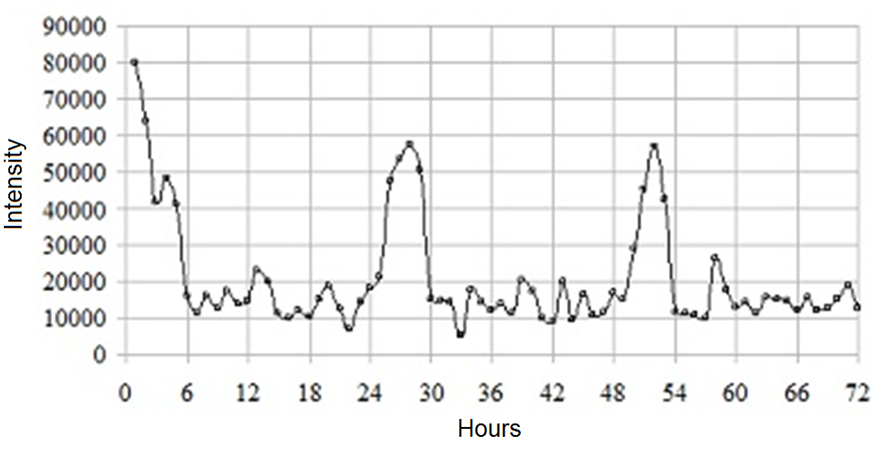 Figure 8
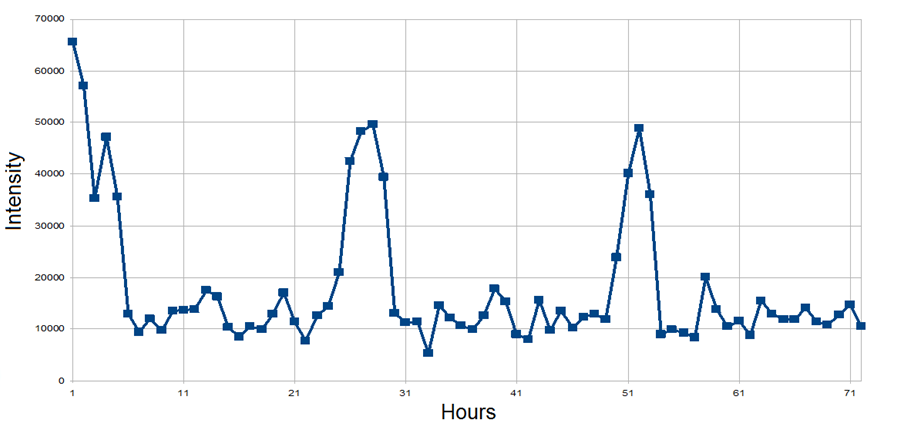 Figure 8
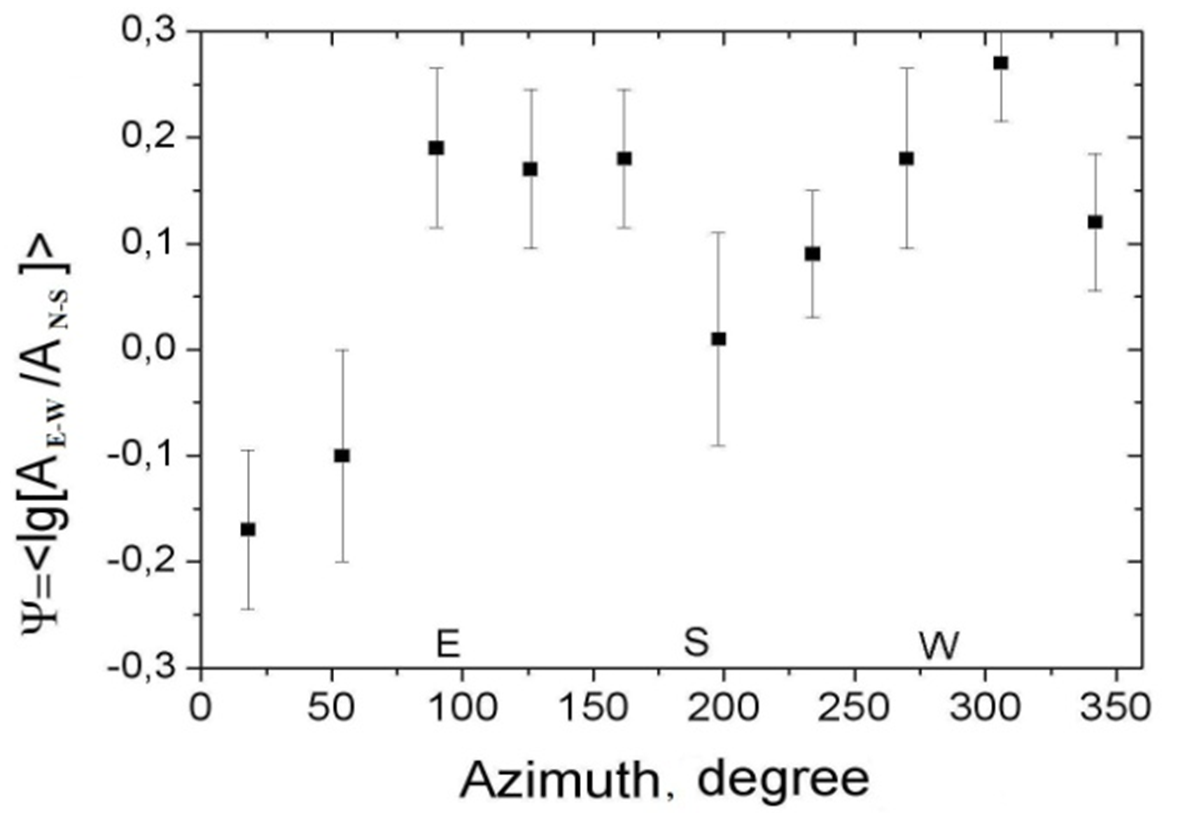 Figure 9
| Seasons | Observation time (hours) | Total EAS events number | Percentage of analyzed events | Number of EAS with muons data | Number of EAS with Cherenkov light data | Cherenkov light observation time (hours) | Number of EAS with radio emission |
| 2009-2010 | 6153.83 | 113138 | 87 | 60618 | 9897 | 621.78 | 822 |
| 2010-2011 | 6455.25 | 137830 | 89 | 56130 | 8611 | 508.39 | 1017 |
| 2011-2012 | 6533.94 | 155351 | 91 | 54559 | 9227 | 482.11 | 1183 |
| 2012-2013 | 6515.54 | 149381 | 92 | 89430 | 10219 | 591.77 | 1151 |
| 2013-2014 | 6446.44 | 147589 | 91 | 72110 | 7164 | 396.00 | 1123 |
| 2014-2015 | 6365.05 | 140101 | 72 | 82392 | 7838 | 429.34 | 840 |
| 2015-2016 | 5671.43 | 127490 | 81.6 | 62599 | 4819 | 314.60 | 867 |
| date | ,deg | , deg | E0, eV | Aν | R, m |
| 16.11.86 | 74 | 180 | 3.11019 | 58.0 | 300 |
| 16.12.87 | 71 | 178 | 31019 | 40 | 367 |
| 21.02.88 | 70 | 210 | 1019 | 3.1, 3.8 | 1030, 950 |
| 09.03.88 | 36 | 125 | 91018 | 6.2 | 792 |
| 07.05.89 | 59 | 168 | 21020 | 62.5 | 750 |
| 10.03.11 | 51 | 239 | 1.11019 | 89, 43, 5.8 | 350, 413, 604 |
| 16.05.11 | 69 | 99 | 1.61019 | 33, 29, 40 | 501, 564, 479 |
| 31.12.11 | 15 | 165 | 1.11019 | 1.2, 1.0, 2.9 | 950, 980, 860 |
| 12.04.12 | 8 | 222 | 1.31019 | 4.1, 2.8, 6.0 | 762, 785, 626 |
| 04.05.13 | 46 | 295 | 1.11019 | 5.3, 6.0, 12 | 776, 768, 368 |
| 12.12.13 | 15 | 297 | 1.21019 | 5.1, 8.4, 3.6 | 855, 806, 988 |
| 03.10.13 | 21 | 21 | 1.11019 | 9.1, 11, 2.7 | 419, 396, 815 |
| 22.03.13 | 46 | 4 | 1.81019 | 41, 48, 78 | 418, 432, 366 |
| 02.01.14 | 48 | 207 | 1.01020 | 16.3, 19.4 | 1013, 988 |
| 22.01.14 | 47 | 189 | 1.11019 | 107.6, 119.6 | 297, 266 |
| 05.02.14 | 26 | 343 | 3.51019 | 3.4, 5.6 | 671, 627 |
| 02.03.14 | 30 | 217 | 1.21019 | 4.9, 6.0, 7.8 | 782, 749, 708 |
Peer Reviews
No public reviews on file for this paper yet. If you reviewed it on a platform where reviews are public (OpenReview, ICLR, NeurIPS, ICML), you can paste yours below so the community can read it here.
Videos
No videos yet. Explain this paper in a talk, walkthrough, or lecture? Add one.
Radio Emission of Air Showers with Extremely High Energy Measured by the Yakutsk Radio Array
S.P. Knurenko
Z.E. Petrov
I.S. Petrov*∗*
Yu. G. Shafer Institute of Cosmophysical Research and Aeronomy Siberian Branch of the RAoS, Russia
Abstract
The Yakutsk Array is designed to study cosmic rays at energy 1015-1020 eV. It consists several independent arrays that register charged particles, muons with energy E1 GeV, Cherenkov light and radio emission. The paper presents a technical description of the Yakutsk Radio Array and some preliminary results obtained from measurements of radio emission at 30-35 MHz frequency induced by air shower particles with energy 11017 eV. The data obtained at the Yakutsk array in 1986-1989 (first set of measurements) and 2009-2014 (new set of measurements). Based on the obtained results we determined:
Lateral distribution function (LDF) of air showers radio emission with energy 1017 eV. Radio emission amplitude empirical connection with air shower energy. Determination of depth of maximum by the ratio of amplitude at different distances from the shower axis. For the first time, at the Yakutsk array, radio emission from the air shower with energy 1019 eV was registered including the shower with the highest energy ever registered at the Yakutsk array with energy 2 1020 eV.
Radio emission, Air showers, Ultra-high energy cosmic rays, Yakutsk array
I Introduction
The method of registration of radio emission of ultrahigh energy particles is based on the motion of charged particles in the geomagnetic field Kahn and Lerche (1966); Falcke and Gorham (2003) and Askaryan effect Askaryan (1961). Apparently, both generation mechanisms are effective in passing air shower particles through the atmosphere. Their contribution to the generation of radio emission depends on the conditions of the shower development in the atmosphere: height of the shower maximum, zenith angle of the incoming shower and energy. Full research of radio emission mechanisms is only available on the arrays with a hybrid registration system of extensive air showers (EAS) particles: electrons, muons, Cherenkov light, ionization and radio emission.
Influence from both mechanisms affects the symmetry of the lateral distribution of air showers radio emission as shown from the experiments. This is especially noticeable at small distances from the shower axis, where the radio emission intensity decreases significantly.
In the following years after this discovery, there have been many experimental studies of radio emission from air showers Jelley et al. (1965); Allan (1971), including the Yakutsk array Artamonov et al. (1987). Short reviews of the air shower radio emission work can be found in Tsarev (2004); Filonenko (2015); Huege (2016); Schröder (2017). In paper Tsarev (2004) pointed out the possibility of registration of extensive air showers (EAS) with energies above 1019 eV, employing radio equipment placed on the surface of the Earth and registering the radio emission by satellites on the Earth orbit. Surface arrays require a huge area of 3-5 thousand square kilometers for the registration of showers with such energies. In addition, it requires relatively quiet in terms of radio interference place in the urbanized society that is difficult to find. At the same time, satellite based arrays would allow a large solid angle which covers bigger areas and detects a larger number of air showers with highest energies. Thus, the problem of statistics of such showers would have been solved, and the spectrum of cosmic rays would be studied at energies up to 1021 eV. But before one put this idea into practice, we need to ensure the effectiveness of this method of registration of showers with ultra-high energies. For these purposes would most be suited the currently existing large ground arrays where exist a corresponding infrastructure which can be used for registration of radio emission. Experiments on radio radiation from the EAS were actively carried out in 60-70 years of the last century. For example, the array of the Moscow State University in the 70s registered air shower radio emission at energies 1016-1017 eV Vernov et al. (1966); Atrashkevich et al. (1978). Later, in 1986-1989, at the Yakutsk array were carried out measurements of radio emission in the energy range above 1017 eV Artamonov et al. (1987, 1988, 1990).
In recent years, interest in the air shower radio emission, as an independent method to study the physics of the EAS has grown significantly, and for registration of radio emission were built arrays of significant size Schellart et al. (2013); Fuchs and et al. (2012). This method makes it possible not only to evaluate the energy but also to reconstruct the longitudinal shower development, namely, the depth of maximum Xmax Apel and et al. (2014); Knurenko and Petrov (2015a). This is especially important for huge arrays where the uncertainty in the estimation of shower energy with different methods of detecting air showers reaches about (20-40). For example, Auger and Telescope Array difference is 20 and the cause of differences still remains unknown Matthews (2013). Thus, the radio emission, in conjunction with other methods could be employed for intercalibration of huge arrays Bezyazeekov et al. (2016); Apel et al. (2016); Aab and et al. (2016).
This paper presents radio emission of EAS with ultra-high energies data obtained by Yakutsk array in 1986-1989 and 2009-2014 years.
The paper structured as follows. In the section II the Yakutsk array is described: frequency choice for registration, equipment, software for registration and analysis. Methodological issues like background noises at the Yakutsk array region is discussed in section LABEL:yakutsk_sec_meth_issues. In section IV the results of registration of air showers with energy E = 1017-1018 eV and E1019 eV are presented, also energy estimation, determination of depth of maximum development and mass composition of CR. Conclusion is discussed in section V.
II Yakutsk Radio Array
II.1 First Stage
In the mid 80-es of the last century, the Radio Array with registration bandwidth 30-40 MHz was designed as an extension of main Yakutsk particle array Artamonov et al. (1987).The setup consisted of two parts: analog and digital. The analog part comprises the reception, amplification of the radio signal, matching circuits of the output signals by the level and frequency with the parameters of the digital recorder. The digital part of the array converts input analog signals into digital code and writes information of the radio noise state and the signal from the shower to a buffer RAM. Then the information about the noise field and a radio pulse from EAS were copied to the computer hard disc drive (HDD). Air shower radio emission is registered by 20 receiving antennas, which are installed on 10 pillars as shown in Fig. 1.
The distance between antenna pillars was 50, 100, 200, 300 and 500 meters, covering an area of roughly 0.35 km2. One pillar consists two independent half-wave dipoles with orientation E-W and N-S. Antennas installed at / 4 above ground, thus ensuring a maximum of the radiation pattern of the emission coming from the top.
Fig. 1 shows the location of antennas. At the lower part of the antenna pillar special container is located. In order to enhance the radio signals, unified broadband receivers with direct amplification at the bandwidth of 30-35 MHz were applied. Suppression of the gain at frequency 29 MHz 40 dB, at frequencies less than 28 MHz and more than 36 60 dB.
Constructively, the receivers are designed as two blocks. The first block is located under the antenna, the block consists a low noise amplifier with a gain of Ku 40 dB and output matching with the cable. In the second block, the final amplifier with gain Ku 40 dB was placed. To match with a bandwidth of the ADC at the output of the amplifier amplitude detectors are used. To improve detection of linearity powerful FET (Field Effect Transistor) type KP901 and KP902 were used.
All recording equipment: power amplifiers, detectors and ADC were placed in the two warm cabins, because of the extremely low winter temperatures (-40 ∘ C). Also, the cabins contain calibration generators and high-frequency switches.
Calibration
During the calibration process, the input of the antenna amplifier is disconnected from the antenna and is connected to the output of the calibration generator via coaxial cable. Calibration is performed automatically without operator intervention at specified intervals of time. For this purpose, the remote-controlled generators G4-151 and RF switches on the relay of REV-15, which is controlled by a central computer, were used. To improve the accuracy of timing synchronization of additional ADC of crystal oscillators has been introduced.
ADC
In the first stage of the experiment, ADC F-4226 with the following parameters were used: sampling frequency - 20 MHz, conversion time - 50 ns, accuracy -8 bits (256 amplitude points), RAM-1024 word capacity (51 ms). Continuous operation of the converter allows one to store information in the memory of the radio pulses before receiving the ADC trigger signal input from the scintillation detectors of the Yakutsk array. The 9th bit of data word is a sign of the data are in the RAM to run.
Additional synchronization with EAS provided by a separate channel of signal detection for time synchronization at a frequency of 207 MHz with an accuracy of 100 ns, using the same type of ADC.
II.2 Current State of Radio Array
II.2.1 Selection of Optimal Frequency for Air Showers Radio Emission Registration
In 2009, for an optimal frequency choice, the background frequency spectrum from 1 to 100 MHz was analyzed Kozlov et al. (2012), according to work Ellingson et al. (2007). We used digital spectrum analyzer ASA-2332. At frequencies, up to 20 MHz due to the presence of large natural radio noise (primarily storm origin), it is not possible to distinguish air showers pulses with sufficient efficiency. Therefore, it is reasonable to select frequencies above 20 MHz, since ionosphere noises amplitude decreases dramatically in the transition to high frequencies and is about (0.5-1)Vm*-1*MHz*-1* at the frequency 20 MHz. Over this frequency range, the amplitude of galactic noises decreases much slower with the frequency than storm noises. At 32 MHz it is 1.0-2.0 Vm*-1*MHz*-1*. Thermal noise of the antenna is much smaller than the galactic noise at frequencies up to 100 MHz and has almost no influence on our measurements. Therefore, the most favorable frequency range for the measurements at the Yakutsk array is 30-40 MHz, where expected the best signal-to-noise ratio because at higher frequencies the spectrum is limited by strong interfering man-made signals, e.g. broadcast television.
Also, we measured background noise at the output of the analog receiver (Fig. 2) of the Yakutsk radio array. The Fig. 2 indicates the window with a frequency of 28-42 MHz with no significant interference.
II.2.2 Hardware and Measurement Technique
In early 2009, at the Yakutsk array, the radio array was reconstructed Petrov et al. (2011). It consists 12 crossed at 90∘ receiving antennas oriented in directions W - E (West - East), N - S (North - South), the peripheral recording device (PRD) and data storage on a personal computer. PRD was located directly at the antenna field. The antenna field is located close to the main center of Yakutsk array and consists two independent clusters, synchronized by GPS system. The spacing between antennas was 50 m, 100 m and 500 m. Antennas located at a distance of 50-100 m from ground stations with scintillation detectors.
Antennas that used to register high-frequency signals are shown in Fig. 3a and Fig. 3b.
The bandwidth is 4 MHz, sensitivity 10V (2 Vm*-1* MHz*-1*), the dynamic range is 50 dB. Receiving channels are based on the principle of direct signal amplification and subsequent detection. Antenna low noise amplifiers are placed into special containers (isolated metal box), connected directly to the antenna; a buried coaxial cable connects the antenna with final amplifier, filter and ADC for the digital data acquisition. The main paths are based on the cascade amplification circuit with mismatched contours. As a recorder computer, IBM PC / AT type was employed. We used fast 8-bit LA n10M8PCI as an ADC with sampling frequency 100 MHz.
Synchronization of all antennas including with a central station of Yakutsk array is provided by GPS system. It made possible to identify radio emission from air showers with a great accuracy. The location of the antenna sets is shown in Fig. 4.
Registration of radio emission is triggered by one of two event triggers from the Yakutsk array. The first of the two possible triggers is the main Yakutsk array trigger, which registers in an area of 12 km2 showers with energy more than 1017 eV. The Small Cherenkov array (Fig. 4) registers in an area of 1 km2 showers with energy 1015-51017 eV.
The controller registration, collection and storage of the data was performed based on an industrial computer with 19 PCI slots (can be installed 19 PCI card). The program saves a number of the antenna and the number of ADC, the date, the time, the air shower and the technical characteristics of the ADC. The sample rate of the ADC is 100 MHz, the capacity of the buffer memory is 2 MB. In addition, the ADC allows recording the prehistory (before the trigger arrival) of 25 s and history (after the arrival of the trigger) for 15 s.
Calibration of radio channels is performed by applying the calibration of radio pulses at the input of antenna amplifiers. signal duration was 200 ns, 32 MHz frequency filling. Calibration pulses are passed through the entire path and recorded in digital form on the hard disk along with the experimental data.
II.2.3 Registration and Analysis Software. Database
For the registration, control and calibration purposes the program (Fig. 7) was developed. It provided a display of pulse information from each radio channel and its condition. Each frame contained information of 4 antennas colored individually and the program is able to select a single channel and view it. The program is able to load previously saved registration data, view it, use selection and group events by given criteria, create a new file with selected showers. All pulses data including calibrating pulses from every antennas are saved in separate file. Further, these data are used for mathematical processing of each shower event.
The software is able to show a background of scintillation detectors as well as radio emission background before and after registration of radio signal. In order to do this one need to select file viewing mode by clicking on the “View.Rad” button (Fig. 7). Directly from interface panel one can set selection criteria for the registered data and create a new file with only showers that fits selection criteria. For analysis of accumulated statistics the program of preliminary selection, data accumulation and analysis was developed.
The database is a table in Paradox 7 format (Fig. 6). The database structure is as follows: record number, date, time, observation type, channel quantity, weather condition, event data and link to the original file, arrival angle of the shower, shower axis, primary particle energy and different time characteristics of the pulses.
Due to the small number of antennas, only 45 of showers data contains showers with radio emission the software has additional code that enables edit function. The edit function allows one to find air shower event with no radio emission, false events, and different types of ADC failure, exclude obvious noises etc. Remaining shower events with radio emission comprised cleared database, which can be used for further analysis.
III Methodological Issues of Measurement of Air Showers Radio Emission
III.1 Radio Noise Background at Yakutsk Array Latitude
Analysis of noise background made at Yakutsk array shown that noise background contains pulses of different nature, which can be divided by a signal duration and pulse shape. The analysis of spectrum was carried out during different seasons (autumn, winter and spring) for a week. In the total spectrum, artificial interference from high voltage electric circuits can be seen (Fig. 8a). They are distinguished by a wide spectrum and long signal duration about milliseconds. In addition, there were signals from broadcasting stations mostly from Asia and Japanese islands. In order to exclude them we chose frequency band free of the broadcast stations (II.2.1). In addition, we used trigger from the Yakutsk array to register air shower radio emission and the peak of radio emission signal should be within signal window, according to the trigger signal delay. Also, by using scintillation and Cherenkov detectors as a trigger we exclude noise signals with high amplitude registered by radio emission antennas. They feature certain set of pulses, specific appearance on the air and pulse duration. For these reasons, they are easily identified from the whole spectrum of observed pulses. Apart from man-made noises, we observed natural background noise of the Galaxy. The pulses form of this emission were close to the form of pulses from EAS.
III.2 Diurnal Variation
In order to study the nature of the noise spectrum, we analyzed the rate of pulses for 3 days (15 - 17 October 2011). The result is shown in Fig. 8a and 8b.
A diurnal variation is clearly visible. This is also indicated by the difference in intensity of the spectra obtained for the day and night periods Petrov et al. (2011). The observed pattern in a good agreement with the result obtained in the paper Ellingson et al. (2007), which explains the presence of the diurnal variation of the radio noise amplitude by the non-uniform luminosity of different regions of the Galaxy. The larger amplitude at night is attributable to the plane of the Galaxy, which consists the highest number of emitting sources. Lower amplitude is typical for daytime when the antennas measures emission from the polar region of the Galaxy, which has lower luminosity than the plane of the Galaxy.
III.3 Air Shower Radio Emission Polarization
In order to study polarization effect of air showers, we selected 600 events with energy 5 1016 eV. The showers axis were located within Small Cherenkov Array perimeter of 500 m and zenith angle were 45∘. Fig. 9 shows the dependence of amplitude ratio in antennas with a different orientation from azimuth angle. Preliminary analysis has shown that the amplitude of the radio signal in E-W direction is always higher than the amplitude of radio signals in N-S direction. In our case, we effectively recorded radio emission from the showers coming from the north. Thus, the radio emission from the EAS has a distinct polarization perpendicular to the direction of the geomagnetic field, which causes the polarizing effect of radio waves due to the action of the geomagnetic mechanism.
IV Results
IV.1 Experimental Data
Air shower detection effectiveness depends on spacing between stations, energy registration threshold, area of array and number of stations. In the case of the Yakutsk radio array with the area of s = 0.1 km2 and the distances between antennas R= 50, 100 and 500 m with 12 antennas, the expected effectiveness of measurements is low. It can be seen from Table 1 with raw data of registered air showers in the annual measurement cycle. Despite the significant observation time comparing to, for example, optical measurements, which is as low as 10 of annual measurements cycle of the Yakutsk array. A number of air showers with registered radio emission are only a small fraction. This is due to small amount of antennas and relatively small area of radio array. Besides, in showers with energy less than 1017 eV and with distance between antenna and axis larger than 500 m radio signal is commensurable to background noise. In this case, it’s difficult to distinguish air shower radio emission among the noises.
A total number of air shower events with radio emission registered by radio array 2009-2016 for 44141 hours is 7003 air showers (Table 1).
To plot LDF, we selected 421 air showers with energy 1017 eV and zenith angle 45∘. In all showers, there were measurements of the total charged component, muon component and the flux of Cherenkov light. A complex measurement of the shower made it possible to establish a relationship between the magnitude of the radio signal and the different characteristics of the EAS: the energy of the electromagnetic component and the longitudinal development of the shower in the atmosphere.
IV.2 Air Showers with Energy more than 1019 eV
Fig. 10 shows radio pulse of inclined air shower with energy 31019 eV Artamonov et al. (1990). In Table 2 most of the showers have energy from 1019 to 3.51019 eV, and two showers with energy 1020 eV Knurenko and Petrov (2016). Dots are normalized to mean energy E0 = 1.541019 eV, to mean zenith angle <$$\theta$$> = 43.1*∘* according to eq. 7, eq. 8 and in logarithmic scale. The approximation is given by eq.1. In Fig. 11 there are showers (triangles) that significantly higher than other dots. These are signal registered in two showers with maximum energy. We did not normalize these air showers to emphasize the special status of these points because they belong to the showers with energy E0 1020 eV and their amplitude greater than in other showers.
We see that dots indicates rapid attenuation of the radio signal and shows LDF dependence on the distance of antennas from air shower axis.
Table 2 shows air showers with the highest energy, registered at Yakutsk array in 1986-1989, 2009-2014 years.
IV.3 LDF of Air Showers Radio Emission
In Fig.12 shown the signals registered by antennas at different distances from the shower axis. The vertical lines marked errors related to the absolute calibration of the radio signal. As one can see that radio emission amplitudes are significantly attenuated with distance. This picture of the formation of the spatial distribution of radio emission indicated its dependence from the longitudinal development of air showers. This is confirmed by calculations and can be used to recover the depth of maximum development XmaxHuege et al. (2008); Kalmykov et al. (2013). In order to do that it’s enough to measure an amplitude of radio emission at different distances from air shower axis and use their ratio to estimate Xmax as shown from model calculations and experiments at LOPES, Tunka-Rex and Yakutsk Apel et al. (2012); Bezyazeekov et al. (2016); Knurenko and Petrov (2015b).
To plot average LDF, we selected showers with zenith angle 45∘- and with shower axis within the circle around the center of Yakutsk array with radius 500 m. Then, selected showers were divided into 3 groups with energy 1.731017 eV, 4.381017 eV and 1.321018 eV. The resulted set of showers were split in the evenly spaced distance of lgR = 0.4 m and at each interval average amplitude was calculated based on local gradient Knurenko and Petrov (2013). Additionally, we took into account noise and fluctuations of the signal at the threshold of each receiving antennas (zero points) according to Schröder and et al (2012). Because of this for analysis, we selected air showers with signal-to-noise ratio 5, i.e. showers within distances range of 50-500 m depending on the shower energy. For showers with energies above 31018 eV, the distance interval shifted towards higher distances R. Dependence of amplitude from distance for each energy range is shown in Fig. 13, normalized to zenith angle = 35∘. The approximation curves is given by:
[TABLE]
where A - radio emission amplitude, - the fit parameter(depends on the energy), R - the distance from shower axis to the antenna, R0 - the slope parameter.
As seen from Fig. 13, the shape of LDF is fitted well by formula (1) only in the range of 50-350 m from the shower axis at greater distances for its approximation, we probably need another exponent.
Fig. 13 shows that slope of LDF increases with energy. Possibly, this change in the slope of LDF is related to the development of Xmax in the atmosphere. This fact we used to estimate Xmax by ratio P1 = A1(80)/A2(200) in showers with energy E 31017 eV and P2 = A1(175)/A2(725) in showers with energy E 31018 eV. From long-term data, we found the dependence of radio emission amplitude on zenith angle , energy E and depth of maximum development Xmax Knurenko and Petrov (2015b). The approximation was chosen by maximum likelihood estimation:
[TABLE]
Where, - zenith angle, - geomagnetic angle (13.8 ∘ for the Yakutsk array), R - the distance to the antenna, E - the energy of the primary particle, X - the depth of the maximum development of the air shower.
From equation (IV.3) it follows that radio emission LDF depends on energy E and depth of maximum Xmax.
IV.4 Energy Estimation
IV.4.1 Energy balance method
The method of determining the energy at the Yakutsk array is based on the expression (3) used inDyakonov et al. (1991); Knurenko et al. (2006):
[TABLE]
In the first approximation, the sum of the components presented in (3) will be the total energy of the primary particle. All summand of E0 were reconstructed with use of integral parameters of air shower. In our case, they are determined by the following method. The energy, scattered in the atmosphere above observation level by electrons is determined by formula (4):
[TABLE]
Here F - total flux of Cherenkov light of air shower; k(x,Pλ) - fitting coefficient that takes into account the transparency of the real atmosphere and expressed through the depth of the development of the EAS measured at the arrayIvanov et al. (2007):
[TABLE]
where N - total number of charged particles at the sea level, - mean free path of air shower particles, which was found from correlation parameters Ns(X) - Q(400) at different zenith angles Glushkov et al. (1953). The energy transferred into muons with the threshold energy 1 GeV, estimated by the formula (6)
[TABLE]
Where - average muon energy, calculated according to the measured energy spectrum of air shower muons up to Е = 103 GeV and equal to 10.6 GeV. Nμ - total number of muons with threshold energy E 1 GeV.
Remaining insignificant part (5) of primary energy that is difficult to estimate experimentally we determined from calculations. Magnitude of ionization losses of muons is equal to Eμi = (0.120.09) Eμ, energy losses on nuclear fission in the air as 0.5 GeV, ionization losses of hadron component in the atmosphere as Ehi = (5.6 2.2)10Eei and the energy corresponding for neutrino component as Eν = (0.64 0.18)Eν.
The uncertainty of the method for estimating total energy of air shower in our case is 25. Further, this energy estimation is used to establish a relation of the radio emission amplitude with EAS energy Knurenko and Petrov (2015b).
IV.4.2 Radio emission correlation with air shower energy
Air shower data, plotted against energy and zenith angle in Fig. 14. OY axis - number of n, OX axis - air shower energy. In Fig. 15 OY axis - number of n, OX axis - zenith angle .
Selected showers were used to plot dependence of radio emission amplitude on zenith angle (Fig. 16). Obtained dependence is well described by formula:
[TABLE]
Fig. 17 shows the distribution of the distances from antennas to air showers. In Fig. 17 shown that the majority of antennas are in the range of 200 - 500 m. For this reason, median average distance R = 350 m was taken for normalization. The amplitude of antennas at different distances from shower axis was normalized to Rmed. Normalized radio signals were used to plot dependence of radio emission amplitude from air shower energy (Fig. 18). Dependence of amplitude on energy is obtained from individual shower analysis in the paper Knurenko et al. (2013)(eq. 8). The energy was estimated from air shower Cherenkov total light flux Knurenko et al. (2006).
[TABLE]
Here denotes the estimated radio amplitude and the energy of the primary particle.
IV.5 Estimation of Depth of Maximum Development Xmax by Radio Emission LDF
Depth of maximum development of air shower Xmax at Yakutsk array determined by cascade curve reconstructed by lateral distribution of Cherenkov light using inverse problem method Tikhonov and Arsenin (1977) The algorithm described in details in works Dyakonov et al. (1988); Knurenko et al. (2001). A Fredholm equation of the first kind (9) is the basis of the algorithm, which in our case is solved by the adaptive method Kochev (1985).
[TABLE]
where - the function defined by lateral-angular distribution of electrons in partial electron-photon cascade, - cascade curve; - level of ”noises”, depends on measurement uncertainties, statistical processing of the data, function , integration etc.; - transmittance of the atmosphere; and - upper and lower limits of the atmosphere area.
As seen from eq. (9) the method takes into account physics of air shower electron-photon component development and characteristics of the atmospheric conditions during registration of the Cherenkov radiation Dyakonov et al. (1999).
Next, we had obtained the empirical relation of Cherenkov light LDF slope P(Q1/Q2) with Xmax for vertical and inclined showers Dyakonov et al. (1991); Knurenko and Sabourov (2011).
In Fig. 19a and Fig. 19b correlation of LDF slope with is shown. The correlation was found by analyzing air showers registered by Cherenkov detectors and radio antennas Knurenko and Petrov (2015b). Obtained result indicates the dependence of radio emission LDF on the depth of maximum development Xmax that allows studying physics of air showers by radio emission data.
Xmax correlation with a parameter P1 = A1 (80) / A2 (200) P2 = A1 (175) / A2 (725) is shown in Fig. 19a and Fig. 19b. The solid line is simple approximation:
[TABLE]
where is the ratio of amplitudes at 80 m (80) and 200 m (200), is the ratio of amplitudes at 175 m and 725 m , and are determined by the eq.1.
To estimate the depth of maximum Xmax in individual showers we used formula (10). The formulas have the uncertainty of 10-25 g/cm2 in the range of 600-790 g/cm2 as shown by model calculation. Near sea level accuracy of Xmax estimation decreases. In general, the accuracy of measurement of the amplitude of the radio signal and EAS parameters reconstructed by radio emission depends on the error of the electronics (ADC, preamplifier and postamplifier), mathematical processing methods and a systematic uncertainty of energy estimation.
Fig. 20 shows the dependence of Xmax from energy obtained by averaging a large number of individual showers. For comparison, results of LOPES, LOFAR and MSU (Moscow State University) are also plotted Kalmykov et al. (2013); Apel et al. (2012); Buitnik and et al. (2014). Solid lines are model calculations of hadron interactions QGSjetII-04 for primary particles p, C, Fe Ostapchenko (2011); Heck et al. (1998). The experimental results within experimental error are consistent with each other. Still, large statistical errors do not allow us to make a definitive conclusion about the mass composition in the energy range 1017 - 1018 eV, but by comparison of obtained results with model calculations QGSjetII-04, the preliminary conclusion would be of the mixed composition of cosmic ray particles. In the future, with more statistics of air showers with radio measurements more specific conclusion about the mass composition can be made.
V Conclusion
The Yakutsk array for more than 45 years continuously registers air showers in the energy range 1015 - 1020 eV. Constantly upgraded, extending the range of techniques to study the structure of spatial and longitudinal EAS development Artamonov and et al. (1994); Knurenko et al. (2001). Measurement of the radio emission from the EAS at the start of the Yakutsk experiment in 1970 was part of the research program and now we can conclude some results:
Long-term observation of air shower radio emission with ultra-high energies at the Yakutsk array shown that such measurements are promising at energies E 1019 eV. In addition, a function of air shower radio emission attenuation at energies E 1019 eV was obtained. 2. 2.
Empirically evaluated the shower energy E0 from radio emission amplitude and Xmax from LDF of radio emission Knurenko and Petrov (2015b). 3. 3.
First shower with energy 21020 eV registered by antennas at Yakutsk array. 4. 4.
It was shown by measurement at Yakutsk array that the radio emission from the relativistic shower particles at energies above 1017 eV can be used to study the physics of the air showers as an independent method and in conjunction with other methods of registering EAS for their mutual calibration Knurenko and Petrov (2015b). 5. 5.
In the future, the method of measuring radio emission, one can study the spectrum and mass composition of cosmic rays at energies above 1019 eV not only registering radio emission on the surface Petrov et al. (2011); Huege (2016) but also significantly increasing the aperture ratio of the array by placing the antenna on the space station, orbiting Earth Tsarev (2004).
Acknowledgments
The reported study was funded by RFBR according to the research project 16-29-13019.
We wish to thank all of the staff of the Yakutsk Array for the opportunity to use experimental data and useful discussion during the article preparation.
References
- Kahn and Lerche (1966)
F. Kahn and I. Lerche, Proc. of R. Soc. A 289, 206 (1966).
- Falcke and Gorham (2003)
H. Falcke and P. Gorham, Astroparticle Physics 19, 477 (2003).
- Askaryan (1961)
G. Askaryan, Sov. Phys. JETP 41, 616 (1961).
- Jelley et al. (1965)
J. Jelley, J. Fruin, N. Porter, T. Weekes, F. Smith, and R. Porter, Nature 205, 327 (1965).
- Allan (1971)
H. Allan, Prog. in Elemen. Part. And Cos. Ray Phys 10, 171 (1971).
- Artamonov et al. (1987)
V. Artamonov, V. Atrashkevich, T. Egorov, and et al., Proc. of Extensive Air Showers with Energy more than 1017 eV pp. 109–113 (1987).
- Tsarev (2004)
A. Tsarev, Physics of Elementary Particles and Atomic Nuclei 35, 1 (2004).
- Filonenko (2015)
A. Filonenko, Physics-Uspekhi 58, 633 (2015).
- Huege (2016)
T. Huege, Physics reports 620, 1 (2016).
- Schröder (2017)
F. Schröder, Progress in Particle and Nuclear Physics 93, 1 (2017).
- Vernov et al. (1966)
S. Vernov, A. Abrosimov, V. Volovik, I. Zalyubovsky, and G. Christiansen, JETP Letters pp. 157–162 (1966).
- Atrashkevich et al. (1978)
V. Atrashkevich, O. Vedeneev, C. Alan, and et al., Nuclear Physics 28, 712 (1978).
- Artamonov et al. (1988)
V. Artamonov, V. Atrashkevich, T. Egorov, and et al., Proc. of All-Union conference of cosmic rays 1, 47 (1988).
- Artamonov et al. (1990)
V. Artamonov, T. Egorov, A. N. Efimov, and et al., Proc. 21st ICRC 9, 210 (1990).
- Schellart et al. (2013)
P. Schellart, A. Nelles, S. Buitink, and et al., AA 560, A98 (2013).
- Fuchs and et al. (2012)
B. Fuchs and et al., Nucl. Instr. and Meth. A 692, 93 (2012).
- Apel and et al. (2014)
W. Apel and et al., Physical Review D 90, 062001 (2014).
- Knurenko and Petrov (2015a)
S. Knurenko and I. Petrov, J. Phys.: Conf. Ser. 632, 012100 (2015a).
- Matthews (2013)
J. Matthews, Proc. of 33rd ICRC p. 1218 (2013).
- Bezyazeekov et al. (2016)
P. Bezyazeekov, N. Budnev, O. Gress, and et al., JCAP 01, 052 (2016).
- Apel et al. (2016)
W. Apel, J. Arteaga-Velásquez, L. Bahren, and et al., Physics Letters B 763, 179 (2016).
- Aab and et al. (2016)
A. Aab and et al., Phys. Rev.D 93, 12005 (2016).
- Kozlov et al. (2012)
V. Kozlov, S. Knurenko, V. Mullayarov, Z. Petrov, and M. Pravdin, Proc. 1st Int. Conf. Electromagnetic Method of Environmental Studies pp. 215––217 (2012).
- Ellingson et al. (2007)
S. Ellingson, J. Simonetti, and C. Patterson, IEEE Trans. Antennas and Propag. 55, 826 (2007).
- Petrov et al. (2011)
Z. Petrov, D. Borschevsky, S. Knurenko, V. Kozlov, and I. Petrov, NEFU Herald 8, 5 (2011).
- Knurenko and Petrov (2016)
S. Knurenko and I. Petrov, JETP Lett. 104, 297 (2016).
- Huege et al. (2008)
T. Huege, R. Ulrich, and R. Engel, Astropart. Phys. 30, 96 (2008).
- Kalmykov et al. (2013)
N. Kalmykov, A. Konstantinov, and O. Vedeneev, Journal of Physics: Conference series 409, 2012071 (2013).
- Apel et al. (2012)
W. Apel, J. Arteaga, and L. Bähren, Physical Review D 85, 071101(R) (2012).
- Knurenko and Petrov (2015b)
S. Knurenko and I. Petrov, Bulletin of the Russian Academy of Science. Physics 79, 410 (2015b).
- Knurenko and Petrov (2013)
S. Knurenko and I. Petrov, Proceedings of the 33th International Cosmic Ray Conference p. 0054 (2013).
- Schröder and et al (2012)
F. Schröder and et al, Nucl. Instr. and Meth. A 662, S238 (2012).
- Dyakonov et al. (1991)
M. Dyakonov, T. Egorov, N. Efimov, and et al., Science, Novosibirsk p. 252 (1991).
- Knurenko et al. (2006)
S. Knurenko, A. Ivanov, I. Sleptsov, and A. Sabourov, JETP Lett. 83, 473 (2006).
- Ivanov et al. (2007)
A. Ivanov, S. Knurenko, and I. Sleptsov, JETP 131, 1001 (2007).
- Glushkov et al. (1953)
A. Glushkov, T. E. M.N. Dyakonov, and et al., Bulletin of the Russian Academy of Science. Physics 57, 91 (1953).
- Knurenko et al. (2013)
S. Knurenko, V. Kozlov, Z. Petrov, and M. Pravdin, Bulletin of Russian Academy of Sciences. Physics 77, 1559 (2013).
- Horneffer et al. (2007)
A. Horneffer, W. Apel, J. Arteaga, and et al., Proc. of the 30th ICRC, Merida, Mexico 4, 83 (2007).
- Apel and et al. (2010)
W. Apel and et al., Nucl. Instr. and Meth. A 620, 202 (2010).
- Tikhonov and Arsenin (1977)
A. Tikhonov and V. Arsenin, Winston, NY p. 258 (1977).
- Dyakonov et al. (1988)
M. Dyakonov, S. Knurenko, V. Kolosov, and et al., Nucl. Instr. and Meth. A 248, 224 (1988).
- Knurenko et al. (2001)
S. Knurenko, V. Kolosov, Z. Petrov, and et al., Proc. of 27th ICRC 1, 157 (2001).
- Kochev (1985)
V. Kochev, Use of Computers in Control Problems pp. 62–71 (1985).
- Dyakonov et al. (1999)
M. Dyakonov, S. Knurenko, V. Kolosov, and et al., Atmos. Oceanic. Optic. 12, 315 (1999).
- Knurenko and Sabourov (2011)
S. Knurenko and A. Sabourov, Astrophys. Space Sci. Trans. 7, 251 (2011).
- Buitnik and et al. (2014)
S. Buitnik and et al., Physical Review D 90, 082003 (2014).
- Ostapchenko (2011)
S. Ostapchenko, Physical Review D 83, 014018 (2011).
- Heck et al. (1998)
D. Heck, J. Knapp, J. Capdevielle, and et al., Report-FZKA, Forschungszentrum Karlsruhe 248, 6019 (1998).
- Artamonov and et al. (1994)
V. Artamonov and et al., Bulletin of Russian Academy of Science. Physics 58, 92 (1994).
The reference list from the paper itself. Each links out to its DOI / PubMed record.
- 1Kahn and Lerche (1966) F. Kahn and I. Lerche, Proc. of R. Soc. A 289 , 206 (1966).
- 2Falcke and Gorham (2003) H. Falcke and P. Gorham, Astroparticle Physics 19 , 477 (2003).
- 3Askaryan (1961) G. Askaryan, Sov. Phys. JETP 41 , 616 (1961).
- 4Jelley et al. (1965) J. Jelley, J. Fruin, N. Porter, T. Weekes, F. Smith, and R. Porter, Nature 205 , 327 (1965).
- 5Allan (1971) H. Allan, Prog. in Elemen. Part. And Cos. Ray Phys 10 , 171 (1971).
- 6Artamonov et al. (1987) V. Artamonov, V. Atrashkevich, T. Egorov, and et al., Proc. of Extensive Air Showers with Energy more than 10 17 e V pp. 109–113 (1987).
- 7Tsarev (2004) A. Tsarev, Physics of Elementary Particles and Atomic Nuclei 35 , 1 (2004).
- 8Filonenko (2015) A. Filonenko, Physics-Uspekhi 58 , 633 (2015).