Emission line ratios of Fe III as astrophysical plasma diagnostics
Sibasish Laha, Niall B. Tyndall, Francis P. Keenan, Connor P., Ballance, Catherine A. Ramsbottom, Gary J. Ferland, Alan Hibbert

TL;DR
This study uses advanced atomic data and Cloudy modeling to analyze Fe III emission lines in nebulae, revealing discrepancies with observations and highlighting the importance of electron cascading effects for plasma diagnostics.
Contribution
The paper provides updated Fe III emission line ratios using new atomic data and assesses their reliability for nebular plasma diagnostics, highlighting areas needing further atomic data refinement.
Findings
Previous theory-observation discrepancies are not fully resolved.
Certain Fe III line ratios reliably diagnose electron density.
The Fe III cooling function is significantly higher at 30,000 K with new data.
Abstract
Recent state-of-the-art calculations of A-values and electron impact excitation rates for Fe III are used in conjunction with the Cloudy modeling code to derive emission line intensity ratios for optical transitions among the fine-structure levels of the 3d configuration. A comparison of these with high resolution, high signal-to-noise spectra of gaseous nebulae reveals that previous discrepancies found between theory and observation are not fully resolved by the latest atomic data. Blending is ruled out as a likely cause of the discrepancies, because temperature- and density-independent ratios (arising from lines with common upper levels) match well with those predicted by theory. For a typical nebular plasma with electron temperature K and electron density , cascading of electrons from the levels , and $\rm…
Click any figure to enlarge with its caption.
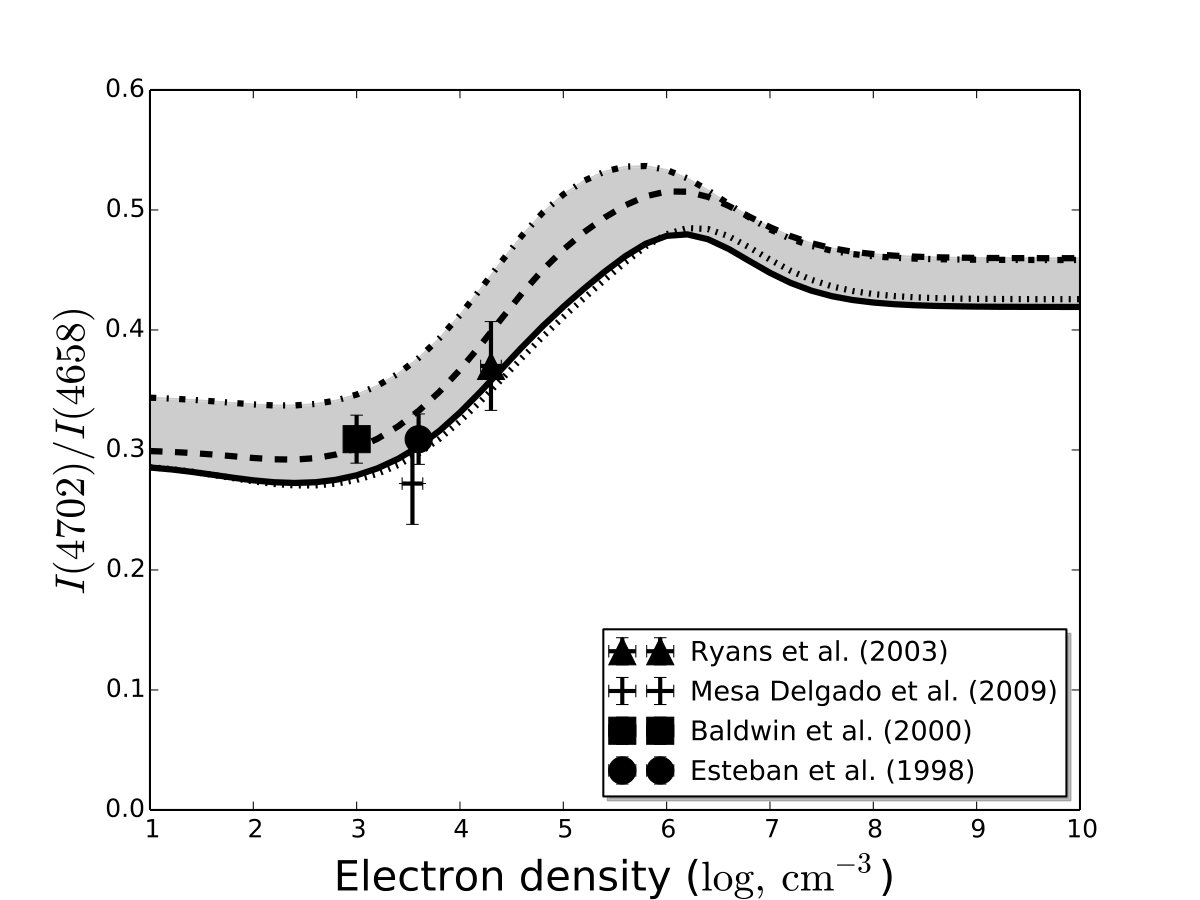 Figure 1
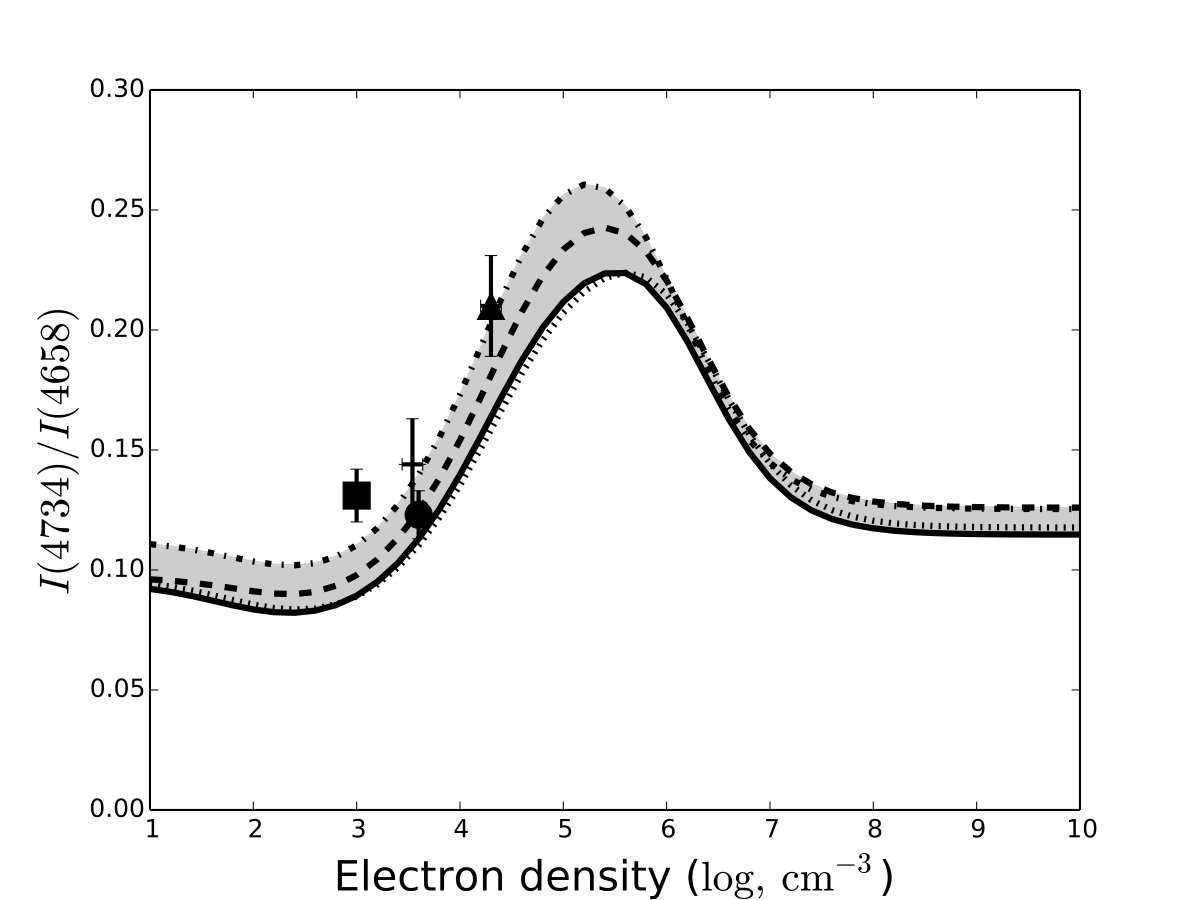 Figure 2
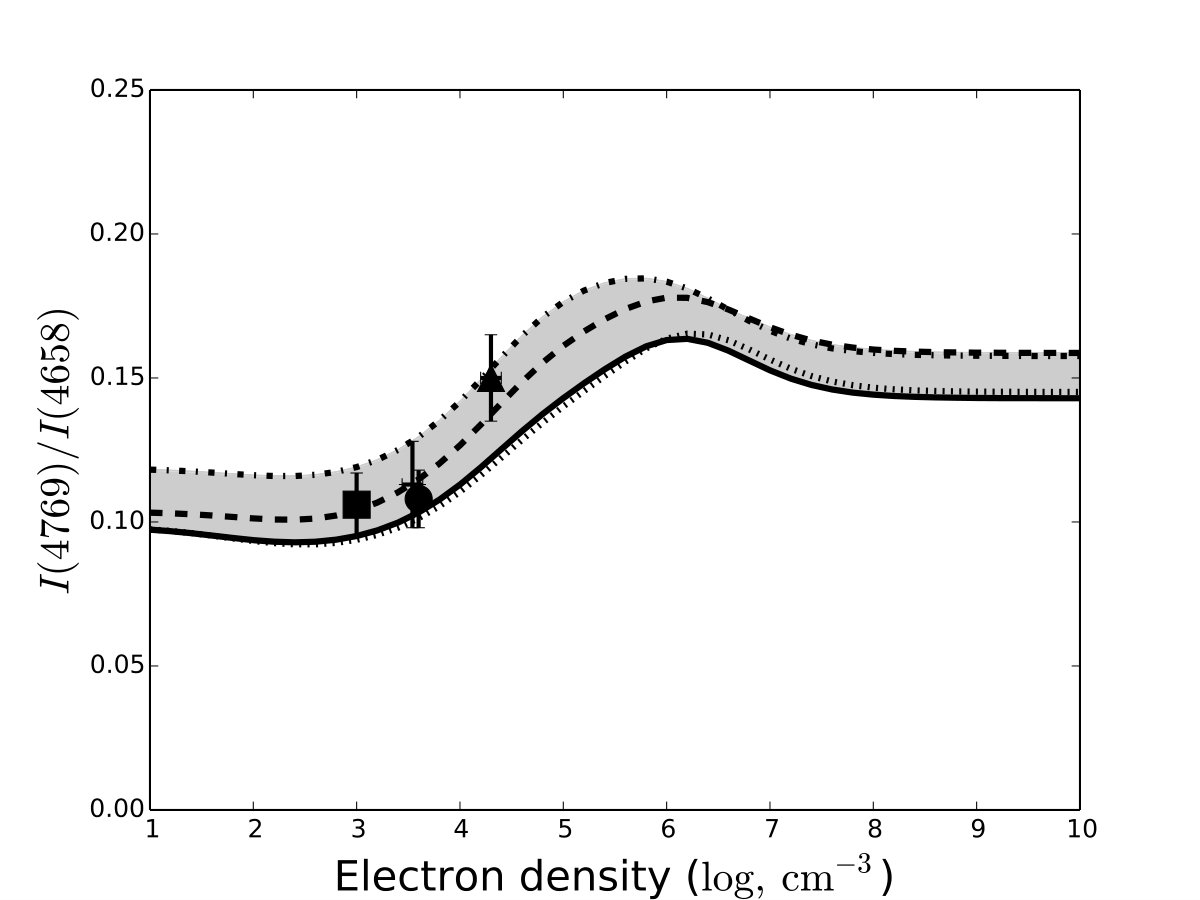 Figure 3
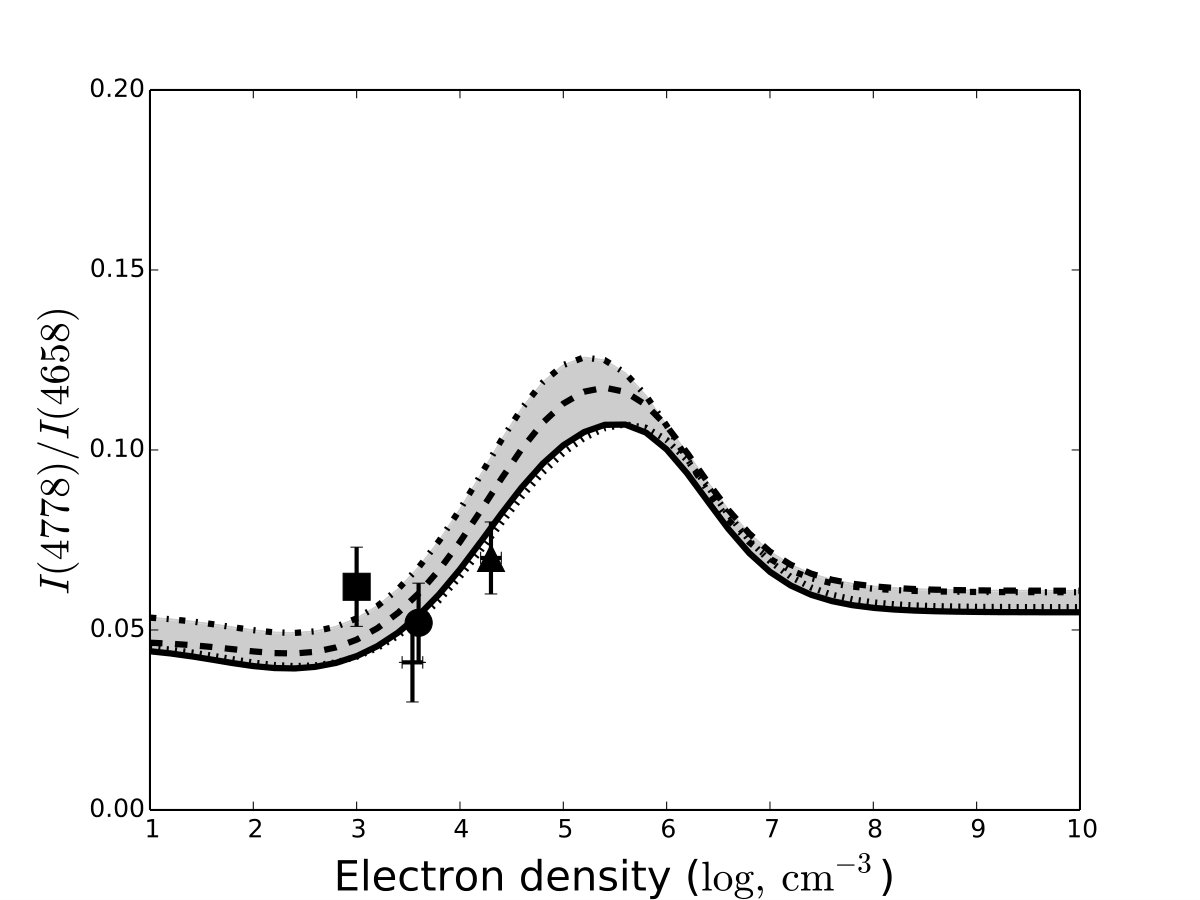 Figure 4
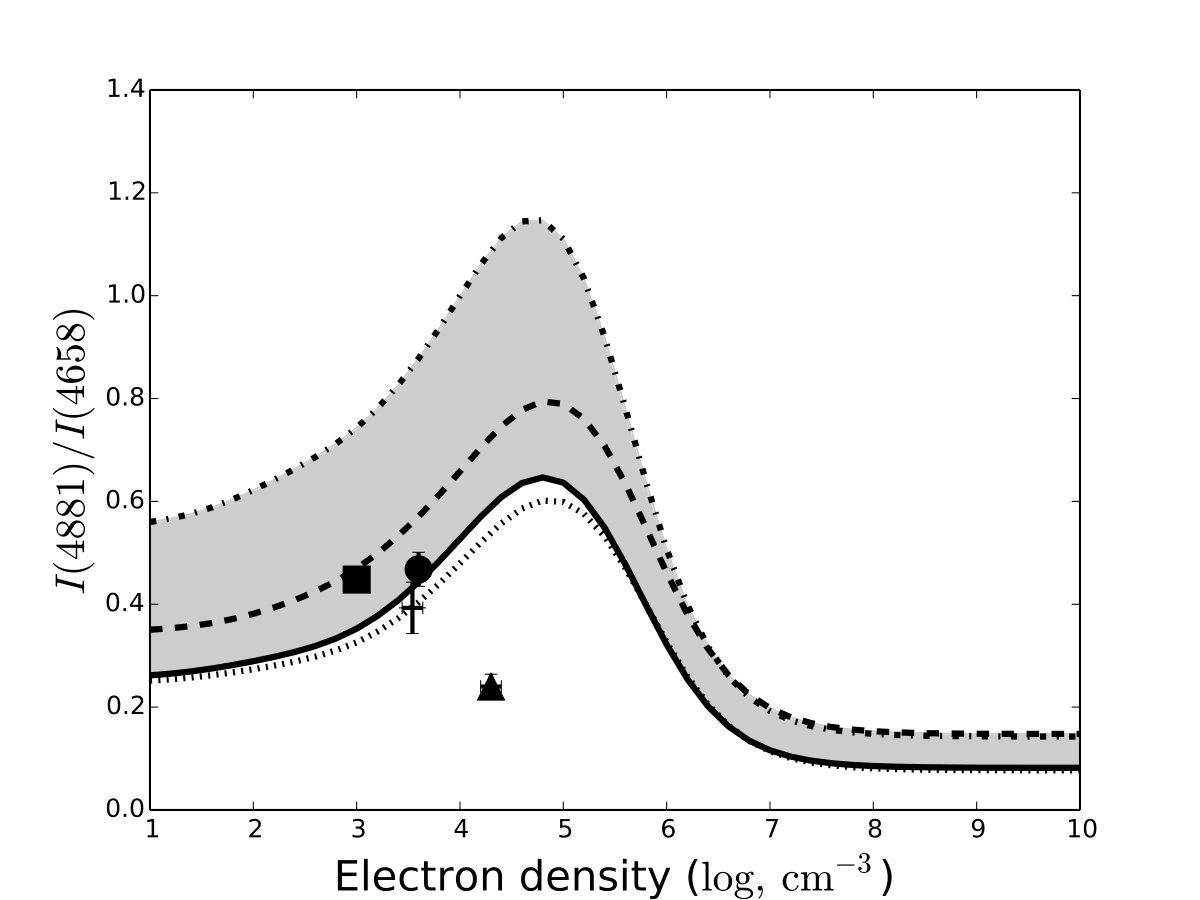 Figure 5
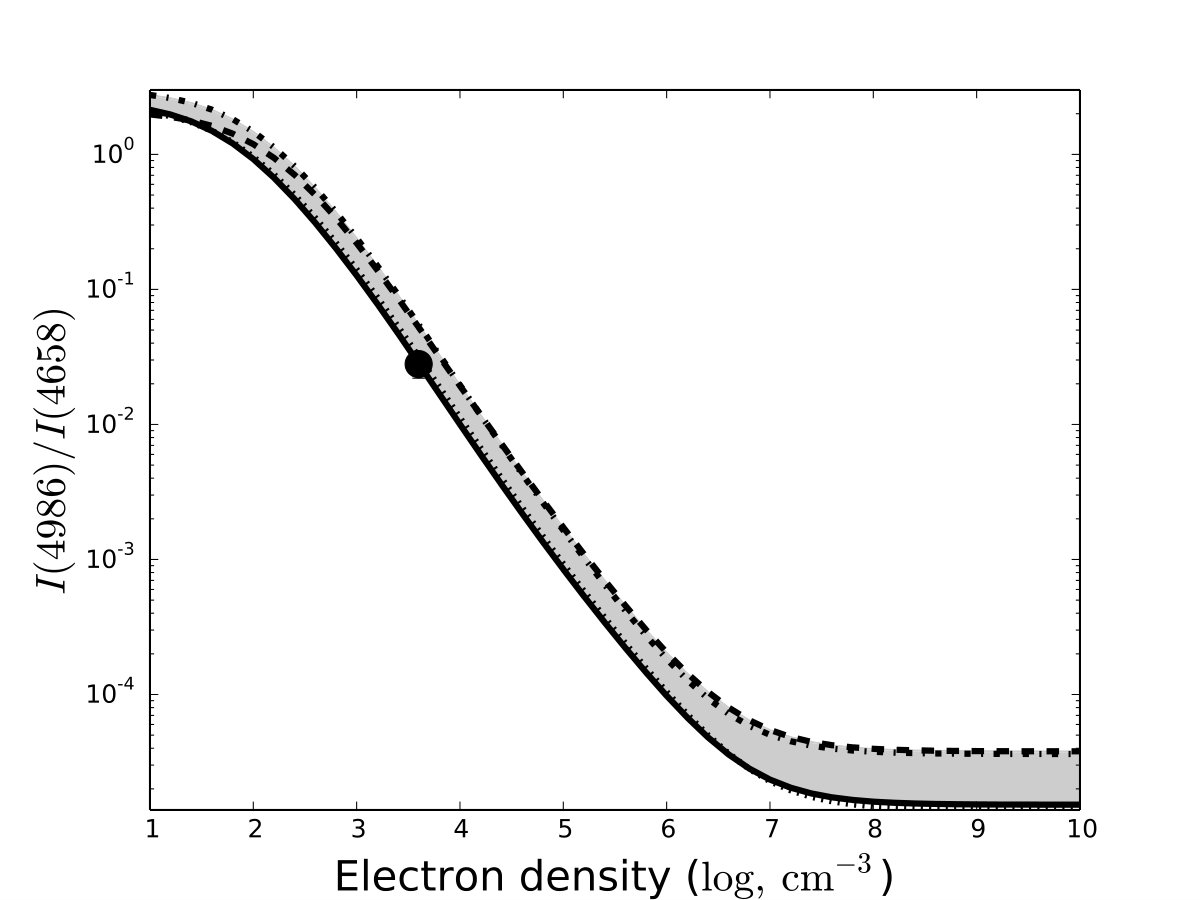 Figure 6
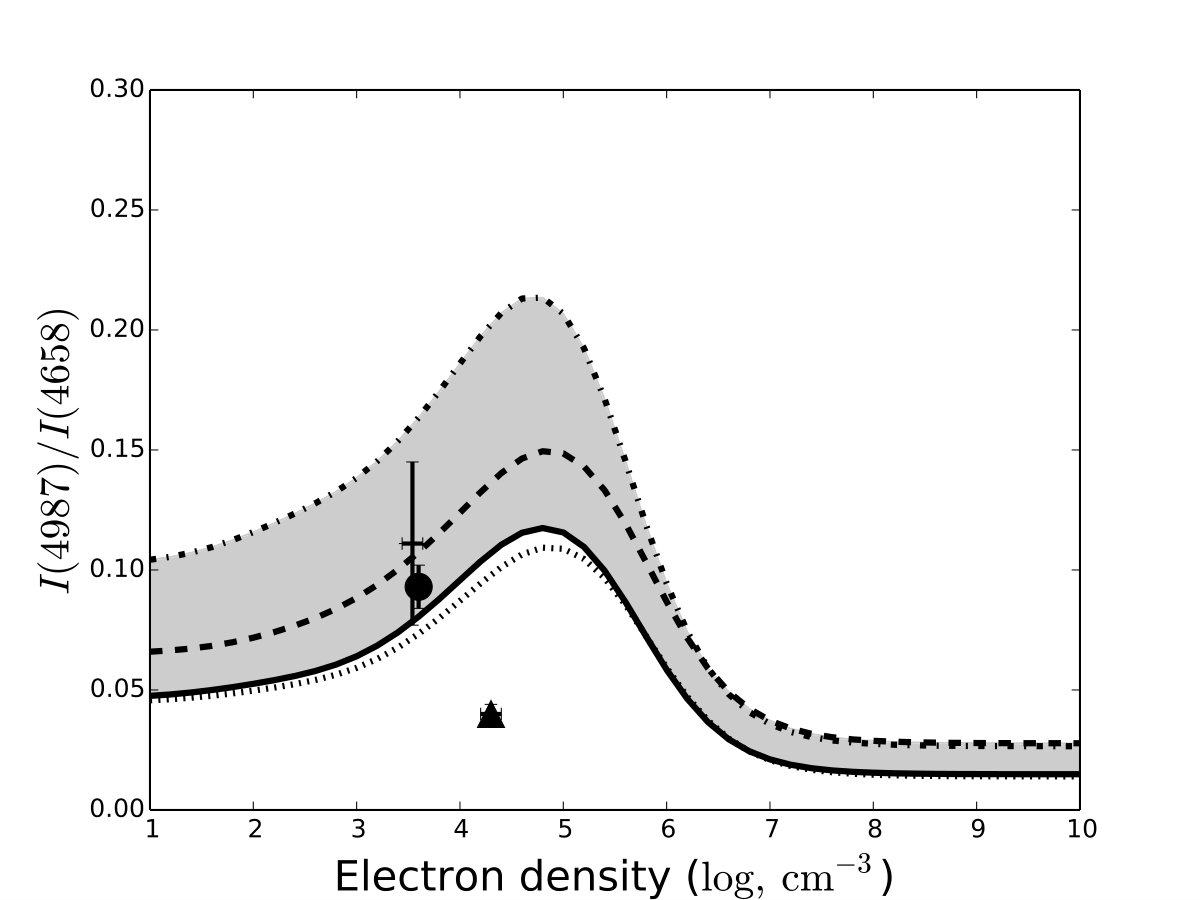 Figure 7
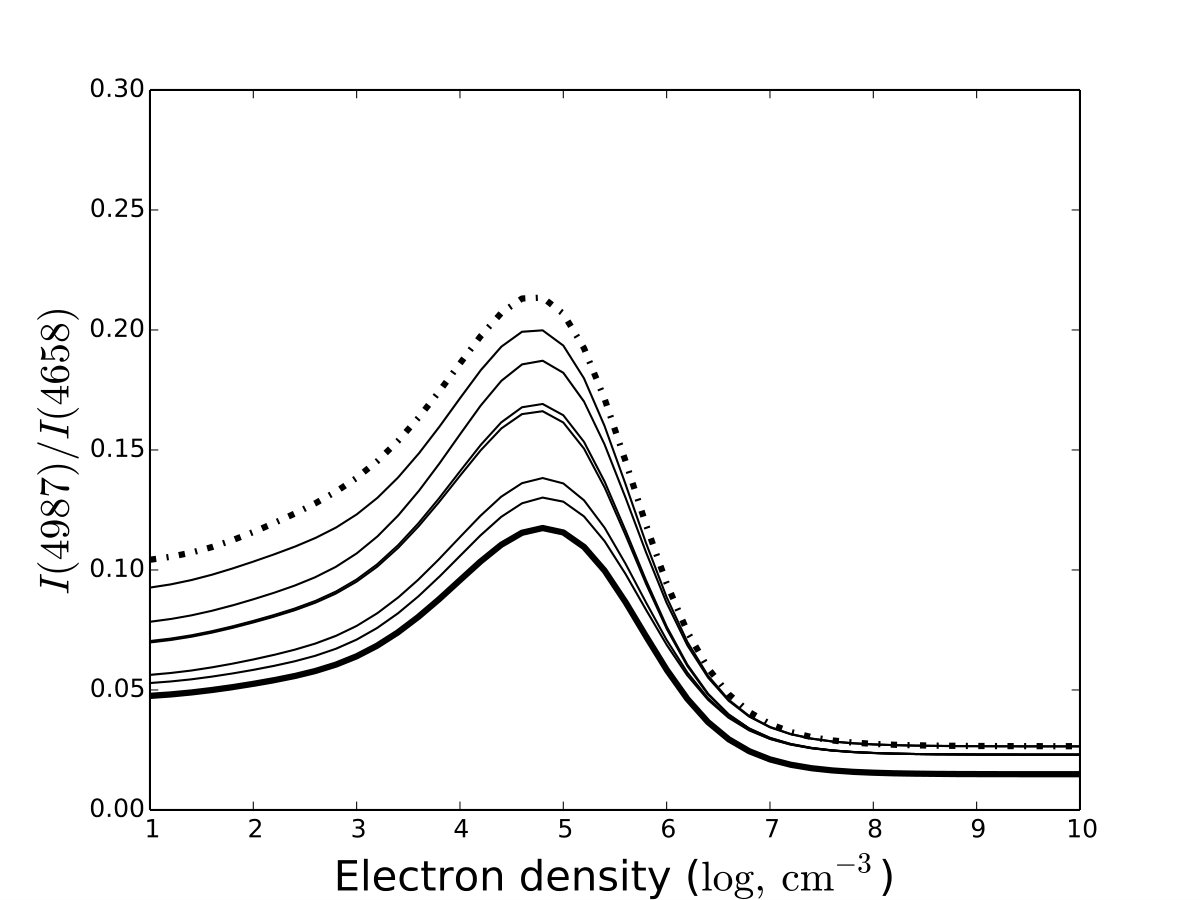 Figure 8
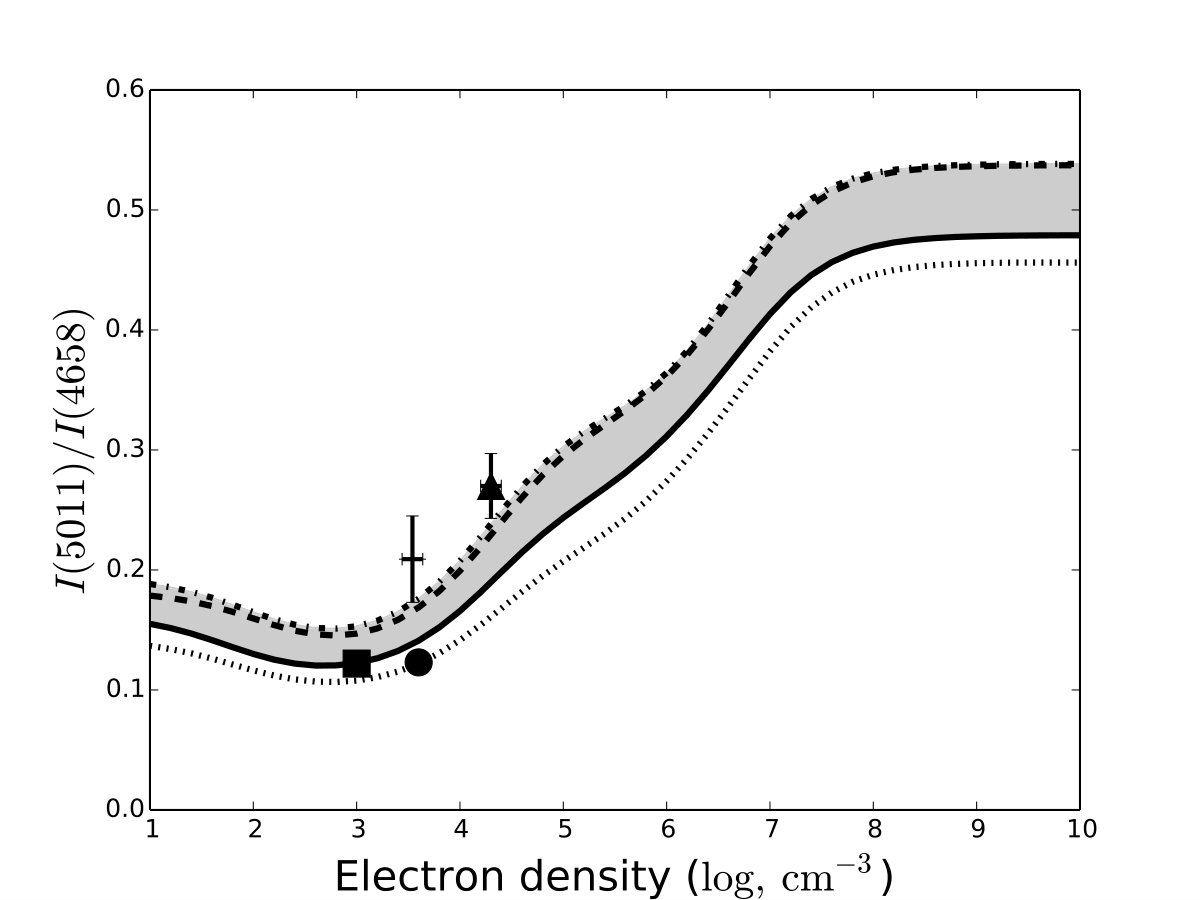 Figure 9
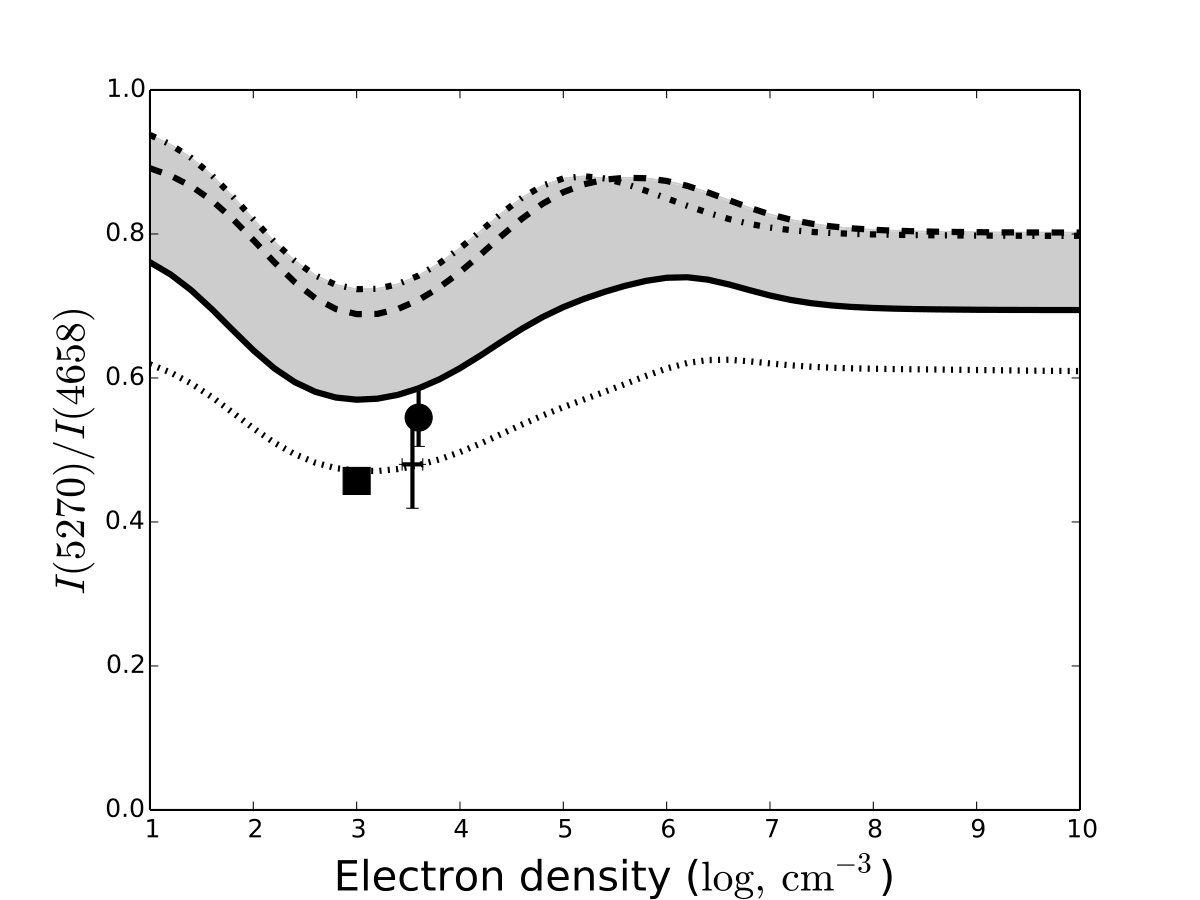 Figure 10
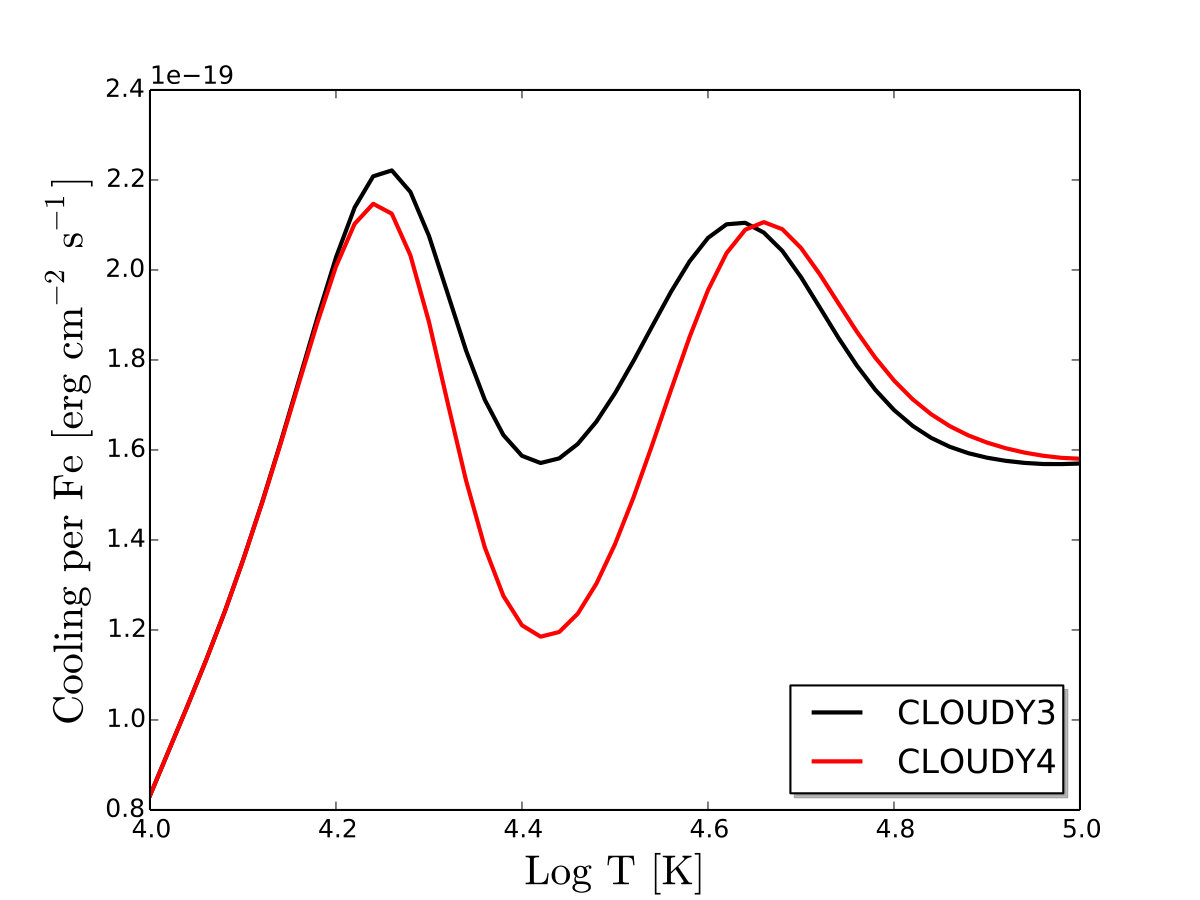 Figure 11
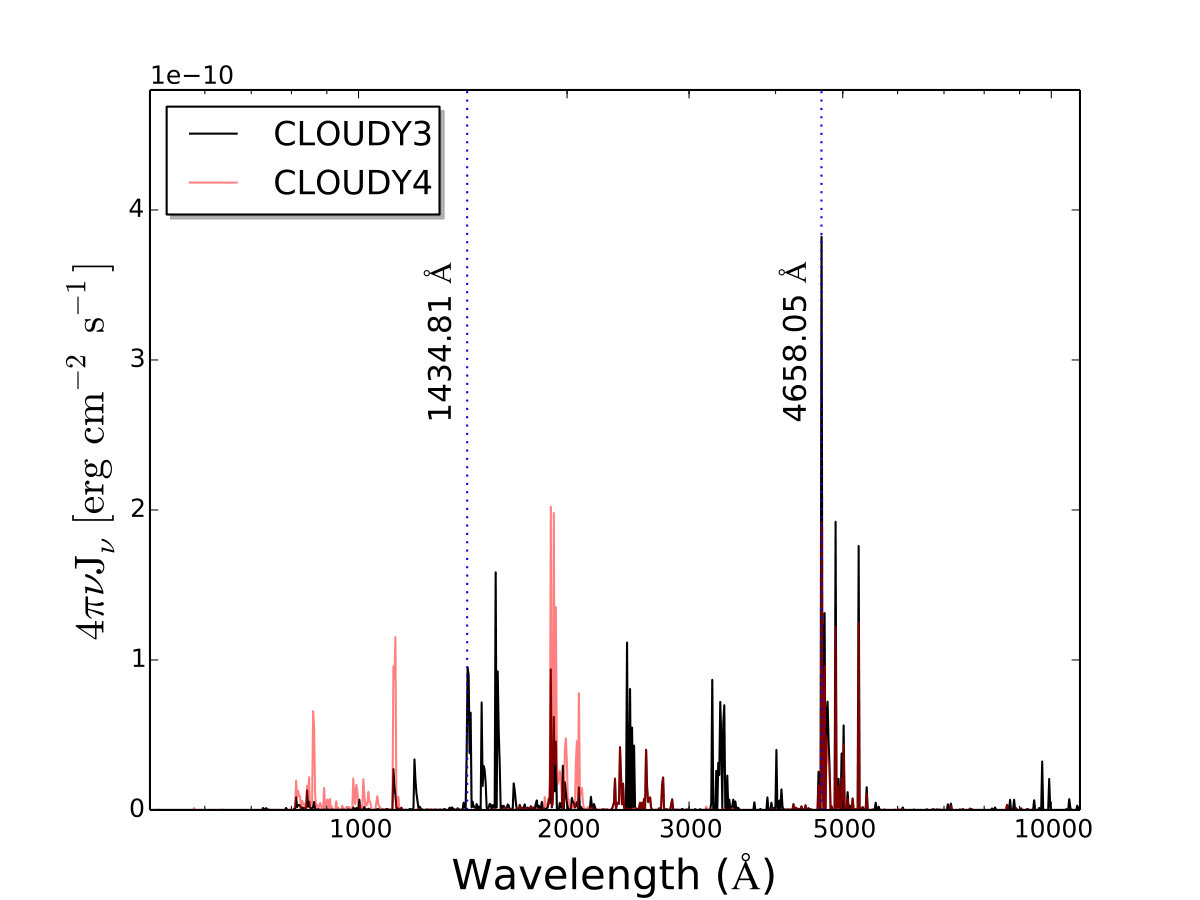 Figure 12
| Lower levela | Upper levela | Wavelength () | Wavelength ()b | |
|---|---|---|---|---|
| (NIST, Vacuum) | (Adopted) | |||
| Line ratio | HD 3416171 | HH 202 2 | Orion3 | Orion4 |
|---|---|---|---|---|
| 4702/4658 | 0.37 | |||
| 4734/4658 | 0.21 | |||
| 4769/4658 | 0.15 | |||
| 4778/4658 | 0.07 | |||
| 4881/4658 | 0.24 | |||
| 4986/4658 | - | - | - | |
| 4987/4658 | 0.04 | - | ||
| 5011/4658 | 0.27 | |||
| 5270/4658 | - |
| Line ratio | HD 3416171 | HH 2022 | Orion3 | Orion4 | CLOUDY35 |
|---|---|---|---|---|---|
| 4769/4702 | 0.41 | ||||
| 4778/4734 | 0.33 | ||||
| 4607/4702 | |||||
| 4667/4734 | - | ||||
| 4987/4881 | 0.17 | - | |||
| 5085/5011 | - | - | |||
| 4756/4658 | - | ||||
| 4080/4008 | - | - | - | ||
| 5412/5270 | - |
| Plasma | HD 3416171 | HH 2022 | Orion3 | Orion4 | |
|---|---|---|---|---|---|
| parameter | |||||
| ) | |||||
| Lower level | Upper level | A-value () | A-value () |
|---|---|---|---|
| CLOUDY3 | CLOUDY2 | ||
| Deb & Hibbert (2009) | Badnell & Ballance (2014)1 | ||
| (1) | (12) | 0.5681 | 0.3671 |
| (12) | (15) | 0.0182 | 0.0074 |
| (12) | (16) | 0.0343 | 0.0045 |
| (12) | (17) | 0.0002 | 0.0071 |
| (2) | (9) | 0.0077 | 0.0089 |
| (9) | (15) | 0.0182 | 0.0074 |
| (9) | (16) | 0.0343 | 0.0045 |
| (9) | (17) | 0.0002 | 0.0071 |
| Line Ratio | Keenan et al. (1993) | CLOUDY31 |
|---|---|---|
| 0.34 | 0.33 | |
| 0.14 | 0.14 | |
| 0.06 | 0.06 | |
| 0.38 | 0.51 | |
| 0.07 | 0.16 | |
| 0.32 | 0.59 |
Peer Reviews
No public reviews on file for this paper yet. If you reviewed it on a platform where reviews are public (OpenReview, ICLR, NeurIPS, ICML), you can paste yours below so the community can read it here.
Videos
No videos yet. Explain this paper in a talk, walkthrough, or lecture? Add one.
Emission line ratios of Fe III as astrophysical plasma diagnostics.
Sibasish Laha11affiliation: Centre for Theoretical Atomic, Molecular and Optical Physics, School of Mathematics and Physics, Queen’s University Belfast, Belfast BT7 1NN, Northern Ireland, U.K.; email: [email protected], [email protected] , Niall B. Tyndall11affiliation: Centre for Theoretical Atomic, Molecular and Optical Physics, School of Mathematics and Physics, Queen’s University Belfast, Belfast BT7 1NN, Northern Ireland, U.K.; email: [email protected], [email protected] , Francis P. Keenan22affiliation: Astrophysics Research Centre, School of Mathematics and Physics, Queen’s University Belfast, Belfast BT7 1NN, Northern Ireland, U.K. , Connor P. Ballance11affiliation: Centre for Theoretical Atomic, Molecular and Optical Physics, School of Mathematics and Physics, Queen’s University Belfast, Belfast BT7 1NN, Northern Ireland, U.K.; email: [email protected], [email protected] ,
Catherine A. Ramsbottom11affiliation: Centre for Theoretical Atomic, Molecular and Optical Physics, School of Mathematics and Physics, Queen’s University Belfast, Belfast BT7 1NN, Northern Ireland, U.K.; email: [email protected], [email protected] , Gary J. Ferland33affiliation: Department of Physics and Astronomy, The University of Kentucky, Lexington, KY 40506, U.S.A;email: [email protected] , and Alan Hibbert11affiliation: Centre for Theoretical Atomic, Molecular and Optical Physics, School of Mathematics and Physics, Queen’s University Belfast, Belfast BT7 1NN, Northern Ireland, U.K.; email: [email protected], [email protected]
Abstract
Recent state-of-the-art calculations of A-values and electron impact excitation rates for Fe iii are used in conjunction with the Cloudy modeling code to derive emission line intensity ratios for optical transitions among the fine-structure levels of the 3d6 configuration. A comparison of these with high resolution, high signal-to-noise spectra of gaseous nebulae reveals that previous discrepancies found between theory and observation are not fully resolved by the latest atomic data. Blending is ruled out as a likely cause of the discrepancies, because temperature- and density-independent ratios (arising from lines with common upper levels) match well with those predicted by theory. For a typical nebular plasma with electron temperature K and electron density , cascading of electrons from the levels , and plays an important role in determining the populations of lower levels, such as , which provide the density diagnostic emission lines of Fe iii , such as - at 4658 Å. Hence further work on the A-values for these transitions is recommended, ideally including measurements if possible. However, some Fe iii ratios do provide reliable -diagnostics, such as 4986/4658. The Fe iii cooling function calculated with Cloudy using the most recent atomic data is found to be significantly greater at 30000 K than predicted with the existing Cloudy model. This is due to the presence of additional emission lines with the new data, particularly in the 1000–4000 Å wavelength region.
Subject headings:
ISM: H II regions, Herbig Haro object H202, planetary nebula:general, planetary nebula:NGC 7009, atomic data.
1. Introduction.
Emission lines arising from transitions among the fine-structure levels of the configuration of Fe iii are widely observed in the optical spectra of astrophysical sources, including planetary nebulae, H II regions and quasars (see, for example, Garstang et al., 1978; Keenan et al., 1993; Ryans et al., 2003; Mesa-Delgado et al., 2009, and references therein). These Fe iii transitions are also important tracers of Fe abundance in the case of H II regions and lowly ionised planetary nebulae, where they are often the only ionisation state of Fe detected in the optical band.
Garstang et al. (1978) first noted the diagnostic potential of optical Fe iii lines, and subsequently several authors have generated theoretical electron temperature () and density () dependent emission line intensity ratios for this ion, and used these to determine plasma parameters for nebular sources (for example, Keenan et al., 1993, 2001; Bautista et al., 2010, and references therein.). However, there are longstanding inconsistencies between electron densities derived from different Fe iii ratios, as well as discrepancies with values of determined from other species such as O ii, S ii and Cl iii with similar ionisation potentials to Fe iii and which hence should originate in nearby regions of the nebular plasma. For example, Fang & Liu (2011) in their study of the Saturn nebula NGC 7009 found electron densities in the range = 104.4–105 cm*-3* from several Fe iii ratios, more than an order of magnitude greater than those from S ii or Cl iii. Similarly, Ryans et al. (2003), in their study of the emission-line spectrum of the hot post-Asymptotic Giant Branch star HD 341617, found that although most Fe iii line ratios indicate (consistent with those from O ii), several implied .
Recently, Badnell & Ballance (2014) have produced new state-of-the-art excitation rate data for Fe iii using the R-matrix suite of packages, while Deb & Hibbert (2009) has previously calculated A-values for this ion using the highly sophisticated CIV3 code (Hibbert, 1975; Hibbert et al., 1991). In this paper we use these data to generate Fe iii line intensity ratios, which we compare with both other theoretical results and with high spectral resolution observations, to investigate if the longstanding problems with this ion in nebular spectra can be resolved. The paper is arranged as follows. In Section 2 we discuss representative high resolution optical observations of Fe iii emission lines in nebular sources, while Section 3 contains details of the line ratio calculations. Results are presented and discussed in Section 4, and conclusions in Section 5.
2. Observations
The Fe iii diagnostic emission lines in the optical region lie between 4000–5500 , and arise due to , , and transitions among levels of the configuration. These are listed in Table 1. The Fe iii lines are in a crowded region of the spectrum, leading to the possibility of blending. Examples of close emission line pairs include: He i 4009.25 Å and Fe iii 4008.36 Å; O ii 4661.63 Å and Fe iii 4658.05 Å; [Fe ii] 5273.35 Å and Fe iii 5270.40 Å (see for example, Rodríguez, 2002; Baldwin et al., 2000). Hence, for the purpose of comparison between theory and observation in our study, we select only those observations which employ high resolution () spectra, to ensure as far as possible that the Fe iii lines are not blended. We also focus on observations which have high signal-to-noise (S/N) ratios to facilitate the reliable detection of these weak lines.
Our observational datasets consist of Fe iii line intensity ratios for (i) the hot post-Asymptotic Giant Branch star HD 341617, obtained by Ryans et al. (2003) using the Keck telescope; (ii) the brightest knot of the Herbig Haro object HH 202 in the Orion nebula, studied by Mesa-Delgado et al. (2009) using the Very Large Telescope at the European Southern Observatory; (iii) the Orion nebula H II region by Esteban et al. (1998), which employ data from the 2.1 m telescope at the Observatorio Astronomico Nacional (OAN) in Mexico; (iv) the Orion nebula H II region, this time obtained by Baldwin et al. (2000) using the 4 m telescope at the Cerro Tololo Inter-American Observatory (CTIO). Details of the observations may be found in the above references. In Table 2 the observed Fe iii line ratios from these datasets which are density sensitive are summarised, while in Table 3 we list those arising from common upper levels and hence should be independent of and . The errors in the line ratios from Ryans et al. (2003) are assumed to be 10%, as these authors do not quote any uncertainty estimates for their data. This assumption is based on the fact that the Ryans et al. spectra are better in both spectral resolution and S/N than the Orion data of Esteban et al. (1998), where they claim intensity errors of 10% for lines of similar strength to those of Fe iii , yielding line intensity ratios with errors of 14%. Hence adopting a 10% error for the HD 341617 data is probably an overestimate. Note that all ratios are in energy units.
In Table 4 we list average values of electron temperature and density derived for our nebular sample in the relevant references listed above. These plasma parameters were obtained using diagnostic line ratios in ions which have similar ionisation potentials to that of Fe iii (30.7 eV) and hence should be emitted from a co-spatial region, and include for example O ii (35.1 eV), Cl iii (39.6 eV) and N ii (29.60 eV). Ryans et al. (2003) could not estimate the temperature of the nebular plasma in HD 341617, due to the lack of reliable diagnostics, and hence adopted a value of 10,000 K from Parthasarathy et al. (2000). However, we note that most of the Fe iii line ratios are not particularly sensitive to , as discussed in Section 3.
3. Theoretical line ratios.
The Cloudy modeling code (Ferland et al., 1998, 2013) and CHIANTI suite of packages (Dere et al., 1997; Del Zanna et al., 2015) are employed to calculate Fe iii line intensity ratios. We have used several atomic datasets, including electron impact excitation rates (ECS) and transition probabilities (A-values) from Badnell & Ballance (2014). These authors have calculated ECS using three methods, namely (i) intermediate coupling frame transformation (ICFT), (ii) Breit-Pauli R-matrix (BPRM) and (iii) Dirac Atomic R-matrix (DARC), each for the lowest 322 fine-structure levels. They found excellent agreement among all three calculations, and here we have used ECS values from the ICFT method, although we note that adoption of either of the other two Fe iii datasets leads to the same results. Transition probabilities for transitions among the lowest levels have also been taken from Deb & Hibbert (2009), calculated with the general configuration interaction code (CIV3) and a large configuration set. There are significant differences in the A-values between the Badnell & Ballance and Deb & Hibbert studies. However, considering the more rigorous calculations by the latter with many configurations, we have adopted these in the final dataset. We employ the measured energies from NIST for the 322 levels of Badnell & Ballance, and correct their A-values for the energy differences between theory and experiment.
Using the above atomic data, we have generated three different Cloudy models, termed CLOUDY1, CLOUDY2 and CLOUDY3. In the CLOUDY1 model, the energy levels, A-values and ECS are from Badnell & Ballance (2014), with a total of 51,681 transitions among 322 levels. The energy level values from Badnell & Ballance (2014) are consistently higher than those measured by NIST and are not ordered as per increasing NIST energies. The CLOUDY2 model comprises energies for the 322 levels from NIST, and energy-corrected A-values and ECS from Badnell & Ballance (2014). This is also the same set of data adopted in CHIANTI. The CLOUDY3 model is the same as CLOUDY2, except for the A-values of the transitions among the lowest levels, which are from Deb & Hibbert (2009). Henceforth CLOUDY3 will be referred to as the ‘final’ model.
In addition to the above, we also consider a CLOUDY4 model that employs the Fe iii atomic data currently in Cloudy (Zhang, 1996), and are summarised in Lykins et al. (2013). As iron is one of the main elements responsible for maintaining thermal equilibrium in a nebular plasma, we include CLOUDY4 in our study to assess any differences in plasma cooling rates when Cloudy is updated with the new Fe iii atomic data. We discuss this in detail in the Section 4.2.
Figures 1–9 show a number of density-sensitive Fe iii emission line ratios, generated using the three Cloudy models CLOUDY1, CLOUDY2 and CLOUDY3 as a function of in the range 10 – . In our calculations we have adopted a temperature of K, to match those found for the observed nebulae in Table 4. However, to show the temperature dependence of the ratios, we also plot results at = 15000 K in Figures 1–9. We find that apart from 5011/4658 and 5270/4658 in Figures 7 and 8, all the ratios are relatively insensitive to temperature variations.
The observed values of the Fe iii line ratios are plotted in Figures 1–9 at the electron densities listed for the source in Table 4. Also indicated in each figure is the range in the theoretical line ratios from the various Cloudy models, which arises mainly due to the adoption of different sets of A-values in each. Note that in all cases we use the ECS data of Badnell & Ballance (2014), although the different energy level values in various models will result in somewhat different excitation and de-excitation rates, and may hence impact the line ratios. The spread in ratio values may be interpreted as ‘error bands’ in the calculations. For most ratios, this error band is 20 – 30% of the CLOUDY3 curve values. However, for 4881/4658 and 4987/4658 in Figures 5 and 6, the error bands are more than 50% of the CLOUDY3 ratio values, indicating large differences in the A-values for these transitions in the Cloudy models.
We have also estimated the errors arising in the line ratios due to possible uncertainties in the ECS calculated by Badnell & Ballance (2014). The resonances in the electron scattering cross section near threshold may sometimes have high peaks, and yield higher values of the ECS. We have removed those values of cross section which have only one point above the local average, and then convolved the remainder with Gaussian profiles with full-width-half-maxima of 40 meV. The resulting ECS differ by less than 1% from the original values, which in turn does not therefore modify the theoretical line ratios in any model. From Table 2 of Badnell & Ballance (2014) we note that the ECS calculated by the authors using three different methods (ICFT, BPRM and DARC) agree very well. The differences in the values do not affect the line ratios calculated in this work. Hence, we only focus on the differences in the A-values as a possible source of errors for the Fe iii line ratios.
For line ratios having common upper levels, and which hence should be density and temperature independent, we have calculated theoretical values at and K using the CLOUDY3 model. These are listed in Table 3.
4. Results and discussion
4.1. Emission line intensity ratios
An inspection of Figures 1–9 reveal that the observed Fe iii line ratios mostly lie within the error bands of the theoretical values calculated at = K, except for 5270/4658. In particular, they are generally in best agreement with line ratios calculated with the CLOUDY3 model, which we believe contains the most reliable atomic dataset, although within the error bars in the observations, the results are consistent with all three models. However, in the case of 5270/4658 in Figure 4, the measured ratios lie outside all of the Cloudy model ranges at = 9000 K. As the other ratios do not show a significant temperature sensitivity, and hence the observations are in reasonable agreement with the = 15000 K calculations as well as those at 9000 K, it is possible that the Fe iii - emitting region of the plasma is at a much higher temperature than indicated from other spectral diagnostics. We point that these diagnostics do indicate a range of temperatures and not a unique value. For example, Esteban et al. (1998) find = 9000 – 12400 K for the Orion nebula. However, it is difficult to believe that the temperature of the Fe iii region could be so different from those of other ions. We note that there are also significant discrepancies between theory and observation for 4881/4658 and 4987/4658 in HD 341617, as previously noted by Ryans et al. (2003), although this is not the case for these ratios in the other sources. It is therefore possible that there is some error in the measurements of 4881/4658 and 4987/4658 in the Ryans et al. spectrum.
To investigate if the discrepancies between theory and observation may be due to line blending, in Table 3 we list measured line ratios involving transitions from common upper levels (which hence should be - and -independent), plus the calculated values from the CLOUDY3 model. However, we note that the theoretical results are similar from all three models. An inspection of the table reveals good agreement between theory and observation, including for the ratio with the 4658 Å line, the transition in common for the -diagnostics. We can therefore rule out blending as a likely cause of the observed discrepancies. Hence, below we investigate if the atomic data may be responsible for these.
Previous calculations of Fe iii line ratios have employed A-values and ECS from a variety of sources, with some difference from those presented here, but most in agreement. For example, Keenan et al. (1993), henceforth K93, have derived the density dependent line ratios of Fe iii using A-values from Garstang (1957) and ECS from Berrington et al. (1991). A comparison of these with results from our CLOUDY3 model is shown in Table 6 at K and . We find that there are no major differences between our calculations and those of K93 with the exception of 5011/4658 and 5270/4658. The low density tail of the latter derived by K93 reaches a value of , while with the latest atomic data the line ratio is mostly flat (with value of ) and insensitive to density. This is understandable from the fact that the A-value for the transition in Garstang (1957) is 0.355 s*-1* while it is 0.570 s*-1* in Deb & Hibbert (2009). Similarly for the A-value of Garstang (1957) is 0.473 s*-1* and 0.770 s*-1* in Deb & Hibbert (2009).
As noted earlier, we consider the differences in the line ratios from the three Cloudy models as error bands arising due mostly to the various sets of A-values adopted. We find that not only do the differences in the A-values of the relevant transitions affect the ratios, but also those of others due to cascading of electrons from higher levels. To demonstrate this we consider the example of 4987/4658 which shows a large error band (50%) between the CLOUDY2 and CLOUDY3 models. The 4987 and 4658 lines are due to the and transitions, respectively, where the bracketed quantities are the level numbers (with the ground state being level 1). Cascading to levels 9 and 12 from 15 (), 16 () and 17 () is important because of the relatively large transition probabilities, and also the fact that 15, 16 and 17 are closely spaced in energy (3.04, 3.09 and 3.11 eV, respectively). In Table 5 we list the A-values from the CLOUDY2 and CLOUDY3 models which involve pumping in and out of levels 9 and 12, the upper levels of 4987 and 4658 Å, respectively. As we change each of the A-values from the CLOUDY3 to the CLOUDY2 data, the line ratio curves gradually move upwards as shown in Figure 10. We find that cascading affects the Fe iii line ratios at a plasma temperature of K, and hence the corresponding A-values play an important role in deriving the line ratios. However, in cases such as 4986/4658 in Figure 9, where the error bar is small, the line ratios may be effectively used to constrain the plasma density.
4.2. Plasma cooling function
We compare the total cooling function for a pure Fe plasma generated using two different atomic datasets, namely that currently used in Cloudy (CLOUDY4) and the final model (CLOUDY3). Iron is known to be an important contributor to the cooling function in nebulae, which is a fundamental parameter since it determines the thermal stability and energy balance of the plasma (Gnat & Ferland, 2012). We have repeated the cooling function calculations described by Lykins et al. (2013) using both the CLOUDY3 and CLOUDY4 models, and in Figure 11 plot these for a temperature range over which Fe iii has a significant fractional abundance. The cooling at 30,000 K is enhanced when the new CLOUDY3 data are used, which could have a major impact on the thermal stability of environments near this temperature. Figure 11 also shows a comparison of the Fe iii spectra predicted with the two datasets. There are several regions where CLOUDY3 predicts lines while CLOUDY4 does not, with the largest difference for the UV/near-UV region between 1000–4000 Å. This is due to the larger number of levels in CLOUDY3 (322 with Emax = 221274 cm*-1* compared to 219 with Emax = 137522 cm*-1* in CLOUDY4), combined with the inclusion of A-value data in this model which are absent in CLOUDY4. For example, consider one of the strongest lines in the spectrum which is present in CLOUDY3 but not in CLOUDY4, namely that at 1434.81 Å (See Figure 11). This line arises due to a transition from level 43 (E = 69695 cm*-1*) to the ground state, and its A-value in CLOUDY3 is 113.74 s*-1*, whereas CLOUDY4 does not contain an A-value for this transition, explaining its absence. The larger number of emission lines in CLOUDY3 in turn leads to additional cooling, as indicated in Figure 11.
5. Conclusions
We conclude that the existing discrepancies between theory and observation for Fe iii line ratios in nebular plasmas cannot be fully resolved using currently available atomic data. Furthermore, blending of the Fe iii lines is unlikely to be the cause because theoretical temperature- and density-independent Fe iii line ratio values involving transitions from common upper levels are in agreement with measured values. However, we find that cascading of electrons from the , and levels plays an important role in populating the levels which provide the diagnostic emission lines of Fe iii . Hence, the A-values for these transitions are crucial in determining the line ratios, and further calculations for these would be highly desirable, as would measurements if feasible. We note that some of the Fe iii line ratios in Figures 1–9 do show good agreement between theory and measurement, including 4734/4658, 4778/4658, and 4986/4658, and hence may be employed as -diagnostics. The most reliable is probably 4986/4658 in Figure 9, due to the narrow error band and lack of sensitivity. However, the 4986 Å line is often weak and may not always be detected.
Adoption of the most recent Fe iii atomic data in Cloudy leads to a cooling function which is significantly greater around 30,000 K than that generated with the existing Cloudy model. This is due to the presence of more emission lines in the former, particularly in the UV/near-UV wavelength range from 1000–4000 Å.
ACKNOWLEDGEMENTS
The project has made use of public databases hosted by SIMBAD, maintained by CDS, Strasbourg, France. SL, CAR and FPK are grateful to STFC for financial support via grant ST/L000709/1. GJF acknowledges financial support from the Leverhulme Trust via Visiting Professorship grant VP1-2012-025, and also support by the NSF (1108928, 1109061 and 1412155), NASA (10-ATP10-0053, 10-ADAP10-0073, NNX12AH73G and ATP13-0153) and STSciI (HST-AR-13245, GO-12560, HST-GO-12309, GO-13310.002-A, HST-AR-13914 and HST-AR-14286.001). CHIANTI is a collaborative project involving George Mason University, the University of Michigan (USA) and the University of Cambridge (UK). SL is grateful to the CHIANTI Helpdesk Team and Peter Young in particular for their help with CHIANTI software.
The reference list from the paper itself. Each links out to its DOI / PubMed record.
- 1Badnell & Ballance (2014) Badnell, N. R., & Ballance, C. P. 2014, Ap J, 785, 99
- 2Baldwin et al. (1991) Baldwin, J. A., Ferland, G. J., Martin, P. G., Corbin, M. R., Cota, S. A., Peterson, B. M., & Slettebak, A. 1991, Ap J, 374, 580
- 3Baldwin et al. (2000) Baldwin, J. A., Verner, E. M., Verner, D. A., Ferland, G. J., Martin, P. G., Korista, K. T., & Rubin, R. H. 2000, Ap JS, 129, 229
- 4Bautista et al. (2010) Bautista, M. A., Ballance, C. P., & Quinet, P. 2010, Ap J, 718, L 189
- 5Berrington et al. (1991) Berrington, K. A., Zeippen, C. J., Le Dourneuf, M., Eissner, W., & Burke, P. G. 1991, Journal of Physics B Atomic Molecular Physics, 24, 3467
- 6Deb & Hibbert (2009) Deb, N. C., & Hibbert, A. 2009, Atomic Data and Nuclear Data Tables, 95, 184
- 7Del Zanna et al. (2015) Del Zanna, G., Dere, K. P., Young, P. R., Landi, E., & Mason, H. E. 2015, A&A, 582, A 56
- 8Dere et al. (1997) Dere, K. P., Landi, E., Mason, H. E., Monsignori Fossi, B. C., & Young, P. R. 1997, AAPS, 125