The Formation of S0 Galaxies with Counter-Rotating Neutral and Molecular Hydrogen
Robert Bassett, Kenji Bekki, Luca Cortese, Warrick J. Couch

TL;DR
This study uses advanced simulations to investigate how minor mergers can lead to counter-rotating gas and stars in S0 galaxies, revealing key conditions for their formation and implications for galaxy evolution.
Contribution
It demonstrates that retrograde primary galaxy orbits are essential for counter-rotation, and explores how gas, bulge mass, and orbital parameters influence this process in S0 galaxies.
Findings
Counter-rotation requires a retrograde primary galaxy.
Including significant gas can prevent counter-rotating gas formation.
Bulge mass and orbit influence the distribution of accreted material.
Abstract
The observation of counter rotation in galaxies (i.e. gas that rotates in the opposite direction to the stellar component or two co-spatial stellar populations with opposite rotation) is becoming more commonplace with modern integral field spectroscopic surveys. In this paper we explore the emergence of counter-rotation (both stellar and gaseous) in S0 galaxies from smoothed-particle hydrodynamics simulations of 1/10 mass ratio minor mergers between a 10^10.8 solar mass disk galaxy with a bulge-to-total ration of 0.17 and a gas rich companion (gas-to-stellar mass fraction of 5.0). These simulations include a self-consistent treatment of gas dynamics, star formation, the production/destruction of H2 and dust, and the time evolution of the interstellar radiation field. We explore the effect of retrograde versus prograde obits, gas and bulge mass fractions of the primary galaxy, and…
Click any figure to enlarge with its caption.
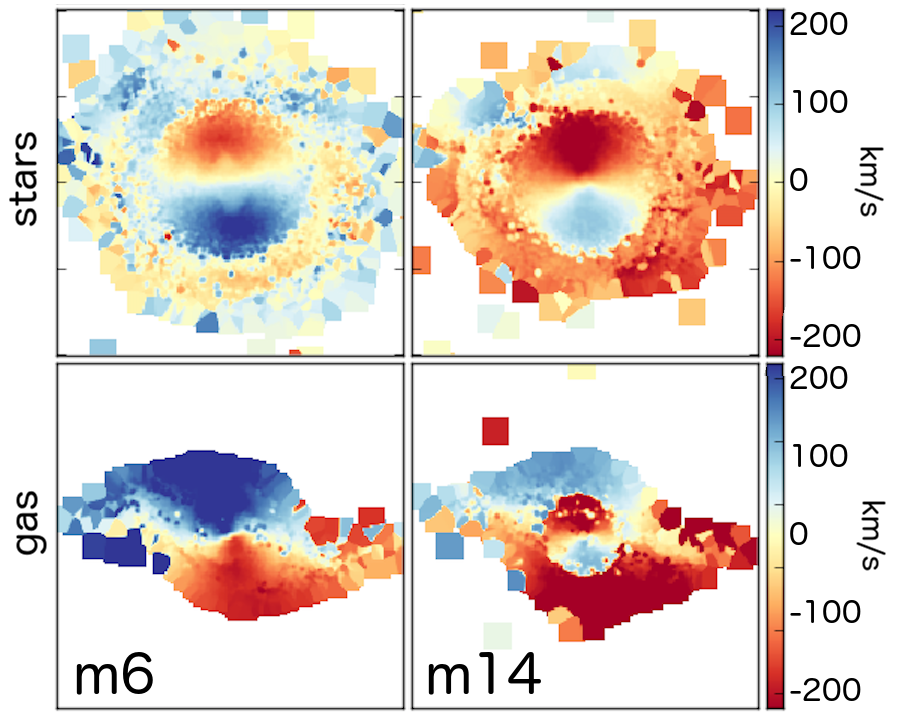 Figure 1
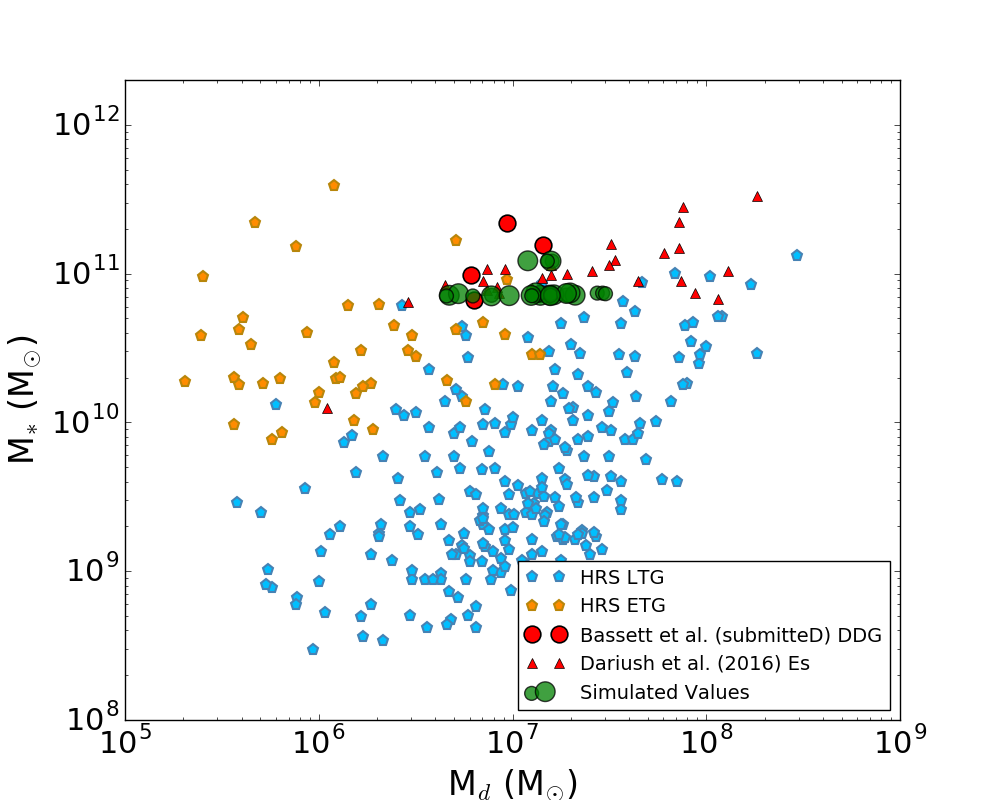 Figure 2
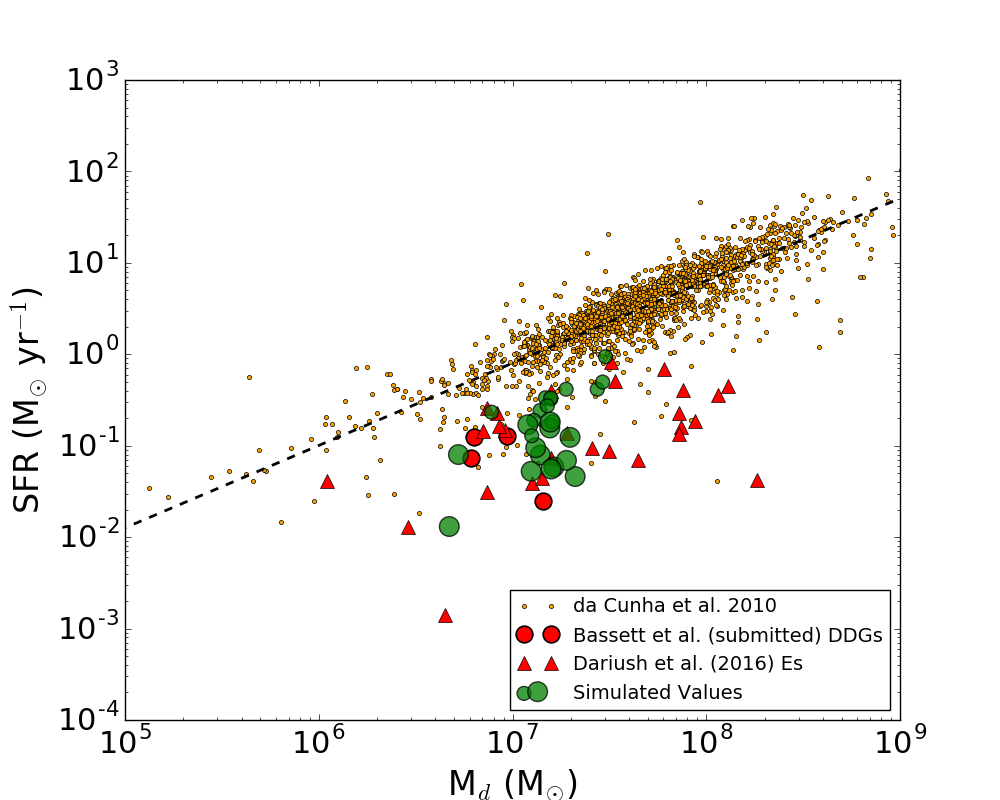 Figure 3
 Figure 4
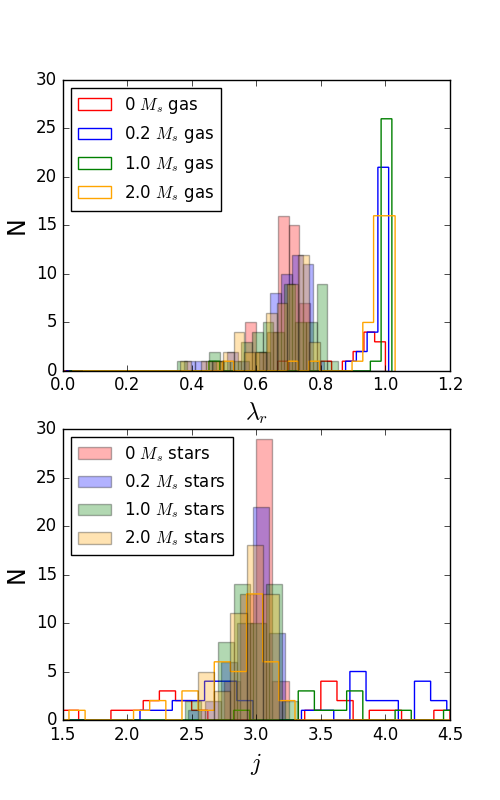 Figure 5
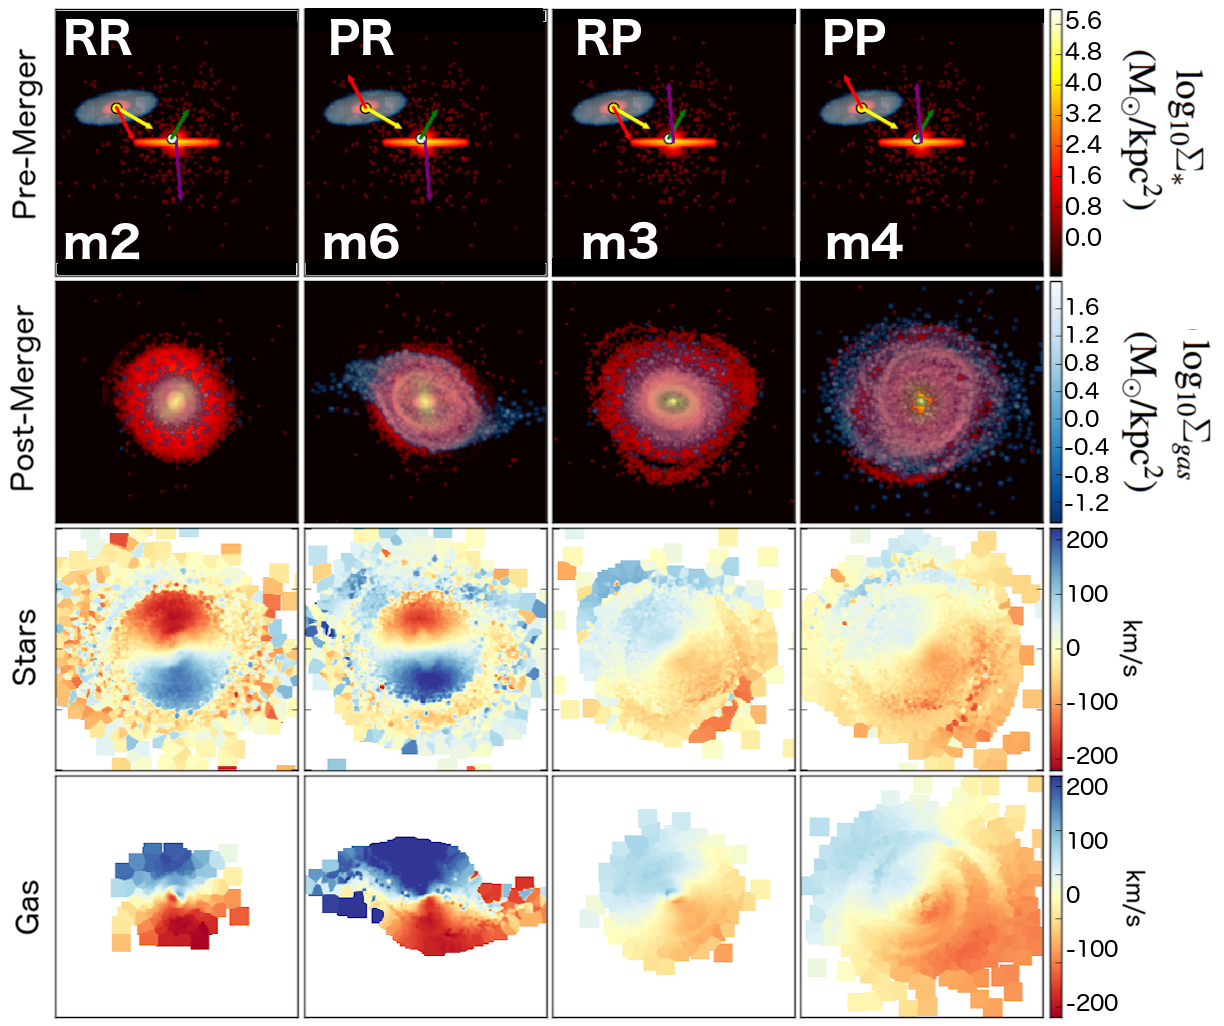 Figure 6
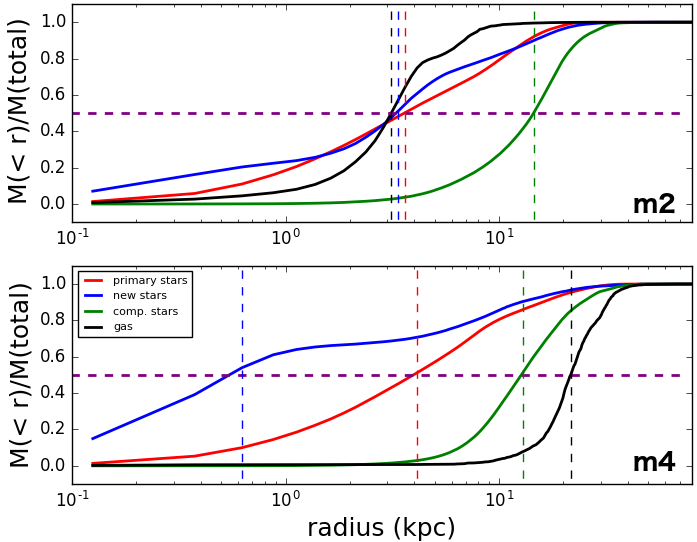 Figure 7
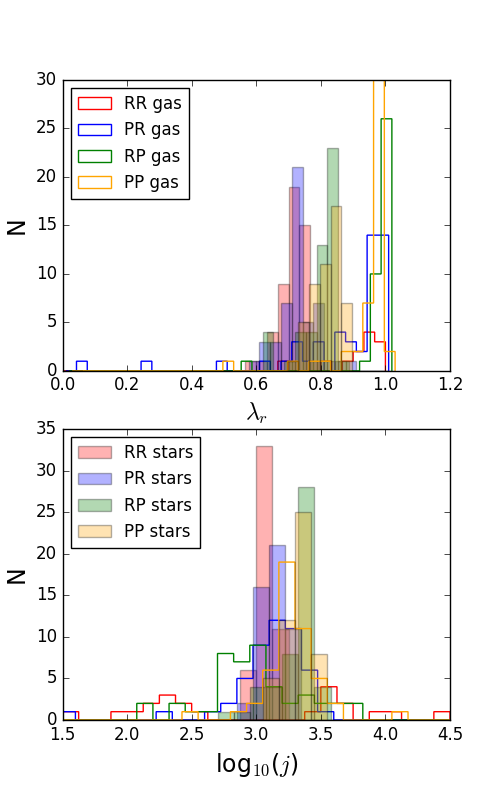 Figure 8
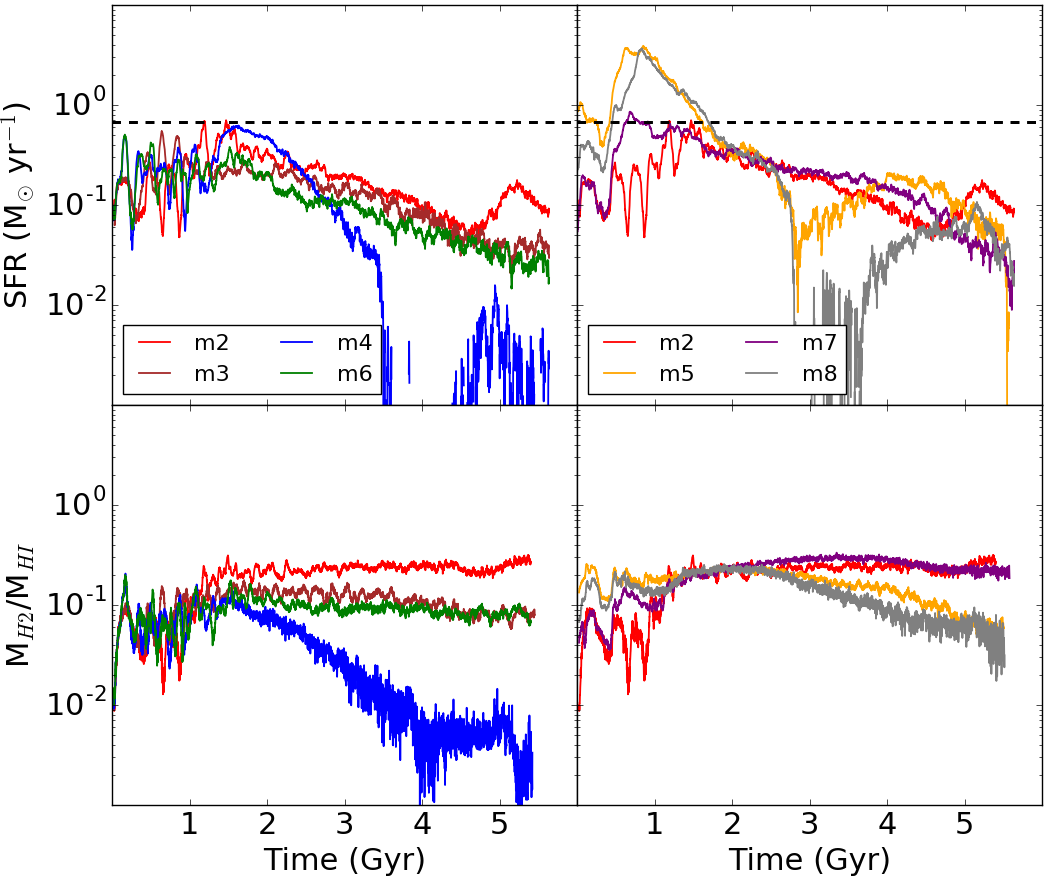 Figure 9
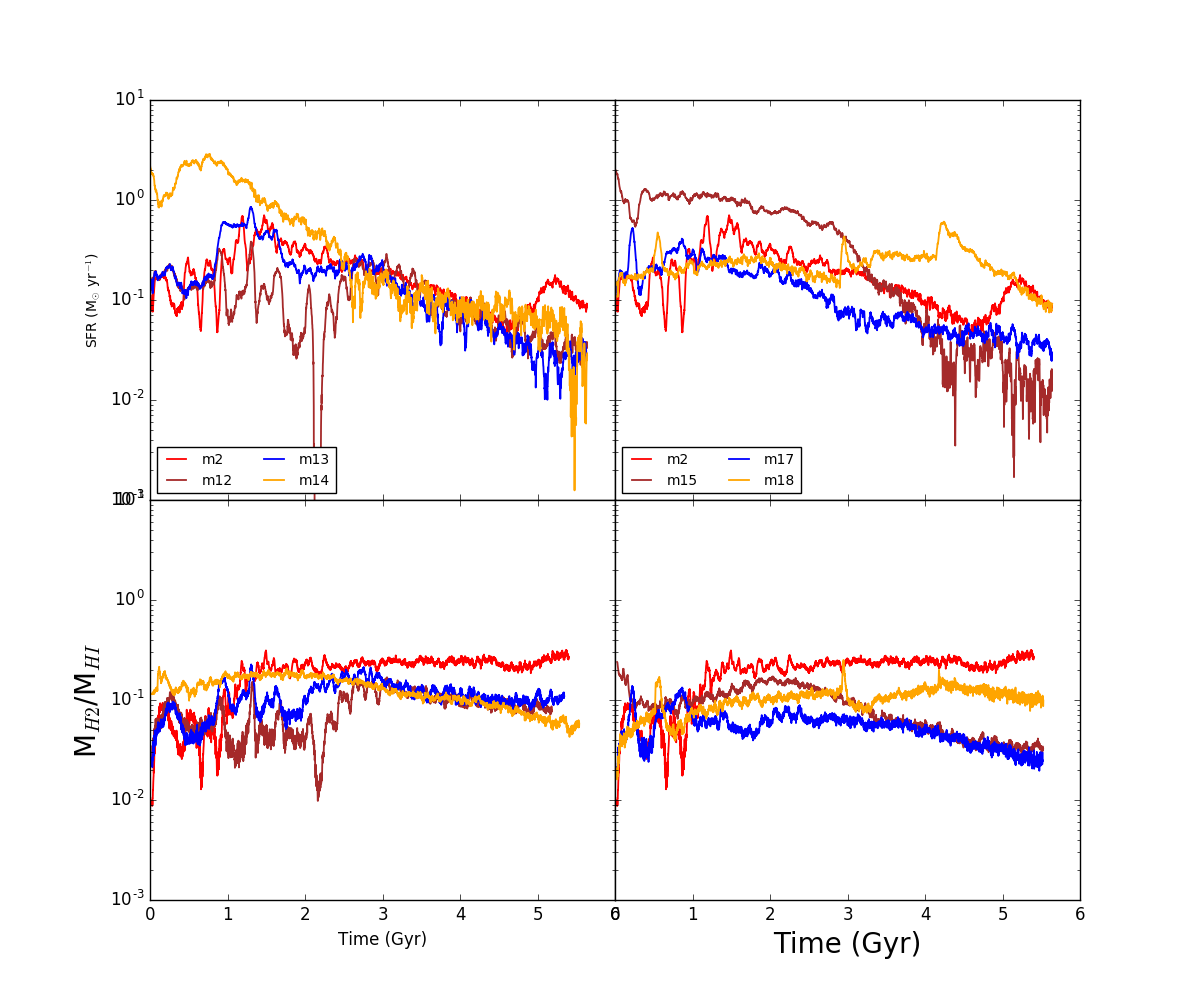 Figure 10
 Figure 11
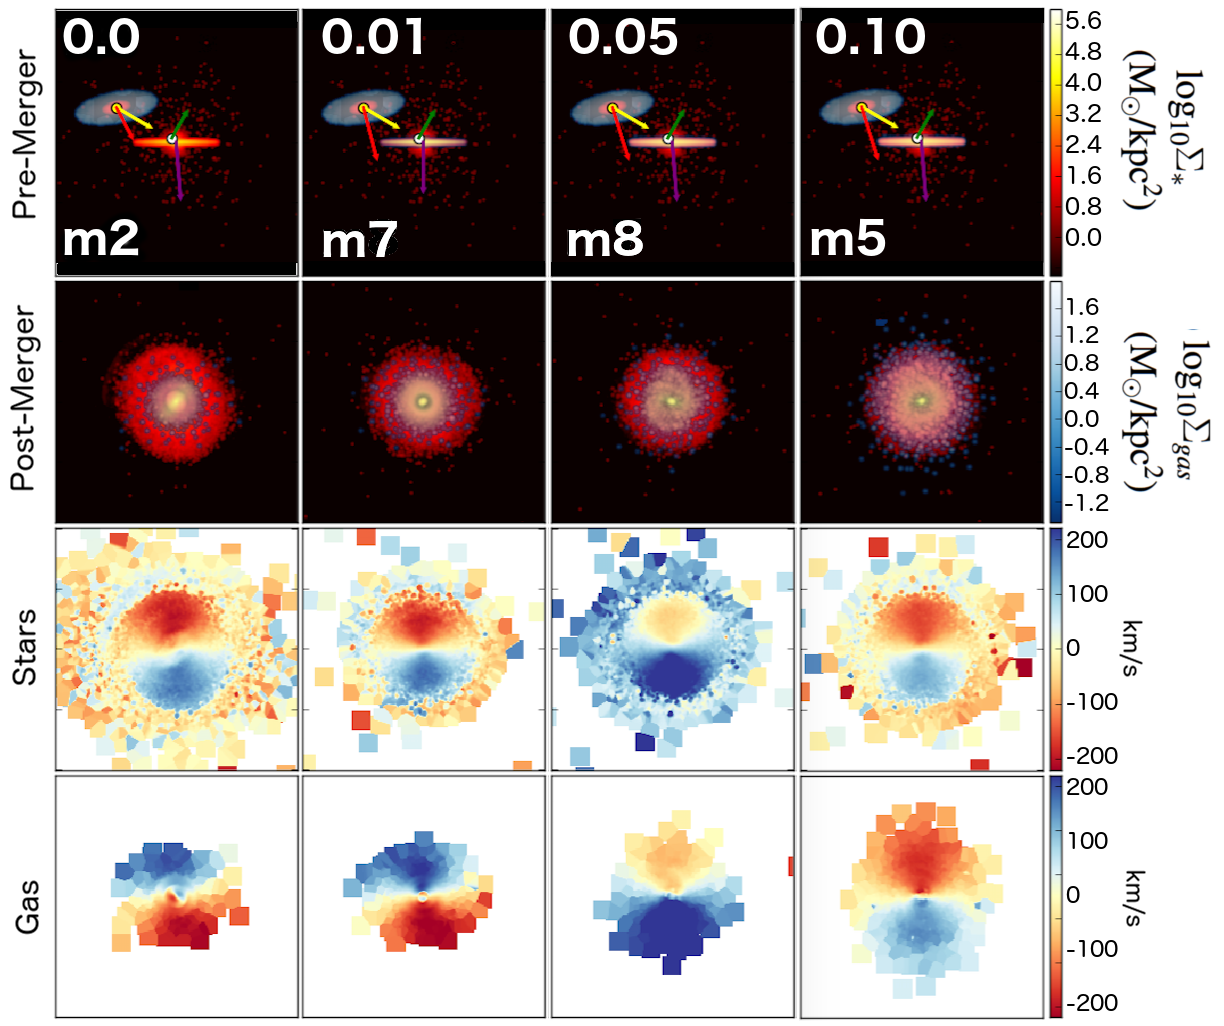 Figure 12
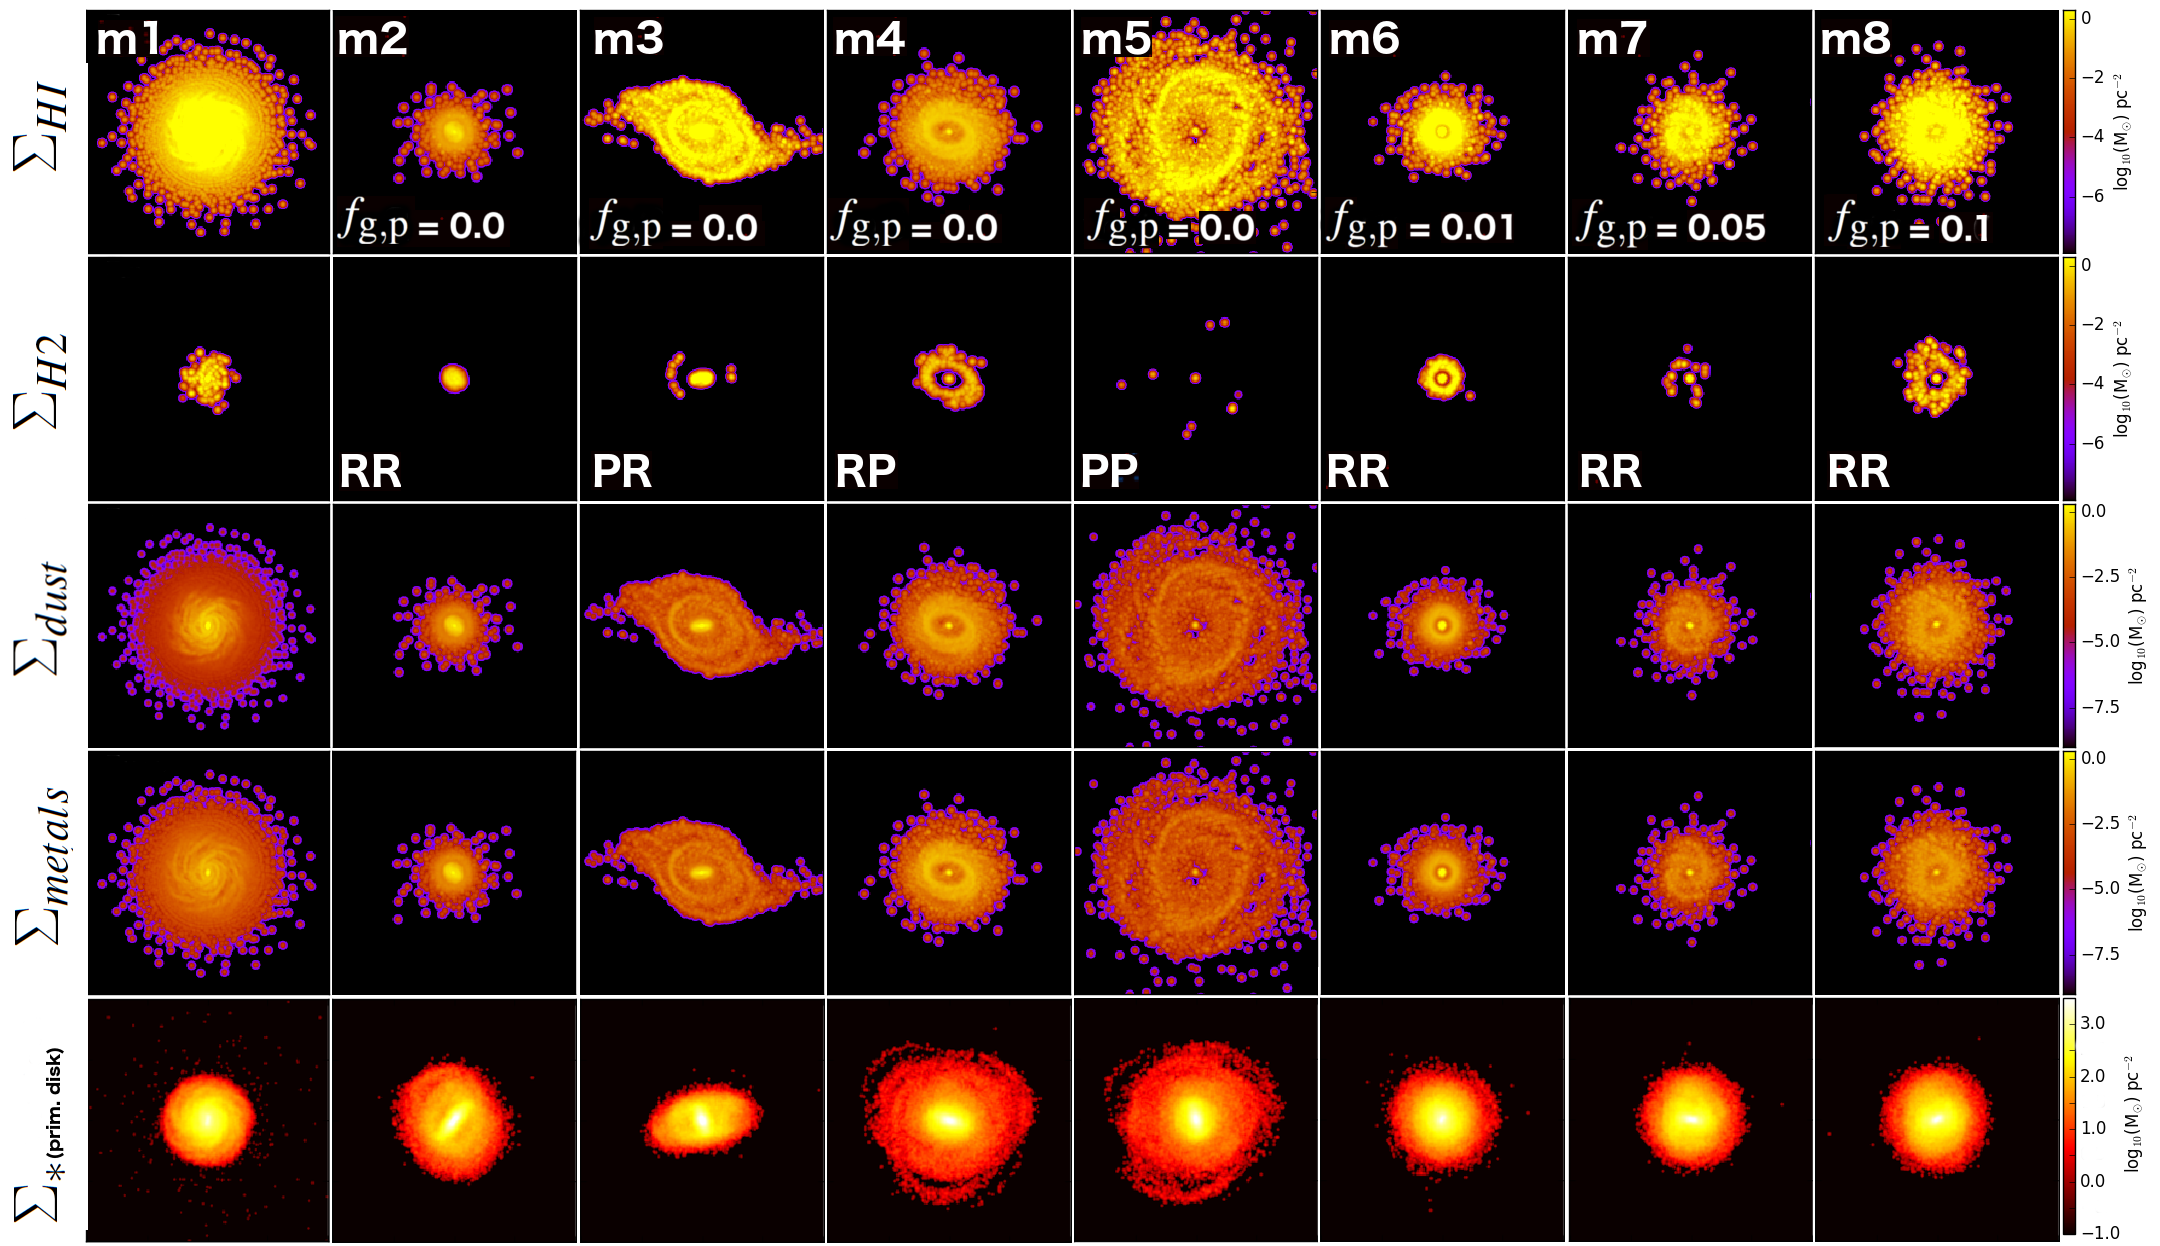 Figure 13
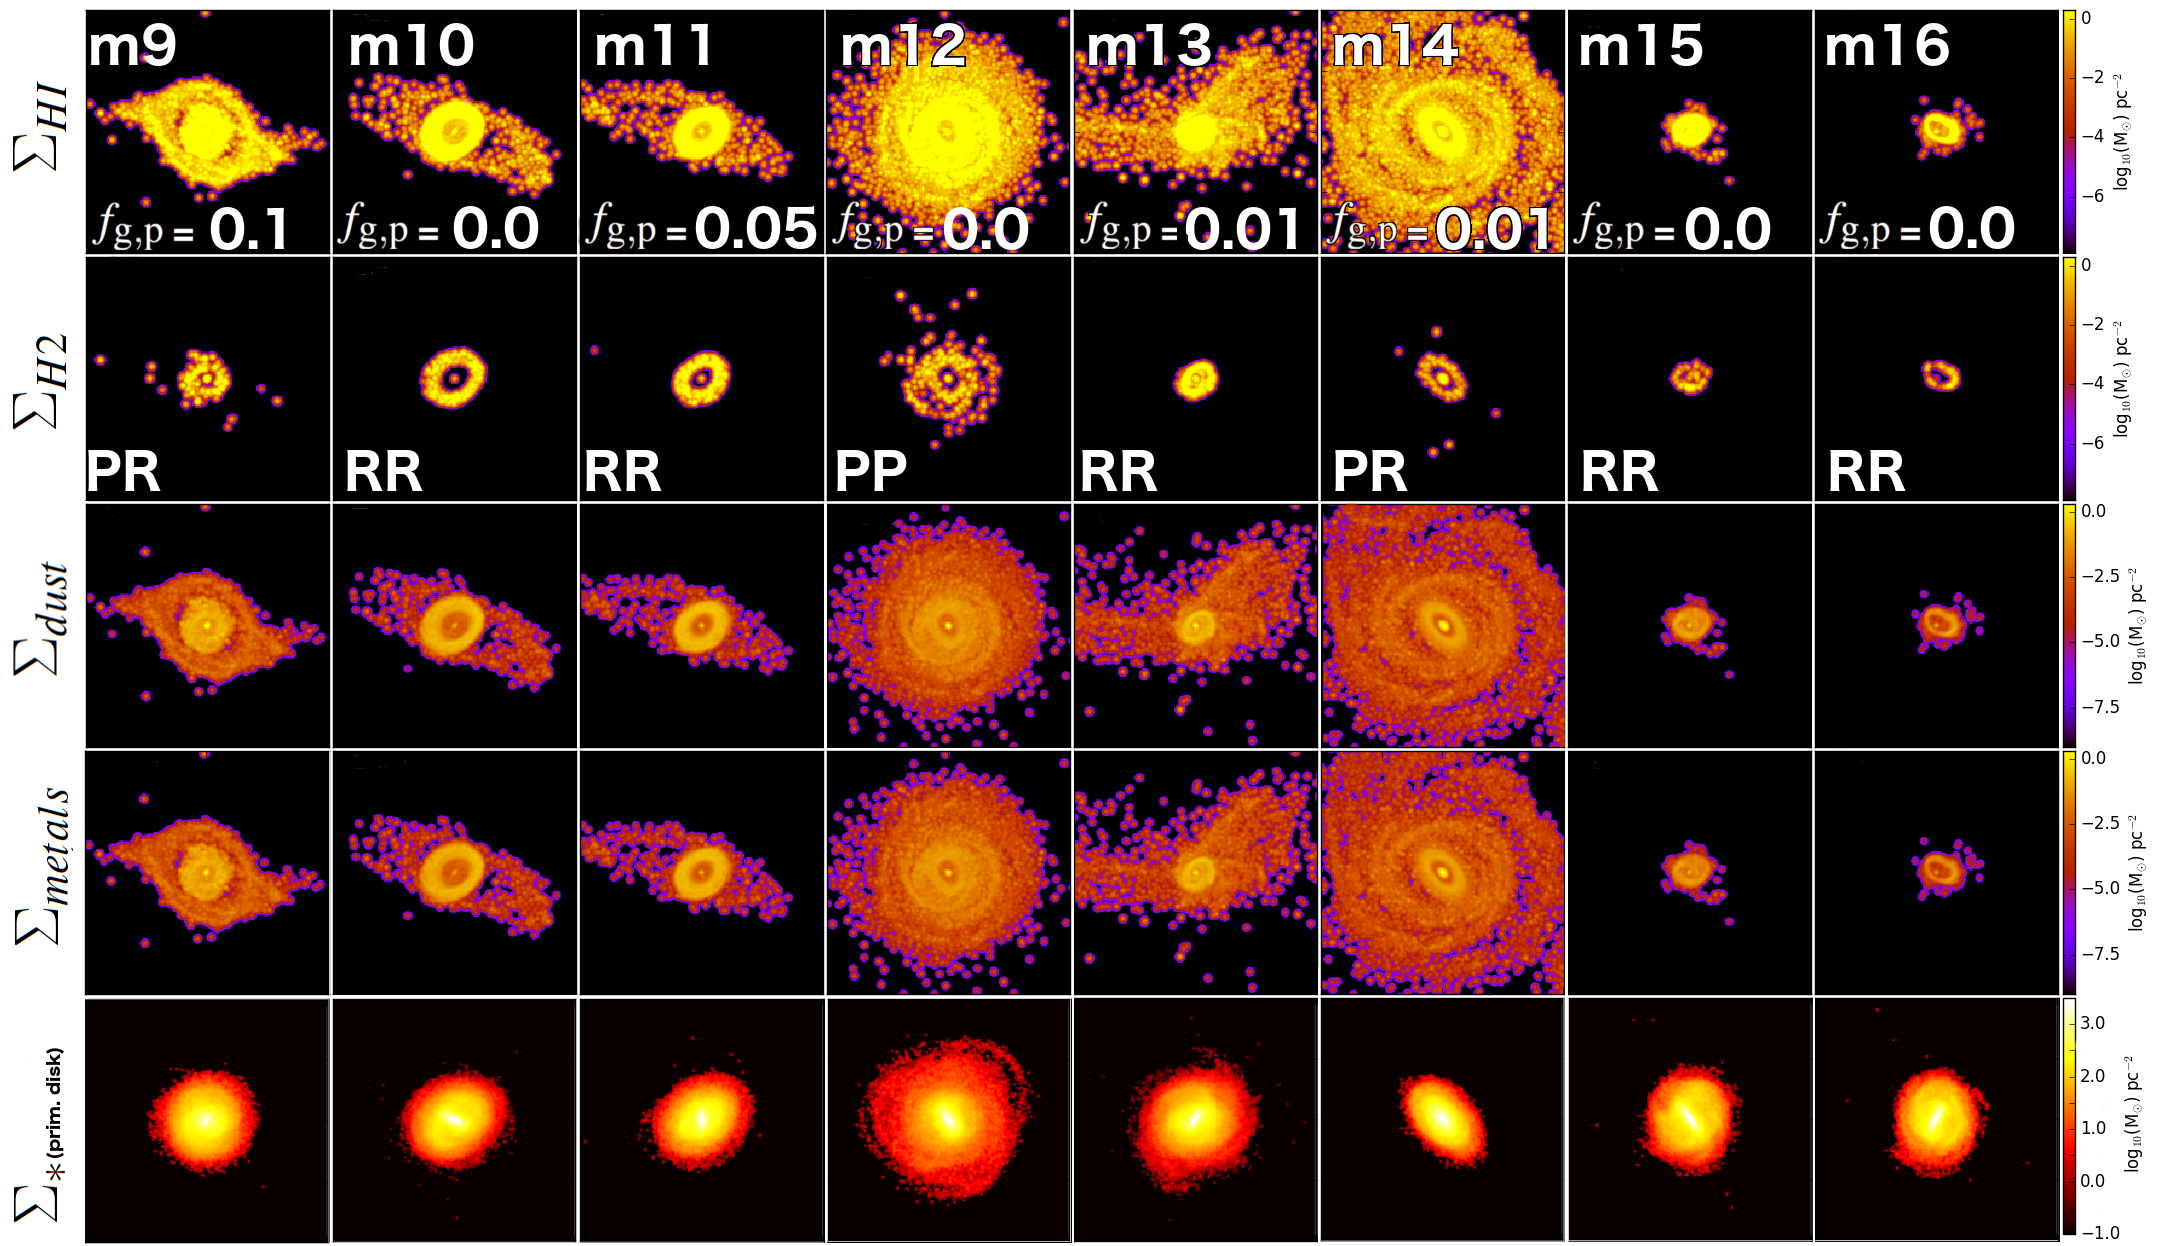 Figure 14
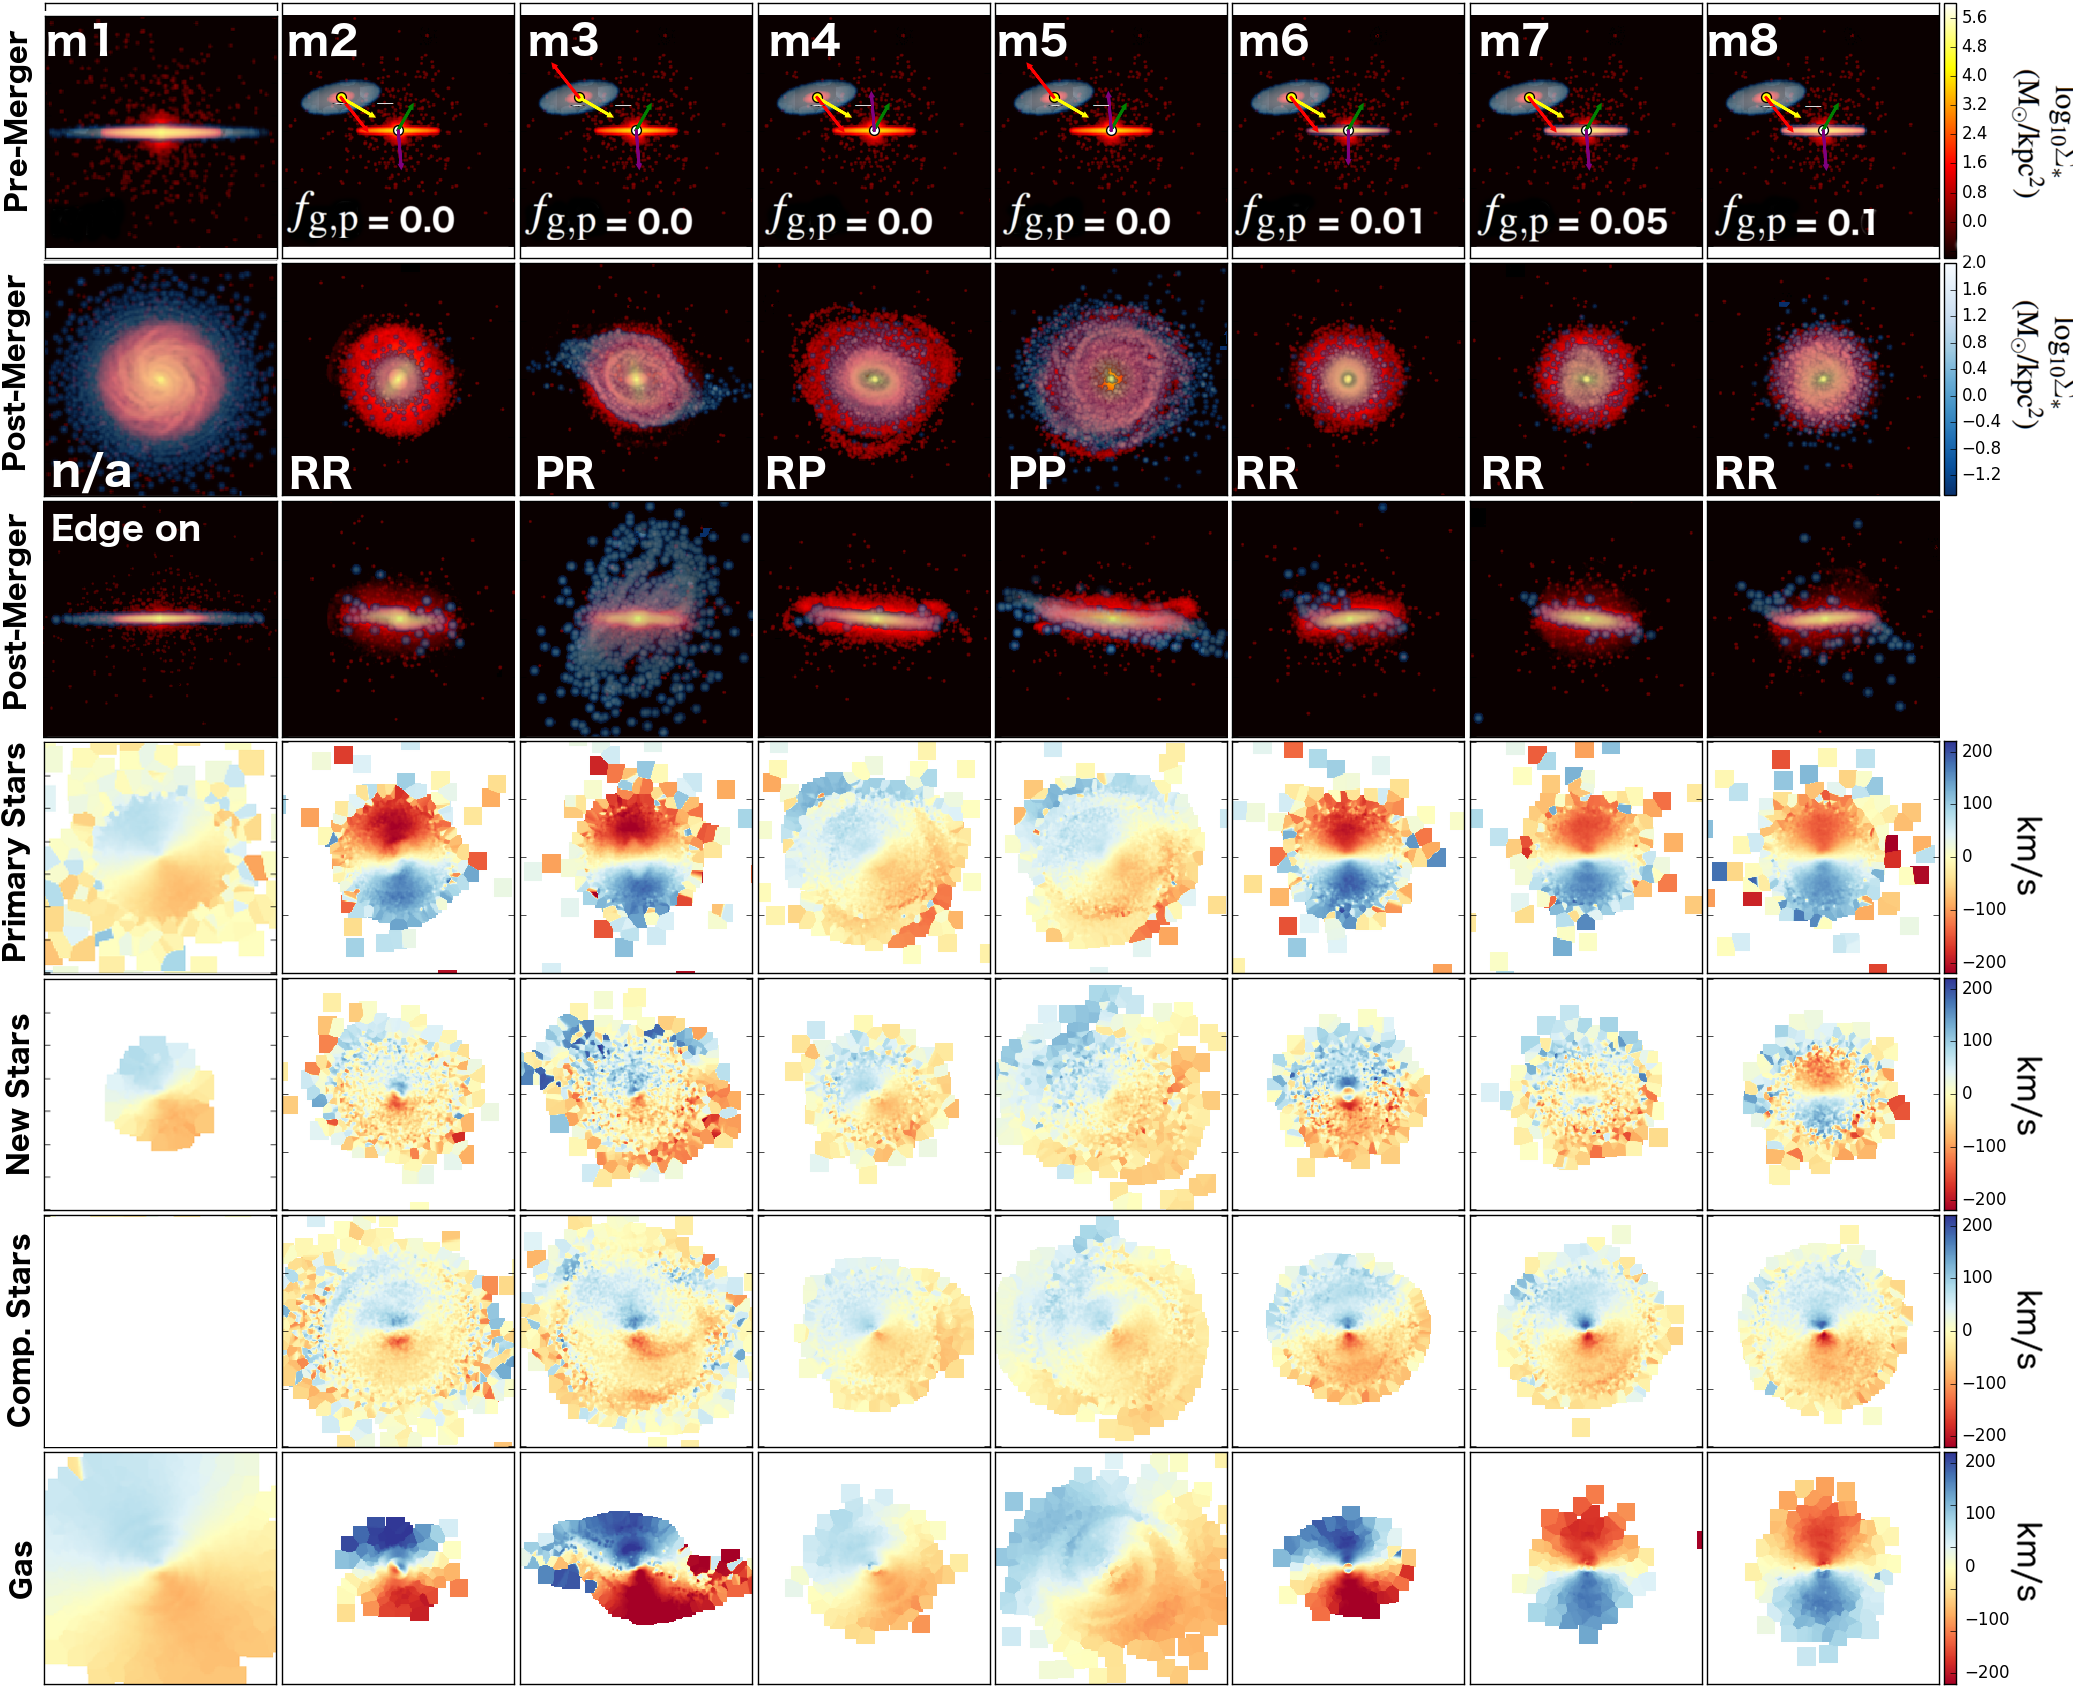 Figure 15
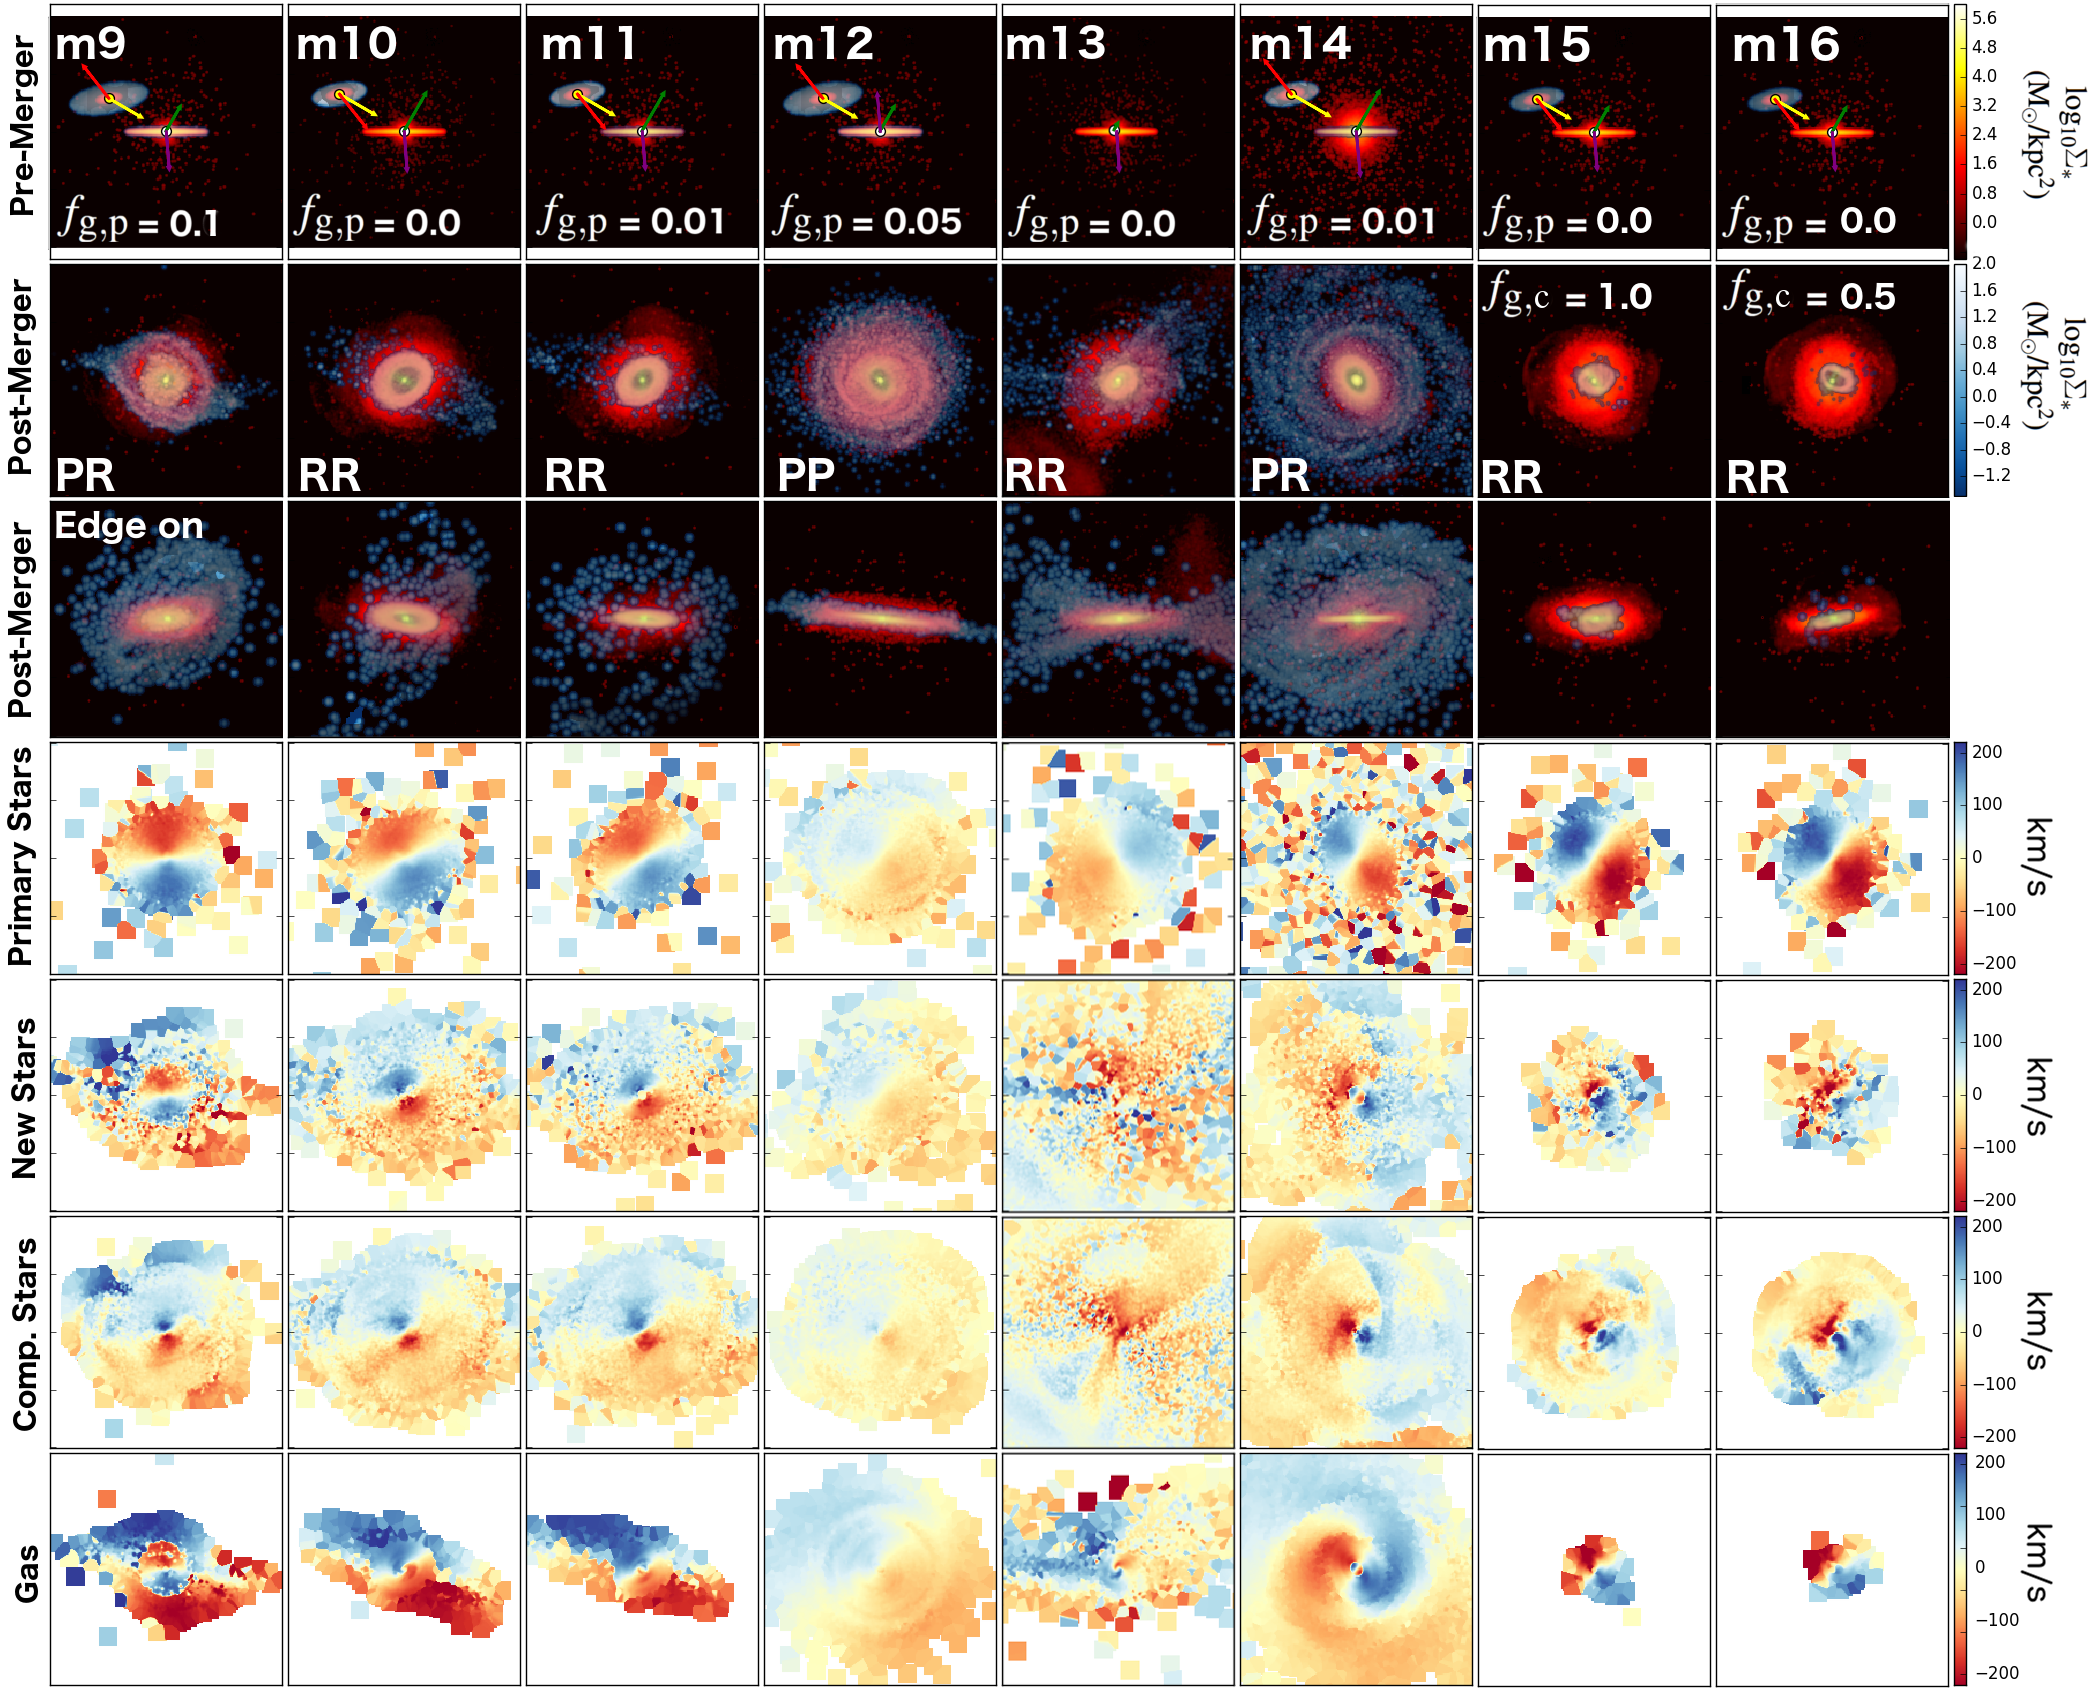 Figure 16
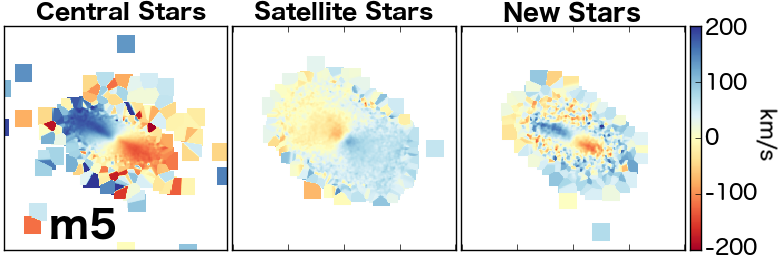 Figure 17
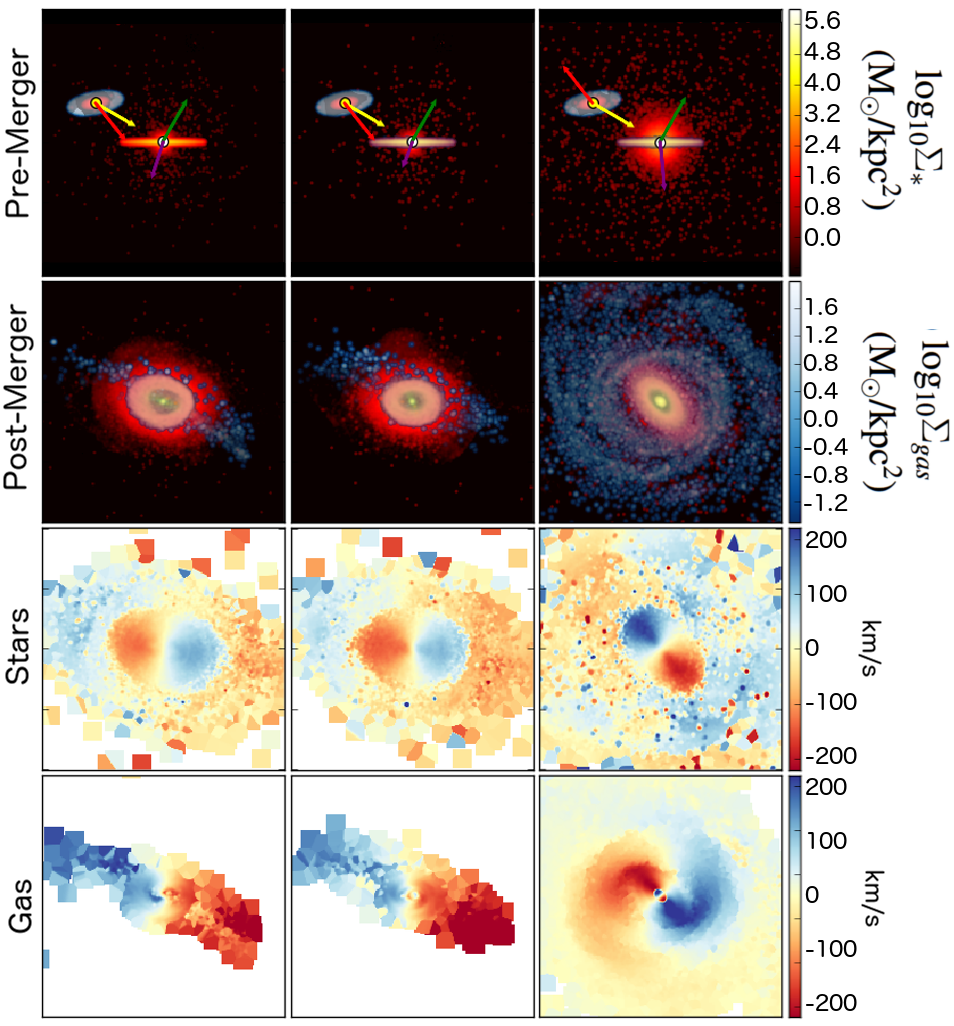 Figure 18
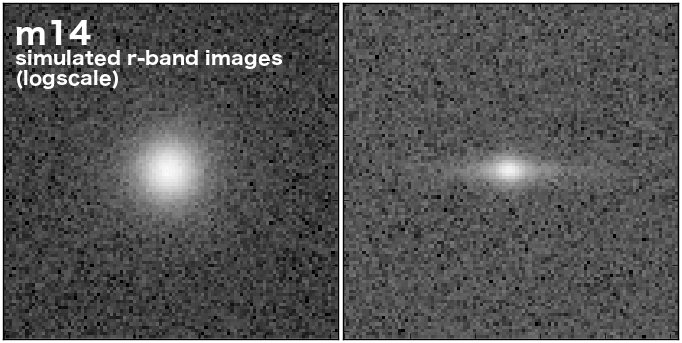 Figure 19
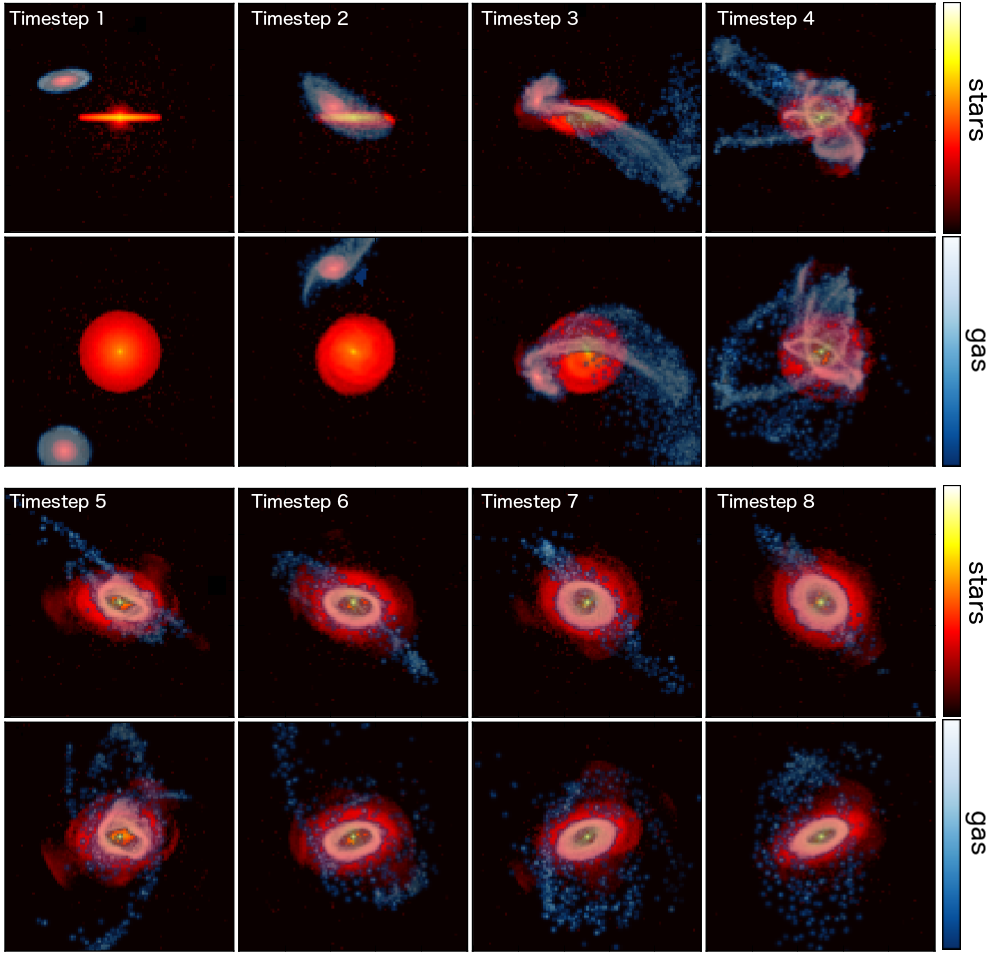 Figure 20
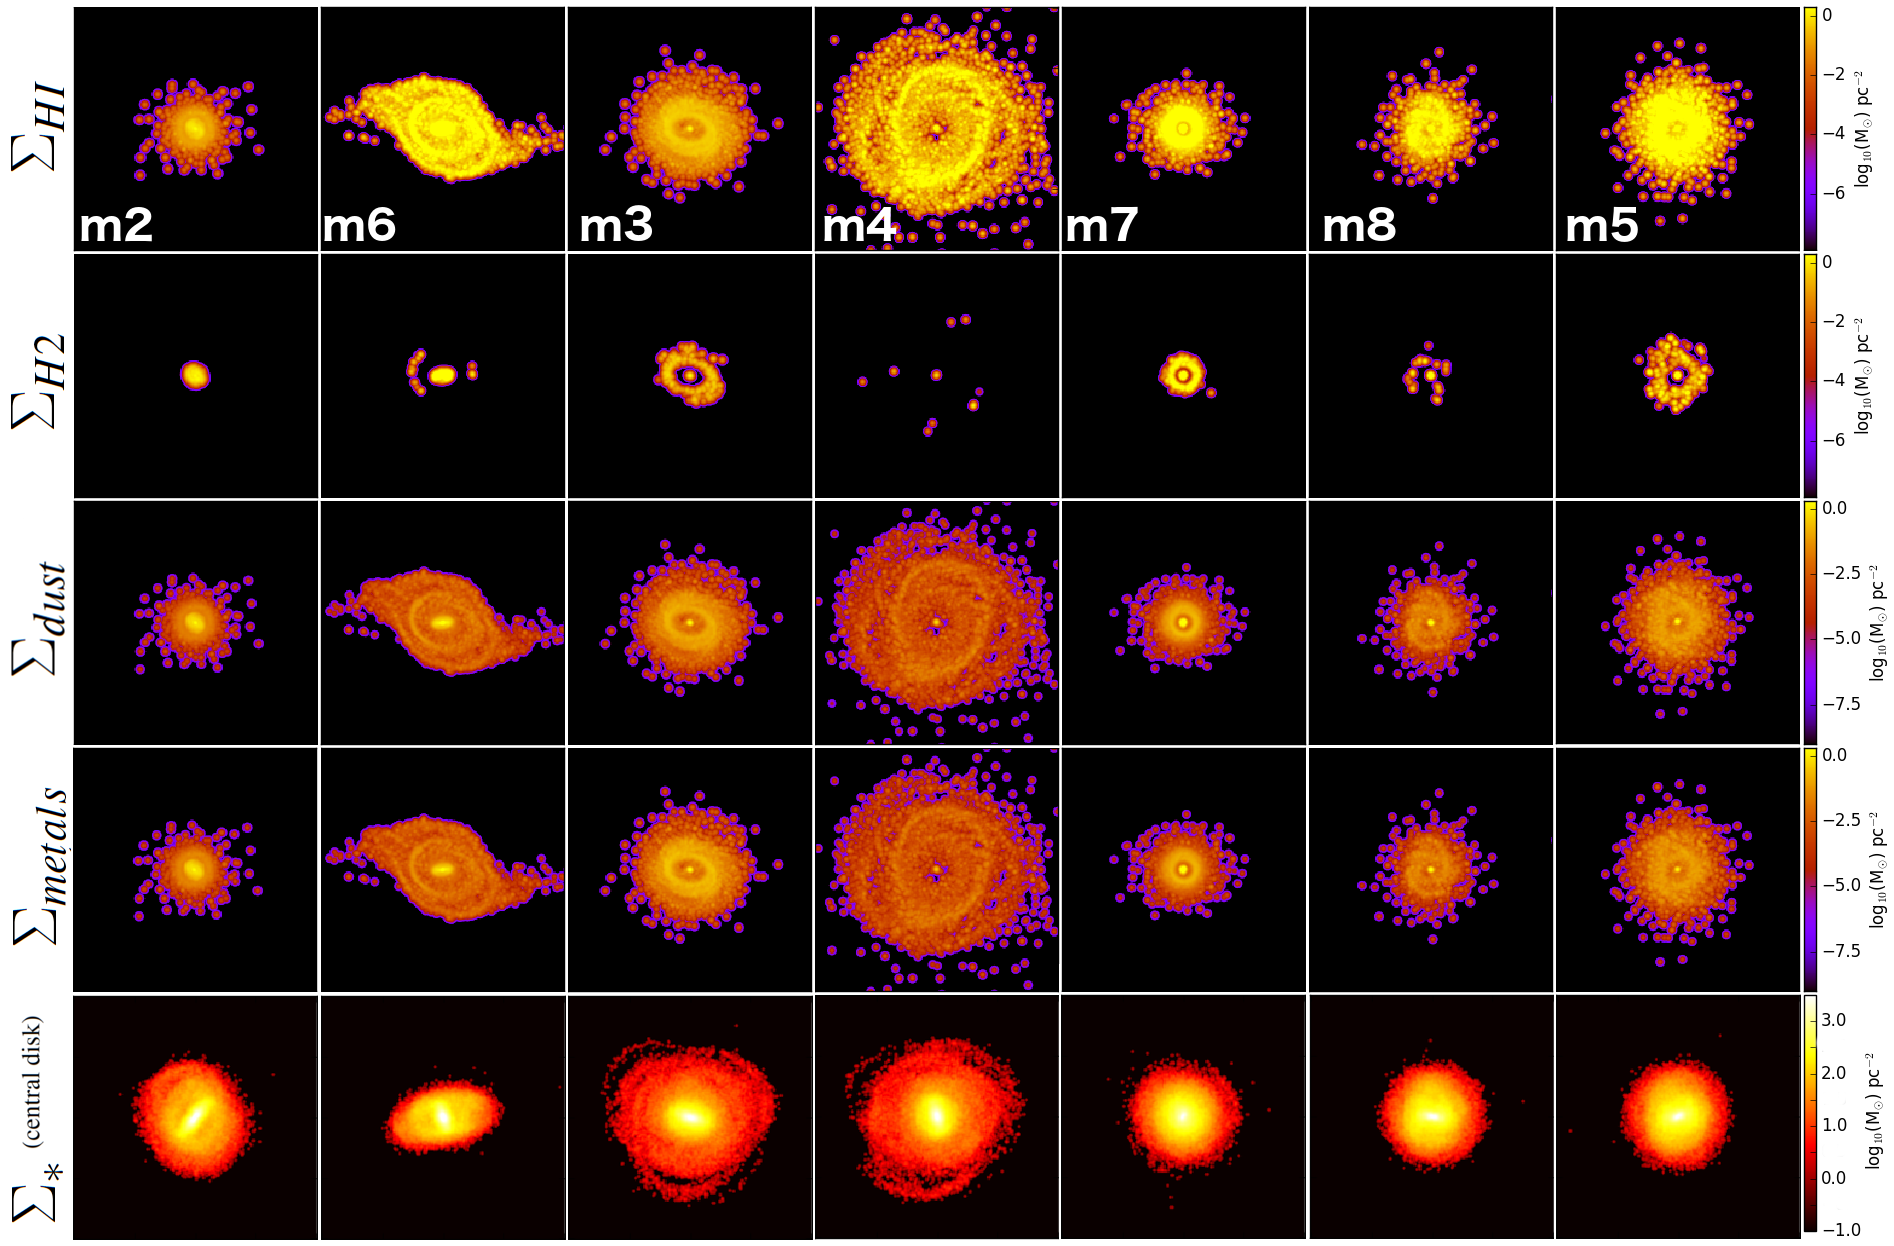 Figure 21
| ID 111 The isolated model is m1. | 222 The initial bulge mass fraction of a primary galaxy. | 333 The initial gas mass ratio (, where and are the initial total stellar and gas masses, respectively) of a primary galaxy. | 444 The initial gas mass ratio of a companion galaxy. | Orbit 555 ‘PP’, ‘PR’, ‘RP’, and ‘RR’ represent the prograde-prograde, prograde-retrograde, retrograde-prograde, and retrograde-retrograde orbital configurations, respectively. | 666 The pericenter distance of a merger in units of kpc | 777 The initial distance of two disk galaxies in units of kpc. | 888 The orbital eccentricity of merging two galaxies. |
|---|---|---|---|---|---|---|---|
| m1 | 0.17 | 0.09 | n/a | n/a | n/a | n/a | n/a |
| m2 | 0.17 | 0.0 | 5.0 | RR | 8.8 | 35.0 | 0.7 |
| m3 | 0.17 | 0.0 | 5.0 | PR | 8.8 | 35.0 | 0.7 |
| m4 | 0.17 | 0.0 | 5.0 | RP | 8.8 | 35.0 | 0.7 |
| m5 | 0.17 | 0.0 | 5.0 | PP | 8.8 | 35.0 | 0.7 |
| m6 | 0.17 | 0.01 | 5.0 | RR | 8.8 | 35.0 | 0.7 |
| m7 | 0.17 | 0.05 | 5.0 | RR | 8.8 | 35.0 | 0.7 |
| m8 | 0.17 | 0.1 | 5.0 | RR | 8.8 | 35.0 | 0.7 |
| m9 | 0.17 | 0.1 | 5.0 | PR | 8.8 | 35.0 | 0.7 |
| m10 | 0.17 | 0.0 | 5.0 | RR | 17.5 | 52.5 | 0.7 |
| m11 | 0.17 | 0.01 | 5.0 | RR | 17.5 | 52.5 | 0.7 |
| m12 | 0.17 | 0.05 | 5.0 | PP | 17.5 | 52.5 | 0.7 |
| m13 | 0.17 | 0.01 | 5.0 | RR | 17.5 | 175 | 1.0 |
| m14 | 1.0 | 0.01 | 5.0 | PR | 17.5 | 52.5 | 0.7 |
| m15 | 0.17 | 0.0 | 1.0 | RR | 8.8 | 35.0 | 0.7 |
| m16 | 0.17 | 0.0 | 0.5 | RR | 8.8 | 35.0 | 0.7 |
| ID 999 The isolated model is m1. | counter? 101010 Components with counter-rotation with respect to the primary stars in the final merger remnant: c* = companion stars, n* = new stars, g = gas, and components with “!” are only partially counter-rotating (e.g. kinematic twists or flips) | rings? |
|---|---|---|
| m1 | n/a | none |
| m2 | c*, n*, g | inner |
| m3 | c*, n*, g | inner, outer |
| m4 | none | inner |
| m5 | none | outer |
| m6 | c*, n*!, g | inner |
| m7 | c*, n*! | none |
| m8 | c*, n*! | inner |
| m9 | c*, n*!, g! | inner, outer |
| m10 | c*, n*, g | inner |
| m11 | c*, n*, g | inner |
| m12 | none | inner, outer |
| m13 | g | inner |
| m14 | c*, n*!, g! | inner, outer |
| m15 | c*, n*, g | inner |
| m16 | c*, n*, g | inner |
| ID 111111 The isolated model is m1. | 121212 percentage of gas mass converted into stars | 131313 percentage of angular momentum lost by gas component, note in models with non-zero this can often be negative (net gain of ) as gas converted to stars represents a loss of typically occuring in low gas. | 141414 Final half-mass radius of gas component in kpc | 151515 Final concentration index, gas | 161616 percentage of angular momentum lost by primary stars | 171717 Final half-mass radius of primary stars in kpc | 181818 Final concentration index, primary stars | 191919 Final half-mass radius of new stars in kpc | 202020 Final concentration index, new stars | 212121 Final half-mass radius of companion stars in kpc | 222222 Final concentration index, companion stars |
|---|---|---|---|---|---|---|---|---|---|---|---|
| m1 | 5.8% | -4.8% | 5.9 | 2.36 | -47.2% | 0.9 | 2.43 | n/a | n/a | n/a | n/a |
| m2 | 60.7% | 84.7% | 3.1 | 2.20 | 16.9% | 3.6 | 3.76 | 3.4 | 4.33 | 14.6 | 1.63 |
| m3 | 40.8% | 47.9% | 13.1 | 2.14 | 13.9% | 3.9 | 3.58 | 2.9 | 6.04 | 16.6 | 1.68 |
| m4 | 44.9% | 51.4% | 10.4 | 1.46 | 10.1% | 4.1 | 3.79 | 6.6 | 1.83 | 9.9 | 1.78 |
| m5 | 57.6% | 12.3% | 21.6 | 1.50 | 8.0% | 4.1 | 3.91 | 0.6 | 20.2 | 12.9 | 1.91 |
| m6 | 69.7% | 65.2% | 6.1 | 1.53 | 2.7% | 4.6 | 2.57 | 1.4 | 4.64 | 12.1 | 1.76 |
| m7 | 91.8% | -6.2% | 7.6 | 1.59 | 3.2% | 4.9 | 2.59 | 0.9 | 3.29 | 12.9 | 1.62 |
| m8 | 80.4% | -173.1% | 10.6 | 1.59 | -1.1% | 4.9 | 2.64 | 0.9 | 7.29 | 12.1 | 1.85 |
| m9 | 77.1% | -93.1% | 13.6 | 2.32 | -3.8% | 4.9 | 2.59 | 1.1 | 5.22 | 15.6 | 1.75 |
| m10 | 28.4% | 70.1% | 10.9 | 1.25 | 7.0% | 4.4 | 3.00 | 11.6 | 2.37 | 19.4 | 1.65 |
| m11 | 46.9% | 68.8% | 9.1 | 1.27 | 3.9% | 4.6 | 2.73 | 7.9 | 2.56 | 19.6 | 1.70 |
| m12 | 62.7% | -41.5% | 16.9 | 1.68 | -2.4% | 4.4 | 3.69 | 1.4 | 5.73 | 13.4 | 1.90 |
| m13 | 22.1% | 45.9% | 7.9 | x | -2.4% | 4.4 | 3.11 | 56.1 | 1.99 | 56.1 | 1.86 |
| m14 | 34.3% | 36.4% | 21.1 | 2.13 | 0.3% | 3.1 | 3.48 | 1.6 | 22.23 | 28.4 | 2.09 |
| m15 | 15.2% | 81.4% | 5.4 | 1.37 | 6.6% | 4.4 | 2.94 | 8.4 | 1.81 | 17.4 | 1.58 |
| m16 | 8.4% | 75.5% | 6.4 | 1.35 | 5.6% | 4.6 | 2.73 | 8.1 | 1.77 | 17.4 | 1.56 |
Peer Reviews
No public reviews on file for this paper yet. If you reviewed it on a platform where reviews are public (OpenReview, ICLR, NeurIPS, ICML), you can paste yours below so the community can read it here.
Videos
No videos yet. Explain this paper in a talk, walkthrough, or lecture? Add one.
The Formation of S0 Galaxies with Counter-Rotating Neutral and
Molecular Hydrogen
Robert Bassett1, Kenji Bekki1, Luca Cortese1, Warrick Couch2
1International Centre for Radio Astronomy Research, University of Western Australia, 7 Fairway, Crawley, WA 6009, Australia
2Australian Astronomical Observatory, PO Box 970, North Ryde, NSW 1670, Australia E-mail: [email protected] (ICRAR)
(Accepted XXX. Received YYY; in original form ZZZ)
Abstract
The observation of counter rotation in galaxies (i.e. gas that rotates in the opposite direction to the stellar component or two co-spatial stellar populations with opposite rotation) is becoming more commonplace with modern integral field spectroscopic surveys. In this paper we explore the emergence of counter-rotation (both stellar and gaseous) in S0 galaxies from smoothed-particle hydrodynamics simulations of 1/10 mass ratio minor mergers between a 1010.8 M*⊙* disk galaxy with a bulge-to-total ration of 0.17 and a gas rich companion (gas-to-stellar mass fraction of 5.0). These simulations include a self-consistent treatment of gas dynamics, star formation, the production/destruction of H2 and dust, and the time evolution of the interstellar radiation field. We explore the effect of retrograde versus prograde obits, gas and bulge mass fractions of the primary galaxy, and orbital parameters of the companion. The key requirement for producing counter rotation in stars or gas in a merger remnant is a retrograde primary, while the relative spin of the companion affects only the radial extent of the accreted gas. We also find that including a significant amount of gas in the primary can prevent the emergence of counter-rotating gas, although accreted stars retain counter-rotation. Bulge mass and orbit have a secondary effect, generally influencing the final distribution of accreted stars and gas within the framework outlined above. In addition to our primary focus of counter-rotating components in galaxies, we also make some predictions regarding the SFRs, H2 distributions, and dust in minor merger remnants.
keywords:
galaxies: interactions – galaxies: kinematics and dynamics
††pubyear: 2016††pagerange: The Formation of S0 Galaxies with Counter-Rotating Neutral and Molecular Hydrogen–A
1 Introduction
Prior to the 1980’s the concept of counter-rotating matter in galaxies, galaxies which contain multiple dynamical components (stars and/or gas) rotating in different directions, was primarily theoretical (Lynden-Bell, 1960; Toomre, 1982; Binney & Tremaine, 1987). The first example of counter-rotation in an observation was shown by Galletta (1987) who observed an SB0 galaxy to have gas rotating in retrograde orbits relative to the stars. Observation of two counter-rotating stellar components in E7/S0 galaxy NGC 4550 by Rubin et al. (1992) came a few years later. In retrospect, it is not surprising that these discoveries were both made for S0 galaxies as subsequent studies have shown that the percentage of S0 galaxies that exhibit counter-rotation is 20-40% (Bertola et al., 1992; Kuijken et al., 1996; Pizzella et al., 2004; Davis et al., 2011) compared to < 8% for Sa-Sbc galaxies (Kannappan & Fabricant, 2001). For a more thorough historical review on the topic of multispin galaxies see Rubin (1994) and Corsini (2014).
Having been established as a concrete reality, counter-rotating components of galaxies next required a viable formation mechanism. Another important development occuring contemporaneously to the discovery of such systems was the recognition of the importance of galaxy interactions in the emerging hierarchical model of galaxy evolution (Gunn & Gott, 1972; Press & Schechter, 1974; White & Rees, 1978; Davis et al., 1985, among others). A number of numerical simulations have shown some galaxy mergers do indeed produce counter-rotation in galaxies (Balcells & Quinn, 1990; Hernquist & Barnes, 1991; Thakar et al., 1997; Bendo & Barnes, 2000; Di Matteo et al., 2007) and, as they are a cosmological necessity, mergers represent the prime candidate for the origin of counter-rotation. This option is also attractive in that mergers have also been shown as a mechanism that can contribute to the formtion of S0 galaxies (e.g. Mihos et al., 1995; Bekki, 1998; Querejeta et al., 2015), which may explain the prevalence of counter-rotation in intermediate morphological types.
Among studies of the emergence of counter-rotation in simulations only Thakar et al. (1997) and Mapelli (2015) demonstrate counter-rotation in minor merger remnants. These simulations are able to preserve the disk of the central galaxy resulting in S0, rather than elliptical, remnants. While the work of Thakar et al. (1997) is focused on the emergence of counter-rotation, the authors tested only three minor merger simulations with only the dark matter content of the accreted satellite varying between simulations. These simulations are also dark matter only, N-body simulations, thus an update using state-of-the-art hydrodynamical simulations is warranted. The more recent work of Mapelli (2015) was focused on building gas rings in S0 galaxies through mergers with the emergence of counter-rotation being a secondary trait that is only briefly discussed. Thus, a large parameter space is yet to be explored in regards to the primary factors required to produce counter-rotating components through minor mergers.
In this work we perform a series of minor merger simulations using our original chemodynamical code for galaxy evolution (Bekki, 2013). Our code represents a major step forward compared to the sticky particle simulations of Thakar et al. (1997), allowing us to track the complex evolution of different stellar components in our galaxies as well as their multiphase interstellar medium. Another improvement in this study when compared to Thakar et al. (1997) and Mapelli (2015) is that we perform a large number of merger simulations with the specific focus of understanding how the initial conditions affect the emergence of counter-rotation. Thus, our study represents the first systematic study of the formation of S0 galaxies hosting counter-rotating gas and/or stars through minor mergers. Our suite of simulations allows us to investigate the effects of the spin orientation of the merging galaxies relative to their orbit, the gas fraction of the primary galaxy, bulge mass of the central galaxy, as well as the orbital parameters themselves. Simulations such as these can help to pin down the statistics of how many galaxy mergers are likely to result in kinematic misalignments easily identifiable by IFS observations. Furthermore, for those simulations resulting in co-rotation of gas and stars, we aim to identify observables that may be strongly indicative of past galaxy interactions in the absence of obvious peculiarities in photometry and/or kinematics. This paper is laid out as follows: In Section 2 we describe our simulation code and the initial conditions of our merger simulations, in Section 3.1 we briefly describe our method of producing two dimensional maps from out simulated data, in Section 4 we describe the outcomes of our mergers and possible observational signatures, in Section 5 we provide some discussion and comparison with previous works, and in Section 6 we briefly summarise our conclusions.
2 The model
2.1 A simulation code
We employ the simulation code that has been recently developed in our previous works (Bekki, 2013, B13; Bekki & Tsujimoto, 2014, B14) to investigate the structure and kinematics of gas, dust, and stars in galaxy mergers. Since the details of the code are already given in B13 and B14, we describe them briefly here. Gravitational calculations can be done on GPUs whereas other calculations (e.g., gas dynamics, dust evolution, and hydrodynamics) are performed using CPUs, thus the code can be run on GPU-based clusters. The hydrodynamical part of the code is based on the smoothed-particle hydrodynamics (SPH) method for following the time evolution of gas dynamics in galaxies.
The code allows us to investigate gas dynamics, star formation from gas, formation on dust grains, formation of dust grains in the stellar winds of supernovae (SNe) and asymptotic giant branch (AGB) stars, time evolution of interstellar radiation field (ISRF), growth and destruction processes of dust in the interstellar medium (ISM), and photo-dissociation due to far ultra-violet (FUV) light in a self-consistent manner. The new simulation code does not include the effects of feedback of active galactic nuclei (AGN) on ISM and the growth of supermassive black holes (SMBHs) in galaxies. Since our main purpose is not to investigate the AGN feedback effects on the formation of counter-rotating gas rings, we consider our adoption of the code for the investigation of gas and dust properties in S0 galaxies is appropriate.
2.2 Merger progenitor disk galaxy
2.2.1 Basic Description
The smaller (‘companion’) and larger (‘primary’) galaxies in a minor merger are represented by disk galaxies with the latter also including a central bulge component. The total masses of dark matter halo, stellar disk, gas disk, and bulge of a disk galaxy are denoted as , , , and , respectively. The gas mass fraction is denoted as and considered to be a key parameter that determines the final kinematics of gas. The evolution of gas in minor mergers strongly depends on of the primary and the companion ( and , respectively), and accordingly we investigate models with different and . We adopt the density distribution of the NFW halo (Navarro, Frenk & White, 1996) suggested from CDM simulations to describe the initial density profile of dark matter halo in a disk galaxy:
[TABLE]
Here, , , and are the spherical radius, the characteristic density of a dark halo, and the scale length of the halo, respectively. The -parameter (, where is the virial radius of a dark matter halo) and are chosen appropriately for a given dark halo mass () by using recent predictions from cosmological simulations (e.g. Neto et al., 2007).
The bulge of a disk galaxy is represented by the Hernquist density profile with the bulge mass fraction () as a free parameter ranging from 0 to 1. For the companion galaxy in a minor merger, is set to be 0 (bulge-less disk galaxy) while the primary galaxy, in most cases, contains a non-rotating bulge with = 0.17. The radial () and vertical () density profiles of the stellar disk are assumed to be proportional to with scale length and to with scale length , respectively. The gas disk with a size of has the radial and vertical scale lengths of and , respectively. In the present model, the exponential disk has kpc for the primary and 5.5 kpc for the companion. The primary and companion galaxies are assumed to have and 3, respectively. In addition to the rotational velocity caused by the gravitational field of the disk, bulge, and dark halo components, the initial radial and azimuthal velocity dispersions are assigned to the disc component according to the epicyclic theory with Toomre’s parameter = 1.5. The vertical velocity dispersion at a given radius is set to be 0.5 times as large as the radial velocity dispersion at that point.
In this work we describe the initial morphology of the primary galaxy as being a late-type. In particular, these simulated galaxies represent the early end of the late-type galaxy sequence (i.e. Sa galaxies) for two reasons: first they host large bulges and second the majority begin the simulations free of gas. From an observational perspective, it may be equally valid to describe our primary galaxies as initially having S0 morphologies though this simply reflects the often ambiguous nature of visual classifications for S0-Sa galaxies (e.g. Sandage, 2004; Kormendy & Bender, 2012). In simulations, the assertion that a gas-free, disk-like galaxies should all be considered S0 in morphology is not clear cut, with examples of simulated gas-free galaxies hosting spiral arms readily available in the literature (e.g. Bekki et al., 2002). For this reason we choose to describe the initial morphologies as late-type, although it can easily be argued that an S0 classification is also appropriate. Regardless, we test here the conditions required such that gas-rich, minor mergers involving massive disks (whether Sa or S0) produce S0 remnants containing counter-rotating gas and/or stars.
The initial gravitational softening lengths for dark matter halo, stellar disk, gas disk, and bulge in the central galaxy are set to be 2.1 kpc, 0.2 kpc, 0.08 kpc, and 0.2 kpc, respectively. Those for the dark matter halo, the stellar disk, and the gas disk of the companion galaxy are set to be 0.88 kpc, 0.08 kpc, and 0.08 kpc, respectively. We employ a variable softening length for dark matter and stellar particles residing in dense regions, with a minimum value of 0.08 kpc, matching that of the gas particles. Using these multiple and varying softening lengths for different components, we are able to resolve the 100-1000pc scale distribution of cold neutral and molecular gas in simulated S0s in this present study. The main results of this work focus on the kpc (and greater) scale kinematics of different components of our merger remnants. Furthermore, as described in Section 3.1, we also employ a 2D, 1 kpc Gaussian smoothing kernal while producing kinematics maps of our simulations. Thus, our conclusions based on large scale kinematics should not change were we to rerun our simulations at a much higher resolution (although such simulations may differ significantly on sub-kpc scales).
Other properties of the galaxies in our models are chosen to roughly match those observed in the local universe. First, the initial stellar mass of the primary galaxies of log10() = 10.85 () is near the peak in stellar mass for S0 galaxies observed in the GAMA survey (Moffett et al., 2016). As we mentioned previously, we consider our primary galaxies to begin as late-type galaxies, however we match their initial mass to those of low S0’s in order that the remnants will have masses appropriate for an S0 galaxy (as there is little mass growth during the simulation). The corresponding mass of the satellite galaxies give a merger mass ratio of 1/10, which falls in the observed range for low redshift minor mergers (Croton et al., 2006; Stewart et al., 2008; Somerville et al., 2008; Lotz et al., 2011). Finally, the gas mass fractions of the companion galaxies of 0.5 are consistent with observed values for dwarf galaxies from the ALFA survey presented in Huang et al. (2012). We note that the sample of Huang et al. (2012) will be biased towards gas-rich systems, particularly at low stellar mass, thus they likely represent the upper end in gas fraction compared to the bulk population of dwarf galaxies. Regardless, gas-rich galaxies similar to our simulated companions are known to exist and, although likely rare, gas-rich minor mergers similar to our simulations will occur and have been shown to be necessary to reproduce observations (e.g. the HI distributions of HI-excess galaxies, e.g. Gereb et al., 2016).
Following the observed mass-metallicity relation in disk galaxies (e.g. Tremonti et al., 2004), we allocate a metallicity to each disk galaxy. We do not assume a metallicity gradient in the present study in order to avoid introducing another model parameters that can hamper the interpretation of the simulation results. Metallicity-dependent radiative cooling is included, and the initial gas temperature is set to be 10,000 K for the primary and secondary galaxies in the mergers. Gas-to-dust-ratio is a function of metallicity and we assume a dust-to-metal ratio of 0.4 for all models. The details of the model for gas dynamics with dust is given in B13.
2.2.2 Possible Limitations
We are limited in the exact types of mergers we can study due to the extremely large parameter space represented by the wide variety of progenitor galaxies in minor mergers. First we point out that, although this work represents a step forward towards a systematic analysis of the emergence of counter-rotation in minor merger remnants, we primarily focus on mergers involving gas poor (or gas free) primary galaxies with a fixed bulge-to-total ratio of 0.17 and an extremely gas rich companion with = 5.0. We focus on mergers such as these because the large gas content of the merger remnants will be representative of those galaxies hosting the most easily detectable counter-rotating gas disks. While we do include few examples of mergers that vary these basic parameters, we do not explore varying these values in a large range of with a large range of initial conditions (e.g. low as well as = 1.0).
Recently, Marinova et al. (2012) showed that 50-65% of S0 galaxies in the local universe exhibit stellar bars. Although we find that bars form in a number of our simulations (see Section 4.3), bars are not included in the initial conditions for either the primary or companion galaxy. Bars can significantly influence the angular momentum transfer in galaxies, and thus may have an impact on the way material is accreted during a minor merger. We expect any differences that may be induced by an initial bar will be on sub-galactic scales and will not affect the overall direction of rotation, and by extension our classification of a given component as co- or counter-rotating.
Finally, we emphasise that the bulge of the primary galaxy is initially spherical and non-rotating. This is typical of bulges in hydrodynamical simulations, but may not always be the case for observed galaxies that can host flattened and/or rotating bulges (e.g. Noordermeer, 2008). Although the relative kinematics of primary and companion stars and gas can have an effect on the final distribution Toomre & Toomre (e.g. enhanced tidal stripping in prograde mergers 1972), the fact that bulges in our simulations are relatively small with = 0.17 means this can only have a minor effect, if any, on our results. If anything, the presence of a non-rotating component in the primary galaxy would act to confuse signatures of counter-rotation by adding a random velocity component to those stars of the primary galaxy disk. Thus, if the bulges in our primary galaxies are initiated with rotation matching that of the primary disk, the counter-rotation signature would only be enhanced.
2.3 Star formation
We adopt the ‘-dependent’ SF recipe (B13) in which SFR is determined by local molecular fraction () for each gas particle in the present study. A gas particle can be converted into a new star if the following three conditions are met for each particle: (i) the local dynamical time scale is shorter than the sound crossing time scale (mimicking the Jeans instability) , (ii) the local velocity field is identified as being consistent with gravitationally collapsing (i.e., div v), and (iii) the local density exceeds a threshold density for star formation (). We also adopt the Kennicutt-Schmidt law, which is described as SFR (Kennicutt, 1998), where is the power-law slope. A reasonable value of is adopted for all models. The threshold gas density for star formation () is set to be 1 cm*-3* for all models in the present study.
Each SN is assumed to eject the feedback energy () of erg and 90% and 10% of are used for the increase of thermal energy (‘thermal feedback’) and random motion (‘kinematic feedback’), respectively. The thermal energy is used for the ‘adiabatic expansion phase’, where each SN can remain adiabatic for a timescale of . This timescale is set to be yr. A canonical stellar initial mass function (IMF) proposed by Kroupa (2001), which has three different slopes at different mass ranges is adopted. and the IMF is assumed to be fixed at the canonical one. Therefore, chemical evolution, SN feedback effects, and dust formation and evolution is determined by the fixed IMF.
2.4 Dust and metals
Chemical enrichment through star formation and metal ejection from SNIa, II, and AGB stars is self-consistently included in the chemodynamical simulations. The time evolution of the 11 chemical elements of H, He, C, N, O, Fe, Mg, Ca, Si, S, and Ba is investigated to predict both chemical abundances and dust properties in the present study, though we do not discuss these. We consider the time delay between the epoch of star formation and those of supernova explosions and commencement of AGB phases (i.e., non-instantaneous recycling of chemical elements). We adopt the nucleosynthesis yields of SNe II and Ia from Tsujimoto et al. (1995) and AGB stars from van den Hoek & Groenewegen (1997) in order to estimate chemical yields in the present study.
The dust model adopted in the present study is the same as those in B13 and B14: The total mass of th component (=C, O, Mg, Si, S, Ca, and Fe) of dust from th type of stars ( = I, II, and AGB for SNe Ia, SNe II, and AGB stars, respectively) are derived based on the methods described in B13. Dust can grow through accretion of existing metals onto dust grains with a timescale of . Dust grains can be destroyed though supernova blast waves in the ISM of galaxies and the destruction process is parameterised by the destruction time scale (). We consider the models with Gyr and Gyr, and the reason for this selection is discussed in B13.
2.5 formation and dissociation
The details of the new model for formation on dust grains in galaxy-scale simulations have already been provided in B14, therefore, we summarise only briefly here the model for formation and dissociation in the present study. The present chemodynamical simulations include both formation on dust grains and dissociation by FUV radiation self-consistently. The temperature (), hydrogen density (), dust-to-gas ratio () of a gas particle and the strength of the FUV radiation field () around the gas particle are calculated at each time step so that the fraction of molecular hydrogen () for the gas particle can be derived based on the formation/destruction equilibrium conditions. The SEDs of stellar particles around each -th gas particles (thus ISRF) are first estimated from ages and metallicities of the stars by using stellar population synthesis codes for a given IMF (e.g. Bruzual & Charlot, 2003). Then the strength of the FUV-part of the ISRF is estimated from the SEDs so that can be derived for the -th gas particle. Based on , , and of the gas particle, we can derive (See Fig. 1 in B13a). Thus, each gas particle has , metallicity ([Fe/H]), and gas density, and the total dust, metal, and masses are estimated from these properties.
2.6 Galaxy mergers
Both companion and the primary galaxies in a galaxy merger are represented by the disk galaxy model described above. Although the mass-ratio of the companion to the primary can be a free parameter represented by , we investigate only for the models with . This is because the simulated merger remnants can have S0-like morphology without spiral arms.
In all the simulations of minor mergers, the orbit of the two disks is set to be initially on the plane and the distance between the center of mass of the two disks is a free parameter (). The pericenter distance, represented by and the orbital eccentricity () are free parameters too. The spin of the primary and companion galaxies in a merger pair is specified by two angle and (in units of degrees), where is the angle between the axis and the vector of the angular momentum of a disk and is the azimuthal angle measured from axis to the projection of the angular momentum vector of a disk on the plane. In the present model, is set to be 0 for the two disks. The values of can be different for the two: and are for the companion and the primary galaxies, respectively: we used this notation of for the companion, because we focus on the gas dynamics of the companion.
We mainly investigate the models with the following four merger orbital configurations: (i) prograde-prograde (‘PP’) model with = 35, = , (ii) prograde-prograde (‘PR’) model with = 35, = , (iii) retrograde-prograde (‘RP’) model with = 35, = , and (iv) retrograde-retrograde (‘RR’) model with = 145, = . We investigate two representative cases of orbits, bound orbit with and hyperbolic one with . The results of the two cases are not so different in terms of counter-rotating gas formation in S0s. The model parameters for each model are summarized in Table 1.
3 Analysis
3.1 Mapping of Simulated Data
Here we briefly describe our methods for producing two dimensional (2D) maps from our three dimensional (3D) SPH simulations. This process is essential in presenting a clear picture of our simulations, however the specific details can have some bearing over the interpretation of our results. Note that, while gas and stars are often treated separately in our analysis, the mapping process for both components is identical.
First, we perform a coordinate transformation of the positions and velocities of each particle for a given timestep of a given simulation in order to achieve the desired projection. Typically, this is either edge on or nearly face on (inclined at 15-20*∘*) with respect to the disk of the central galaxy. The reason we do not present perfectly face on projections is because this will result in an apparent lack of rotation in the velocity maps for rotating galaxies. This is key to clearly showing counter-rotating components in our simulated galaxy mergers.
Next, we create a 2D, 100100 kpc grid with a pixel size of 0.5 kpc. At each grid point we select all particles within 4 kpc of the pixel centre. For each selected particle we calculate a weighting using a Gaussian kernel with a FWHM of 1 kpc multiplied by the particle mass. From this we produce maps of mass surface density by performing a weighted sum of the selected particles and dividing by our pixel size of 0.25 kpc2. For velocity maps, we take the weighted average of the -component of the velocity vector (projecting into or out of the 2D plane defined by our grid) for particles selected about each pixel. A caveat to our kinematic measurements is that we will only trace the dominant kinematic component at a given spatial location, while information on multiple, co-located kinematic components is lost. This smoothing is, however, significantly larger than our softening length, thus we can be sure that our results will not change were we to run the same simulations at much higher spatial resolution.
Maps produced using this technique, including surface mass density and kinematics of different components, are shown in Sections 4.2 and 4.3. Although we do not suffer from the effects of noise and limits on our sensitivity to low surface mass density regions, these maps provide a useful qualitative comparison to observational data products such as those produced from IFS instruments and even radio interferometry.
3.2 Integrated Quantities
In this section we briefly describe a number of physical quantities measured in each of our simulations. These include the final half-mass radii and concentrations of each baryonic component, the percentage of gas consumed by star-formation, and the percentage change in angular momentum () for gas and primary galaxy stars. These values are summarised in the appendix in Table 3, and we describe below our methods for measuring these values.
First, half-mass radii and concentration index are measured. We measure the spherical radius defining spheres in which contain 50 and 90% of the total stellar mass giving and , respectively. The concentration index, , is then defined as the ratio of these values, /. This value is similar to the concentration index employed on observational data, which Nakamura et al. (2003) and Deng & Yu (2015) show that can be a useful tool in separating between early- and late-type galaxies. The typical value separating morphologies is = 2.85, with early-type galaxies being more concentrated and late-type galaxies being less concentrated. We present these values for gas, primary stars, companion stars, and newly formed stars. An illustration of this procedure for m2 and m4 is given in Figure 2.
The next integrated quantity is the percentage of the initial gas mass that is consumed by star formation. This quantity is measured by first subtracting the final gas mass from the initial gas mass, then dividing by the initial gas mass. This gives a decimal value that is then converted to a percentage.
Finally, we calculate the change in angular momentum about the primary galaxy of the gas component and the stars initially contained within the primary galaxy for each model. This is done by calculating the cross product of the radial and velocity vector of each particle in a given component, taking the mass weighted center and average velocity as the zero points of the system. This is then multiplied by the mass of the given particle, and each angular momentum vector is summed giving , and the final value is the magnitude of this vector. This process is performed at the beginning and end of the simulations and the percentage change is calculated in a similar manner to the percentage change in gas mass.
4 Results
4.1 Isolated Disk Galaxy Model
Before examining our minor merger simulations we first briefly explore the properties of our isolated model m1. This simulation begins as a featureless disk of gas and stars with a central bulge having a bulge mass fraction of 0.17. An edge-on view of the initial setup and a face-on view after 1.4 Gyr of evolution in isolation are shown in the top two panels of the first column of Figure 3. From the view of the final gas and stellar distributions, we find that this galaxy has developed a well defined spiral arm pattern meaning this simulation can be clearly classified as a late-type galaxy (LTGs). In this work, we consider the presence or absence of spiral arms to be the key factor separating LTGs and S0 galaxies. We also note that the final value (see Table 3) for the stellar component is < 2.85, consistent with this being a LTG.
Below the stellar and gas density maps we show the final kinematics maps of the old stars, new stars, and gas, which are found to share a very similar disk-like rotation. At large radii, the kinematics of the old stars exhibit a fairly random distribution, however this is simply due to the presence of a pressure supported bulge. The compact profile of this galaxy component has a broad, low density wing of stars resulting in a small fraction of bulge stars being found beyond the full extent of the disk, particularly in directions perpendicular to the disk distribution. As mentioned, these starts are initially non-rotating, thus in these regions where we primarily find bulge stars, kinematics are relatively random.
In our isolated model we have found a strong spiral structure and co-rotation among all components of our simulated galaxy. Thus, we can say with confidence that the absence of these features in our simulations of minor mergers are the result of the galaxy interraction rather than secular processes. It can be argued that the presence of a massive gas disk in our isolated model means that this is a somewhat unfair comparison to our initially gas-free primary galaxies, however previous works have shown that spiral arms can be formed in simulations of isolated, gas-free disk galaxies (e.g. Bekki et al., 2002).
4.2 Conditions for Producing Counter-Rotating Gas Disks in S0 Galaxies
In this Section we explore the effects of the relative spins and gas fractions of galaxies in our merger simulations on the gas versus stellar kinematics of the merger remnants. Specifically, we are interested in identifying the key initial conditions that result in a counter-rotating gas disk. For a quick reference, we provide in the second column of Table 2 a list of components that are counter rotating relative to stars originally in the primary galaxy for each model.
Before presenting our results, we must explicitly state the definition of counter rotation used in this work. We consider the primary baryonic component of these galaxies to be the stars initially belonging to the central galaxy as these stars make up a majority of the mass budget of our merger remnants. Thus we define a given component at “counter rotating” if it exhibits rotation in the opposite direction to those stars initially belonging to the primary galaxy. In IFS observations of merger remnants such as these, stars initially in the primary galaxy will represent the primary spectral component. In particular, for IFS analyses in which only a single stellar component is assumed, only the most massive kinematic component will be analysed. This is typically true of shallow observations, while observations with longer exposure times can reliably extract multiple stellar kinematic components. In star-forming galaxies, gas kinematics are also often straightforward to measure from the roughly Gaussian emission lines. Thus gas versus stellar counter-rotation is often the easiest to identify from an observational perspective.
4.2.1 Dependence on Initial Angular Momentum
Here we examine the stellar versus gas kinematics of four simulated mergers with =0.0, models m2-m5, beginning with very similar initial conditions. We fix the initial orbits, of both galaxies, , and rotational speed of both galaxies. The only difference in each simulation are the direction of the spin of each galaxy with respect to the spin of the orbit, either retrograde or prograde. Thus, each simulation may be distinguished by the relative spin of the companion and the primary galaxies, e.g. retrograde-prograde. For the remainder of this work, we will refer to the relative spins in a given simulation in this manner, giving first the spin of the companion followed by the primary (e.g. “RP” denotes a retrograde companion and a prograde primary). These scenarios are illustrated in the columns 2-5 of Figure 3 where we show from left to right models m2 (RR), m3 (PR), m4 (RP), and m5 (PP).
The first result of these four simulations is that mergers resulting in counter-rotating gaseous and stellar components require that the primary galaxy be rotating retrograde to the merger orbit. This is consistent with a number of previous works focusing on both dissipative and dissipationless major mergers (e.g. Kormendy, 1984; Balcells & Quinn, 1990; Hernquist & Barnes, 1991; Bendo & Barnes, 2000; Di Matteo et al., 2007). In regards to counter- versus co-rotation of accreted material, however, the spin of the companion galaxy has no effect. This is due to the fact that the companion galaxy is completely destroyed in the merger and its gas and stellar content is redistributed in the disk of the primary galaxy. In this way the initial internal kinematics of the companion galaxy are lost and the orbital direction of the accreted material is inhereted by the orbital direction of the merger.
Although the spin of the companion galaxy does not seem to affect the spin of the gas and new stars of the merger remnant, it does have a clear effect on the radial extent of the accreted gas. For = 0 mergers in which the rotation of the companion galaxy is retrograde, RR (m2) and RP (m4), the gas content of the merger remnant appears in Figure 3 to be less extended than for our PR (m3) and PP (m5) mergers. This agrees with the values in Table 3 with m2 and m4 having values of 3.1 and 10.4 kpc, compared to 13.1 and 21.6 kpc for models m3 and m5. Furthermore, the concentration indices of m2 and m4 are 47% larger than m3 and m5, meaning the former two have significantly more compact gas distributions. The relative spin of the primary galaxy has a the same effect on the gas extent, however the effect is not as large. For example, of our RP merger is 3.4 larger than for our RR, and gas in our PR merger is 4.2 more extended than in our RR remnant. Therefor we find that the merger remnant among m2-m5 with the smallest gas disk is our RR merger while the merger with the largest gas disk is PP. We discuss further the varying morphologies of each component in Section 4.3.
4.2.2 Dependence on Central Gas Mass
Next we explore how the properties of the merger remnant depend on the gas content of the primary galaxy. In this Section we take our =0, RR merger, model m2, from Section 4.2.1 as our base model and run an additional three simulations with increasing each time. We perform mergers with primary gas fractions of 0.01, 0.05, and 0.10, which correspond to 0.2 (m6), 1.0 (m7), and 2.0 (m8) times the total gas mass of the companion galaxy. In each simulation the gas in the primary galaxy is arranged in an exponential disk with a scale radius and scale height matched to that of the stellar disc component of the primary galaxy. The initial and final gas/stellar distributions and final kinematics are shown in columns 6-8 of Figure 3.
The main effect of adding gas to the primary galaxy is that gas accreted from the companion during a retrograde merger collides with gas in the primary. In all four simulations the gas is accreted in such a way that its bulk motion is opposite to the direction of rotation of the primary disk. Thus, the rotation of the accreted gas, which follows the orbital angular momentum of the companion’s orbit, will be decreased relative to the gas free case. This can be seen Figure 3, comparing to bottom rows of columns 2 and 6 showing the final gas kinematics. The base =0 model, m2, shows clear gas-stars counter rotation with a complex gas velocity field. The same is true of m6 with =0.01, however the irregularities in the gas velocity have been smoothed out. Our two models in which the primary galaxy begins with the same or more gas than the companion, m7 and m8, have co-rotating gas and primary stars in their merger remnants. In general, accreted gas is swept up by any preexisting gas in the primary galaxy. The larger the gas mass initially in the primary, the easier it is for accreted gas to change its orbital direction.
We also find that both the gas and primary stars of merger remnants with non-zero are more extended than in the =0 case. Increasing results in an increase of , with models m6, m7, and m8 having = 6.1, 7.6, and 10.6 compared to 3.1 for m2. Adding even a small amount of gas to the primary galaxy is found to also significantly reduce , however, beyond this initial drop, adding more gas does not seem to further decrease this value. Models m6-m8 all have similar values at compared to =2.2 found for m2. We will discuss further the relative morphologies of different components of each model further in Section 4.3.
Considering the kinematics of stars initially belonging to the companion galaxy, row 5 of Figure 3, we find that including gas in the primary galaxy has little to no effect. There is no appreciable difference between models m6-m8, which are also quite similar to those of m2, the =0 case. This is because stars merge without dissipation and thus retain the motion of the companion’s orbit about the primary galaxy. The kinematics of the new stars shown in row 4 of Figure 3, on the other hand, are somewhat more complex. In the central regions we find that newly formed stars are co-rotating with the primary galaxy stars. This is even true for model m6, although the co-rotating region is extremely small with a radius of 3.5 kpc. This co-rotating region increases in size with increasing . Beyond this inner co-rotating region, the new stars are found to counter rotate. The reason for this complex behavior is that stars in the inner region form from gas that is either initially belonging to the co-rotating gas disk of the primary or from accreted gas that has reached smaller radii and is thus more likely to have been swept up by the preexisting gas. Counter rotating new stars at large radii formed from gas initially in the companion galaxy before this gas has been swept up by the gas of the primary. Thus, these new stars retain the counter-rotating orbits by merging dissaptionlessly.
Finally, we also explore the effect of the initial gas content of the primary galaxy in a PR merger. This was shown in the previous section to be the only other configuration resulting in counter-rotating gas for models with gas free primary galaxies (m3). We show the final stellar and gas velocity maps for PR mergers with and without initial gas in the primary galaxy in column 3 of Figure 3 and column 1 of Figure 4, respectively. The overall spatial distributions of gas and stars, as well as the stellar kinematics, in the two models are quite similar, however there is a clear difference in the gas kinematics. In m9 we find that in the central region gas and stars are co-rotating while gas accreted at larger radii is counter-rotating as in m6. This is in contrast to nonzero models with RR orbits, m6-m8 discussed above, which exhibit smooth velocity maps with no kinematic flips. As we noted in the previous section, mergers with a prograde satellite rotation result in a larger final gas disk. In the case of m6-m8 all the accreted gas falls to small radii and is swept up by the initial gas content of the primary galaxy, while in m9 gas rapidly stripped from the companion collects at radii beyond the central gas disk and is thus able to retain the counter-rotating kinematics inherited from the orbit of the merger.
4.2.3 The Effect of Orbit, Bulge Mass, and
Next we briefly investigate the effect of the orbital distance and eccentricity, primary bulge mass, and on the final distribution and kinematics of gas and stars in our merger simulations. We show the initial setup, the near face-on view of the final merger remnant, and the final near face-on stellar and gas kinematics of these models in the columns 2-8 of Figure 4.
Considering merger orbit, we present two RR simulations that both have orbits with initial and pericenter separations between the two galaxies twice that of our previous models. These models are m10 and m11 in Table 1, and the gas fractions of the primary galaxies are 0 and 0.01 respectively. We also produce a PP merger with an initial separation 2 larger than in previous sections and with = 0.05, m12. Finally, we present model m13, which has an orbital eccentricity of 1.0, a parabolic orbit, requiring a significantly larger initial separation to achieve the same pericentre distance as our other models.
For models m10 and m11, the resulting merger remnants are quite similar to m2, exhibiting counter-rotating gas in the central regions. In contrast to m2, however, both models have a more prominent ring structure and long tidal streams of gas with a slightly different orbital plane. These tidal streams appear to have inherited their orbits from the initial orbit of the incoming companion galaxy, and in the final kinematic maps their rotation is offset by 10-30*∘*. This is consistent with the inclination of the orbit we input as initial conditions. As with previous simulations, the kinematics of new stars tend to follow those of the gas, and the kinematics of stars initially in the companion are largely unaffected appearing quite similar to models m2-m8. Model m12, our PP merger, has resulting gas/stellar distributions and kinematics that are extremely similar to the =0, PP merger, m5. Both m5 and m12 are among the models with the largest at 21.6 and 16.9 kpc, respectively. The radial distribution of the gas is similar as well, with values found to be 1.50 and 1.68. Furthermore, all components in these models are found to be co-rotating with fairly regular velocity maps. This suggests that PP mergers may be among the most difficult to identify based on the kinematics of their remnant galaxies.
In contrast to all models discussed to this point, model m13 (shown in column 5 of Figure 4, which has a parabolic merger orbit, exhibits chaotic kinematics in the accreted stars and gas. The final distribution of gas has a centrally concentrated region surrounded by a handful of long streams that roughly mirror the distributions of accreted stars. These streams exhibit distinct kinematics that are apparent in the kinematics maps of the new stars and companion stars. Relative to these two kinematic maps, the kinematics of the accreted gas is fairly regular, particularly in the central regions where it counter rotates relative to the primary stars (which have relatively regular rotation). From an observational perspective, this galaxy would likely be identified as having gas versus stellar counter rotation, thus this suggests a parabolic orbit will not affect the emergence of counter rotation. We note, however that the random motions of the accreted stellar components could complicate their identification in a spectral decomposition of the stellar continuum.
We also test the effect of significantly increasing the bulge mass of the primary galaxy in m14, thus testing the effect of a PR wet, minor merger with an elliptical galaxy. This is also depicted in Figure 4 in the 6 column. The strong gravitational potential of the massive bulge results in much more efficient stripping of gas and stars from the incoming companion galaxy. Thus, the merger remnant of m17 is among the most extended gas disks in our our simulations with =21.1 kpc. While the final kinematics of this model are quite complex, in the central regions, where IFS observations are typically focused, the gas is predominantly counter-rotating. In the inner-most 2 kpc we find a region of co-rotating gas, however this gas is the remnant of the initial gas disk included in the primary galaxy in this model. As in previous models, m6-m8, tidal interactions cause this initial gas disk to collapse inward and be rapidly depleted through star formation. Beyond the inner regions of the galaxy, the gas exhibits a kinematic twist that manifests as a spiral pattern in the velocity map. This is also reflected in the outer stellar kinematics, which will again be dominated by newly formed stars similar to models m10 and m11. Similar to previous models, these stellar motions will be difficult to detect, but the kinematic twist seen in the gas content could possibly be detected using radio interferometry for very nearby galaxies.
Finally, we test the effects of lowering on the resulting properties of our merger simulations. In simulations discussed thus far we have employed = 5.0. Although low mass galaxies with gas fractions this large have been observed, they represent the most gas rich dwarf systems at low redshift (Huang et al., 2012). As such, wet, minor mergers with companion galaxies of lower are more common. We have performed two additional RR, minor merger simulations, m15 and m16, with orbits matched to m2 and = 1.0 and 0.5, respectively. These are shown in columns 7 and 8 of Figure 4. Overall the resulting merger remnants are quite similar to that of m2, featuring counter-rotating gas and companion/new stars. The radial extent of the gas for all three models is comparable with m2, m15, and m16 having = 3.1, 5.4, and 6.4 respectively. Models m15 and m16, however, have lower than m2 (1.4 vs 2.2). It is not clear, though, if this is due to the change in , or a result of a truncation of the gas disks of m15 and m16 due to the combination of our mass resolution and the low space density of gas at large radii in these models. Using a larger value of allows us to better map the final distribution of gas, particularly at large radii, and should not have a major effect on our main conclusions regarding the emergence of counter-rotation.
4.3 Merger Remnant Morphologies
In all of our simulations, the merging process results in a S0 merger remnant, i.e. a disk galaxy devoid of spiral arms. This is in contrast to many previous works on simulations of counter-rotating gas and stellar components in merger remnants focusing on major mergers as these simulations typically result in elliptical morphologies (e.g. Di Matteo et al., 2007; Jesseit et al., 2007). In this sense, the mergers presented here provide an important step forward in understanding the formation mechanism for the 20-40% of S0 galaxies found to host counter-rotating components (Pizzella et al., 2004; Davis et al., 2011).
We note that in some models the images of the final morphologies shown in the second rows of Figures 3 and 4 appear as late types, models m12 and m14 in particular. This appearance is driven by the gas distributions at large radii, rather than stars. To show this we create simulated SDSS r-band images of model m17 placed at a redshift of 0.05. First an artificial datacube was created using the simple stellar population spectral models from the PÉGASE-HR library (Le Borgne et al., 2004), created from observations of Milky Way stars. In each spaxel of our simulated cubes we determine the age of each star particle based on their time of birth and the time elapsed in the simulation. Star particles present at the beginning of the simulation are initiated with an age of 1 Gyr. We then create a mass weighted spectrum in each spaxel where each star particle contributes a component taken as the PÉGASE-HR model with an age closest to that of the particle. We next blur the image using a Gaussian kernel with a full-width half max of 3.61 pixels, corresponding to the average seeing of the SDSS survey. Finally, we apply the SDSS r-band filter to this cube and add Gaussian noise at a level that produces a simulated image typical of SDSS observations at .
Face-on and edge-on simulated r-band images for model m17 are shown in Figure 6. This shows that the spiral arms apparent in Figure 4 are not present in the stellar distribution, which has a lenticular appearance. The gas component of these galaxies at large radii is almost entirely HI, thus star-forming regions will not be present. This means that even for photometry at shorter wavelengths, e.g. the u-band, will not provide imaging of the gas.
In a majority of our merger simulations, the concentration index of the primary stars in our remnant, , is larger than 2.85. The value of = 2.85 is found by Nakamura et al. (2003) and Deng & Yu (2015) to reliably separate visually-classified LTGs ( < 2.85) and ETGs ( > 2.85). The concentration of new stars, , also tends to be quite high in most cases as a majority of stars are formed in the inner most regions of the primary galaxy. These new stars are extremely bright relative to older stellar populations and will thus contribute to increasing the overall of the full stellar distribution. We note, however that in no model is or larger than 2.85, meaning that these accreted components are preferentially arranged in a disk structure. Thus, from a quantitative point of view, merger remnants with < 2.85 may remain as LTGs rather than transforming into S0’s. From our simple prescription in which an S0 is identified as such based on the lack of spiral arms, however, all galaxy mergers result in S0 remnants as shown by the second rows of Figure 3 and 4.
Next we examine in detail the spatial distribution of the various components of the gas in our simulated merger remnants. We show in the rows of Figures 5 and 7 the face on views of the surface density, , of, from top to bottom, HI, H2, mass of dust, mass of metals, and stars tagged as initially belonging to the disk component of the primary galaxy. We observe both inner and outer rings in our simulations, and our large range of initial conditions allow us to discuss the likely formation mechanism for these structures. The occurance of rings in each of our models is summarised in Table 2 for reference. Inner rings have typical sizes comparable to inner galaxy structures such as bars while outer rings are two or more times larger (Athanassoula et al., 2009). In this work we employ a fixed radial cut of 10 kpc to separate inner and outer rings, i.e. rings with radii < 10 kpc are inner rings and those with radii > 10 kpc are outer rings. In our isolated fiducial model, no bar emerges through secular processes. Thus, we can say with confidence that bars evident in our merger simulations are indeed induced by the merging process rather than internal/secular evolution.
First we examine the formation of inner rings, which occur in eleven out of sixteen simulations presented in Figures 3 and 4; m2, m3, m4, m6, m8, m10, m11, m12, m13, m14, m15, and m16. This includes simulations in which the primary galaxy initially contains no gas as well simulations in which the primary galaxy contains gas. Comparing the morphologies of the gas and stars in our merger remnants, it appears that the occurrence of inner rings in mergers with is related to the generation of a bar in the disk component of the primary galaxy, as seen in the bottom row of Figures 5 and 7. This bar formation is due to tidal torques on the disk stars during the merging process and the inner gas rings in these simulations form at radii consistent with the lengths of the stellar bars. Inner rings appear to always contain HI
We also find that including large amounts of gas in the primary galaxy suppresses merger induced bar formation, and thus the emergence of an inner gas ring at the outer edge of the bar. The apparent ring structures in models m6, m8, m12, and m14 which initially contain gas in the primary galaxy, are significantly more compact than those seen in m2, m3, and m4. This may suggest that the ring-like appearance in these simulations emerges due to the rapid depletion of gas in the inner-most regions rather than bar driven resonances.
Outer gas rings are only prominent in four out of sixteen of these simulations, always occurring in those simulations in which the rotation of the companion galaxy is prograde relative to its orbit about the primary (RP and PP mergers). As we noted in Section 4.2.1, the gas initially in the companions in these mergers is more efficiently stripped resulting in a much more extended gas distribution when compared with mergers with retrograde companion rotation. One difference between our RP and PP mergers is that we find a merger induced bar in the RP mergers, which is responsible for the generation of an inner ring in addition the the outer ring (m3 and m9). In the PP case, we find neither a bar nor an inner ring. We do find gas well beyond the outer ring, however, whereas in our RP mergers the gas is rapidly truncated beyond the outer ring. This may be the result of angular momentum and material being transported inwards due to the influence of the central bar. The gas in m3 loses 47.9% of its angular momentum while for m5 this value is only 12.3% in agreement with this assessment (see Table 3). A similar comparison between m9 and m14, however, is complicated by a 10 difference in .
The size of the outer ring in all cases is roughly the same, and this may be related to the orbit of the companion galaxy, which does not change between these simulations. Further simulations with a larger variation in orbital parameters will be required to test this. Finally, we note that all of the outer rings observed in our simulations are almost entirely devoid of H2. Thus, these regions will have a large hydrogen mass with relatively low levels of star-formation, and should therefore represent outliers from the kennicutt-schmidt relation (Schmidt, 1959; Kennicutt, 1998).
Although we do not observe spiral arms in any of our merger remnants, we do observe arm-like tidal streams in three of our simulations. Specifically these are models m4, m5, and m12, which are also those three simulations with a prograde primary galaxy. Furthermore, these are also the only three galaxies that exhibit no counter-rotating components in their merger remnants. Although observed low surface brightness features such as these often requires long exposure times, these may be useful in identifying merger remnants with prograde primary galaxies that will not display clear kinematic signatures.
Before leaving the subject of merger remnant morphologies we also highlight another peculiarity that emerges in models m2 and m3. These models are both performed with retrograde primary galaxies and = 0, resulting in the two strongest stellar bars among all of our models (see the bottom row of Figure 5). We find that these models also exhibit bars in their distributions of gas, dust, and metals, and this bar is significantly shorter and perpendicular to the stellar bar. These so-called “nested” bars were originally proposed as a mechanism for fueling active galactic nuclei by Shlosman et al. (1989) and have subsequently been observed in around 1/3 of barred galaxies (e.g. Wozniak et al., 1995; Erwin, 2002, 2004, among others). Works on simulations of nested bars are on-going with some groups manually creating these structures to explore their influence on the host galaxy evolution (Namekata et al., 2009, e.g.) or, notably, Wozniak (2015) who demonstrate the emergence of nested bar formation in an isolated disk galaxy. Our simulation is unique as this serendipitous discovery of a nested bar that appears to be induced by a galaxy merger. The topic of merger induced nested bars will be the topic of future research, and we simply make note of it here.
4.4 Other Galaxy Properties
Here we present the evolution of star-formation and dust scaling relations of our merger simulations. While not directly related to the emergence of counter-rotation in S0 galaxies, these provide signatures that can be reliably compared with current observations.
4.4.1 Star-Formation
The time evolution of SFR and H2 fraction () is shown for m2-m8 in Figure 8. The top row shows the evolution of SFR and the bottom row shows the evolution of H2 fraction. The horizontal dashed line in the top row indicates the SFR of the star-forming main sequence at the mass of our merger simulations (following the prescription of Whitaker et al., 2012).
First we focus on our models with = 0 presented, shown in the left column of Figure 8. We find that all four mergers peak in their SFR around 2 Gyr, which corresponds to the final coalescence of our mergers, and this peak is roughly consistent with the SFR expected for main-sequence galaxies of this mass. Beyond 2 Gyr, the SFR gradually tapers off in most cases, however m5, our PP merger, experiences a rapid truncation in SFR at around 3.5 Gyr. The H2 fractions of our models gradually increase to 2 Gyr then, in all cases other than m5, the H2 fraction levels off for the remainder of these simulations. This suggests a coevolution of HI and H2 in these mergers where the H2 consumed by star formation is continuously replenished by the HI reservoir.
Model m5, on the other hand, was found to exhibit a much larger spatial distribution of gas due to more efficient stripping during the merger as a consequence of the PP configuration. Indeed, Table 2 shows that for m5 is 21.1 kpc, significantly larger than the values of 2.1, 13.1, and 10.4 found for m2, m3, and m4. Gas at large radii remains stable due to a rapid rotation, preventing the HI from collapsing to form H2. The rapid truncation of SFR seen at 3.5 Gyr is the result of the depletion of the inner H2 reservoir, which is no longer replinished from the large HI disk. This is also reflected in the significantly lower H2 fraction seen in this galaxy beyond 2 Gyr.
In the right column of Figure 8 we show the time evolution of SFR and H2 fraction for our series of RR mergers with increasing primary gas fraction, m6-m8. Here, model m2 is plotted again as a reference. In the case where gas is included in the primary galaxy we find an earlier peak in the SFR that can be slightly above the average SFR of the main sequence. This occurs because the initial gas disk in the primary galaxy experiences a tidal torque due to the incoming companion that causes it to collapse inward. This compaction of the gas causes an increase in the H2 fraction, and as a result the initial gas in the primary galaxy is rapidly converted into stars. In the case of m6, there is significantly less initial gas in the primary and thus the SFR peak is lower than models m7 and m8. In models m7 and m8, however we see a rapid truncation of the SFR reminiscent of that seen in our PP merger, m5. Similar to m5, m7 and m8 result in co-rotating remnants that have a significantly larger final gas disk. Thus, the truncation of SFR can again be attributed to stable HI gas at large radii. This is again reflected in the lower H2 fraction when compared with models m2 and m6. Unlike m5 however, m7 and m8 eventually increase their SFR again to roughly match the level seen in m2 and m6 at the end of our simulations. The presence of remaining gas from the primary galaxy provides a mechanism for angular momentum transfer, allowing accreted gas to continue to move inwards and form stars.
SFR and H2 fraction evolution for models m9-m16 are also shown in Figure 9. The same overall trends observed in models m2-m8 are also at play here. In general, models in which gas is found to be trapped at large radii, whether in a disk (e.g. m12 and m14) or in tidal streams (e.g. m10 and m11) exhibit a suppression of both SFR and H2 fraction compared to m2 at late times. Again this is due to the fact that gas at large radii is stable and prevented from converting from HI to H2. Also similar to m2-m8, models in Figure 9 that begin with a large value of (e.g. m9 and m12) are found to have an early peak in SFR related to the rapid depletion of gas from the primary galaxy. We include Figure 9 for completion, however, as star formation is not the focus of this work we leave in depth analysis for future work.
4.4.2 Dust Mass Relations
Finally, we explore the dust mass, , scaling relations of our minor-merger remnants. Relations between and quantities such as SFR and have been explored by a number of authors. In particular, works such as Dariush et al. (2016) and Bassett et al. (2017) use samples of massive visually classified ETGs known to contain dust based on detection at infrared wavelengths. Galaxies from Bassett et al. (2017) are further classified as being largely dispersion supported (“dispersion dominated galaxies”, DDGs) based on IFS observations from the SAMI Galaxy Survey (Bryant et al., 2015). The presence of dust in these systems is peculiar as these galaxies are likely to host a hot, X-ray emitting halo that is inhospitable to long lived dust grains (Draine & Salpeter, 1979, e.g.). Galaxies from Dariush et al. (2016) and Bassett et al. (2017) are found to be outliers in vs SFR and vs , which is taken as evidence that their dust content was recently accreted through mergers. As we have described, our models carefully track the evolution of allowing us to test the connection between the -SFR and - relation and minor-merger activity.
We show in Figure 10 the relationship between and SFR for our minor-merger simulations in comparison with observations. The relationship for “normal” star-forming galaxies from the Sloan Digital Sky Survey (SDSS) taken from da Cunha et al. (2010) are shown as small orange circles, and a linear fit to this data is indicated by the black dashed line. Dusty elliptical galaxies from Dariush et al. (2016) and DDGs from Bassett et al. (2017) are shown as red triangles and red circles, respectively. We show the values for our merger simulations using green circles at two different time steps. Smaller circles show the position at the halfway point of our simulations, slightly after final coalescence, and the larger circles show the final positions.
Both our simulated galaxies and dusty ETGs of Dariush et al. (2016) and Bassett et al. (2017) exhibit significantly lower SFRs at a fixed when compared to the bulk of star-forming galaxies from SDSS. We also find that the SFR of our simulations is typically higher at the halfway point, which should be expected given the declining star-formation histories of our models shown in Figures 8 and 9. It can be seen that a non-negligible number of star-forming SDSS galaxies also occupy the low SFR region below the dashed line however, which suggests that mergers are not the only mechanism that can cause galaxies to fall below the bulk relation. The fact that all of our simulated data points fall below this relation is intriguing though, and observations of vs SFR can provide an indication of merging activity, however further observations will be required to confirm this. Indeed, IFS observations of the four galaxies from Bassett et al. (2017) show these galaxies to have kinematic signatures of mergers such as offsets between the kinematic position angles of gas and stars (e.g. Davis et al., 2013, Bryant et al. in prep).
We also show in Figure 11 the - relationship of our simulations. We again plot our values over those for ETGs from Dariush et al. (2016) and Bassett et al. (2017). These points are now compared with galaxies from the Herschel Reference Survey (HRS Boselli et al., 2010; Cortese et al., 2012b), which is an infrared survey of very nearby galaxies representing a large range in galaxy type and environments. The proximity of this sample provides a high confidence in visual morphological classifications as well as allowing for measurements of to very low masses. LTGs and ETGs from HRS are shown in Figure 11 as blue and orange pentagons, respectively.
Similar to Figure 10, our simulated galaxies are found to occupy a similar region to dusty ETGs of Dariush et al. (2016) and Bassett et al. (2017), following a roughly horizontal sequence around 1011 M*⊙*. This sequence appears to extend HRS ETGs to higher while HRS LTGs, on the other hand, are found to follow a sequence of increasing with increasing (albeit with relatively large scatter compared to -SFR). A relationship between and is a common feature of star-forming galaxy samples (Cortese et al., 2012a, e.g.) attributed to the fact that dust is produced by evolved stars, thus more stars will lead to more dust. The lack of correlation seen by Dariush et al. (2016) and Bassett et al. (2017) dusty ETGs is possible further evidence for a merger driven origin for their dust content. In such a scenario, the amount of dust in these galaxies appears will be dictated by the dust content of the companion galaxy rather than the stellar mass of the primary. Our simulated values agree well with this hypothesis as we find nearly an order of magnitude variation in in an extremely narrow range of .
5 Discussion
5.1 The Emergence of Counter-Rotation
A number of previous works have investigated the emergence of gas-versus-stellar counter-rotation in galaxy merger simulations. The general result of these simulations is that the primary galaxy must rotate in the opposite direction of the merger orbit, i.e. a retrograde merger (Kormendy, 1984; Balcells & Quinn, 1990; Hernquist & Barnes, 1991; Bendo & Barnes, 2000; Di Matteo et al., 2007). This has also been shown by Thakar et al. (1997) for gas-free, sticky-particle, N-body simulations of minor mergers. In this paper we have found a similar result using state-of-the-art SPH simulations including realistic stellar and gas physics, as well as tracking the production (and destruction) of new stars, dust, and metals.
In addition to confirming the necessity of a retrograde orbit in producing a counter-rotating gas disk, we have also explored the effects of including significant amounts of gas in the primary galaxy. In such a merger, the accreted gas collides with the gas initially in the primary galaxy, which can have a significant impact on the final gas kinematics. We compare this with the results of Lovelace & Chou (1996), who performed simulations with smooth, filamentary accretion of gas onto a gas-rich primary galaxy. Similar to Thakar et al. (1997), smooth accretion such as this onto a gas free primary galaxy will also result in a counter-rotating gas disk. By gradually adding gas to the central galaxy, Lovelace & Chou (1996) found that once the gas content of the primary was equal to the mass of gas accreted, the final gas disk will co-rotate with the stellar component. For the first time, we have shown that this is also true for the discrete accretion of a single, gas-rich companion galaxy. This observation may influence the discrepancy between the fraction of S0 galaxies exhibiting gas vs stellar counter-rotation (20-40% Bertola et al., 1992; Kuijken et al., 1996; Pizzella et al., 2004; Davis et al., 2011) and the fraction seen in later types (< 8% for Sa-Sbc galaxies Kannappan & Fabricant, 2001). Galaxies with Sa and later morphologies are far more likely to contain large amounts of gas, thus minor mergers, even with extremely gas rich companions, will have little, if any, effect on the observed kinematics post-merger.
It should also be noted, however, that S0 galaxies and LTGs have typically experienced significantly different formation histories. The well established morphology density relation (Dressler, 1980) shows that S0 galaxies are more common in higher density, group environments than LTGs, where minor mergers are more common (e.g. Wilman et al., 2009). This means that LTGs have experienced fewer mergers, on average, and their gas content inhibits the emergence of counter-rotating components as we have shown. Thus, the morphology density relation provides an additional reason for the large discrepancy between the fractions of S0 and LTGs exhibiting counter-rotating gas.
From an observational point of view, studies of gas-versus-stellar counter-rotation in galaxies is becoming more commonplace due to the proliferation of integral field spectroscopy (e.g. Davis et al., 2013; Jin et al., 2016). These studies identify not only those galaxies with gas and stellar kinematic misalignemts of 180*∘, those hosting counter-rotating gas disks, but also galaxies with misalignments between 0∘* and 180*∘. The gas content of these galaxies, which is most likely externally accreted, is expected to relax into either co- or counter-rotation with the stellar content of the primary galaxy within 5.0 dynamical times (Davis & Bureau, 2016). In this framework, the distribution of kinematic misalignment angles should be strongly peaked around 0∘* (this peak includes all normal/non-disturbed galaxies), relatively flat between 0*∘* and 180*∘, and weakly peaked at 180∘*. This is roughly the result observed for ATLAS galaxies by Davis et al. (2013).
Davis & Bureau (2016) attempt to match the distribution in kinematic offsets found by Davis et al. (2013) using a simple toy model. Without significantly increasing the relaxation time above 5.0 dynamical times, they typically find the peak at 180*∘* is much larger than the observed distribution. We have shown here that in cases where massive ETGs contain gas prior to an accretion even, the emergence of a counter-rotating gas disk is suppressed, an effect not accounted for in the work of Davis & Bureau (2016). Recently it has been shown that 10-40% of ETGs contain significant amounts of molecular gas (though the exact percentage may depend on environment Combes et al., 2007; Serra et al., 2012) Properly accounting for this could suppress the number of counter-rotating gas disks to match observations without invoking long gas relaxation times.
We note that ATLAS galaxies are, on average, of an earlier morphological type than galaxies simulated in this work. It is reasonable to suggest this may limit the appropriateness of a comparison between our study and the works of Davis et al. (2013) and Davis & Bureau (2016). First we point out that the ATLAS sample includes a large number of S0 galaxies at a broad range of stellar masses, comparable to simulated galaxies studied here. We have also shown in model m14 that increasing the bulge fraction of the primary galaxy alters the efficiency of gas stripping of the companion, but does not change the general result regarding co- versus counter-rotating gas disks. Thus, given the simplicity of the model presented in Davis & Bureau (2016), for a large number of ATLAS galaxies (at lower masses in particular) we consider this comparison to be apropos. More generally, we expect our results regarding the dependence of the emergence of counter-rotating gas disks on merger orbits and primary gas fraction to hold for all ETGs in a comparable mass range.
Another interesting aspect of retrograde mergers in which the primary galaxy initially contains significant amounts of gas is that, while the gas is found to co-rotate with the bulk of the stars, we also identify clear cases of stellar-versus-stellar counter-rotation. This is shown in Figure 3 for model m8 where we find stars initially belonging to the accreted companion galaxy end up in counter-rotating orbits relative to those stars initially belonging to the primary galaxy. Similar types of orbital segregation has previously been shown in major merger simulations by Balcells & González (1998) and Di Matteo et al. (2007). The reason for this behavior is the collisionless nature of star-particles, which is in stark contrast to the behavior of the accreted gas. We also find that the newly formed stars have the most complex kinematic structure, but this is due to the fact that these stars form from two, initially distinct, gas reservoirs. Mergers such as this could explain examples of galaxies with stellar-versus-stellar counter-rotation from observations such as the S0 galaxy NGC 1366 (Morelli et al., 2008, 2017).
Identifying galaxies with stellar-stellar counter-rotation such as these at higher redshift will be significantly more difficult, particularly using observations from modern IFS surveys such as SAMI. This is due to the fact that the spectral signature of accreted stars will have a much lower flux density than the stars of the primary galaxy. A possible alternative method to determine of S0 galaxies have counter-rotating stellar populations would be to observe individual globular clusters in nearby S0s, using techniques demonstrated by the SLUGGs Survey (Pota et al., 2013). Multiple kinematic populations of globular clusters could be evidence of galaxies hosting both globular cluster systems formed in-situ and a population of accreted globular clusters.
5.2 Gas Rings and Bar Formation
Apparent in a number of our minor merger simulations is the emergence of gas rings. Rings in the inner regions are quite common in disk galaxies and can often be associated with resonances and/or bars (Binney & Tremaine, 1987; Buta et al., 1996). Although bars have been found to form through instabilities in simulations of isolated disk galaxies (e.g. Berrier & Sellwood, 2016; Polyachenko et al., 2016, and references therein), in our isolated disk test-case we did not observe spontaneous bar formation. This gives us confidence that bars emerging in our simulations are primarily the result of galaxy-galaxy interaction. Bar formation through galaxy interactions has long been suspected, for example Thompson (1981) showed that a large fraction of galaxies in the centre of the coma cluster exhibit bars. Recent works studying simulations of galaxy interactions, flybys in particular, have shown that tidal forces can indeed induce bar formation, even in cases where a secular bar would not normally appear (Lang et al., 2014; Martinez-Valpuesta et al., 2016). In our simulations, inner-rings (with radii < 10 kpc) appear to emerge primarily in cases where a bar has also formed, suggesting that these two structures are closely related.
Outer rings in galaxies (with radii > 10 kpc), on the other hand, are difficult to connect with secular evolutionary processes in galaxies and are often attributed to external accretion of gas (e.g. minor mergers Marino et al., 2009; Mapelli, 2015; Gereb et al., 2016). We find outer rings in a number of our simulations including models m3, m5, m9, m12, and m14 (see Figures 3 and 4). The key similarity between these three simulations is that the companion galaxy in each case experiences more efficient tidal stripping of gas during infall. In all three cases this is due to the prograde rotation of the satellite relative to the merger orbit. This has been known to enhance tidal stripping since the very early simulations of Toomre & Toomre (1972). For model m14, this process is further enhanced by the presence of a massive bulge in the central galaxy, which produces a deep and extended gravitational potential well.
A number of authors have explored the incidence of ring structures in S0 galaxies finding, in general, these to be quite frequent, occurring in 25-90% of galaxies (depending on sample selection and wavelength targeted). Observations have focused on indicators of star formation such as UV (Salim et al., 2012) or H emission (Pogge & Eskridge, 1993) indirectly related to H2 regions, HI (e.g. Oosterloo et al., 2007), and even stellar light (Laurikainen et al., 2013). There are, though, relatively few observational examples of directly observed molecular gas rings such as that of NGC 4477 shown in Crocker et al. (2011). This is partly due to technological limitations, however our simulations suggest that a majority of H2 rings formed through mergers are compact, inner rings reducing our ability to identify them in observations. This means that current facilities will be able to resolve molecular gas rings only in the most nearby S0 galaxies. Newer interferometric facilities such as ALMA are thus the most likely to observe molecular gas rings in galaxies in the near future.
6 Conclusions
In this paper we have presented the morphologies and kinematics of a series of minor merger remnants between two disk galaxies. These mergers result in S0 remnants with a variety of kinematic signatures including both co- and counter-rotation in accreted gas and stars as well as kinematically decoupled cores and kinematic twists, which we have presented using 2D projected maps. These maps share many similarities with IFS data products, and, although we do not suffer from noise and surface brightness limitations, they provide a useful comparison to maps of galaxies from modern IFS surveys. The relatively large number of simulations presented here has allowed us to perform a systematic study of the initial conditions responsible for the various kinematic signatures, and we summarise our main results as follows:
- •
The key factor necessary for producing counter-rotating gas and stellar populations in a given merger remnant is that the orbit of the merger must be retrograde with respect to the primary galaxy. Thus, accreted material is brought in counter to the rotational direction of the stellar content of the primary galaxy.
- •
The relative spin of the companion does not affect the above result, however it does affect the final spatial distribution of gas. Encounters with prograde companion galaxy rotation result in more extended gas distributions than retrograde due to more efficient tidal stripping.
- •
If the primary galaxy contains as much or more gas than the companion, the accreted gas is swept up by the gas of the primary resulting in co-rotating gas and primary stars in the remnant. In this case, however, stars accreted from the companion remain counter-rotating due to their collisionless nature. This observation can help to explain the difference in the fraction of counter-rotating S0 galaxies (20-40%) when compared to LTGs (< 8%).
From a practical standpoint, these conclusions show that, although gas versus stellar counter-rotation is the easiest to observe, the lack of such a signature does not immediately rule out recent, wet, minor mergers. Examples of galaxies with co-rotating gas and stars may host a secondary, counter-rotating stellar component. Such a component may be difficult to identify in some observations, however, but we propose the observation of counter-rotating planetary nebulae systems and globular cluster systems in S0 galaxies (the latter would be similar to observations performed by the SLUGGS survey team Pota et al., 2013) may provide evidence of these systems. Finally, we also find three examples of prograde mergers with no counter-rotating components that will be the hardest merger remnants to identify. These three models do exhibit clear stellar, tidal streams at large radii, which may be used to identify them as merger remnants, although observing these will typically require extremely long exposure times.
In addition to these major conclusions, we observe a number of other intriguing features in our galaxy merger simulations.
- •
We find merger induced bars in a number of our simulations, in particular, retrograde mergers with gas free primary’s (m2 and m3) exhibit the strongest bars (as well as secondary, nested bars). Including gas in the primary galaxy tends to suppress bar formation.
- •
We also find inner and outer rings in some simulations. Inner rings appear to be connected to bar driven resonances while outer rings are associated with tidally stripped gas that collects at large radii.
- •
Simulations in which remnants have large gas disks (m5 in particular) have a corresponding large angular momentum that seems to prevent HI from converting into H2. This is associated with a significantly suppressed SFR and H2 mass fraction.
- •
We compare the -SFR and - distributions of our simulated galaxies to observed samples of “normal” star-forming galaxies as well as massive ETGs containing dust. Our results support the connection between the dust content of these galaxies and merger activity proposed by Dariush et al. (2016) and Bassett et al. (2017).
We note that our suite of simulations still represents only a small portion of the possible parameter space for minor galaxy mergers. Parameters that have not varied here include mass ratio, dark matter fraction, and orbital inclination to name a few. An obvious next step that can address this issue is to apply a similar analysis to simulated galaxy mergers from the GalMer database (Chilingarian et al., 2010). Regardless, the results presented here are a useful step forward in our understanding of the formation of counter-rotating stellar and gaseous components in S0 galaxies.
RB acknowledges support under the Australian Research Council’s Discovery Projects funding scheme (DP130100664). We also with to thank the anonymous referee for helpful comments that have helped to clarify this manuscript.
Appendix A Table of Integrated Values
Here we present Table 3, which gives the integrated quantities calculated as described in Section 3.2. These include change in gas mass, final half mass radii and concentrations of each component, and the change in angular momentum of gas and primar stars.
The reference list from the paper itself. Each links out to its DOI / PubMed record.
- 1Athanassoula et al. (2009) Athanassoula E., Romero-Gómez M., Bosma A., Masdemont J. J., 2009, MNRAS , 400, 1706 · doi ↗
- 2Balcells & González (1998) Balcells M., González A. C., 1998, Ap J , 505, L 109 · doi ↗
- 3Balcells & Quinn (1990) Balcells M., Quinn P. J., 1990, Ap J , 361, 381 · doi ↗
- 4Bassett et al. (2017) Bassett R., et al., 2017, The SAMI Galaxy Survey: Kinematics of Dusty Early-Type Galaxies, submitted to MNRAS
- 5Bekki (1998) Bekki K., 1998, Ap J , 502, L 133 · doi ↗
- 6Bekki (2013) Bekki K., 2013, MNRAS , 432, 2298 · doi ↗
- 7Bekki & Tsujimoto (2014) Bekki K., Tsujimoto T., 2014, MNRAS , 444, 3879 · doi ↗
- 8Bekki et al. (2002) Bekki K., Couch W. J., Shioya Y., 2002, Ap J , 577, 651 · doi ↗