The SAMI Galaxy Survey: Kinematics of Dusty Early-Type Galaxies
Robert Bassett, K. Bekki, L. Cortese, W. J. Couch, A. E. Sansom, J., van de Sande, J. J. Bryant, C. Foster, S. M. Croom, S. Brough, S. M. Sweet,, A. M. Medling, M. S. Owers, S. P. Driver, L. J. M. Davies, O. I. Wong, B. A., Groves, J. Bland-Hawthorn, S. N. Richards, M. Goodwin

TL;DR
This study investigates the kinematics of dusty early-type galaxies using integral field spectroscopy, revealing that most are rotation-dominated and likely retain internally produced dust, challenging the need for external dust acquisition.
Contribution
It provides new insights into the kinematic properties of dusty ETGs, showing most are rotation-supported and likely contain internally generated dust, contrasting previous assumptions about external dust accretion.
Findings
90% of dusty ETGs are rotation-dominated.
Dispersion-dominated ETGs show signs of recent mergers.
Most dusty ETGs likely retain internally produced dust.
Abstract
Recently, large samples of visually classified early-type galaxies (ETGs) containing dust have been identified using space-based infrared observations with the Herschel Space Telescope. The presence of large quantities of dust in massive ETGs is peculiar as X-ray halos of these galaxies are expected to destroy dust in 10 Myr (or less). This has sparked a debate regarding the origin of the dust: is it internally produced by asymptotic giant branch (AGB) stars, or is it accreted externally through mergers? We examine the 2D stellar and ionised gas kinematics of dusty ETGs using IFS observations from the SAMI galaxy survey, and integrated star-formation rates, stellar masses, and dust masses from the GAMA survey. Only 8% (4/49) of visually-classified ETGs are kinematically consistent with being dispersion-supported systems. These "dispersion-dominated galaxies" exhibit discrepancies…
Click any figure to enlarge with its caption.
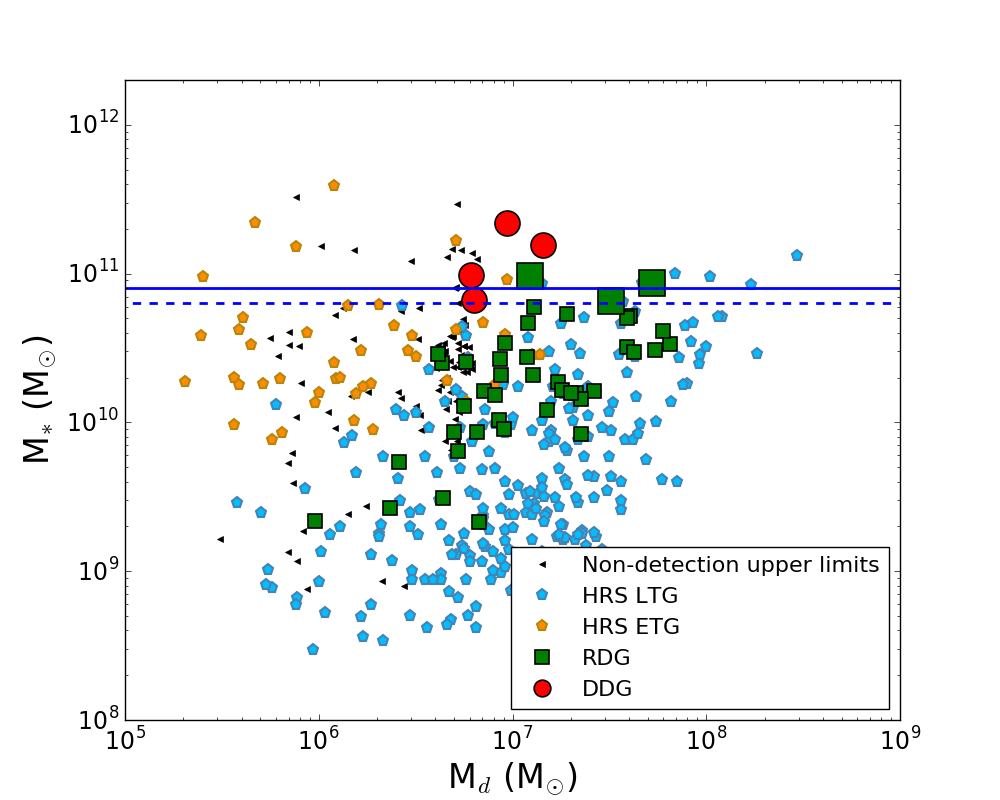 Figure 1
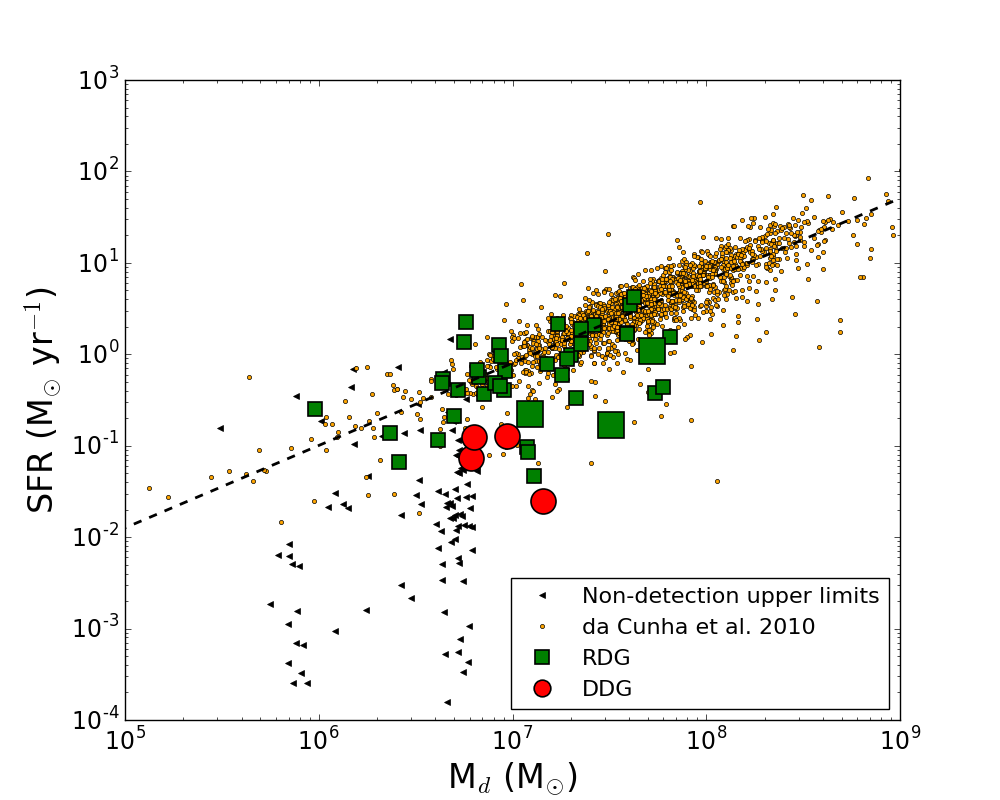 Figure 2
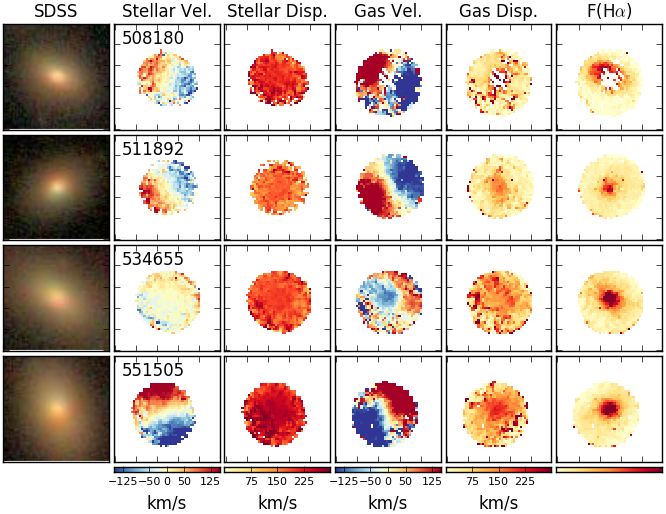 Figure 3
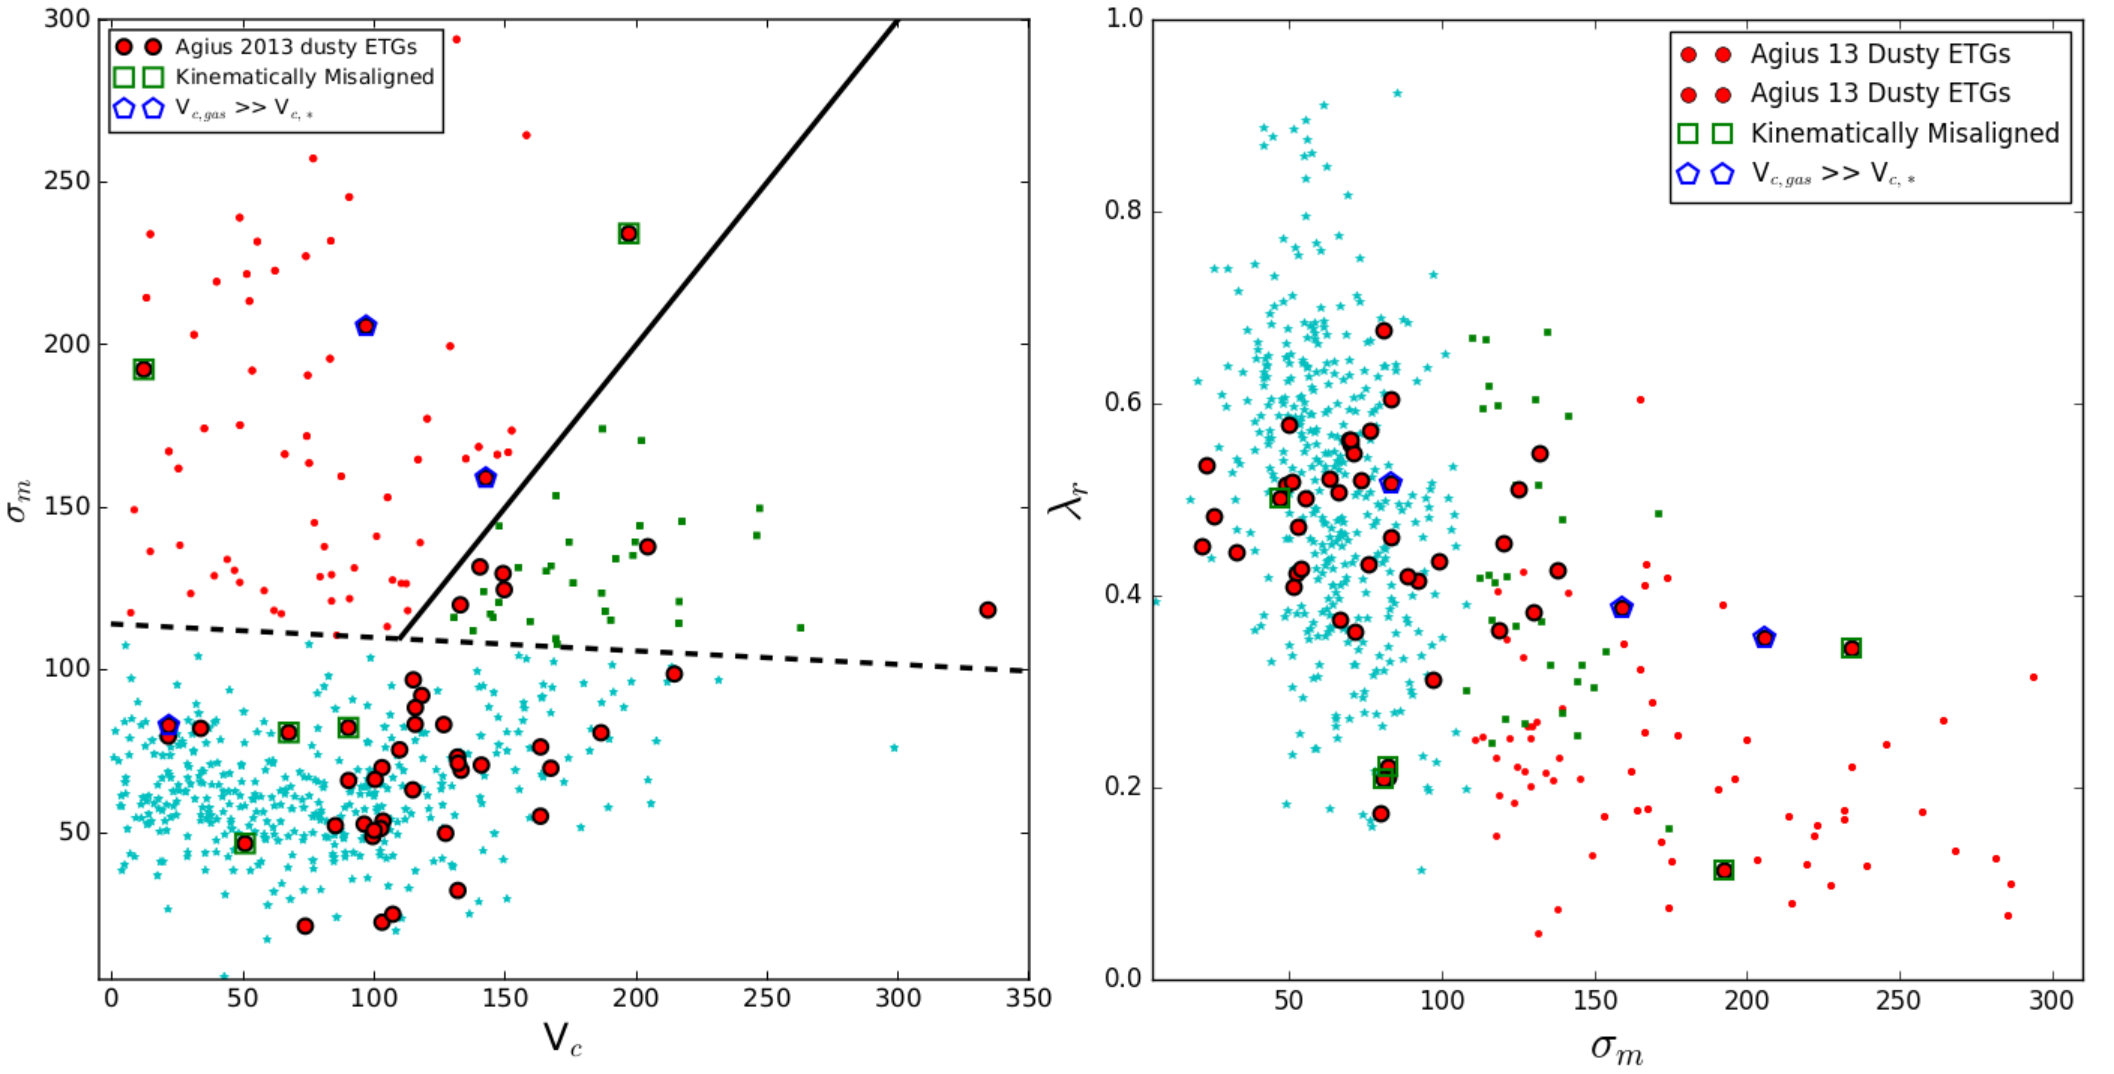 Figure 4
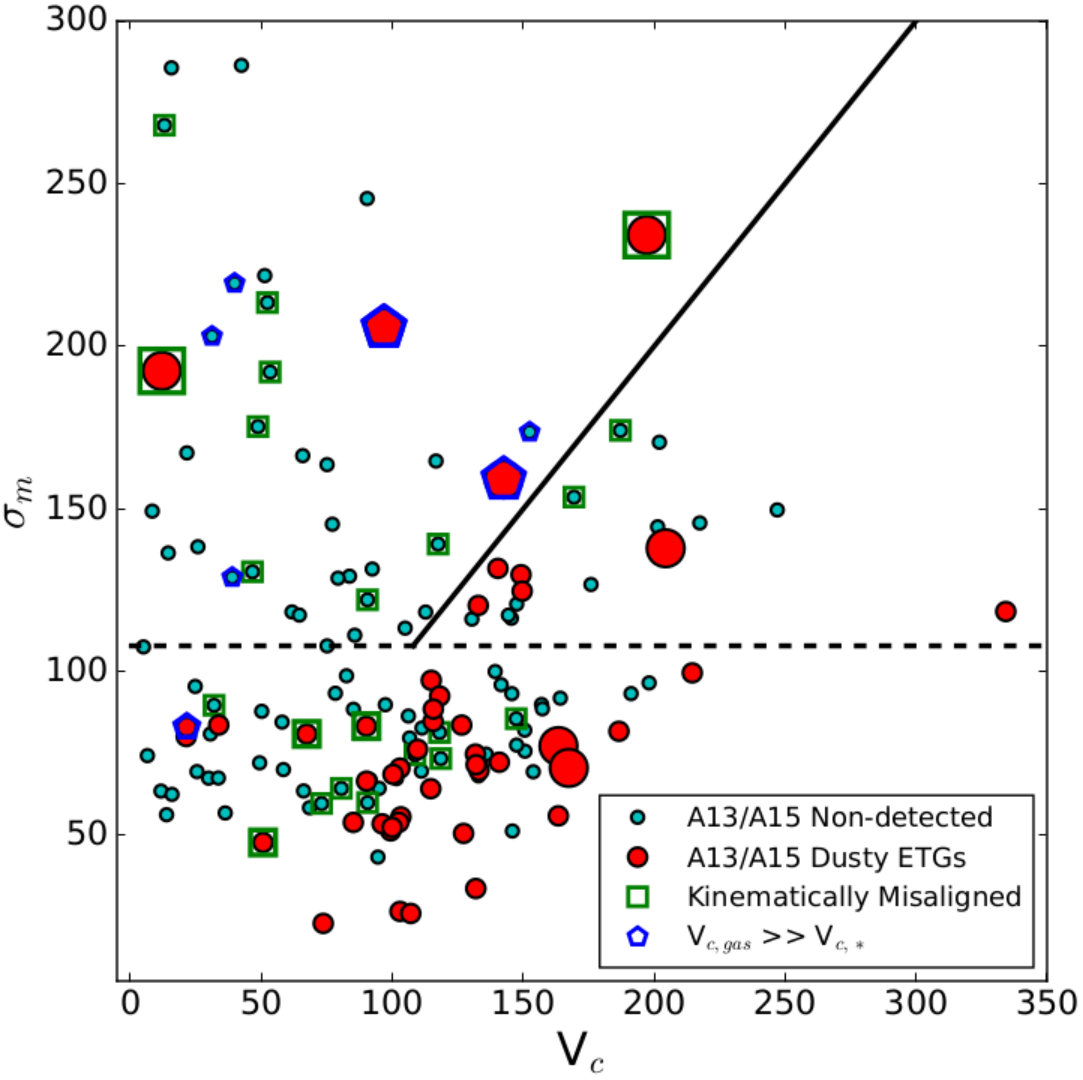 Figure 5
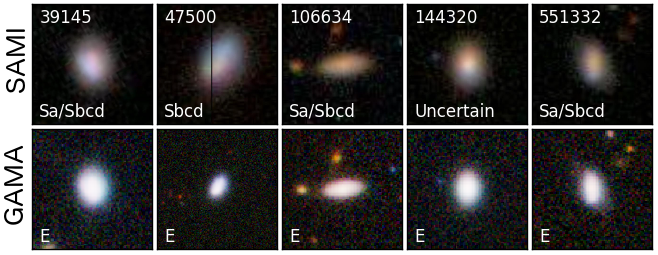 Figure 6
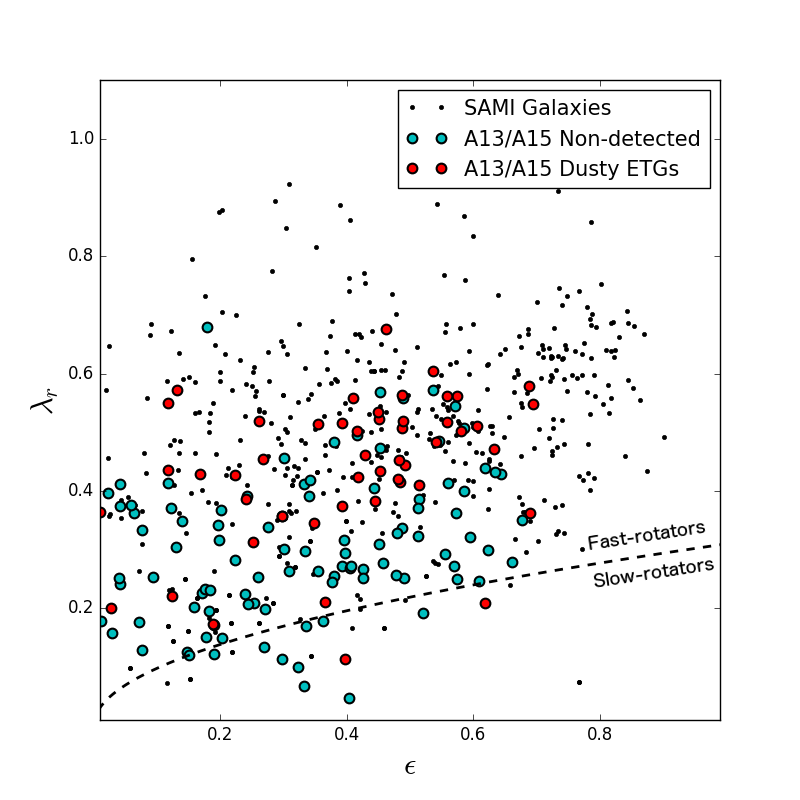 Figure 7
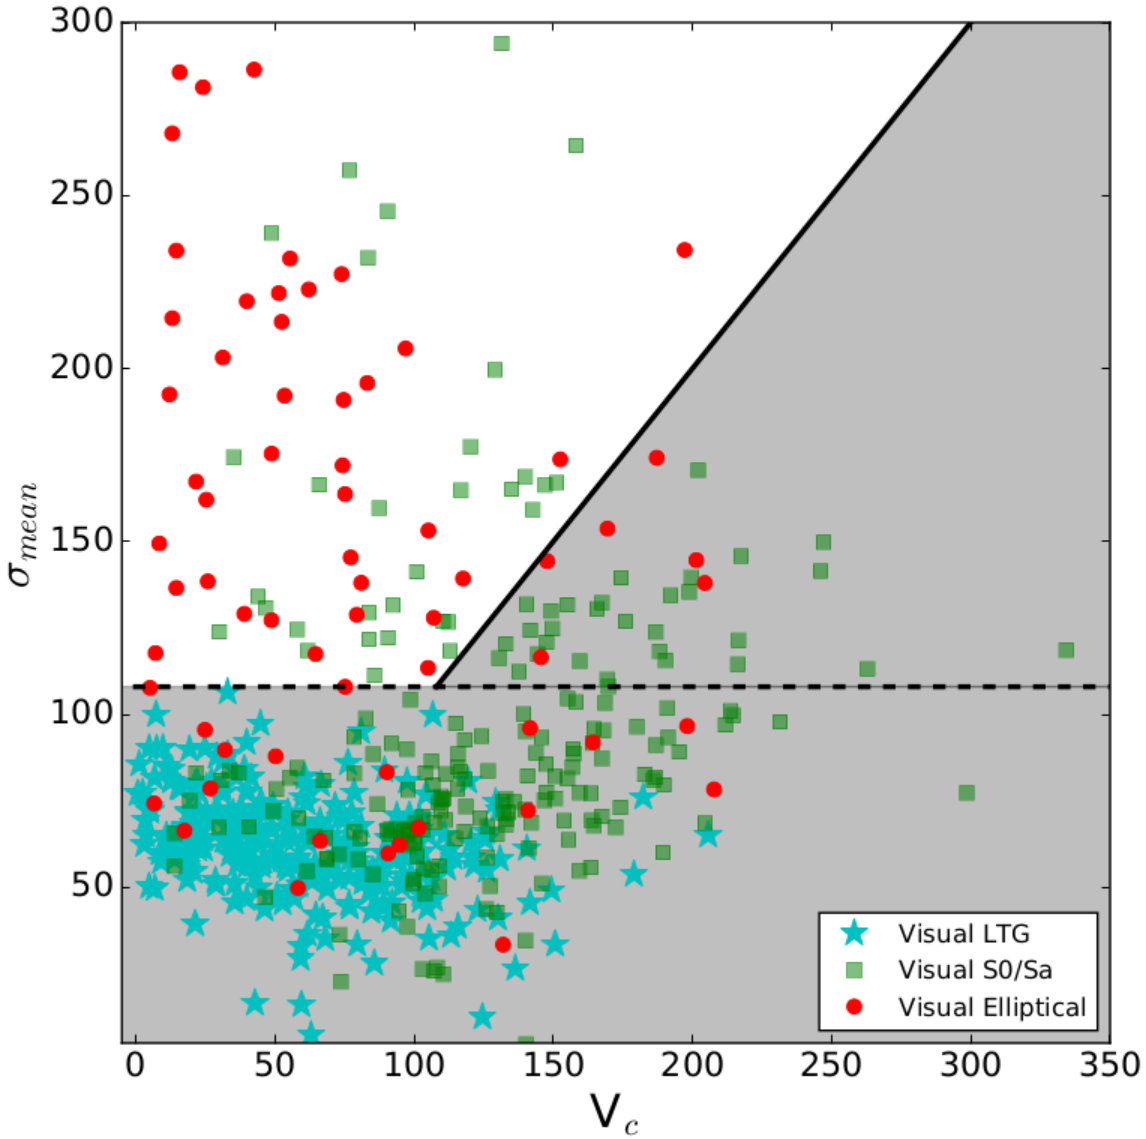 Figure 8
 Figure 9
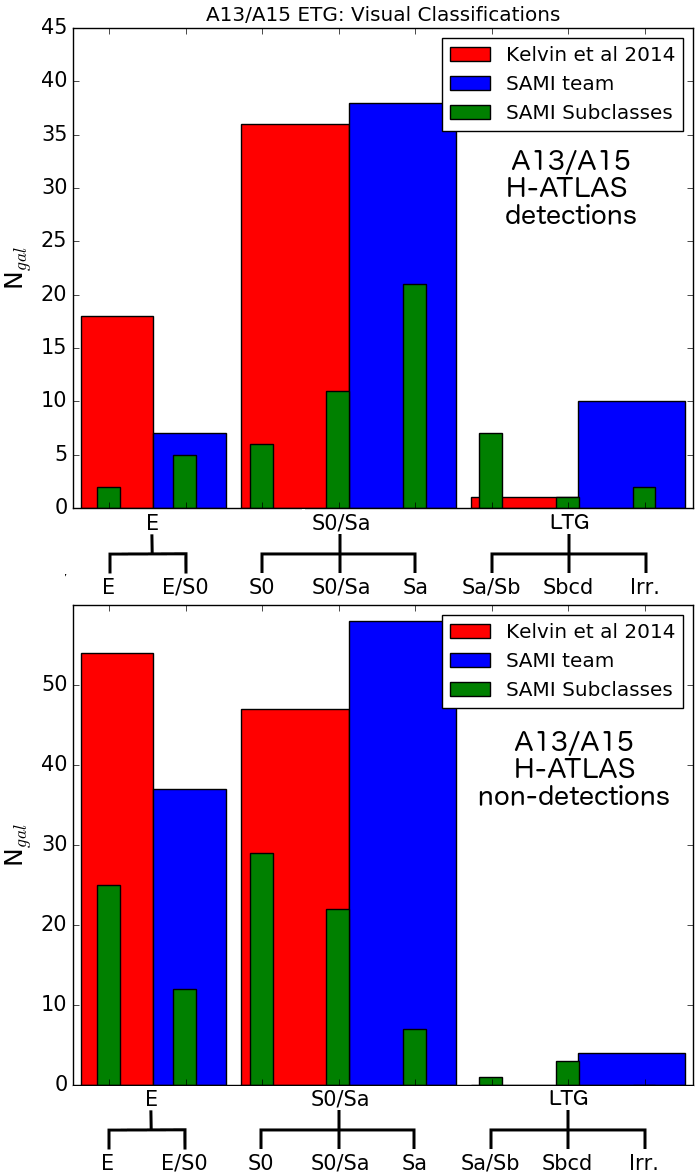 Figure 10
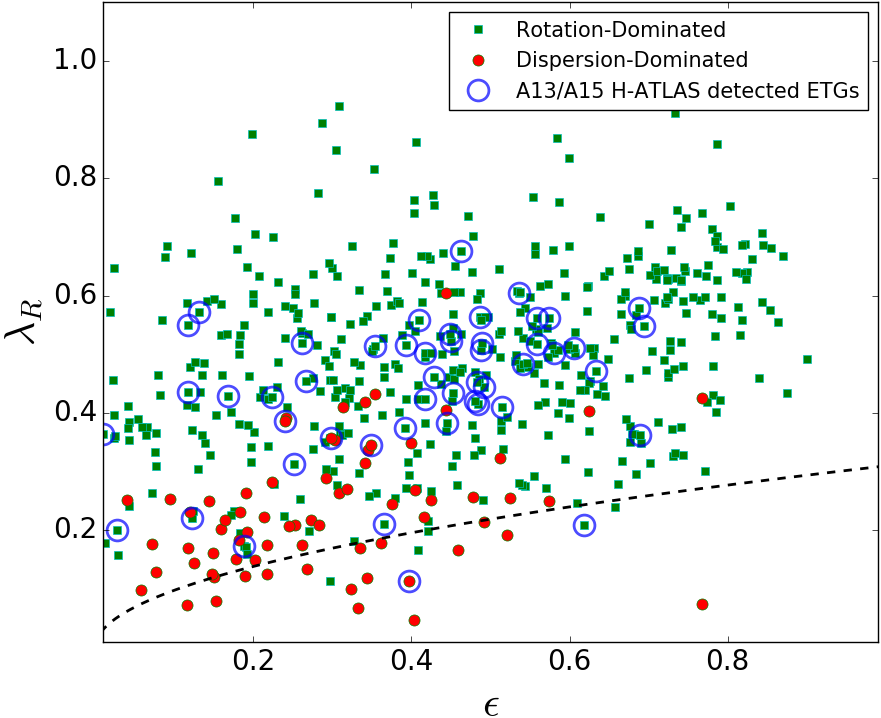 Figure 11
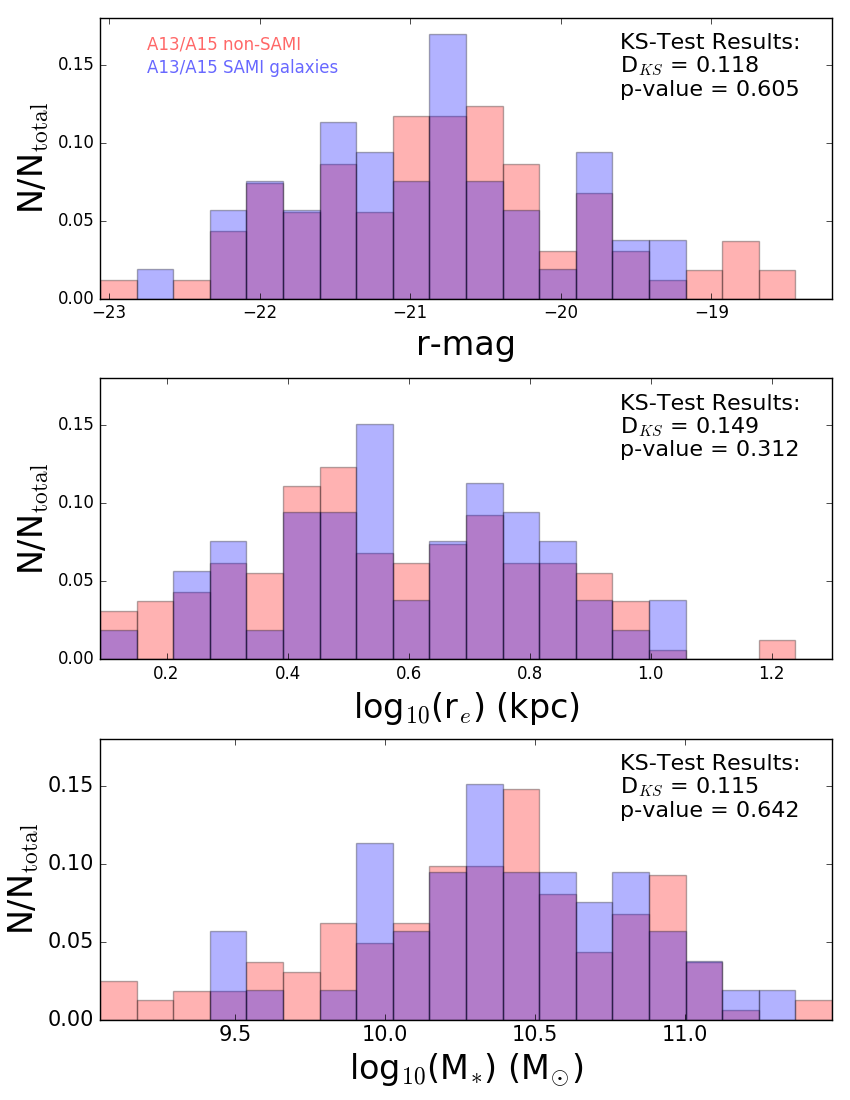 Figure 12
 Figure 13
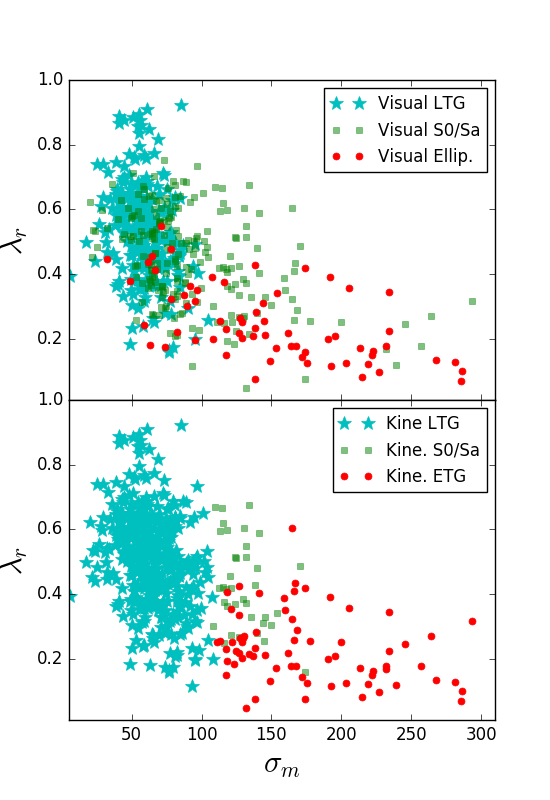 Figure 14
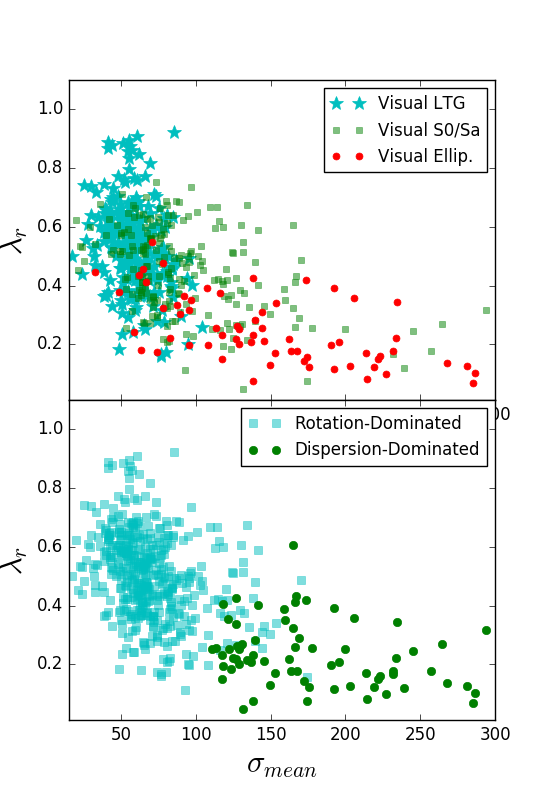 Figure 15
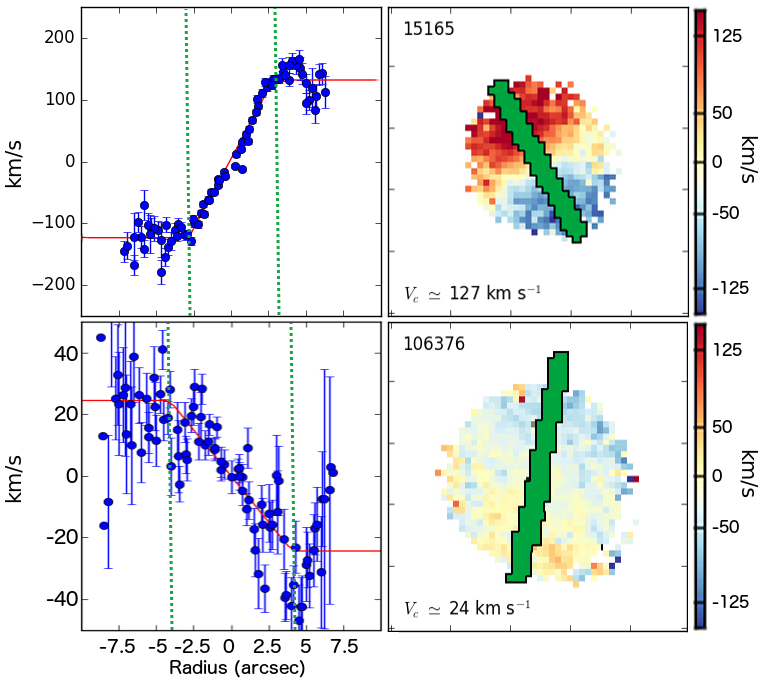 Figure 16
Peer Reviews
No public reviews on file for this paper yet. If you reviewed it on a platform where reviews are public (OpenReview, ICLR, NeurIPS, ICML), you can paste yours below so the community can read it here.
Videos
No videos yet. Explain this paper in a talk, walkthrough, or lecture? Add one.
The SAMI Galaxy Survey: Kinematics of Dusty Early-Type Galaxies
R. Bassett1, K. Bekki1, L. Cortese1, W. J. Couch2, A. E. Sansom3, J. van de Sande4,J. J. Bryant2,4,5, C. Foster2, S. M. Croom4,5, S. Brough2, S. M. Sweet6, A. M. Medling6,7,8,M. S. Owers2,9, S. P. Driver1, L. J. M. Davies1, O. I. Wong1,5, B. A. Groves6,J. Bland-Hawthorn4, S. N. Richards2,4,5, M. Goodwin2, I. S. Konstantopoulos2,10,J. S. Lawrence2
1International Centre for Radio Astronomy Research, University of Western Australia, 7 Fairway, Crawley, WA 6009, Australia
2Australian Astronomical Observatory, PO Box 915, North Ryde, NSW 1670, Australia
3Jeremiah Horrocks Institute, University of Central Lancashire, Preston PR1 2HE, UK
4Sydney Institute for Astronomy, School of Physics, A28, The University of Sydney, NSW 2006, Australia
5ARC Centre of Excellence for All-sky Astrophysics (CAASTRO)
6Research School for Astronomy and Astrophysics, Australian National University, Canberra, ACT 2611, Australia
7Cahill Center for Astronomy and Astrophysics, California Institute of Technology, MS 249-17 Pasadena, CA 91125, USA
8Hubble Fellow
9Department of Physics and Astronomy, Macquarie University, NSW 2109, Australia
10Envizi Suite 213, National Innovation Centre, Australian Technology Park, 4 Cornwallis Street, Eveleigh NSW 2015, Australia E-mail: [email protected] (ICRAR)
(Accepted XXX. Received YYY; in original form ZZZ)
Abstract
Recently, large samples of visually classified early-type galaxies (ETGs) containing dust have been identified using space-based infrared observations with the Herschel Space Telescope. The presence of large quantities of dust in massive ETGs is peculiar as X-ray halos of these galaxies are expected to destroy dust in 107 yr (or less). This has sparked a debate regarding the origin of the dust: is it internally produced by asymptotic giant branch (AGB) stars, or is it accreted externally through mergers? We examine the 2D stellar and ionised gas kinematics of dusty ETGs using IFS observations from the SAMI galaxy survey, and integrated star-formation rates, stellar masses, and dust masses from the GAMA survey. Only 8% (4/49) of visually-classified ETGs are kinematically consistent with being dispersion-supported systems. These “dispersion-dominated galaxies” exhibit discrepancies between stellar and ionised gas kinematics, either offsets in the kinematic position angle or large differences in the rotational velocity, and are outliers in star-formation rate at a fixed dust mass compared to normal star-forming galaxies. These properties are suggestive of recent merger activity. The remaining 90% of dusty ETGs have low velocity dispersions and/or large circular velocities, typical of “rotation-dominated galaxies”. These results, along with the general evidence of published works on X-ray emission in ETGs, suggest that they are unlikely to host hot, X-ray gas consistent with their low when compared to dispersion-dominated galaxies. This means dust will be long lived and thus these galaxies do not require external scenarios for the origin of their dust content.
keywords:
galaxies: kinematics and dynamics - galaxies: interactions - ISM: dust, extinction
††pubyear: 2016††pagerange: The SAMI Galaxy Survey: Kinematics of Dusty Early-Type Galaxies–C
1 Introduction
The recent launch of the Herschel Space Telescope has made it possible for astronomers to study cold dust in a wide variety of galaxies with unprecedented sensitivity. As a consequence, a number of teams have identified large samples of visually-classified early-type galaxies (ETGs) that clearly harbour massive reservoirs of cold dust (Cortese et al., 2012; Rowlands et al., 2012; Smith et al., 2012; di Serego Alighieri et al., 2013; Agius et al., 2013, 2015; Dariush et al., 2016). Although dust is closely related to the formation of stars in star-forming, late-type galaxies (LTGs), this may not be the case in ETGs where the level of on-going star formation is typically much lower (if not non-existent). Furthermore, massive ETGs are known to contain large amounts of hot, X-ray emitting gas that is inhospitable to fragile dust grains. This hot gas rapidly destroys dust through a process known as thermal sputtering, resulting in a dust lifetime of 105-107 yr (Draine & Salpeter, 1979; Itoh, 1989; Tsai & Mathews, 1995; Mathews & Brighenti, 2003; Clemens et al., 2010; Anderson et al., 2015).
The now undisputed presence of large quantities of dust in some ETGs has sparked a debate as to its origins. Many works have suggested that dust found in ETGs must have been recently accreted via mergers with gas-rich satellites (Goudfrooij & Trinchieri, 1998; Gomez et al., 2010; Kaviraj et al., 2009; Davis et al., 2011; Shabala et al., 2012; Kaviraj et al., 2013; Davis et al., 2014; Dariush et al., 2016). In such a merger, the accreted dust will be embedded in a cold medium (either atomic or molecular gas) that can provide shielding from X-ray photons, resulting in a longer lifetime than for dust produced internally (Temi et al., 2007; Clemens et al., 2010; Dasyra et al., 2012; Finkelman et al., 2012). Alternatively, the dust may result from internal processes such as cooling of hot halo gas (Fabian et al., 1994; Bregman et al., 2005; Lagos et al., 2014) or production in asymptotic giant-branch (AGB) stars (Knapp, 1985; Knapp et al., 1992; Athey et al., 2002; Matsuura et al., 2009; Nanni et al., 2013). Currently, there is no clear consensus regarding the internal versus external origins of dust in ETGs, and it is possible that both play some role with the balance between the two sources depending on the properties of individual galaxies (Rampazzo et al., 2005; Cappellari et al., 2011; Finkelman et al., 2012).
Much of the recent work on dusty ETGs is based on samples selected by visual morphology. In such cases it is not clear how certain we can be that such galaxies host a hot, X-ray emitting halo. The X-ray properties of ETGs vary considerably. This X-ray emission is less dominant in lower mass ETGs (e.g. Boroson et al., 2011), in (apparently) younger ETGs (Sansom et al., 2000; Sansom et al., 2006), and in ETGs with higher star formation (Su et al., 2015). Environment is also thought to play a role (e.g. Mulchaey & Jeltema, 2010). Clear evidence of diffuse X-ray emission is found in massive galaxy clusters as well as the most massive individual ETGs (1010.8 M*⊙* and higher; e.g. Anderson et al., 2015) with X-ray luminosities () significantly larger than 1040 ergs s*-1*. For LTGs, Mineo et al. (2012) finds < 1040 ergs s*-1* corresponding roughly to the high cut-off for X-ray binary stars (see Fabbiano, 2006, for a review). Thus, for galaxies observed with < 1040 ergs s*-1*, particularly those with recent star formation, X-ray emission can be attributed to the cumulative emission from supernova remnants and X-ray binaries.
Recent spectroscopic work has provided a connection between galaxy kinematics and X-ray properties. In particular, galaxies with stellar velocity dispersions () larger than 150 km s*-1* are often found to have X-ray luminosities in excess of 1040 ergs s*-1* (Boroson et al., 2011; Sarzi et al., 2013; Kim & Fabbiano, 2015; Goulding et al., 2016), and these galaxies appear to extend the relationship between and stellar mass found in massive galaxy clusters (e.g. Wu et al., 1999; Ortiz-Gil et al., 2004; Zhang et al., 2011, and references therein) to lower mass systems. Below = 150 km s*-1*, all ETGs studied by Goulding et al. (2016) have < 1040 ergs s*-1*; in the range attributed to X-ray binaries by Mineo et al. (2012). Furthermore, recent simulations by Negri et al. (2014b) have shown that galaxy rotation can also act to reduce . This occurs because conservation of angular momentum in rotating galaxy models encourages the growth of cold gas disks, preventing large amounts of hot gas from collecting in the central region. These results suggest that kinematic observations of visually-selected, dusty ETGs may distinguish galaxies embedded in a massive halo of hot gas from those more hospitable to long lived dust reservoirs. It is also worth noting that visual morphology and kinematic classifications are not always well correlated (see Cappellari, 2016, for a recent review of this topic).
This connection between X-ray emitting gas content and kinematics shows that spatially-resolved observations using integral field spectroscopy (IFS), which give a detailed description of a galaxy’s kinematics, can help in understanding the origins of dust in ETGs. IFS observations of large samples of galaxies identified as dusty ETGs provide a step forward in two respects. First, because IFS allows global measurements of stellar covering most of the galaxy, they can clearly identify galaxies with large stellar that most likely host X-ray emitting gas. Second, IFS observations provide a strong indicator of recent merger activity through the direct comparison of ionised gas and stellar kinematics. The work of Davis et al. (2011) using galaxies from the ATLAS survey is an example in this vein, showing a connection between the detection of molecular gas in ETGs and misalignments between ionised gas and stellar kinematics. A scenario in which dust is produced internally is less likely to produce kinematic misalignments, particularly where dust originates directly from AGB stars. Galaxy mergers in simulations often produce misalignments (e.g. Balcells & Quinn, 1990; Thakar et al., 1997; Bendo & Barnes, 2000; Di Matteo et al., 2007, Bassett et al. submitted), thus mergers represent a natural source for externally produced dust in ETGs.
In this work we examine the origins of dust in ETGs using data from the SAMI Galaxy Survey (Bryant et al., 2015). The majority of SAMI galaxies are selected from the Galaxy And Mass Assembly survey (GAMA Driver et al., 2011), therefore we focus on the samples of dusty ETGs selected from GAMA by Agius et al. (2013, A13 hereafter) and Agius et al. (2015, A15 hereafter). We begin by considering those 540 GAMA galaxies observed by the SAMI survey that are found to have high quality kinematic measurements (see Section 4) and clearly defined visual morphologies. We choose to explore the kinematics of A13/A15 galaxies rather than other samples of dusty ETGs (e.g. Rowlands et al., 2012; Dariush et al., 2016) as we find the largest overlap with this sample, which amounts to 49 Herschel detected and 99 non-detected galaxies. Together Rowlands et al. (2012) and Dariush et al. (2016) have a total of 4 galaxies currently observed by SAMI.
This paper is structured as follows: in Sections 2 and 3 we present the samples and data-sets considered. Section 4 presents our method of extracting integrated kinematic quantities from SAMI IFS observations as well as our kinematic criteria for isolatibng those visually-classified dusty ETGs that are most likely to host hot X-ray emitting gas. In Section 5 we apply this selection to those galaxies from A13/A15 observed by SAMI. In Section 6 we discuss the evolutionary implications of our results, and in Section 7 we summarise our conclusions. Throughout this work we adopt a CDM cosmology with = 0.3, = 0.7, and = 70 km s*-1* Mpc*-1*.
2 Samples
2.1 Dusty Early Type Galaxies: Agius
et al. (2013) and Agius et al. (2015)
The parent sample of Herschel ATLAS (H-ATLAS Eales et al., 2010) detected ETGs were first identified and analysed by A13. Briefly, H-ATLAS is a 550 square degree IR survey using the PACS and SPIRE instruments (targeting 100-500m) on the Herschel space observatory with an expected detection of 250,000 galaxies. A13 began by investigating the H-ATLAS detections for a sample of galaxies identified as ETGs in the GAMA dataset through visual classification (Kelvin et al., 2014, see also Section 3.1.2), with active galaxies excluded based on the prescription of Kauffmann et al. (2003). The sample of A13 is restricted to the redshift range 0.013 < < 0.06 and absolute -band magnitudes brighter than = -17.4 providing a volume-limited sample in the -band. They find an H-ATLAS detection rate of 29% (220/771), i.e. 29% of the visually classified ETGs in GAMA have IR detections greater than 5. Rigby et al. (2011) show that in the H-ATLAS science demonstration phase that their survey data has a catalogue number density completeness of > 80% with the remaining 20% missing due to noise and/or blending of sources. The completeness for A13/A15 galaxies should be similar to this. Among H-ATLAS detected ETGs there is a trend for the ratio of dust mass to stellar mass to increase for bluer NUV - colour, implying that recent star formation is likely associated with an increased presence of dust.
2.2 SAMI Overlap With A13/A15
In this paper we wish to explore the resolved kinematics of the sample of dusty ETGs presented in A13 and A15. While A13 includes dust masses for 220 dusty ETGs, only 49 of these have high quality observations in the SAMI galaxy survey. Similarly, the study of A13/A15 incudes 551 H-ATLAS non-detected galaxies, of which 99 have high quality SAMI survey observations. We expect the properties of those galaxies from A13/A15 that overlap with our SAMI observations to be fairly representative of the full sample of A13/A15 galaxies as the SAMI survey is selected to be representative of the GAMA survey, the parent sample of A13/A15.
It is important to know whether the A13/A15 galaxies for which we can investigate the resolved kinematics are representative of the original parent distribution. In Figure 1 we show histograms of -band magnitude, log10(), and log10(M*∗) comparing those galaxies from A13/A15 that have been observed with SAMI (in blue) with those that have not (in red). We then perform a two sample Kolmogorov-Smirnov (KS) test for each of the three galaxy properties for these two subsamples. The resulting p-values of this are given in the top right corner of each panel. The p-value indicates the percentage of the time we should expect to find the observed level of difference between the two samples, given their sizes, under the null hypothesis that they are randomly drawn from the same parent sample (typically the null hypothesis is not rejected where the p-value is larger than 0.01). For -band magnitude, , and M∗* we find p-values of 0.605, 0.312, and 0.642 meaning we can not reject the null hypothesis that these samples come from the same parent distribution. KS-test results for H-ATLAS non-detected A13/A15 galaxies show less agreement in properties between the full sample and those observed with SAMI with p-values for -band magnitude, , and M*∗* of 0.374, 0.075, and 0.132, respectively. Although we find slightly less agreement for non-detections, the p-values suggest that, again, we can not reject the null hypothesis that those observed by SAMI are representative of the parent sample.
3 Data
3.1 SAMI Survey Data
Data analysed in this work comes from the SAMI Galaxy Survey (Bryant et al., 2015) which aims to observe 3600 galaxies using the SAMI integral field spectrograph (Croom et al., 2012) at the 3.9m Anglo-Australian Telescope in the redshift range 0.004 < < 0.095. Observations using the SAMI IFS represent a step forward from more traditional IFS instruments due to the use of multiple fibre bundles (hexabundles, Bland-Hawthorn et al., 2011; Bryant et al., 2014) allowing for simultaneous observations of multiple galaxies with a roughly circular, 147 diameter coverage. Fibres are fed into the AAOmega spectrograph (Sharp et al., 2006), which observes two spectral ranges using a red and blue arm setup. This provides coverage with 3700-5700 Å at R=1812 resolution and with 6300-7400 Å at R=4263 resolution (Croom et al., 2012; Bryant et al., 2015).
The SAMI designed to be representative of the highly complete (>98% Driver et al., 2011) GAMA survey rather than complete itself due to observational constraints. As we have mentioned, H-ATLAS detected A13/A15 galaxies should have a completeness of >80% similar to the overall H-ATLAS survey. We have shown in Figure 1 that H-ATLAS detected A13/A15 galaxies with reliable SAMI kinematics are representative of overall A13/A15 sample, thus we do not expect completeness issues in the SAMI survey to affect our results.
At the time this paper was written, 1094 galaxies have been observed by the SAMI galaxy survey. Of these, 753 have had stellar kinematics measurements performed as described in Section 3.1.1. We then perform two quality cuts on this sample of 753 galaxies. First we utilise only those galaxy observations that include enough high signal-to-noise spaxels such that we can measure the rotation curve beyond its turnover radius (see Section 4 for more information). Next we remove galaxies that exhibit highly uncertain visual classifications of their morphologies (see Cortese et al., 2016). Our cut on stellar kinematics quality removes 199 galaxies while the morphological cut removes a further 14 galaxies, resulting in a final sample of SAMI survey galaxies of 540. We use the kinematic measurements of this large sample of galaxies to determine if a given galaxy is supported by rotation or by random motions. We note that our stellar kinematic quality cut removes 3 H-ATLAS detected galaxies from A13/A15 due to large stellar velocity dispersion errors and our morphological quality cut removes a further 1 A13/A15 dusty ETG. All four of these galaxies, however, have relatively low velocity dispersions, thus excluding them does not affect our conclusions.
3.1.1 Stellar and Ionised Gas Kinematics
Here we briefly describe the stellar kinematics fitting process, however, for a more detailed description see Fogarty et al. (2015) and van de Sande et al. (accepted for publication in ApJ). Stellar kinematics are measured using the penalised pixel-fitting (pPXF, Cappellari & Emsellem, 2004) routine, which has become the standard method for use with IFS datacubes (e.g. Emsellem et al., 2007; Jimmy et al., 2013; Bassett et al., 2014; Ma et al., 2014). The pPXF method convolves spectral templates with a line-of-sight velocity distribution (LOSVD) parameterised using Gauss-Hermite polynomials. The first and second moments of this LOSVD provide the stellar velocity and velocity dispersion, respectively. In this work we are concerned only with these first two moments, however see van de Sande et al. (2017) for a detailed analysis of higher order moments.
Ionised gas kinematics for SAMI galaxies are measured from emission line spectra using the LZIFU spectral fitting pipeline (Ho et al., 2016b). Prior to fitting, the best fitting stellar continuum model from our pPXF procedure is subtracted from the spectra in each spaxel to provide more reliable fits. Gas velocities and velocity dispersions are then extracted from Gaussian fits to ionised gas emission lines. The LZIFU pipeline provides single Gaussian fits as well as more complex fits employing two and three Gaussian components. For the analysis presented in this paper we are primarily interested in the circular velocity, , and kinematic position angle (both described in Section 4.3) for the primary component of the ionised gas. Therefore we use the simple, single-component fits. For more detail on SAMI ionised gas kinematics fits see Ho et al. (2014), Ho et al. (2016a), and Ho et al. (2016b).
3.1.2 Galaxy Morphology
Galaxy morphologies have been determined through visual classification by an internal SAMI working group based on Sloan Digital Sky Survey (SDSS, York et al., 2000) Data Release 9 (DR9) RGB images for all SAMI galaxies observed at the time this paper was written. This classification, described in Cortese et al. (2016), is independent of, but similar to, the scheme of Kelvin et al. (2014) used by the GAMA survey. This involves a step-by-step procedure in which galaxies are first broadly classified as spheroid-dominated or disk-dominated, then placed into subclasses based on finer details. As SAMI galaxies in this work are selected from the GAMA survey, all galaxies here have been classified by both teams with three key differences. First, GAMA team members performed classifications on false colour , , band composite images, while SAMI team members utilise SDSS DR9 images. Second, the classification working groups from both surveys are composed of independent groups of classifiers who will each have their own unique classification bias. Third, SAMI classifications include two criteria for identifying LTGs not used by Kelvin et al. (2014), namely the presence of spiral arms and signs of star formation (based on colour rather than purely on morphology). Discussion of differences between the classifications of the two groups can be found in Section 6.1. As noted previously, 14 galaxies determined to be “unclassified” (see Cortese et al., 2016) are excluded from our analysis, and only one of these comes from the A13/A15 samples. This galaxy, although it has an H-ATLAS detection, has a low velocity dispersion. Thus excluding it does not affect our conclusions. For consistency with A13/A15, galaxies with elliptical, S0, and Sa visual classifications are defined as ETGs.
3.2 Stellar Mass, Dust Mass, and SFR
In Section 5.2 we explore the dust mass scaling relations of A13/A15 galaxies considered in this work. The GAMA survey provides a number of ancilliary data products, which are available for all A13/A15 galaxies observed by SAMI. Briefly, the GAMA survey is a multiwavelength survey of hundreds of thousands of low redshift galaxies. The core of the GAMA survey is a spectroscopic survey at optical wavelengths using the AAOmega instrument at the Anglo-Australian Telescope. This spectroscopic campaign is bolstered by data sharing agreements and coordination with other independent imaging surveys covering the entire electromagnetic spectrum, from X-rays to radio. For more information on the goals, target selection, and public data releases of GAMA survey data see Driver et al. (2009), Baldry et al. (2010), Driver et al. (2011), and Liske et al. (2015).
Using data products from the GAMA survey we explore stellar masses (), dust masses (), and SFRs derived from full spectral energy distribution (SED) fits to ultraviolet (UV) to far-infrared (far-IR) observations using the MAGPHYS code based on the models of da Cunha et al. (2008). MAGPHYS has the distinct advantage over more traditional SED fitting techniques (e.g. Bruzual & Charlot, 2003) as the inclusion of far-IR wavelengths allows for a direct balancing of energy from young, hot stars and warm/cold dust emission resulting in more robust SFRs as well as estimates of . Preliminary results from MAGPHYS-determined values for GAMA galaxies have been explored by Davies et al. (2016) and Driver et al. (2016), and full details of the MAGPHYS analysis will be presented in Driver et al. (2017).
Although all SAMI galaxies (including both H-ATLAS detected and non-detected galaxies from A13/A15) have MAGPHYS estimates of , estimates for H-ATLAS non-detected galaxies are highly uncertain due to the lack of far-IR data. For this reason, we estimate upper limits to the dust masses for H-ATLAS non-detected galaxies following the procedure of A13/A15. This procedure is described in Appendix A. Both and SFR can more reliably be extracted in the absence of far-IR detections, thus these values are taken from the GAMA survey for both H-ATLAS detected and non-detected A13/A15 galaxies.
4 Global Kinematics and Kinematic Galaxy Selection
Here we first describe our methods of extracting the global stellar kinematic quantities of rotational velocity, , and flux weighted velocity dispersion, , from our IFS observations. This is followed by a description of our method of selecting galaxies with stellar kinematics dominated by random motions.
4.1 Circular Velocity:
The first step in determining the stellar for each galaxy is to determine the kinematic position angle (PA) based on the observed stellar velocity map. This is achieved using the code fit_kinematic_PA (see e.g. Cappellari et al., 2011) on the SAMI stellar velocity maps. This code determines the global kinematic position angle following the method described in Appendix C of Krajnović et al. (2006). Next, we use the measured stellar kinematic PA of each galaxy to extract the projected rotation curves along the kinematic major axis and, from this fit, estimate the value of using a custom Python code. We briefly outline this procedure here, however a more detailed description is given in Appendix B.
To recover we trace an artificial slit of width 15 across the velocity map at an angle given by the PA. The velocity as a function of position along the slit is fit by a piecewise function made up of two constant velocity sections separated by a sloped linear segment describing the central velocity gradient. This functional form, which follows Epinat et al. (2009), provides two parameters: the turnover radius, , and . The latter is given by the constant velocity value beyond . For some observations the coverage of the SAMI bundle does not extend beyond , thus measured values of are largely unconstrained. This is true for 199 of the 753 galaxies tested (including 3 H-ATLAS detected A13/A15 galaxies), and these galaxies are excluded from further analysis. Finally we apply an inclination correction to based on measured ellipticities and bulge-to-total ratios taken from the GAMA survey and from Simard et al. (2011), respectively (our inclination correction is described fully in Appendix B).
4.2 Flux Weighted Velocity Dispersion:
We adopt the value , the flux weighted stellar velocity dispersion, for our global velocity dispersion measure following previous IFS studies at various redshifts (Law et al., 2009; Epinat et al., 2009; Jones et al., 2010; Wisnioski et al., 2011; Green et al., 2014). Prior to measuring the stellar , we mask spaxels with large uncertainties on following the procedure of van de Sande et al. (2017). is then defined as:
[TABLE]
where is the flux observed in the spaxel with and as its spatial position, and is the corresponding stellar velocity dispersion. We find this measurement is robust for all galaxies with SAMI coverage beyond as described in Section 4.1. A rough correction for the effects of beam smearing is applied following (Bassett et al., 2014), where the artificial induced by the seeing is subtracted from in quadrature. For a detailed description of our masking and beam smearing correction procedure, see Appendix C. For simplicity, all remaining references to and in this paper refer specifically to inclination corrected and beam-smearing corrected values respectively.
4.3 Kinematic Galaxy Selection
In this Section we utilise galaxy stellar kinematics from IFS observations to select dispersion-dominated galaxies in a less ambiguous way than visual morphological classification. We would like to know how many galaxies that are visually classified as ETGs are really dispersion-dominated systems, and how many have kinematic properties more similar to rotationally-supported LTGs. The latter are typified by S0 galaxies, which, by definition, exhibit a significant disk component.
Our stellar kinematic selection is depicted in Figure 2 where we plot versus . Plotted symbols indicate different visual morphologies taken from our SAMI classifications. We note that the velocity resolution of the SAMI survey is 70 km s*-1*, which means that many of our low stellar values will be upper limits. In particular, this will be the case for a very large fraction of visually classified LTGs at low , as this low measurement of often results from a nearly face-on inclination. Measurements for face-on galaxies should provide a lower value of when compared to an edge-on view of the same object due to a minimal contribution from rotation and beam smearing. In their IFS study of face-on LTGs from the DiskMass Survey, Martinsson et al. (2013) find that 77% (23/30) have line-of-sight stellar less than 70 km s*-1* with an average value of 56.8 km s*-1* for their entire sample. Thus we should expect low (more face-on on average) galaxies have clustered near our resolution limit. We also note that we apply a larger beam smearing correction for galaxies with a large (see Appendix C), and the uncorrected measurements of for these galaxies are up to 30 km s*-1* larger than pictured in Figure 2.
Visually classified ETGs (Elliptical, S0, and Sa galaxies) are found to exhibit a large amount of scatter in in Figure 2 highlighting the pitfalls of assuming a one-to-one correspondence between visual-morphology and kinematics; e.g. visually-classified ETGs have a large stellar velocity dispersion. Visually classified LTGs, on the other hand, are found to be more clustered. This is due to the fact that they are easier to identify from the presence of clear spiral arms, resulting in a much cleaner selection. S0/Sa galaxies, in general, extend the high end of the LTG distribution to higher . This is consistent with the result of Williams et al. (2010) who show S0 galaxies exhibit a larger than LTGs at fixed M*∗*.
Following the LTGs, we produce a selection to separate galaxies having kinematic properties consistent with those of visually selected LTGs. We initially perform a linear fit to the visual LTGs in Figure 2, finding a slope of -0.04.04. As this is consistent within errors to a flat slope, we simply employ a flat cut in , matching the cutoff value to the highest value observed for a visually selected LTG of 108.0 km s*-1*. This cut is shown in Figure 2 by th horizontal, black dashed line. By design, this isolates 100% of LTGs in our sample, however 31% of visually-classified elliptical galaxies also fall below this line (20/65).
We are interested in galaxies for which a large fraction of the dynamical support comes from random motions, implying a large relative to . For this reason we also plot in both panels the 1-to-1 relation as a solid black line. Galaxies falling above this line have > , thus they are the most likely to derive a majority of their support from random motions (e.g. Weiner et al., 2006; Law et al., 2009; Lemoine-Busserolle & Lamareille, 2010; Newman et al., 2012). We define galaxies falling above both this line and the black dashed line as “dispersion-dominated” galaxies. The remaining galaxies we define as “rotation-dominated” galaxies. Comparing this kinematic selection with our sample of 540 SAMI galaxies with reliable kinematics, we find that 100% of dispersion-dominated galaxies (DDGs) and 39% (181/469) of rotation-dominated galaxies (RDGs) are visually classified as ETGs. We reiterate the point from Section 3.1.2 that our definition of ETG includes Sa galaxies, however. If we redefine ETGs more strictly as only galaxies with visual classifications earlier than Sa, we find 93% (66/71) of DDGs and 14% (66/469) of RDGs are considered ETGs.
Before moving on, we examine the relationship between the galaxy spin parameter, , and ellipticity, , for A13/A15 galaxies. Here, is calculated from our SAMI stellar kinematics maps as:
[TABLE]
Where is the flux in spaxel , and and are the line-of-sight velocity and velocity dispersion in spaxel . The value is the semimajor axis of the ellipse defined by the -band axis ratio () on which spaxel lies (i.e. the intrinsic radius). This sum is performed using only spaxels within an ellipse defined by the galaxy effective radius, , and . For ATLAS galaxies, Emsellem et al. (2011) show that these parameters are useful in separating fast and slow-rotators among their sample of ETGs. versus for our sample is shown in Figure 3 where we plot RDGs, DDGs, and H-ATLAS detected ETGs from A13/A15. The dashed line shows the separation between slow- versus fast-rotators taken from Emsellem et al. (2011).
We find that there is a correspondence between vs and our kinematic selection, with a majority of DDGs falling at low and . This suggests that the two methods are tracing similar properties of SAMI galaxies, particularly in light of the large uncertainty in for SAMI observations (which in some cases is >0.4). Considering only H-ATLAS detected ETGs from A13/A15, we find that employing the slow- versus fast-rotator selection of Emsellem et al. (2011) would retain only two galaxies, with one having significant rotation and a relatively large . We are able to double our sample of H-ATLAS detected ETGs by employing the kinematic selection outlined here. We stress that, within uncertainties in our kinematic measurements, our kinematic selection and that of Emsellem et al. (2011) are tracing roughly the same population. In this work, however, we are primarily interested in galaxies with a large stellar velocity dispersion, which can be used as an indication of the presence of a hot, X-ray emitting halo (e.g. Boroson et al., 2011; Sarzi et al., 2013; Goulding et al., 2016).
Although stellar is often used as a proxy for (e.g. Faber & Jackson, 1976), it has been shown that even massive, X-ray halo hosting galaxies can host disks of cold gas and dust when rotating rapidly (Negri et al., 2014a; Negri et al., 2014b). Using our kinematic quantities, however, we can identify those galaxies likely to host hot X-ray emitting gas, and further select only those low rotation galaxies in which the presence of this gas would hinder the formation of long-lived dust grains. Figures 2 and 3 show that this may not be accomplished considering versus or by using alone as an indicator of a hot interstellar medium.
5 Results
5.1 Kinematics of A13/A15 Galaxies
Having developed a stellar kinematic selection, we now apply this to those A13/A15 galaxies that have been observed by the SAMI Galaxy Survey. The versus parameter space used to perform our kinematic selection is depicted in Figure 4 for A13/A15 galaxies observed by SAMI with H-ATLAS non-detections shown by small cyan circles and H-ATLAS detected galaxies shown by larger red circles. We also indicate those galaxies having kinematic irregularities (described below) by green squares and blue pentagons.
From Figure 4 it can be seen that a far larger fraction of DDGs are non-detections in the H-ATLAS survey. Indeed, considering all DDGs from A13/A15 11% (4/35) are H-ATLAS detections compared with 40% (45/113) of RDGs. The entire sample of A13/A15 represents 771 galaxies with 220 of these being H-ATLAS detections, or 29%. This clearly shows that, although a low fraction of visually classified galaxies host appreciable amounts of dust, it is far more likely for galaxies with kinematics dominated by rotation. In the following Sections, we examine more closely the kinematics of H-ATLAS detected and non-detected galaxies from A13/A15.
5.1.1 Kinematics of H-ATLAS Detected ETGs
As mentioned in Section 2.2, only 49 of the 220 H-ATLAS detected ETGs of A13/A15 have kinematics maps from the SAMI survey that meet our quality cuts, and this subset is shown in our vs diagram in Figure 4 with red circles. We find that 45/49 (90%) are RDGs, with 35 of these 45 having > 100 km s*-1*. This means that these galaxies derive a majority of their dynamical support from rotation as expected for LTGs, particularly for S0/Sa galaxies (as shown in Figure 2). Galaxies such as these may host an X-ray emitting halo if they are massive enough (Anderson et al., 2015, e.g.), however Negri et al. (2014a) and Negri et al. (2014b) have shown that rapid rotation can allow a galaxy to host a cold gas disk even in the presence of such a hot halo. Therefore the presence of dust in these systems does not require an external origin scenario such as galaxy mergers.
Next we investigate kinematics in our sample of four H-ATLAS detected DDGs. A comparison between kinematics of the gas and stars for these four galaxies can be seen in Figure 5, alongside their SAMI stellar and ionised gas kinematics and their H flux maps. All four galaxies exhibit discrepancies between their stellar and ionised gas kinematics, indicating that the dust in these galaxies is related to significant accretion events, such as galaxy mergers, in their evolutionary histories. Here we identify two classes of “kinematically irregular” galaxies, described in the following.
The first class of kinematically irregular galaxies are those with significant misalignments between the kinematic position angles of the stars and ionised gas. These galaxies have been identified by Bryant et al. (in preparation), and here we define kinematic misalignments as those galaxies with differences between the stellar and kinematic position angle of >30*∘. Kinematically misaligned galaxies such as these show the clearest evidence from SAMI observations of having undergone a stochastic event, such as gas accretion, in the relatively recent past (similar to non-SAMI works, e.g. Knapp et al., 1989; McDermid et al., 2006; Davis et al., 2011, 2015; van de Voort et al., 2015). Bryant et al. (in preparation) find that the cut in stellar versus gas position angle of 30∘* may not always provide an accurate descriptor of the fraction of misaligned galaxies due to observational issues (e.g. the depth of the data, see Bryant et al. in preperation), however this will not affect our conclusions as kinematically misaligned galaxies included in our H-ATLAS detected DDG sample have misalignments close to 90*∘*. Such a large difference between stellar and gas kinematics gives the clearest indication of recent accretion.
Galaxies 551505 and 534655 fall into this first class, with both exhibiting kinematic misalignments of 90*∘*. The two cases are not identical, however. 551505 displays rapid rotation in both stars and ionised gas measured to the edge of the SAMI fibre bundle, which may suggest that this is a polar ring galaxy, a relatively stable configuration resulting from merger activity (Bekki, 1998; Iodice et al., 2015, Bryant et al. in preparation). Galaxy 534655, on the other hand, exhibits very slow stellar rotation with a rapidly rotating ionised gas component in the central region possibly indicative of a nuclear starburst. From preliminary analysis of emission line ratios in the central region of this galaxy we find possible evidence of a low-ionization nuclear emission-line (LINER) like emission (Medling et al. in preparation), consistent with this picture. Nuclear starburst activity such as this has also been linked to merger activity in local luminous IR galaxies (LIRGS, Sanders et al., 1999; Bekki & Shioya, 2000; Hopkins et al., 2006; Haan et al., 2013).
In addition to kinematically misaligned galaxies, we also identify a second class of galaxies in which the stars and gas are kinematically aligned but have a significantly larger gas when compared to that of the stars. In order for a galaxy to be included in this classification we require the ratio of stellar to gas rotation, /, to be <0.6 noting that values observed in LTGs as a result of asymmetric drift (a phenomenon related to the aging of stellar populations Gomez & Mennessier, 1977; Westfall et al., 2007) fall in the range 0.75-0.9 (Martinsson et al., 2013; Cortese et al., 2014, 2016). If the origin of the ionised gas content of an ETG were closely related to the existing stellar component, we would expect the two to share similar kinematics, unlike what we see in such cases. This implies that / < 0.6 galaxies have experienced an accretion event in the past related to their gas and dust content, but the difference between the time this occurred and the time at which we observe the galaxy may be significantly longer than for kinematically misaligned galaxies depending on the dynamical relaxation time of the system. Estimates of the relaxation time of gas disks in merger remnants range from 1 Gyr to 5 Gyr (Lake & Norman, 1983; Davis & Bureau, 2016), however see Bryant et al. (in preparation) for discussion of dynamical relaxation time in SAMI survey galaxies.
The other two galaxies in Figure 5, 508180 and 511892, fall into our second class of kinematic irregularities. As noted, the typical values of / seen in LTGs due to asymmetric drift are 0.75-0.89, whereas in galaxies 508180 and 511892 this value is roughly half that at 0.35 and 0.49 respectively. One scenario would be a prograde minor merger where gas is accreted with a similar angular momentum as the accreting galaxy. Retrograde merger remnants are more likely to exhibit gas-stellar counter rotation after dynamical relaxation, particularly in cases where the primary galaxy is gas poor prior to the merger (e.g. Bassett et al., submitted to MNRAS).
Of the 45 H-ATLAS detected RDGs, four also show kinematic discrepancies similar to the four dusty DDGs. This is reasonable as minor mergers are not limited to massive, dispersion-supported galaxies. It is important to note that, although the dust content of some fraction of low-dispersion galaxies will indeed be related to accretion processes, these processes are not a necessity to account for the observed dust in the absence of a hot, X-ray halo. We also indicate with large symbols those H-ATLAS detected ETGs with log10() > 10.8, which Anderson et al. (2015) find is the limiting mass above which galaxies show clear evidence for an X-ray emitting ISM (see Section 5.2). Three RDGs fall in this category, however they all have > 160 km s*-1*. Negri et al. (2014a) and Negri et al. (2014b) show in simulations that, even in the presence of an X-ray halo, rapid rotation can allow for the presence of a cold gas disk. Furthermore, two of these massive RDGs have 75 km s*-1*, suggesting that these two galaxies do not follow the Faber-Jackson relation for massive ETGs (Faber & Jackson, 1976). This discrepancy between their large with a low clearly illustrates that these galaxies must derive a significant amount of support from rotation.
5.1.2 Kinematics of H-ATLAS Non-Detected ETGs
In this Section, we briefly discuss the integrated kinematics of H-ATLAS non-detections from A13/A15. These galaxies are indicated in Figure 4 as small cyan circles. Similar to H-ATLAS detected ETGs, we find that non-detected galaxies also occupy the full range in versus as the 540 SAMI galaxies with reliable measurements, including a significant number of RDGs. We do find, however, that a larger percentage of non-detected galaxies fall in our DDG kinematic selection at 31% (31/99) compared to 8% (4/49) for H-ATLAS detections.
Next we examine the level of kinematic irregularity among our 31 H-ATLAS non-detected DDGs. As discussed in the previous section, kinematically irregular galaxies are thus defined based on a comparison of their stellar and ionised gas kinematics. While all four of our H-ATLAS detected DDGs have strong ionised gas emission, only 35% (11/31) of H-ATLAS non-detected DDGs have ionised gas emission with a high enough signal-to-noise to evaluate this. Thus a majority (20/31) of H-ATLAS non-detected DDGs in our sample are poor in gas as well as dust, as is typical of low redshift ETGs. Among the H-ATLAS non-detected DDGs with ionised gas emission strong enough to measure rotation, 7/11 have kinematically misaligned gas and 4/11 exhibit / < 0.6 (specifically 0.09, 0.10, 0.27, and 0.56). This is similar to kinematic irregularities seen in H-ATLAS detected DDGs, therefore the presence of dust does not impact the relative dynamics of gas compared to stars in ETGs with significant gas. We note, however that the presence of ionised gas in the absence of a secure detection of dust emission is not inconsistent with the presence of a hot, X-ray emitting ISM in massive ETGs. We discuss this point further in Section 6.2.
For completeness we note that among the full sample of DDGs in our SAMI kinematics sample, 58% (41/71) have a high ionised gas emission with high enough signal-to-noise to measure rotation. Among this subsample, 22/41 exhibit kinematic misalignments while 13/41 fall in the / < 0.6 class. Given our small sample size, our finding that 54% of DDGs in our sample with appreciable amounts of ionised gas are kinametically misaligned agrees well with the work of Bryant et al. (in preparation). The authors find that, depending on the exact definitions, 40-53% of ETGs from the full SAMI survey with high signal-to-noise ionised gas emission are kinematically misaligned.
5.2 Dust Properties of H-ATLAS Detected ETGs
Having shown that a majority of the visually classified dusty, ETGs from A13/A15 are consistent with being rotationally-supported, we now investigate the dust content of our sample. Any differences between members of our kinematic selections (or lack thereof), may help to further identify the most likely origin scenario for their dust content. We present in Figures 6 and 7 the - and - relationships for our sample, with markers indicating our kinematic - selection. We also include upper limits on for H-ATLAS non-detections from A13/A15 as small black triangles.
In Figure 6, our observations of vs for A13/A15 galaxies are plotted over a large sample of “normal” star-forming SDSS galaxies taken from da Cunha et al. (2010), which represent the star-forming main sequence, plotted as small orange dots. Also plotted in Figure 6 is a linear fit to vs from da Cunha et al. (2010) given by the black dashed line.
In Figure 7, vs for A13/A15 galaxies are plotted over galaxies from the Herschel Reference Survey (HRS Boselli et al., 2010; Cortese et al., 2012), representing a wide range of galaxy types and environments. Visually classified LTGs from the HRS are given by light blue pentagons while orange pentagons show ETGs. Visual classifications for HRS galaxies are more reliable than those of SAMI galaxies, because HRS galaxies are extremely nearby objects. The relative proximity of HRS galaxies also means that they are sensitive to much lower levels of total than A13/A15, which is reflected in Figure 7 where HRS ETGs overlap with A13/A15 upper limits. This selection effect, however, will not affect our conclusions. We also plot in Figure 7 blue horizontal lines that correspond to stellar masses of galaxies from Anderson et al. (2015) that show evidence of an extended X-ray emitting halo. The solid blue line is located at log10(/) = 10.9, above which all galaxies show clear evidence of such a halo. Considering tentative detections, this can be extended to log10(/) = 10.8, indicated by the dashed blue line. Anderson et al. (2015) explore the relationship between X-ray luminosity () down to individual galaxy masses of log10(/) = 10.0 using stacking of X-ray observations. Below log10(/) = 10.8 they find no dependence between and , suggesting that the observed can be explained by SNe remnants and X-ray binaries rather than a hot gas halo. The results of Anderson et al. (2015) suggest that an alternative to using kinematics to select galaxies hosting X-ray gas halos is to employ a fixed stellar mass limit of log10(/) = 10.8.
Figure 6 shows that DDGs are found to host a lower SFR at fixed when compared to the bulk of RDGs; this difference is even greater when comparing to SDSS star-forming galaxies (a linear fit from da Cunha et al., 2010, is shown as a black dashed line). In Figure 7 it can also be seen that the DDGs are among the most massive galaxies in our sample, and they host extremely small dust reservoirs given their stellar masses. consistent with the assertion DDGs represent genuine massive, elliptical galaxies, likely to host a hot, X-ray emitting interstellar and/or intergalactic medium (Anderson et al., 2015).
Irregularities between stellar and gas kinematics favour a merger driven explanation for the dust content of H-ATLAS detected DDGs. In this scenario, these galaxies begin as typical quiescent ellipticals hosting very little molecular gas and dust (Leeuw et al., 2008; Young et al., 2011; Smith et al., 2012), thus occupying the upper left of Figure 7. These galaxies will then undergo minor mergers with gas rich satellites containing both star-forming gas and dust that is stripped by the central galaxy. A minor merger such as this will significantly increase while contributing negligibly to , thus moving galaxies horizontally towards the right. This is consistent with their location in Figure 7, offset from HRS LTGs and RDGs. Observations have also shown that the star formation efficiency of gas stripped from galaxies can be extremely low (Knierman et al., 2013; Jáchym et al., 2014), consistent with versus SFR for kinematic ETGs presented here.
RDGs more closely follow the relationship for normal star-forming galaxies of da Cunha et al. (2010) in Figure 6 than DDGs, and have a - relationship consistent with HRS LTGs. Although there are examples of suppressed star-formation at a wide range of dust masses, these are found to be within the scatter of the SDSS data. Recently Lianou et al. (2016) examined the scaling relations for ETGs in the HRS finding a significantly larger scatter for ETGs than that observed by da Cunha et al. (2010), with galaxies typically deviating to low SFR, consistent with results presented here. A possible explanation for the position of low SFR RDGs in Figure 6 is morphological quenching (Martig et al., 2009), where the efficiency of converting molecular gas into stars is reduced in the presence of a massive bulge. This has been seen in observations previously (Saintonge et al., 2012) and, given the known correlation between and bulge-to-total ratio (e.g. Lang et al., 2014), can also explain why all three RDGs with log10() > 10.8 exhibit a low SFR with a retention of their dust content.
6 Discussion
6.1 Moving Beyond Visual Classification of Galaxies
The dusty ETGs from A13/A15 studied here have been visually classified by both the GAMA team (Kelvin et al., 2014) and the SAMI team using essentially the same classification criteria. Two of the key differences between the classifications are that they are made up of independent groups of classifiers and they used different images in the classification process. GAMA classifications of Kelvin et al. (2014) are based on false colour , , and band composite images while SAMI classifications employ SDSS DR9 images. The use of longer wavelength data has resulted in the GAMA classifications tending somewhat towards earlier types. There is likely also an influence of the third key difference between SAMI and GAMA classifications, namely those of SAMI include signs of star formation (based on galaxy colour rather than morphology alone) to distinguish LTGs from ETGs. This would help to explain why such a large number of A13/A15 ETGs are identified as Sa galaxies, which are morphologically difficult to separate from S0 galaxies beyond = 0.05, but would be identified by SAMI as later types due to their blue colours. This difference is illustrated in the top panel of Figure 8 where we show the GAMA and SAMI classifications for the A13/A15 dusty ETGs studied here. We show classification histograms for H-ATLAS non-detections in the bottom panel of Figure 8 and, although GAMA classifications are still slightly skewed towards earlier types, the level of agreement is improved compared to H-ATLAS detections.
There is often an inherent assumption that there is a connection between visual classification of a galaxy as an ETG and the presence of a hot, X-ray emitting ISM (e.g. Rowlands et al., 2012; Martini et al., 2013, A13/A15). This may not be fully justified, and, in the case of A13/A15, the inclusion of a large number of Sa galaxies makes this connection more dubious. Comparing those GAMA ETGs containing dust to those that do not, A13 show that dusty ETGs are bluer, less concentrated, and have lower Sérsic indices. Further, A13 dusty ETGs have NUV-r colours more similar to H-ATLAS detected GAMA LTGs than to non-detected ETGs. Thus, from A13 there is already an indication that many H-ATLAS detected visual ETGs from GAMA have properties more like LTGs than giant ellipticals hosting X-ray halos.
The kinematic analysis of the 49 A13/A15 H-ATLAS detections with reliable SAMI observations agrees well with this assessment. In Section 5.1.1 we show that 44/49 of these galaxies have a versus in Figure 4 suggesting kinematics largely dominated by rotation (termed RDGs here). All of these galaxies have below 150 km s*-1* (with only 6 above = 100 km s*-1*), the approximate value above which galaxies have X-ray luminosities exceeding the value expected for the cumulative emission from supernova remnants and X-ray binaries in empirical studies (Boroson et al., 2011; Sarzi et al., 2013; Kim & Fabbiano, 2015; Goulding et al., 2016).
It has also been shown by Anderson et al. (2015) that can often be used to identify galaxies hosting an X-ray emitting ISM, with the clearest evidence found for galaxies with log10() > 10.8 . In fact, it is likely that is more fundamental in determining the presence of such a hot ISM as it is the high mass concentration of these galaxies that prevents hot gas from escaping into the inter-galactic medium. This means that is a secondary indicator arising through the relationship between and in ETGs (Faber & Jackson, 1976). This connection occurs because massive ETGs derive their dynamical support from random motions, which is not the case for galaxies with significant rotation.
Assuming is a better indicator for the presence of hot X-ray emitting gas than in rotating galaxies, we also identify those H-ATLAS detected RDGs with log10() > 10.8 in Figure 4. 41/44 H-ATLAS detected RDGs are found to have masses below this limit, supporting our assertion that they do not host a hot ISM. Although the remaining three RDGs are massive enough to host an X-ray emitting halo, they are also found to have rapid rotation, with > 160 km s*-1* in all three cases. Negri et al. (2014a) and Negri et al. (2014b) have shown that rapid rotation allows massive galaxies to host a disk of cold gas even in the presence of an X-ray emitting halo. This means that, regardless of the properties of the ISM in these three galaxies, dust residing in their disks can be long lived, thus an external origin for their dust content is unnecessary.
Thus, the visual classification of a galaxy as an ETG should not be assumed as clear evidence for the presence of a hot ISM that is inhospitable to dust, in agreement with previous works (e.g. Sansom et al., 2000; Sansom et al., 2006). On the contrary, despite their appearance many visually-classified ETGs are actually rotationally-supported, disk-like, star-forming galaxies with a relatively normal dust content comparable to galaxies found on the star-forming main sequence. In other words, the term early-type in this case does not imply structural difference, but mainly a difference in colour and possibly SFR. This means that the dust content of these galaxies is likely produced internally through normal processes such as supernovae and stellar winds without the need for external mechanisms such as cooling flows or minor mergers.
6.2 Dispersion Dominated Galaxies, Dust, and Merger Rates
From our sample of 49 dusty ETGs from A13/A15 with reliable SAMI observations, we identify 4 galaxies in Figure 4 that are kinematically consistent with being dispersion-dominated systems. SDSS DR9 images of these galaxies are shown in Figure 5 alongside velocity and velocity dispersion maps from the SAMI galaxy survey. All four galaxies exhibit inconsistencies between their stellar and ionised gas indicating recent stochastic processes such as gas accretion through merging. Galaxies 551505 and 534655 are found to have kinematic misalignments of 90*∘* while 508180 and 511892 have stellar to gas ratios < 0.60, inconsistent with the range observed for asymmetric drift in LTGs (0.75-0.89 Martinsson et al., 2013; Cortese et al., 2016). Furthermore, the regular appearance of these galaxies from SDSS observations suggests that if mergers are responsible for these kinematic inconsistencies then these mergers must either be minor, as major mergers typically result in disturbed morphologies (e.g. Larson et al., 2016), or they occurred in the fairly distant past thus having allowed significant time for dynamical relaxation. A possible caveat, however, is that observations deeper than those from SDSS may reveal disturbed morphologies apparent as low surface brightness features (e.g. Sheen et al., 2012).
Evidence that the dust content of these four galaxies may have been recently accreted comes by comparing to other galaxy properties. First, Figure 6 shows that DDGs have suppressed SFR compared to normal star-forming galaxies, a feature seen in simulations of wet minor mergers (Peirani et al., 2010; Davis et al., 2015; Geréb et al., 2016). DDGs are also significantly offset above the - relationship for star-forming galaxies shown in Figure 7, similar to dusty ETGs from Dariush et al. (2016) who observe little variation in with varying . This lack of a correlation is suggested as further evidence of external accretion. Indeed, extremely dust poor massive elliptical galaxies will fall far above the - trend for star-forming galaxies, occupying the top left region of Figure 7. A subsequent wet minor merger will provide a negligible increase in while significantly increasing , thus the merger remnants will move horizontally to the right in Figure 7 towards the region occupied by kinematic ETGs discussed here.
Assuming all four H-ATLAS detected DDGs in this work have acquired their dust content in a merger, how do our results compare with expectations based on the cosmological rates of mergers at low redshift? Martini et al. (2013) compare the measured rate of minor mergers to the theoretical estimates of the destruction time for dust in hot gas of Draine & Salpeter (1979). Following Stewart et al. (2009), the authors make a rough prediction of the expected fraction of dusty ETGs, , based on estimates of the merger rate of Gyr*-1* and a dust lifetime of < 0.02 Gyr following
[TABLE]
This gives < 0.14-0.4% implying that a purely external accretion scenario for large samples of dusty ETGs is extremely unlikely from a statistical perspective. The results of our study provide a possible solution to this tension. First we note that the fraction of ETGs with dust quoted by Martini et al. (2013) is 0.6, whereas for GAMA ETGs in A13 there is only a 29% detection rate from the H-ATLAS survey. As we have shown, however, many of these galaxies are kinematically inconsistent with the presence of a hot ISM. Among DDGs, we find an even lower H-ATLAS detection rate of 11% (4/35), a factor of 5 lower than the value assumed by Martini et al. (2013), yet still significantly larger than their predicted value of < 0.14%.
The argument of (Martini et al., 2013), however, is dependent on a number of assumptions regarding the timescales and conditions of dust accretion in ETGs. Some works have estimated a timescale for gas stripping on the order of a few times 108 yr (Takeda et al., 1984; Murakami & Babul, 1999), which could further increase predictions by an order of magnitude to 1.4-4.0%. The remaining tension between this estimate and the estimate of =11% found in this work may be partially due to incompleteness as a result of our small sample size. Another possibility, though, is the recent suggestion that accretion of dust that is embedded in a larger cold medium may be shielded from the harsh ISM resulting in a further significant increase in dust lifetimes (e.g. Clemens et al., 2010; Dasyra et al., 2012; Finkelman et al., 2012). A full understanding of just how much longer dust may survive in such a scenario is beyond the scope of this work. It should also be noted that, in those galaxies with / < 0.6, the fact that the gas is kinematically aligned with the stars suggests that if the presence of the dust is truly the result of a merger then it must have had sufficient time to undergo dynamic relaxation. This process should occur on Gyr timescales (Lake & Norman, 1983; Davis & Bureau, 2016), supporting the idea that the direct, sub-galactic, environment of dust in ETGs may drastically increase the lifetime of interstellar dust.
We can also discuss the comparison between stellar and ionised gas kinematics of dust-free DDGs in this study, i.e. H-ATLAS non-detections from A13/A15. Of the 31 H-ATLAS non-detected DDGs included here, 36% (11/31) show signs of kinematic discrepancies between their ionised gas and stars. Among these 11, 7/11 are kinematically misaligned while 4/11 are aligned with significantly larger gas compared to that of the stars. The remaining 20 galaxies, however, do not have secure enough detections of ionised gas to provide clean ionised gas kinematics maps. Considering our entire sample of 540 SAMI galaxies with high quality stellar kinematics observations, we find a total subsample of 71 DDGs. Out of these, 49% (35/71) show kinematic irregularities, however only 58% (41/71) have strong ionised gas detections. Among the 35 kinematically irregular DDGs, 22 are kinematically misaligned while the remaining 13 have aligned ionised gas rotating significantly faster than the stars. Our finding that 54% (22/41) of DDGs with appreciable amounts of ionised gas are kinematically misaligned agrees well with the findings of Bryant et al. (in preparation) who find that, among a larger sample of SAMI galaxies, 40-53% of ETGs with high signal-to-noise ionised gas emission exhibit kinematically misaligned gas.
This begs the question, how are kinematically irregular, H-ATLAS non-detected DDGs related to DDGs with H-ATLAS detections? The strongest statement we can make in this regard is that the presence of dust does not have a large impact on the relative dynamics of gas and stars in DDGs with significant gas. As we do not have strong constraints on the possible dust content of H-ATLAS non-detected galaxies, unlike H-ATLAS detections, we do not have the secondary indications of a mergers as an explanation for their kinematic irregularity (e.g. vs ). We can simply say that the presence of ionised gas is likely associated with a stochastic process that has also affected the gas kinematics in these galaxies. Unlike dust, however, ionised gas is not always directly associated with cold gas in galaxies. Indeed, a number of works have shown that old stellar populations (such as post-AGB stars), active galactic nuclei (AGN), or even interactions between warm and hot (X-ray emitting) gas phases may be the dominant sources of ionised gas emission in ETGs (e.g. Binette et al., 1994; Sarzi et al., 2010; Yan & Blanton, 2012). This means that the detection of ionised gas emission in the absence of a secure detection of cold dust is not inconsistent with the presence of a hot, X-ray emitting ISM.
A caveat here, however, is that some H-ATLAS non-detected galaxies from A13/A15 (particularly those DDGs with strong ionised gas emission) may contain appreciable amounts of dust, but have far-IR fluxes below the sensitivity limits of H-ATLAS. Assuming the presence of ionised gas is always associated with dust in our sample of SAMI galaxies would increase our estimate of the number of DDGs with dust to 58% (41/71). Thus the level of tension between merger rates and dust lifetimes in ETGs here would roughly match that seen by Martini et al. (2013). This assumption, however, is unfounded and, as we have noted, estimates of dust lifetimes in the presence of a complex, multiphase ISM in ETGs are equally uncertain. Further study of the ISM of massive galaxies and the precise conditions of gas accretion onto these systems will be required to understand the underlying cause of this tension.
Finally, we note that out of the 41 DDGs from our full SAMI sample that exhibit appreciable ionised gas emission, 5 do not show clear discrepancies between ionised gas and stellar kinematics. These galaxies, however, have not been observed by H-ATLAS, thus the presence of dust is uncertain. Given the above discussion regarding sources of ionising radiation in ETGs, unless these galaxies can be shown to host cold gas or dust, they should not be considered to be peculiar objects.
7 Summary
In this paper we have analysed the 2D kinematics of visually classified ETGs from Agius et al. (2013) and Agius et al. (2015) (A13/A15) using IFS data from the SAMI Galaxy Survey. The sample of A13/A15 includes 220 H-ATLAS detected (dusty) galaxies and 551 H-ATLAS non-detected (dust-free) galaxies. We begin by measuring the stellar circular velocity, , and flux-weighted, global, stellar velocity dispersion, , for a sample of 540 SAMI galaxies for which we can measure beyond the turnover radius of the rotation curve. These values provide a kinematic selection designed to determine those visual ETGs that are consistent with having dispersion-dominated stellar kinematics, indicative of the presence of a hot, X-ray emitting ISM. This selection is then applied to visually classified ETGs from A13/A15 that have currently been observed with SAMI. Finally, we examine the dust properties of these galaxies in comparison with our kinematic selection in order to better understand the origin of the dust in these systems. Our key results are as follows:
- •
Selecting A13/A15 ETGs based on and we find 11% (4/35) of dispersion-dominated A13/A15 galaxies are H-ATLAS detected. This is in contrast to the 29% (220/771) detection rate for the full A13/A15 sample and 40% (45/113) for rotation-dominated galaxies. Thus the detection of dust in visually classified ETGs is 3.5 more likely in galaxies with disk-like rotation than in those with kinematics more consistent with massive elliptical galaxies.
- •
Similarly, only 8% (4/49) of H-ATLAS detected ETGs from A13/A15 with SAMI observations are kinematically consistent with being true, dispersion-dominated galaxies. The remainder have kinematics more similar to blue, visually-classified LTGs and S0/Sa galaxies.
- •
100% of these dispersion-dominated, dusty ETGs exhibit inconsistencies between their stellar and ionised gas kinematics suggestive of recent merger activity and an external origin for their dust content. The corresponding rate of gas versus stellar kinematic discrepancies in our full sample of dispersion-dominated SAMI galaxies is 45% (34/75).
- •
The four dispersion-dominated, dusty ETGs in our sample are also extremely massive and thus quite likely to host a hot, X-ray emitting halo. As such, external accretion scenario is the most viable source for their dust content. Observations of a suppressed star formation in these four galaxies, typical of gas accreted onto massive galaxies (e.g. Geréb et al., 2016), further supports this assertion.
- •
The low velocity dispersions as well as low masses and/or rapid rotation of the remaining galaxies, suggest that dust in these systems may be long-lived thereby eliminating any need for an external scenario for the origin of their dust content.
We have shown that these results may help to reduce the tension between expected dust lifetimes in massive ETGs (Draine & Salpeter, 1979; Clemens et al., 2010), observed merger rates (Lotz et al., 2011), and the observed number of visual ETGs containing dust (Martini et al., 2013). A more complete understanding of the complex, multiphase ISM of massive ETGs, as well as the exact conditions through which gas is accreted onto these systems, will be necessary in understanding this tension fully.
RB acknowledges support under the Australian Research Council’s (ARC) Discovery Projects funding scheme (DP130100664). JvdS is funded under Bland-Hawthorn’s ARC Laureate Fellowship (FL140100278). SMC acknowledges the support of an Australian Research Council Future Fellowship (FT100100457). SB acknowledges the funding support from the Australian Research Council through a Future Fellowship (FT140101166). Support for AMM is provided by NASA through Hubble Fellowship grant #HST-HF2-51377 awarded by the Space Telescope Science Institute, which is operated by the Association of Universities for Research in Astronomy, Inc., for NASA, under contract NAS5-26555. M.S.O. acknowledges the funding support from the Australian Research Council through a Future Fellowship Fellowship (FT140100255). We would also like to thank the anonymous referee for comments and suggestions that have improved the clarity and readability of this work. The SAMI Galaxy Survey is based on observations made at the Anglo-Australian Telescope. The Sydney-AAO Multi-object Integral field spectrograph (SAMI) was developed jointly by the University of Sydney and the Australian Astronomical Observatory. The SAMI input catalogue is based on data taken from the Sloan Digital Sky Survey, the GAMA Survey and the VST ATLAS Survey. The SAMI Galaxy Survey is funded by the Australian Research Council Centre of Excellence for All-sky Astrophysics (CAASTRO), through project number CE110001020, and other participating institutions. The SAMI Galaxy Survey website is http://sami-survey.org/. GAMA is a joint European-Australasian project based around a spectroscopic campaign using the Anglo-Australian Telescope. The GAMA input catalogue is based on data taken from the Sloan Digital Sky Survey and the UKIRT Infrared Deep Sky Survey. Complementary imaging of the GAMA regions is being obtained by a number of independent survey programmes including GALEX MIS, VST KiDS, VISTA VIKING, WISE, Herschel-ATLAS, GMRT, and ASKAP providing UV to radio coverage. GAMA is funded by the STFC (UK), the ARC (Australia), the AAO, and the participating institutions. The GAMA website is http://www.gama-survey.org/.
Appendix A Dust Mass Upper Limits for H-ATLAS
Non-Detections
As described in Section 3.2, for H-ATLAS detected galaxies is measured by the GAMA survey team using the MAGPHYS spectral fitting code of da Cunha et al. (2008). MAGPHYS relies on detections in the far-IR in order to provide reliable estimates of , therefor those values provided by MAGPHYS for H-ATLAS non-detected galaxies are highly uncertain. Thus, for these galaxies we estimate upper limits on the dust masses in the following manner:
First we take the upper limit for the flux in the 250 m Herschel SPIRE band, , to be 33 mJy (Dunne et al., 2011). This is then converted to an upper limit on using (Hildebrand, 1983):
[TABLE]
where is the luminosity distance to each galaxy, computed from spectroscopic redshifts, is the mass absoprtion coefficient assumed to be 0.89 m2 kg*-1* at 250 m (Dunne et al., 2011), and is the Planck function at 250 m and at dust temperature . For all non-detected galaxies we simply fix at 22.1 K, the average value computed through grey-body fitting for H-ATLAS detected sources from A13. Equation 4 also includes a factor of (1+) and a -correction, which is given by:
[TABLE]
where and are the observed and rest-frame frequency, is the dust emissivity index (fixed at 1.5 Dye et al., 2010), is the Planck constant, and is the Boltzmann constant. upper limits are depicted along side MAGPHYS dust masses for H-ATLAS detections in Section 5.2.
Appendix B Rotation Curve Extraction and Measurement of
After measuring the kinematic PA of our kinematics maps, we use this value as input in extracting the rotation curves for each galaxy. This is done by first determining the and positions of the galaxy centre from the stellar flux maps, using:
[TABLE]
where and are the x and y positions of the galaxy centre. An artificial slit with a width of 15 (3 spaxels) is traced across the stellar velocity map with its position defined by the measured PA and galaxy centre. Examples of these artificial slits are shown in green in the right column of Figure 9. The radius, , and velocity, , are recorded at each spaxel within the slit. Here we define with the sign taken to match the sign of . The choice of the definition of positive and negative radii is arbitrary, however, as this simply defines a positive or negative . In the end, the final value of the circular velocity is taken as .
The stellar rotation curves extracted in this way are then used to determine the rotation velocity following the procedure of Epinat et al. (2009). This is done by fitting a piecewise function of the form:
[TABLE]
where is the turn-over radius of the rotation curve that defines where the flat portion of the rotation curve begins. This value is left as a free parameter. Examples of these fits for galaxies with low and high (apparent) are shown in the left column of Figure 9. Although a fairly common feature of galaxy rotation curves is a decline in beyond the turnover radius, (e.g. de Blok et al., 2008), the coverage of our datacubes often does not extend to large enough radii to capture this behaviour. Thus we choose to use the relatively simple model given in Equation 7 as including more parameters is more likely to result in spurious fits, particularly for low S/N spaxels at large radii.
This procedure has the inherent assumption that the 80 covered by SAMI datacubes is larger than , which is not true for many galaxies. We check whether or not observations of each galaxy extend beyond to test this. For each galaxy we first identify the spaxel in our traced slit that is furthest from . If the radius measured for this spaxel is larger than then we flag this as a reliable measurement of . We also visually inspect the rotation curve fits for each galaxy flagged as reliable for verification, and in this process, a small number of galaxies were identified with spurious fits and subsequently flagged and removed from our sample. Finally, some SAMI observations include a low number of spaxels with high signal-to-noise data, which will reduce the reliability of our fitted value of . We perform a test using galaxies with high fidelity rotation curves in which we incrimentally reduce the artificial slit length by one spaxel and remeasure . We find that for slits containing more than 30 spaxels we are able to recover measured from the full slit for
95% of galaxies tested. This fraction falls off rapidly below 30 spaxels, thus galaxies for which slits contain less than 30 spaxels are excluded from our analysis. Among the 753 galaxies tested, we find that 554 galaxies meet these requirements.
We next correct our stellar measurements for the effects of inclination, which causes observed ’s to be lower than the intrinsic rotation velocity of a given galaxy. First we determine the inclination of each galaxy using
[TABLE]
where is the galaxy inclination, is the observed ellipticity, and is the intrinsic flattening for a given galaxy. For each galaxy we provide a rough estimate of based on the following criteria: first we separate galaxies into those that are strongly disk-dominated from those with a significant influence from a central bulge. The former are identified as having bulge to total ratios (B/T) less than 0.3 while the latter have B/T larger than 0.3, which roughly follows the findings of Graham & Worley (2008). Here we take B/T from -band values of Simard et al. (2011) who perform 2D bulge+disk decompositions for SDSS galaxies using the GIM2D software (v3.2 Simard et al., 2002). For disk-dominated galaxies we fix at 0.23, which is the average value found when comparing values reported for spiral galaxies by Lambas et al. (1992) and Padilla & Strauss (2008). Galaxies with B/T > 0.3 are then separated into pure ellipticals and S0/Sa galaxies based on SAMI morphological classifications. We assign an of 0.55 to the S0 and Sa classes (Lambas et al., 1992; Noordermeer, 2006) and a value of 0.63 to elliptical galaxies, the former being the average value found for slow rotators in the ATLAS survey (Weijmans et al., 2014). This large value for elliptical galaxies is appropriate because these object appear relatively round even when the viewing angle is perpendicular to the axis of rotation. Galaxies with low intrinsic rotation and a spheroidal shape, for example, would have significantly over estimated if it is assumed the galaxy is much flatter. Thus adopting =0.63 for elliptical galaxies provides a conservative correction appropriate for dispersion-supported galaxies. The exact assumptions regarding will have only a minor effect on our results as this value is used to correct while, as we will show in Section 4.3, our kinematic selection is primarily based on stellar velocity dispersion.
Finally, we compute the inclination corrected stellar , , as
[TABLE]
This correction inherently assumes that galaxies observed face-on are perfectly circular, which is certainly not accurate for all galaxies. By construction, this process has a relatively small effect on ETGs while LTGs may have underestimated by up to 270 km s*-1*. This is typically the case galaxies observed close to face-on, for which is already quite uncertain, however. Among the 563 galaxies with well sampled rotation curves, we find a median increase in due to our inclination correction of 4.7 km s*-1*, and only 7% have an increase in of more than 50 km s*-1*. As we are interested in ETGs in this work, cases such as this will not affect our results.
Appendix C : Masking and Beam Smearing
Correction
In this appendix we describe in detail our methods of masking bad spaxels prior to measuring and correcting for the effects of seeing, commonly referred to as beam smearing.
We define bad spaxels as those that do not satisfy km s*-1*. This requires the measured error in in each spaxel to be smaller than a fraction of the measured . The inclusion of the km s*-1* is needed in order that we do not exclude a majority of spaxels with a low measurement of . Finally, we also exclude spaxels with < 35 km s*-1*, which is the limit to which we trust our measurements (see van de Sande et al., 2017, for more details), for more on tests of our pPXF procedure). is then measured as the flux weighted velocity dispersion over unmasked spaxels in our stellar velocity dispersion maps. Formally this is defined as:
Our measurements of employ all spaxels meeting the quality cut described above. We test the robustness of by remeasuring this value within radii between 10 and 80 (2-16 spaxels). We find that measurements level off beyond 15, and remain unchanged out to 80. This means that measurements are robust for all galaxies that meet our quality cut, i.e. velocities are measured beyond .
The major difficulty in estimating the global velocity dispersions from IFS observations is accounting for the effects of beam smearing, which can artificially inflate measured in individual spaxels (e.g. Pracy et al., 2005; Law et al., 2009). This effect is enhanced in the central regions of rapidly rotating galaxies where large velocity gradients are observed over individual spaxels. Beam smearing is a complex effect, acting in all three dimensions of IFS datacubes, and a significant ongoing effort to understand beam smearing in SAMI data is underway. In the meantime, we perform a simple beam smearing correction on following Bassett et al. (2014). For each galaxy we estimate the additional induced by beam smearing, , as:
[TABLE]
where is the velocity gradient defined by our fits as (see 4.1), is the spaxel size of 05, and is the seeing of our observations. Seeing values for SAMI galaxies are catalogued at the time of observation with the median seeing at the AAT site being 18. We estimate a “beam smearing corrected” as . The typical corrections measured in this way reduce the measured by 0-30 km s*-1* with a clear dependence on . Below = 60 km s*-1*, corrections are closer to 0-5 km s*-1*. Note that this may result in measured values of below 35 km s*-1*, which we regard as the lower limit to which we trust measurements of the stellar in individual spaxels. Prior to performing our beam smearing correction, all measured values are larger than 40 km s*-1*, thus values below 35 km s*-1* are entirely resultant from our beam smearing correction.
We note that rotation curves may also be affected by beam smearing, in particular the velocity gradient in the central regions. Our measure is largely constrained by the asymptotic velocities at large radii and thus will be minimally affected by beam smearing (if at all). We deem the correction described here necessary, however, as this is a flux weighted quantity, is biased towards the central regions where beam smearing effects are at a maximum.
The reference list from the paper itself. Each links out to its DOI / PubMed record.
- 1Agius et al. (2013) Agius N. K., et al., 2013, MNRAS , 431, 1929 · doi ↗
- 2Agius et al. (2015) Agius N. K., et al., 2015, MNRAS , 451, 3815 · doi ↗
- 3Anderson et al. (2015) Anderson M. E., Gaspari M., White S. D. M., Wang W., Dai X., 2015, MNRAS , 449, 3806 · doi ↗
- 4Athey et al. (2002) Athey A., Bregman J., Bregman J., Temi P., Sauvage M., 2002, Ap J , 571, 272 · doi ↗
- 5Balcells & Quinn (1990) Balcells M., Quinn P. J., 1990, Ap J , 361, 381 · doi ↗
- 6Baldry et al. (2010) Baldry I. K., et al., 2010, MNRAS , 404, 86 · doi ↗
- 7Bassett et al. (2014) Bassett R., et al., 2014, MNRAS , 442, 3206 · doi ↗
- 8Bekki (1998) Bekki K., 1998, Ap J, 499, 635