First results from the TUS orbital detector in the extensive air shower mode
B.A. Khrenov, P.A. Klimov, M.I. Panasyuk, S.A. Sharakin, L.G. Tkachev,, M.Yu. Zotov, S.V. Biktemerova, A.A. Botvinko, N.P. Chirskaya, V.E. Eremeev,, G.K. Garipov, V.M. Grebenyuk, A.A. Grinyuk, S. Jeong, N.N. Kalmykov, M. Kim,, M.V. Lavrova, J. Lee, O. Martinez, I.H. Park

TL;DR
The TUS satellite, as the first space-based detector for ultra-high-energy cosmic rays, has collected atmospheric ultraviolet data, revealing diverse emissions and laying groundwork for future space observatories despite not conclusively detecting cosmic rays yet.
Contribution
This paper presents the first operational results of the TUS orbital detector, testing space-based detection techniques for extensive air showers caused by extreme energy cosmic rays.
Findings
Rich diversity of atmospheric ultraviolet emissions observed.
No conclusive detection of ultra-high-energy cosmic rays yet.
Data aids development of future orbital cosmic ray detectors.
Abstract
TUS (Tracking Ultraviolet Set-up), the first orbital detector of extreme energy cosmic rays (EECRs), those with energies above 50 EeV, was launched into orbit on April 28, 2016, as a part of the Lomonosov satellite scientific payload. The main aim of the mission is to test a technique of registering fluorescent and Cherenkov radiation of extensive air showers generated by EECRs in the atmosphere with a space telescope. We present preliminary results of its operation in a mode dedicated to registering extensive air showers in the period from August 16, 2016, to November 4, 2016. No EECRs have been conclusively identified in the data yet, but the diversity of ultraviolet emission in the atmosphere was found to be unexpectedly rich. We discuss typical examples of data obtained with TUS and their possible origin. The data is important for obtaining more accurate estimates of the nocturnal…
Click any figure to enlarge with its caption.
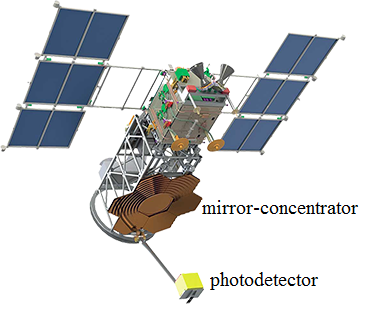 Figure 1
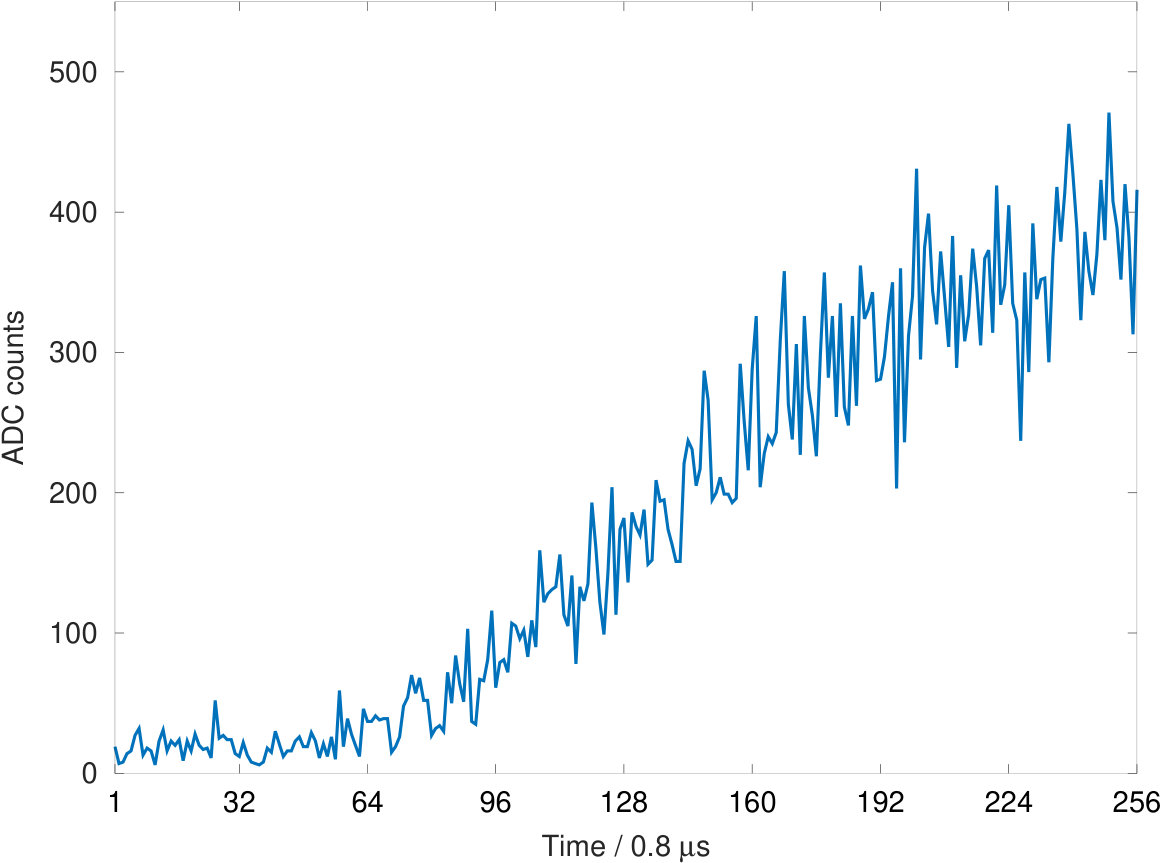 Figure 2
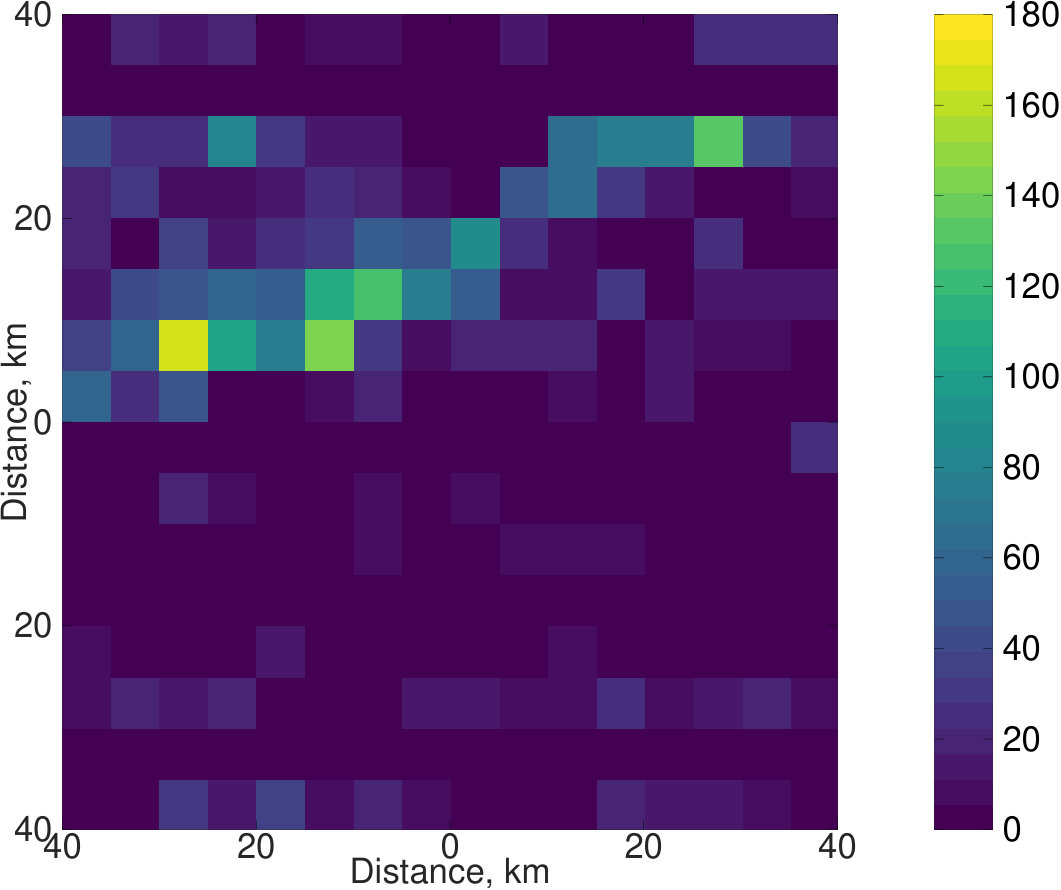 Figure 3
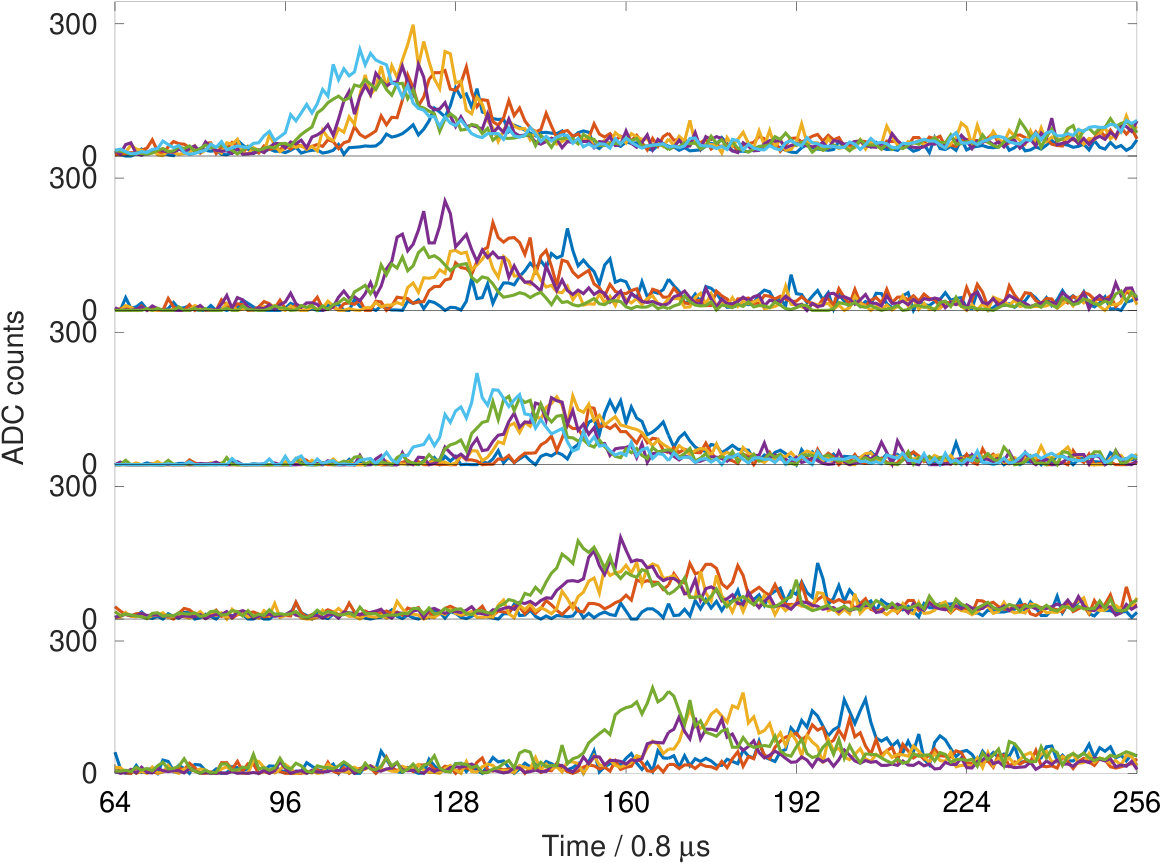 Figure 4
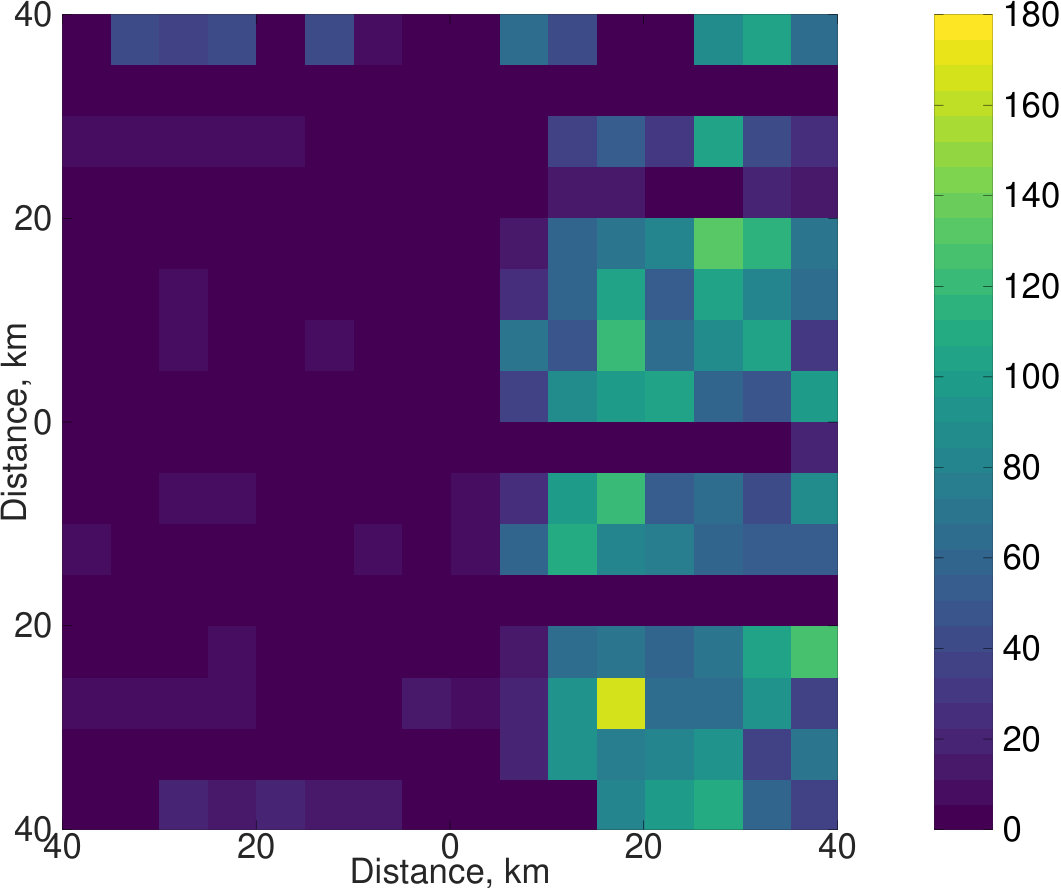 Figure 5
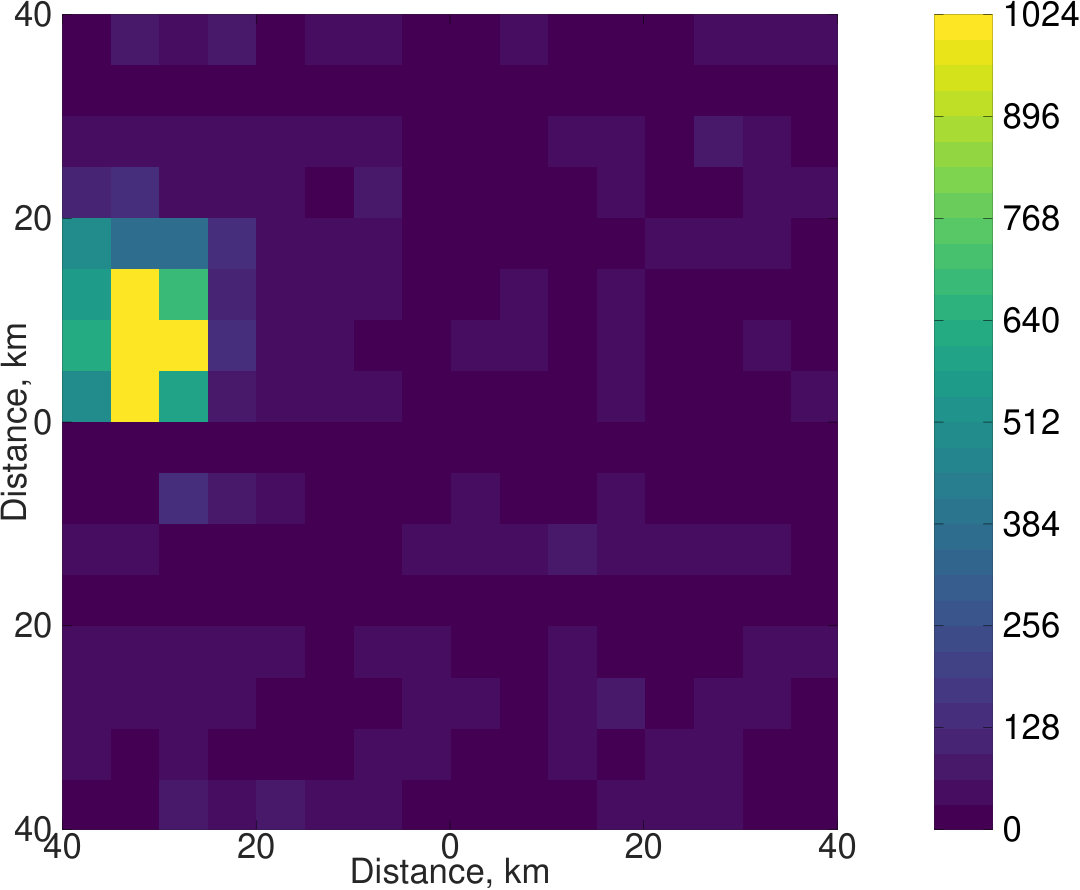 Figure 6
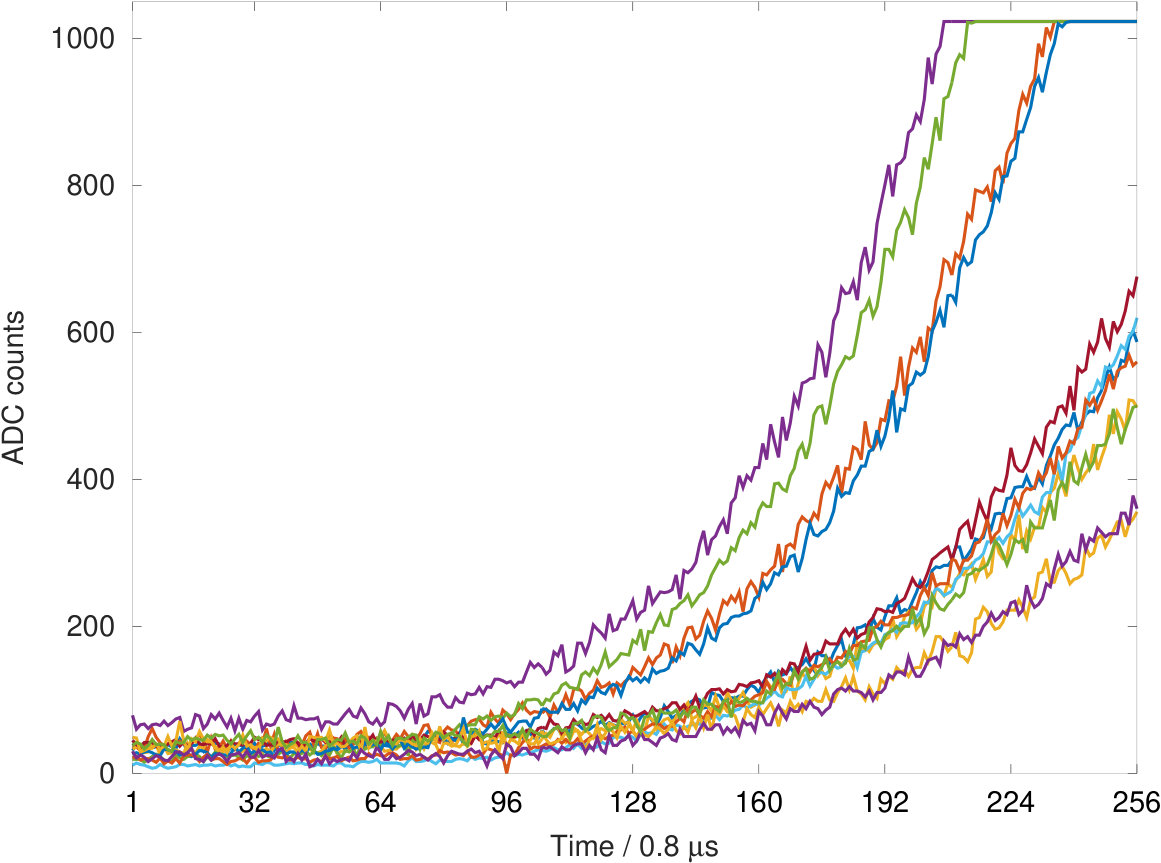 Figure 7
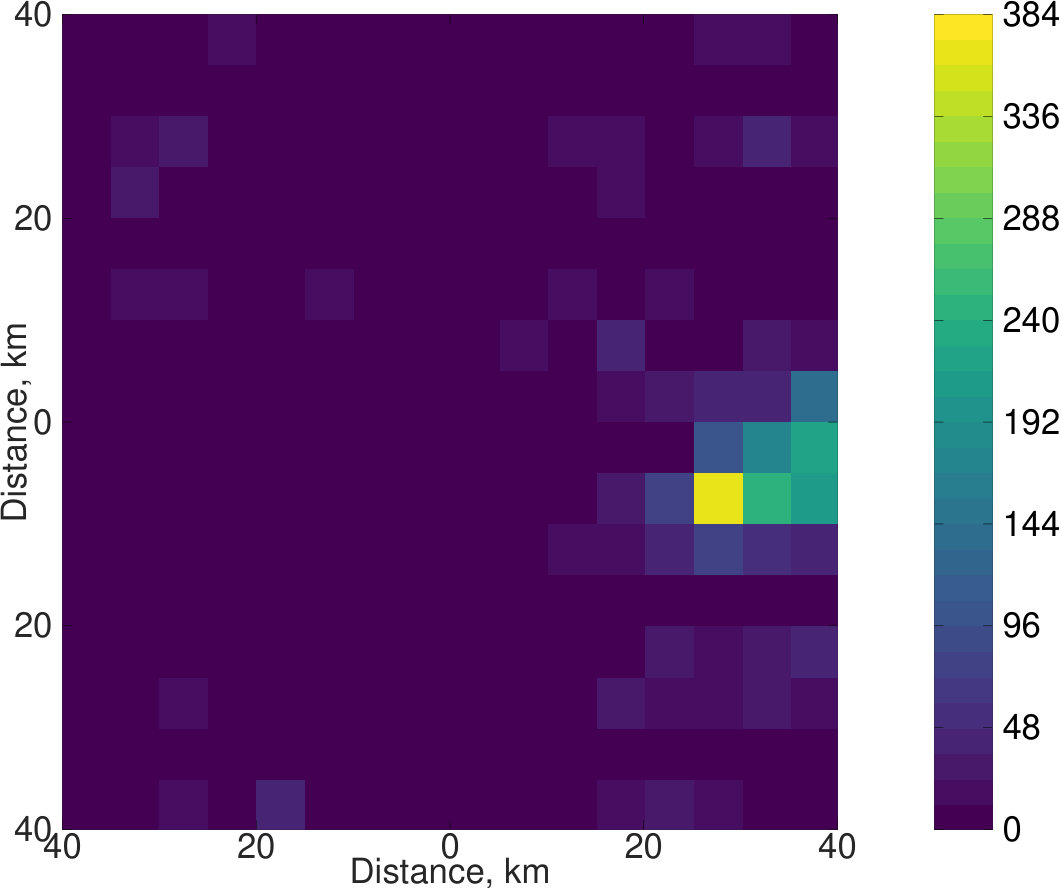 Figure 8
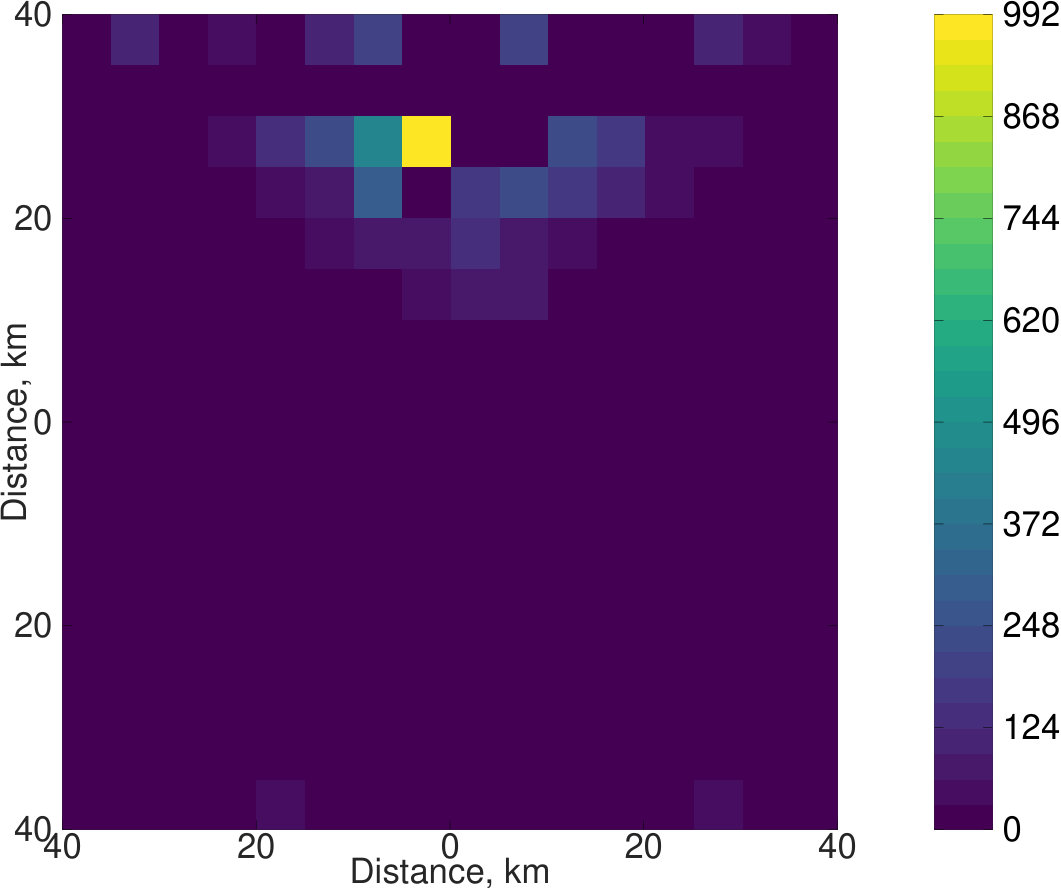 Figure 9
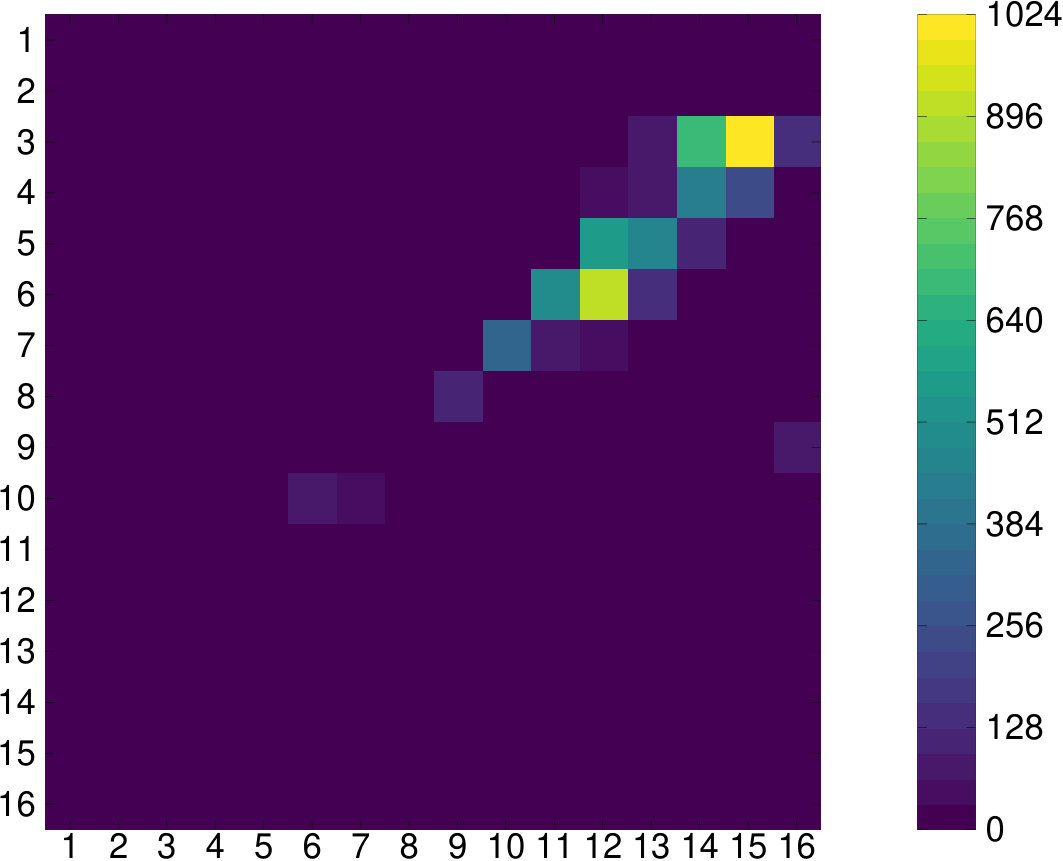 Figure 10
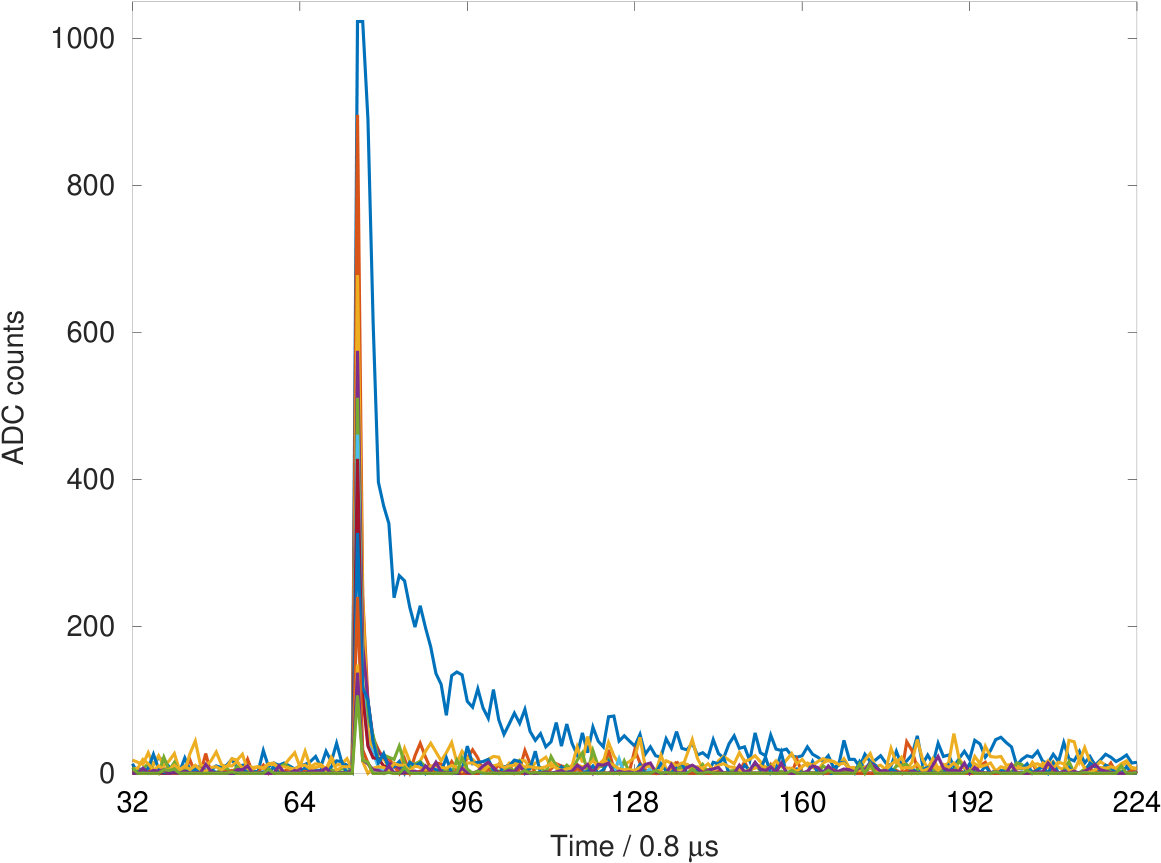 Figure 11
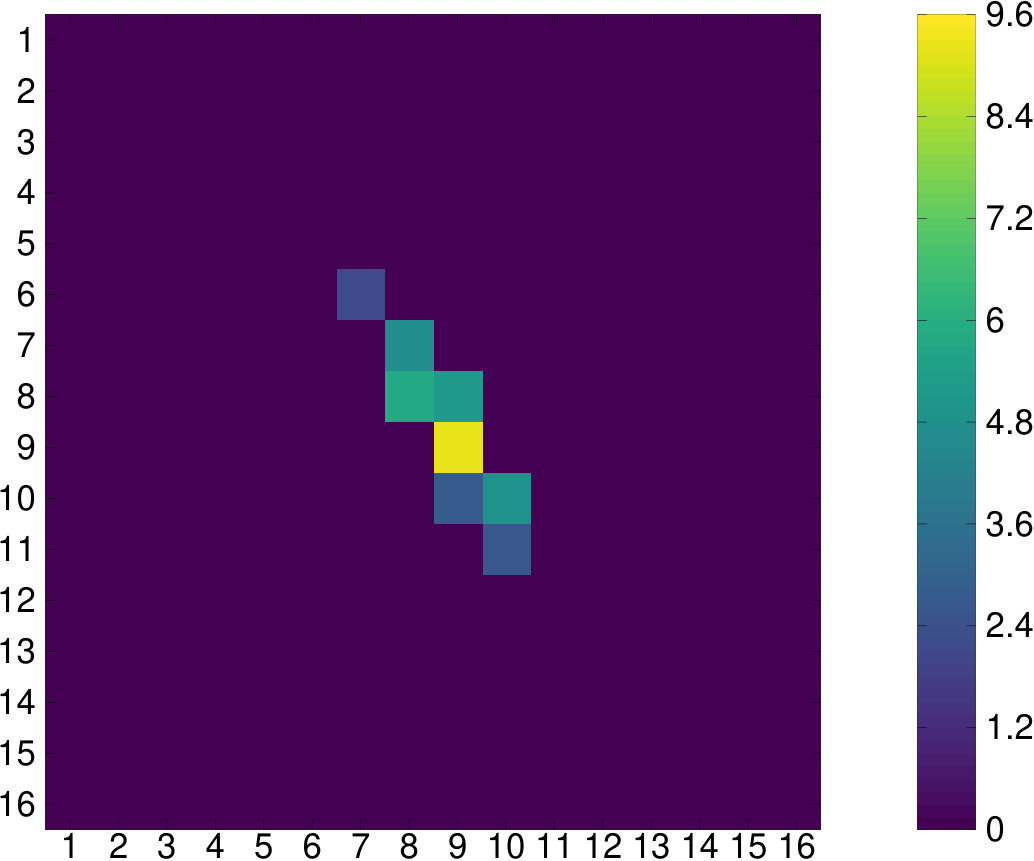 Figure 12
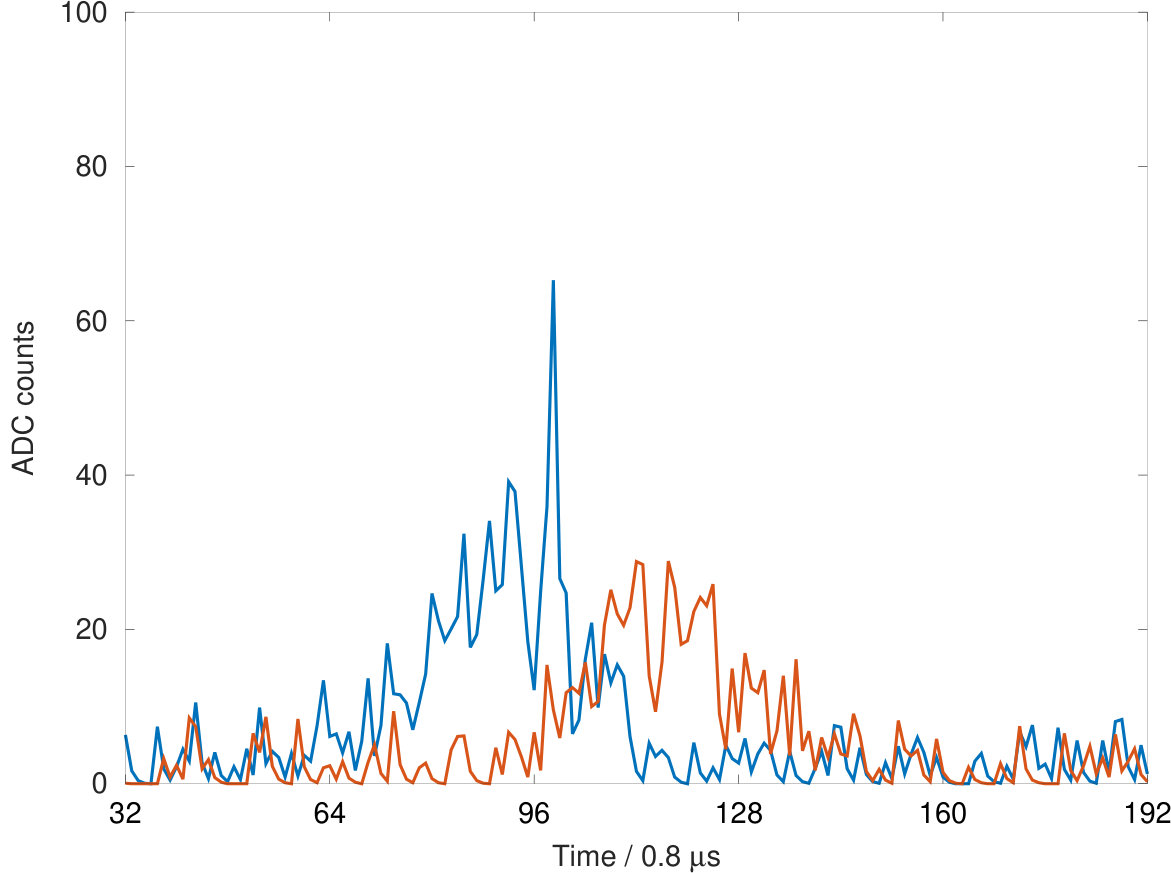 Figure 13
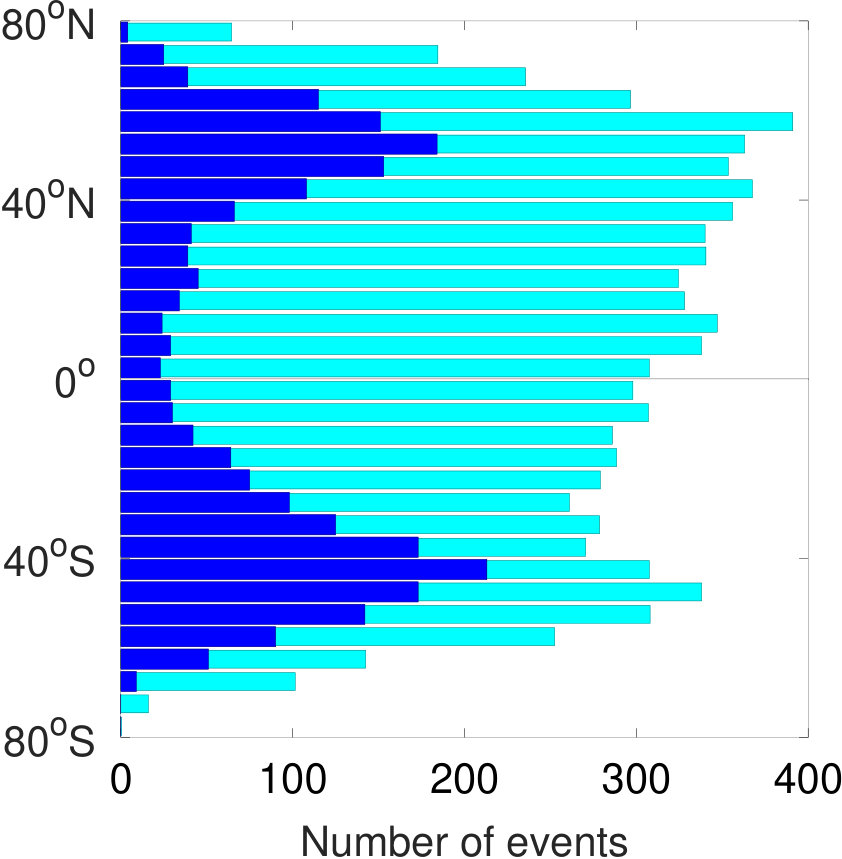 Figure 14
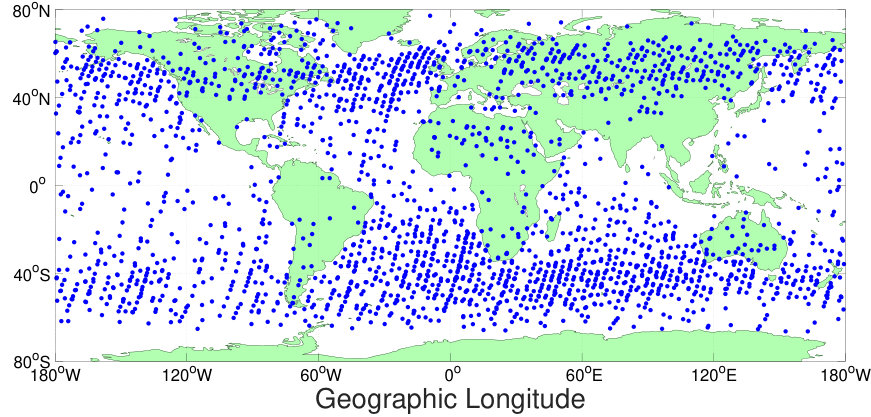 Figure 15
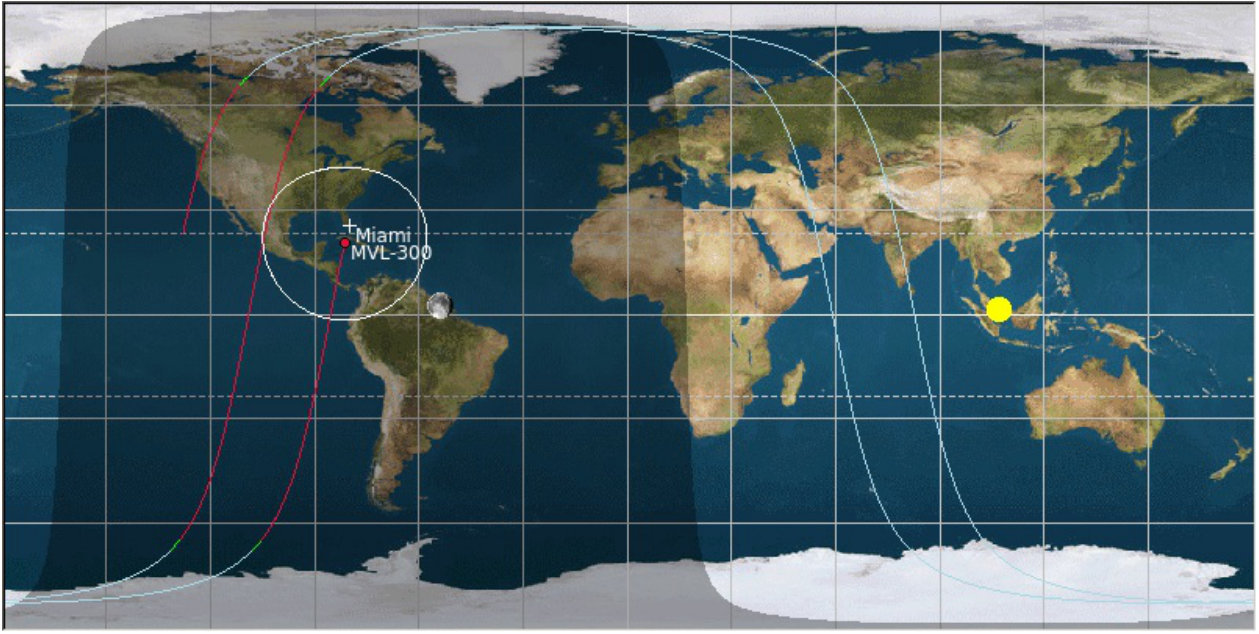 Figure 16
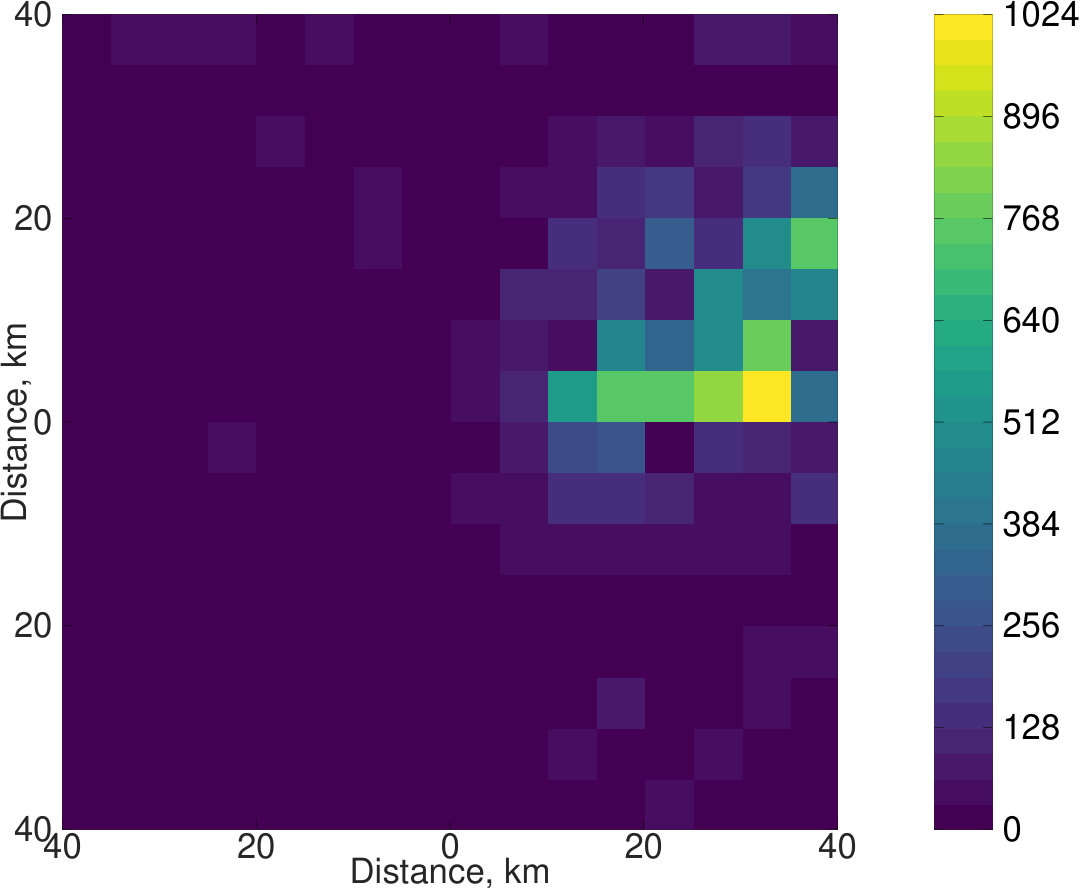 Figure 17
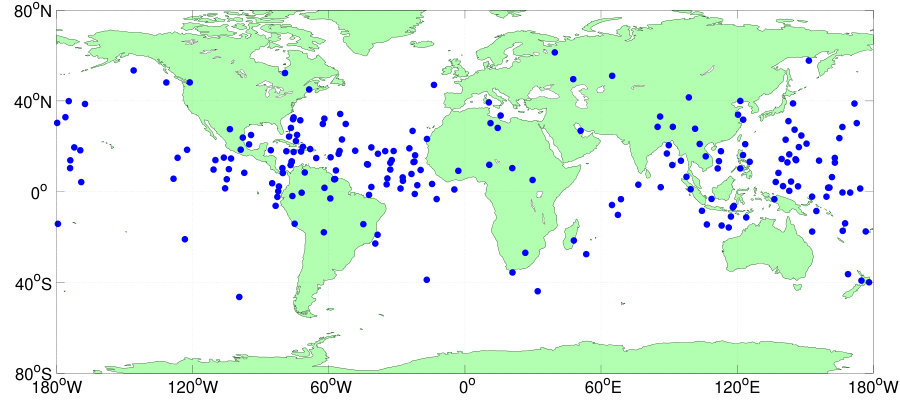 Figure 18
Peer Reviews
No public reviews on file for this paper yet. If you reviewed it on a platform where reviews are public (OpenReview, ICLR, NeurIPS, ICML), you can paste yours below so the community can read it here.
Videos
No videos yet. Explain this paper in a talk, walkthrough, or lecture? Add one.
First results from the TUS orbital detector
in the extensive air shower mode
B.A. Khrenov
P.A. Klimov
M.I. Panasyuk
S.A. Sharakin
L.G. Tkachev
M.Yu. Zotov
S.V. Biktemerova
A.A. Botvinko
N.P. Chirskaya
V.E. Eremeev
G.K. Garipov
V.M. Grebenyuk
A.A. Grinyuk
S. Jeong
N.N. Kalmykov
M. Kim
M.V. Lavrova
J. Lee
O. Martinez
I.H. Park
V.L. Petrov
E. Ponce
A.E. Puchkov
H. Salazar
O.A. Saprykin
A.N. Senkovsky
A.V. Shirokov
A.V. Tkachenko
I.V. Yashin
Abstract
TUS (Tracking Ultraviolet Set-up), the first orbital detector of extreme energy cosmic rays (EECRs), those with energies above 50 EeV, was launched into orbit on April 28, 2016, as a part of the Lomonosov satellite scientific payload. The main aim of the mission is to test a technique of registering fluorescent and Cherenkov radiation of extensive air showers generated by EECRs in the atmosphere with a space telescope. We present preliminary results of its operation in a mode dedicated to registering extensive air showers in the period from August 16, 2016, to November 4, 2016. No EECRs have been conclusively identified in the data yet, but the diversity of ultraviolet emission in the atmosphere was found to be unexpectedly rich. We discuss typical examples of data obtained with TUS and their possible origin. The data is important for obtaining more accurate estimates of the nocturnal ultraviolet glow of the atmosphere, necessary for successful development of more advanced orbital EECR detectors including those of the KLYPVE (K-EUSO) and JEM-EUSO missions.
1 Introduction
Extreme energy cosmic rays (EECRs), those with energies above approximately 50 EeV111 eV., constitute one of the long-standing mysteries of modern astrophysics. They were discovered more than 50 years ago [1] but their nature and origin still remain unclear despite the enormous efforts put into their study, see, e.g., [2] for a review. One of the main obstacles to solving the puzzle is a very low flux of EECRs. It suffices to say that the largest ever cosmic ray experiment, that of the Pierre Auger Observatory, which occupies an area of more than 3000 km2 in Mendoza Province, Argentina, registered only 146 EECRs with energies above 53 EeV in nearly eight years of operation [3]. Another problem is the incomplete coverage of the celestial sphere by existing ground arrays: the Pierre Auger Observatory and the Telescope Array, located in the USA, observe regions of the celestial sphere that only partially overlap. This complicates an analysis of arrival directions (anisotropy) of EECRs at large scales, see, e.g. [4], so that an experiment with a full-sky coverage becomes highly desirable.
A way to overcome both difficulties was proposed by Benson and Linsley in early 1980’s [5, 6]. They suggested to use a reflector type telescope deployed on a low-orbit satellite to register the ultraviolet (UV) photons resulting from the fluorescence and Cherenkov radiation emitted by ionized molecules of nitrogen excited by charged particles of extensive air shower (EAS) cascades generated by EECRs in the atmosphere. In their initial proposal, the telescope was to be equipped with about 5000 photomultiplier tubes located at the focal surface of a 36 m diameter mirror. The task proved challenging in both its scientific and technical aspects because it would require an instrument able to register, from the severe conditions of outer space, the faint flux of fluorescence and Cherenkov photons against the ever-changing nocturnal UV glow of the atmosphere. As a result of these difficulties, no such projects suggested have been implemented yet, see, e.g., [7] for a brief review.
The TUS (Tracking Ultraviolet Set-up) detector was first announced in 2001 as a pathfinder for a more advanced KLYPVE project [8, 9].222Remarkably, John Linsley was one of the active members of the team.
TUS inherited the optical scheme of the original design by Benson and Linsley but with much more modest technical parameters, see Section 2. The D.V. Skobeltsyn Institute of Nuclear Physics at M.V. Lomonosov Moscow State University led the development of TUS in collaboration with a number of universities and research organizations in Russia, Korea, and Mexico [10, 11, 12]. TUS was launched into space on April 28, 2016, as a part of the scientific payload of the Lomonosov satellite [13], pioneering the exploration of EECRs from space.
The main scientific goal of TUS is to verify a technique for observing extreme energy cosmic rays with an orbital detector. With its different modes of operation, TUS is able to obtain information about various kinds of transient luminous events (TLEs) in the atmosphere as well as about the UV background. In what follows, we briefly review the design of TUS and follow with a presentation of the preliminary results of its operation in its main mode, dedicated to registering EECRs. To date, no extensive air showers have been unambiguously identified in the data from observations conducted over the period from August 16, 2016, to November 4, 2016. Nevertheless, this is the first time the UV background of the atmosphere has been studied in the imaging mode. The results obtained were mostly unexpected and provide crucial information for the development of future orbital missions such as KLYPVE (K-EUSO) [14] and JEM-EUSO [15, 16], which are likely to constitute a break-through in exploration of the highest energy particles from space [17, 7, 18]. A detailed analysis of the data is in progress.
2 Design of the TUS detector
TUS is a component of the scientific payload of the Lomonosov satellite (international designation MVL 300, or 2016-026A). The satellite has a sun-synchronous orbit with an inclination of , a period of min, and a height of about 470–500 km. TUS operates during nocturnal segments of the orbit.
The TUS detector consists of two main components: a parabolic mirror-concentrator of the Fresnel type and a square-shaped -channel photodetector aligned to the focal plane of the mirror. The mirror is composed of 7 hexagonal segments of equal size, each of which is composited from two carbon plastic layers and strengthened by a honeycomb aluminium structure. The entire system has an area of about 2 m2 and a 1.5 m focal distance. The field of view (FOV) of the detector is , which covers an area of approximately 80 km80 km at sea level. The angular resolution of a single channel equals 10 mrad, which results in a 5 km5 km area at sea level, see [19, 20] for more details. An artist’s view of the TUS detector on board the Lomonosov satellite is shown in figure 1.
Pixels of the photodetector are Hamamatsu R1463 photomultiplier tubes (PMTs) with a 13 mm diameter multialkali cathode. Their quantum efficiency is about 20% for the 350 nm wavelength. Light guides with square entrance apertures (15 mm15 mm) and circular outputs were employed to uniformly fill the detector’s field of view with 256 pixels. All PMTs have black blends extending 1 cm above their light guides as protection against side illumination. A 13 mm diameter, 2.5 mm thick UV filter is placed in front of each PMT cathode to limit the measured wavelength to the 300–400 nm range.
The pixels are grouped in 16 identical photodetector modules,333In what follows, the 16 modules form horizontal rows in figures presenting snapshots of the focal plane. each of which has its own digital data processing system for the first-level trigger, based on a Xilinx field-programmable gate array (FPGA), and a high voltage power supply, controlled by the FPGA. The central processor board gathers information from all modules, controls their operation, and implements the second-level trigger algorithm. More details on the design of TUS and its photodetector operation can be found in [21, 22].
The TUS electronics can operate in four modes intended for detecting various fast optical phenomena in the atmosphere on different time scales. The main mode is aimed at registering EASs generated by extreme energy cosmic rays and has a time sampling window of 0.8 s. Our present study focuses on results obtained in this mode of operation. Three other modes are also available. Time sampling windows of 25.6 s and 0.4 ms are utilized for studying transient luminous events of different kinds, and a window of 6.6 ms is available for detecting micro-meteors and possibly space debris. Data records for all TUS events include 256 discrete waveforms, one for each channel, and every waveform contains analog-to-digital converter (ADC) counts for 256 time frames.
The TUS trigger system employs a simple algorithm that consists of two levels. The first level trigger decision is based on a comparison of a sum of ADC counts calculated for each pixel during 16 time frames with a threshold level. The total duration of 16 frames (12.8 s) corresponds to the time necessary for the development of a nearly horizontal EAS within a pixel FOV (approximately 5 km5 km). In its turn, the threshold level depends on the mean value of the background radiation within the FOV of a pixel, calculated during 100 ms.
A contiguity trigger is implemented at the second level. The algorithm selects pixels that satisfy the first level trigger requirements and that are adjacent both temporally and in the focal plane. The trigger employs an additional parameter, a so-called adjacency length , i.e., the number of neighboring pixels sequentially triggered at the first level. A number of values in the range from 3 to 6 were tested during the first weeks of TUS operation, and was chosen for the period of data acquisition discussed below as a compromise between the aim to register weak signals of EASs and the need to suppress too high trigger rate due to random fluctuations of the background radiation that takes place for low values of .
Two processes in the photodetector electronics affect event selection by TUS. These are the trigger algorithm itself and the PMT gain control. During normal operation, the detector measures the UV background level and adjusts the sensitivity of the PMTs to avoid their saturation under conditions of increased UV radiation intensity, for example, during moonlit nights and above areas of auroral and thunderstorm activity, large cities, etc. This leads to a diminished sensitivity above these regions and a higher trigger threshold. The high voltage correction occurs once every 100 ms to ensure a constant anode current during EAS waveform measurements. Information about high voltage for all PMT modules is included in each data record. Due to certain limitations of the Lomonosov hardware, the rate of TUS events recorded by the so-called Information Unit of the satellite does not exceed one event per approximately a minute.
Intensive simulations of the EAS development and response of TUS have been performed before the launch. They employed the ESAF framework [23] and a dedicated TUSSIM program developed at Joint Institute for Nuclear Research, Dubna [24, 25, 26]. Figures 2 and 3 illustrate a few important results of the simulations. Specifically, figure 2 demonstrates how the waveforms of two adjacent pixels might look in the case of a nearly horizontal EAS generated by a proton with an energy of EeV. Here, a minimal UV background of the order of ph sr*-1* s*-1* cm*-2* is assumed. Figure 3, adopted from [27], shows how the signal from an EAS can be distributed in the photodetector. The result was obtained for a 100 EeV primary proton arriving in the atmosphere at a zenith angle of , and a UV background glow of the order of ph sr*-1* s*-1* cm*-2*. The signal is shown as a ratio
[TABLE]
where is the mean value of ADC counts , and is the root mean square of .
The energy threshold for TUS was determined to be approximately 70 EeV during moonless nights, and the instrument should be able to register several EECRs above the threshold in 5 years of continuous operation [26] assuming the energy spectrum obtained with the Pierre Auger Observatory for highly inclined EAS [28]. The energy threshold only weakly depends on the value of adjacency length employed in the second level trigger [26].
3 Results
In what follows, we present preliminary results of an analysis of data obtained with TUS in the EAS mode of operation from August 16, 2016, to November 4, 2016, during the interval between two software updates. In total, 17345 events registered during the night time segments of orbits were considered. They were tentatively divided into four main groups on the basis of the temporal structure of waveforms. These groups consist of:
- •
events with noise-like waveforms and approximately constant mean values of ADC counts,
- •
instant flashes with linear tracks across the focal plane (rise time s),
- •
slow spatially extended flashes (typical rise time s),
- •
events with complex spatio-temporal dynamics of waveforms and images in the focal plane.
Each of the groups will be discussed below.
3.1 Events with noise-like waveforms
More than 80% of events registered thus far by TUS in its main mode of operation have noise-like waveforms with ADC counts of all PMTs fluctuating around average values that are close to each other when rescaled according to their individual PMT gains. The average value of ADC counts may be higher or lower depending on the current level of background radiation but the shape of waveforms remains qualitatively similar.
As a rule, the illumination of the focal plane is approximately uniform for noise-like events, and triggering seems to result from certain random fluctuations of the UV background. Currently, such events are utilized for estimating the UV background, which varies according to the phase and relative position of the Moon, the cloud coverage and other conditions. The measurements from these events are also used for preparing time-dependent maps of the UV background.
Sometimes, the illumination of the focal plane is non-uniform, displaying a large brighter region while the waveforms remain noise-like. Such conditions have been observed for numerous events registered during nights around full moons. An example is shown in figure 4. The event was one of a series recorded on September 18, 2016, two days after the full moon.444Four modules with (nearly) zero ADC counts were not working properly at the time. An explanation for this kind of illumination is that, for certain relative positions of the satellite and the Moon, the moonlight arrives at the focal surface directly, without previous reflection by the atmosphere, see figure 5. Additional light above auroral ovals or thunderstorm regions can also contribute to non-uniform illumination of the detector’s focal plane.
Within the group, there is a subset of events with noise-like waveforms, but strongly non-uniform illumination of the focal plane. An event of this kind, shown in figure 6, was recorded on September 30, 2016, at 07:11:56 UTC, when the center of the FOV of TUS was about 25 km south from Las Vegas, Nevada (USA). One can see a strong localized signal, in this particular case covering a part of the city. Two other examples of events recorded above cities can be found in [29]. TUS is routinely registering events of this kind but we cannot claim that all of them relate to city lights or other anthropogenic sources.
In certain events, a number of pixels are saturated and sometimes, in extreme cases of non-uniform illumination of the focal plane, maximum ADC counts remain constant throughout the entire recording interval.555The maximum ADC count equals 1023, which corresponds to approximately 2000 photons at a PMT pupil if the high voltage of the respective module has the maximum possible value, i.e., the module operates at its highest sensitivity. Saturated pixels together with adjacent bright ones form compact spatially localized “hot spots.” Twenty events of this kind were registered within the period analyzed. One of the events, shown in figure 7, took place on October 12, 2016, at 03:29:49 UTC, when TUS was above Venezuela at the N, W coordinates. Remarkably, another event of this type was registered nearby, as well as an additional one with lower ADC counts. The region is known to have one of South America’s highest levels of anthropogenic brightness at visible wavelengths [30].
Using publicly available resources in the Internet, we found objects like airports, power plants, and offshore platforms within the FOV of TUS for many events of this kind. On the other hand, we have failed to attribute these events to atmospheric phenomena such as lightning strikes or TLEs, which are likely to give rise to other events registered by TUS, see Section 3.3 below. Thus it is likely they are due to anthropogenic factors (for example, LED lights or Xenon lamps) although their actual origin remains uncertain. A detailed analysis of all events with noise-like waveforms is in progress.
3.2 Instant track-like flashes
One of the first phenomena that attracted our attention from the very beginning of the TUS operation in space were exceedingly brief (i.e., occurring within a single or, rarely, two time frames) and, as a rule, intense flashes that produced linear tracks across the focal surface. In what follows, we shall call them “track-like events” for the sake of brevity. Such events comprise approximately 14% of the total, and up to % of events registered during moonless nights. An example is shown in figure 8, where a flash occurring during one exposure frame simultaneously666In this case, “simultaneous” indicates an exposure with a duration of up to one frame, which relates to the way information from PMT modules is collected. registers across a group of PMTs in linear alignment to form a track. Typically, at least one of PMTs involved in such an event is saturated. In a few cases, the number of saturated PMTs exceeds 8. Another feature observed in the majority of track-like events is a signal “tail” that typically lasts approximately 60–70 s in at least one of the saturated pixels, see figure 8. Other examples of such flashes can be found in [31, 32, 29].
Figure 9 shows a geographic distribution of 2394 track-like events over the Earth.777In 2087 cases, at least one of the PMTs was saturated. It is readily apparent (and confirmed by the Kolmogorov–Smirnov test) that this mapping does not follow the distribution of all events with respect to latitude, but has clear peaks at N–N and S–S. The median value of the latitude for the whole data set is N, and S for the track-like events. The distribution of all events is not symmetric with respect to the equator due to the seasonal movement of the terminator.
A considerable population of flashes is likewise apparent within the boundaries of the South Atlantic Anomaly, apart from a region of South America, mostly in Brazil. Many noise-like events characterized by a markedly non-uniform illumination of the focal plane have been registered in the region, likely causing a reduction in the trigger rate of track-like events.
Distribution of track-like events versus geographic longitude is similar to that of the entire data set.
While interesting, these events cannot result from extensive air showers generated by EECRs in the atmosphere because nearly horizontal EASs should produce tracks composed of adjacent pixels that flash throughout approximately consecutive 16 exposure frames but not all at once. Preliminary simulations performed using the Geant4 software toolkit [33] have revealed that protons with energies from 100–200 MeV up to a few GeV that hit the UV filters approximately parallel to their plane can produce fluorescence and Cherenkov radiation and result in tracks similar to those observed by TUS.
A model of the detector employed in the simulations was a matrix of cells, which consisted of circular glass filters placed in aluminium plates with the sizes of the real detector. Optical photons generated during interactions of a primary particle and the material of the instrument were recorded at the bottom of each cell, where PMTs are located. The standard FTFP_BERT physics list, which implements electromagnetic and hadronic processes, was used for the simulations that included the birth of Cherenkov photons, glass fluorescence, absorption of photons in the glass filters and their reflection on the boundaries of different materials. The specific light yield of fluorescence in glass was assumed to be 300 photons/MeV at wavelengths 300–400 nm. The refractive index of the UFS-1 glass used in filters equals 1.54.
The simulations demonstrated that a proton that hits the glass filters approximately parallel to their plane can cause a trigger in a PMT located near the boundary of the photodetector beginning from energies MeV. Up to six lined-up PMTs can be triggered by a 200 MeV proton. At energies MeV, a proton can cause a strong signal in sixteen and more PMTs located near a line, with the number of photoelectrons produced that is in agreement with ADC counts registered in the experiment. More details on the simulations can be found in [31].
The same model of the detector was used to check if electrons of the inner Van Allen belt can be a source of track-like events. Electrons with energies up to 10 MeV were considered. It was found that an electron that hits a UV filter normally to its plane produces a signal not exceeding the UV background level of the nocturnal atmosphere. On the other hand, electrons with energies less than 2–10 MeV approaching the focal surface approximately parallel to its plane, cannot penetrate through the aluminium box of the photodetector. Thus electrons of this origin are unlikely to be a source of track-like events.
It is important to note that Cherenkov light, either reflected from Earth or generated within the mirror medium by an upward-going particle can generate events with a strong signal and a compact spot on the focal plane [34, 35]. It would be important to register an event of this kind but their duration is too short to satisfy the second level trigger conditions with its current settings.
3.3 Slow spatially extended flashes
Another distinct group of events consists of flashes with ADC counts increasing steadily for s, modulated by random fluctuations of the signal, as shown in figure 10 for a single channel. We shall call them “slow flashes.” Such a flash typically evolves simultaneously across the majority of pixels, producing a nearly uniform illumination of the focal plane. In most cases, ADC counts continue to grow until the completion of a record.
The geographic distribution of slow flashes is presented in figure 11. The selection of events shown here is conservative in the sense that we only took flashes in which at least 25% of all functioning PMTs demonstrated a more than excess over the baseline signal level near the maximum. It is clearly seen that the majority of these TUS events are located in regions with known high lightning flash rates.888See, for example, http://www.sos.noaa.gov/Datasets/dataset.php?id=6
We compared a sample of 71 slow flashes registered from August 16, 2016, to September 19, 2016, with data from the World-Wide Lightning Location Network (WWLLN)999http://www.wwlln.net/ looking for “companion” lightnings within a wide range of time windows and at angular distances up to from the respective TUS event, which roughly corresponds to the maximum distance from which a ray of light tangent to the Earth is visible from the Lomonosov orbit.
What came as a surprise was the fact that for the time window of s, which matches the accuracy of the trigger time stamps, the overwhelming majority of companion lightnings were registered at distances km from the position of a slow flash. In the particular case shown in figure 10, two strong lightning strikes were registered by the WWLLN at distances of km from the flash and seven weaker strikes at km. For 29 events, lightnings were found at distances km from the center of the TUS field of view and at distances of up to km for 50 events. We also checked much longer time intervals in order to figure out if there were thunderstorms at the respective regions. It was found that thunderstorms were registered within 30 min at distances km from 24 slow flashes. The lack of lightnings strikes registered shortly before the slow flashes might relate to the incomplete effectiveness of the WWLLN in certain regions of the world.
The simplest way to explain this kind of flashes is that the detector registers UV light uniformly distributed in all directions from the location of a lightning strike (or flash) and then partially scattered by the surface of the mirror.
In a few cases, the illumination of the focal plane by a slow flash is strongly non-uniform. For example, an event shown in figure 12 was recorded on September 24, 2016, at 21:01:46 UTC above Uganda (N, W). Twenty-two PMTs demonstrated a growth of ADC counts exceeding the baseline signal level by more than . Two lightning strikes within a time interval of s were registered by the Vaisala Global Lightning Dataset GLD360 [36, 37] within the field of view of TUS. In our opinion, this is an additional argument in favor of a close relation between slow flashes registered by TUS and lightnings.
There are a few events with a number of PMTs saturated before the end of a record, which most likely represent extreme cases of slow flashes. An example of such an event is shown in figure 13. It was registered on September 19, 2016, at 21:30:46 UTC over the Black Sea some 100 km to the West of Sevastopol (N, E). The event took place in conditions of high UV background radiation. Three adjacent PMTs were saturated and another one reached the ADC count of 1020 in about 140 s. The signal also increased by more than above the baseline background level in eight neighboring pixels. It is known from publicly available sources101010See, e.g., http://en.blitzortung.org/. that a thunderstorm was taking place around the location of the TUS event at that time, but we have failed to find information about local lightnings registered within s of the measurement. A number of lightning strikes were collected by GLD360 and another by the WWLLN in 2–5 s after the TUS event at distances from 20 to 50 km from its field of view.
Another event with very similar waveforms registering as a compact spot in the focal surface was detected at 19:54:22 UTC on September 5, 2016, near Aktobe, Kazakhstan (N, E), and a similar event occurred on October 26, 2016, at 00:14:41 UTC above the Atlantic Ocean (N, W). With regard to the former, we have not managed to find information about thunderstorms or transient luminous events nearby. In the latter case, the closest lightning strike was registered by the GLD360 approximately 2 s prior to the TUS event in km from the corresponding location. We cannot exclude the lack of “companions” is due to a less complete coverage of the two regions by lightning sensors.
There are also a few events that demonstrate compact spots in the focal plane along with waveforms that grow monotonously, on average, but the pixels are not saturated in any of them. It is likely that these represent some transitional kind of events between the more typical slow flashes and the extreme ones, and also relate to thunderstorms and lightnings.
Slow flashes with spot-like illumination of the focal plane can theoretically originate from two types of rare TLEs termed “blue jets” and “gigantic jets”, see, e.g., [38] for a brief overview. Both phenomena manifest themselves as optically visual (but radiating also in UV) jets emanating from tops of thunderclouds to the low ionosphere but differ in their colour, typical sizes and speed of evolution. Gigantic jets have mostly been observed above oceans, within from the equator [39]. TUS can only register the very beginning of both kinds of jets in the EAS mode since their duration is of the order of dozens milliseconds.111111TUS has registered multiple events related to thunderstorms in the modes with longer time samples. Some preliminary results can be found in [40].
A more thorough study is in progress.
3.4 Events with complex spatio-temporal dynamics
A few of the events recorded with TUS do not fit within the above three groups but are worth discussing.
In the period of operation considered here, TUS registered three events that are likely to be so called “elves.” Recall that the term “ELVE” stands for Emission of Light and Very Low Frequency perturbation from an Electromagnetic Pulse (EMP) Sources [41]. Elves are short-lived optical events that manifest at the lower edge of the ionosphere (altitudes of 80–90 km) as bright rings expanding at the speed of light up to a maximum radius of km. The life time of an elve is ms. They are likely caused by the atmospheric EMP ionization resulting from cloud-to-ground lightning discharges, see, e.g., [42]. Elves represent the most frequent type of TLEs: according to ISUAL (Imager of Sprites and Upper Atmospheric Lightning) global experimental data [39], 50% of all registered TLEs were determined to be elves. The Pierre Auger collaboration performs dedicated studies of elves [43].
Several waveforms and a snapshot of the focal plane of the first of the elve candidates are shown in figure 14. The event was registered on September 7, 2016, at 09:51:35 UTC over the Pacific Ocean (S, W) and appeared as a bright fading arc crossing the focal plane from one corner to another in the direction from northwest to southeast. A simultaneous lightning (up to 1 s) was registered by the WWLLN at a distance of about 180 km northwest from the center of the TUS field of view. The position of the lightning, the form of the bright arc in the focal plane, and the temporal evolution of the waveforms strongly support the conjecture that this event was an elve.
The second event was recorded on September 18, 2016, at 22:06:48 UTC above Chad (N, E). As in the case just discussed, a bright arc crossed the focal plane from one corner to another. A number of lightning strikes around the location at that time were found in GLD360, five of them occurring within s of the TUS event at distances of 100–140 km. Their positions agree with the dynamics of the luminous arc moving across the focal plane of TUS. A more detailed discussion of this event can be found in [40]. The third event was recorded on October 18, 2016, at 13:20:11 UTC above the vicinity of the Northern Mariana Islands (N, E). A lightning strike that took place in 1 s after the TUS event at a distance of approximately 200 km was found in the GLD360. For both events, the UV background was similar to that of the event shown in figure 14.
TUS has registered several other interesting events different from all those discussed above, but their origin is unclear and they will be discussed elsewhere.
4 Conclusions
We presented preliminary results of an analysis of data obtained by TUS, the first orbital detector of extreme energy cosmic rays, in its main mode of operation throughout the period from August 16, 2016, to November 4, 2016. The data have significantly improved our understanding of both the UV background and the conditions of the space environment within which an orbital detector of EECRs must operate, and the diversity of events recorded in the UV range has exceeded all expectations.
Various transient UV atmospheric phenomena were studied in the earlier MSU Tatiana [44], Tatiana-2 [45] and Vernov [46] satellite missions. The instruments of these experiments included UV radiation detectors based on the same Hamamatsu R1463 PMTs utilized in the TUS mission. Each instrument employed a single PMT working in the ultraviolet range. The field of view varied from to with no spatial resolution. Temporal resolution changed from 16 s for the Tatiana mission to 1 ms for the Tatiana-2. The detectors measured the variation of the nocturnal UV glow of the atmosphere along the satellite orbits. The intensity of the UV glow was found to vary in a wide range – ph sr*-1* s*-1* cm*-2* during moonless nights and increase up to ph sr*-1* s*-1* cm*-2* above auroral lights and during moonlit nights [47]. Numerous transient atmospheric events were detected during the three missions, and a global map of the nocturnal atmospheric UV glow was composited from their data [48, 49, 50].
These studies are continuing with the TUS detector, which has a number of crucial advantages, including its 5 km spatial resolution and the much higher temporal resolution. As a result, TUS is providing new, unique information about transient events in the atmosphere, important for the development of much more advanced instruments, such as KLYPVE (K-EUSO) and JEM-EUSO. TUS continues its orbital mission, and a detailed analysis of its data is in progress, including a dedicated search for EASs generated by cosmic rays of the highest energies. No events of this kind have been unequivocally identified in the data yet, but a preliminary list of possible candidates is under detailed analysis [51]. We believe the experiment marks an important step in the development of the technique of detecting extreme energy cosmic rays from space.
Acknowledgments
The authors wish to thank Robert Holzworth, the head of the World Wide Lightning Location Network, and Vaisala Inc. company for providing the data on lightning strikes employed in the present study. We also thank an anonymous referee for multiple useful comments on the manuscript. The work was done with partial financial support from the Russian Foundation for Basic Research grants No. 15-02-05498-a and No. 16-29-13065. The Korean work is supported by the National Research Foundation grants (No. 2015R1A2A1A01006870 and No. 2015R1A2A1A15055344).
The reference list from the paper itself. Each links out to its DOI / PubMed record.
- 1[1] J. Linsley, L. Scarsi and B. Rossi, Extremely Energetic Cosmic-Ray Event , Physical Review Letters 6 (May, 1961) 485–487 . · doi ↗
- 2[2] K.-H. Kampert and P. Tinyakov, Cosmic rays from the ankle to the cutoff , Comptes Rendus Physique 15 (2014) 318–328 , [ 1405.0575 ]. · doi ↗
- 3[3] A. Aab, P. Abreu, M. Aglietta et al., Searches for anisotropies in the arrival directions of the highest energy cosmic rays detected by the Pierre Auger Observatory , Astrophys. J. 804 (2015) 15 , [ 1411.6111 ]. · doi ↗
- 4[4] Pierre Auger, Telescope Array collaboration, R. U. Abbasi, M. Abe, T. Abu-Zayyad et al., Pierre Auger Observatory and Telescope Array: Joint Contributions to the 34th International Cosmic Ray Conference (ICRC 2015) , 1511.02103 .
- 5[5] R. Benson and J. Linsley, Satellite observation of cosmic-ray air showers , in Bulletin of the American Astronomical Society , vol. 12, p. 818, 1980.
- 6[6] R. Benson and J. Linsley, Satellite observation of cosmic ray air showers , in 17th International Cosmic Ray Conference, Paris, France , vol. 8, pp. 145–148, 1981.
- 7[7] M. I. Panasyuk, M. Casolino, G. K. Garipov et al., The current status of orbital experiments for UHECR studies , Journal of Physics Conference Series 632 (2015) 012097 , [ 1501.06368 ]. · doi ↗
- 8[8] V. V. Alexandrov, D. I. Bugrov, G. K. Garipov et al., Space experiment “TUS” for study of ultra high energy cosmic rays , International Cosmic Ray Conference 2 (2001) 831.