Quasars with PV broad absorption in BOSS data release 9
Daniel M. Capellupo, Fred Hamann, Hanna Herbst, W. Niel Brandt, Jian, Ge, Isabelle P\^aris, Patrick Petitjean, Donald P. Schneider, Alina, Streblyanska, Donald York

TL;DR
This study identifies PV broad absorption in a significant fraction of BAL quasars from SDSS-III/BOSS DR9, revealing large column densities and partial coverage in quasar outflows, which are crucial for understanding feedback in galaxy evolution.
Contribution
It presents the first large-scale survey of PV absorption in BAL quasars, significantly increasing known detections and providing new insights into outflow properties and their prevalence.
Findings
PV absorption detected in 3.0-6.2% of BAL quasars
PV presence correlates with stronger CIV and SiIV absorption
Many PV detections imply large column densities and partial coverage
Abstract
Broad absorption lines (BALs) found in a significant fraction of quasar spectra identify high-velocity outflows that might be present in all quasars and could be a major factor in feedback to galaxy evolution. Understanding the nature of these flows requires further constraints on their physical properties, including their column densities, for which well-studied BALs, such as CIV 1548,1551, typically provide only a lower limit because of saturation effects. Low-abundance lines, such as PV 1118,1128, indicate large column densities, implying outflows more powerful than measurements of CIV alone would indicate. We search through a sample of 2694 BAL quasars from the SDSS-III/BOSS DR9 quasar catalog for such absorption, and we identify 81 `definite' and 86 `probable' detections of PV broad absorption, yielding a firm lower limit of 3.0-6.2% for the incidence of such absorption among BAL…
Click any figure to enlarge with its caption.
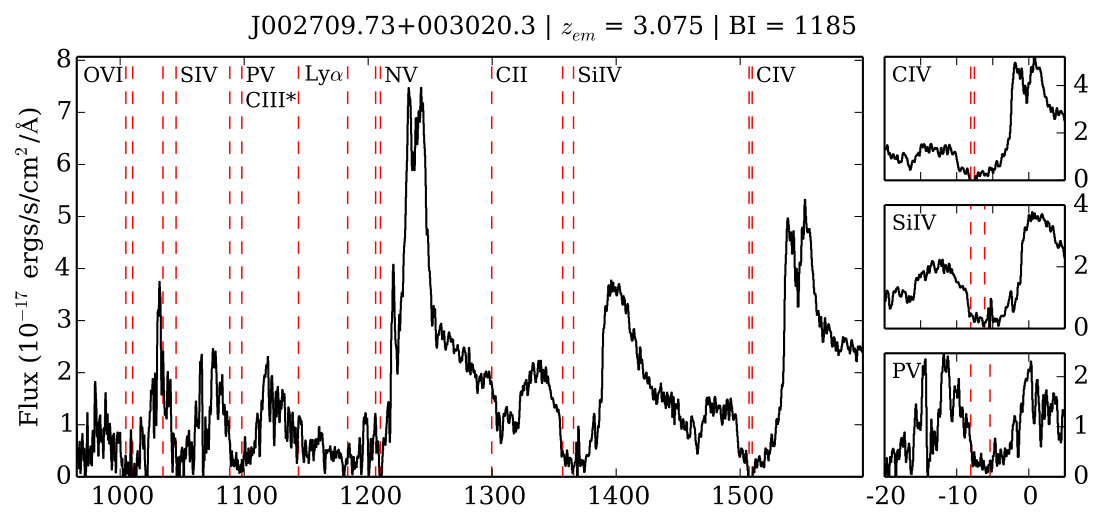 Figure 1
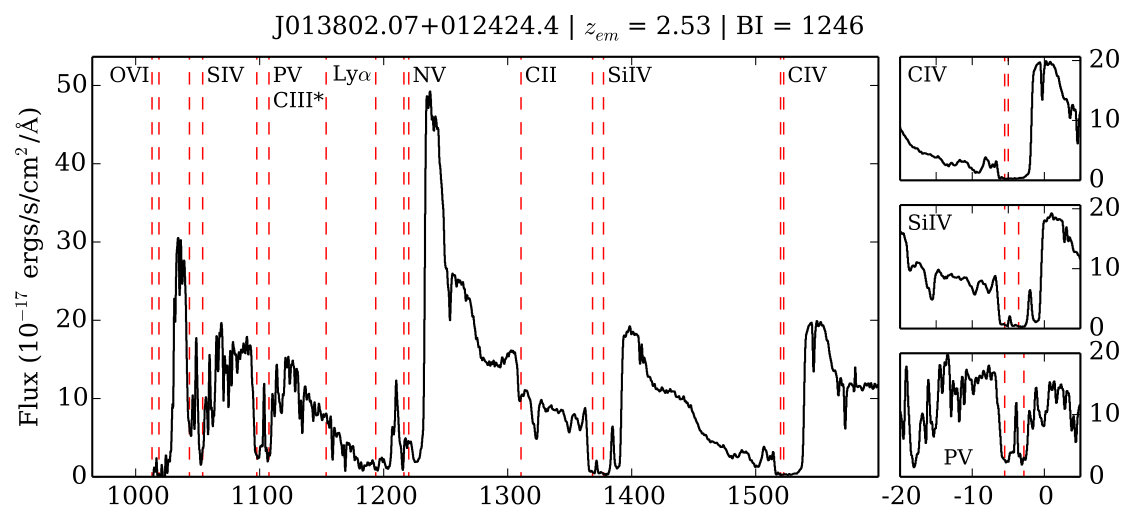 Figure 1
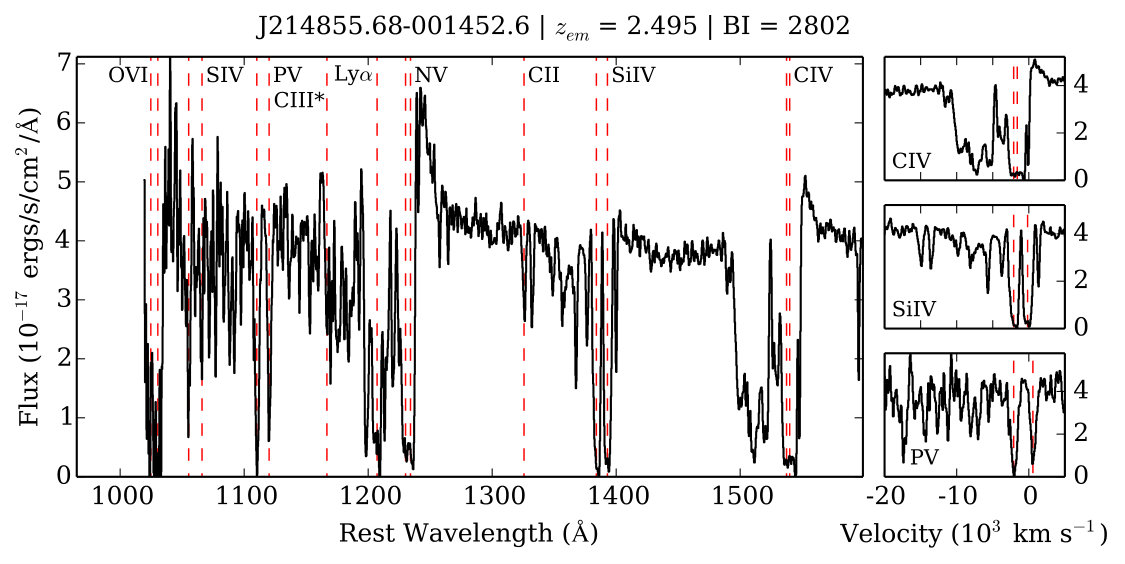 Figure 1
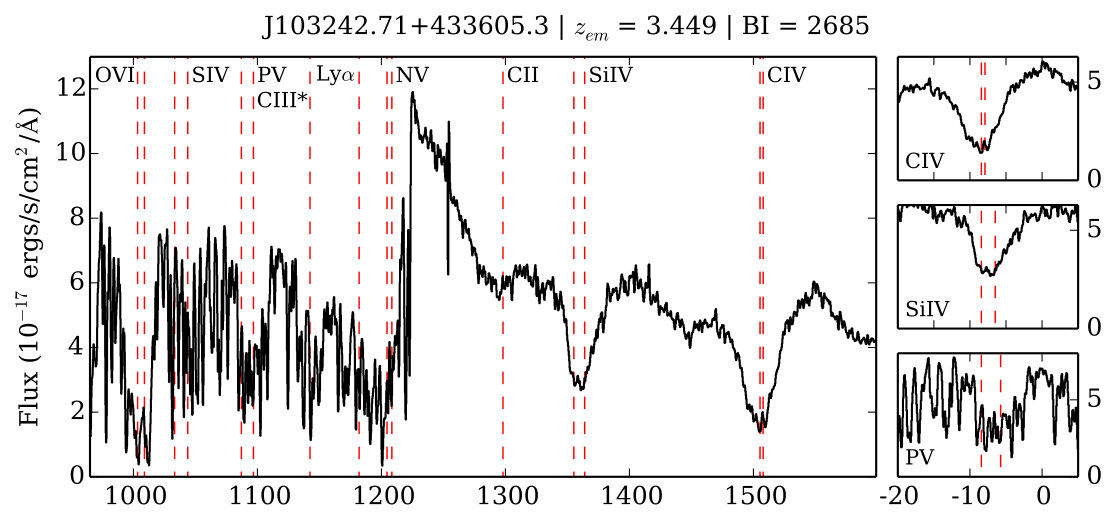 Figure 2
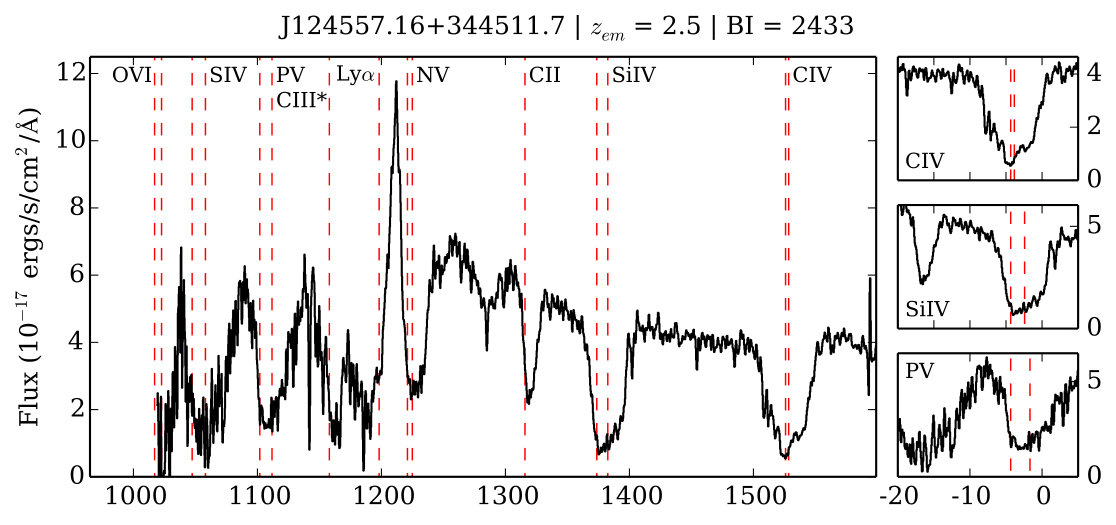 Figure 2
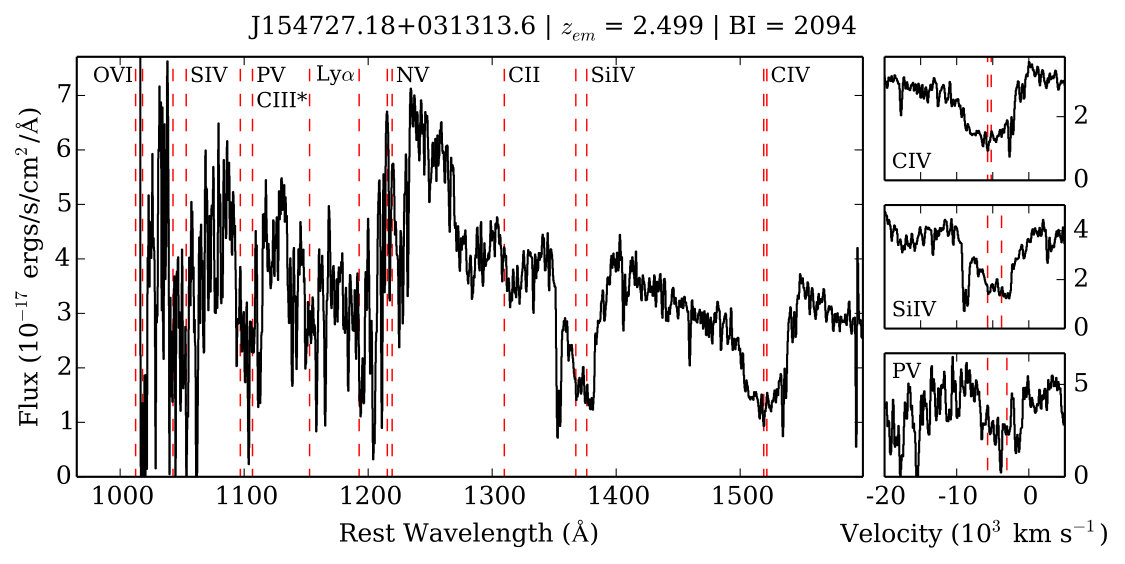 Figure 2
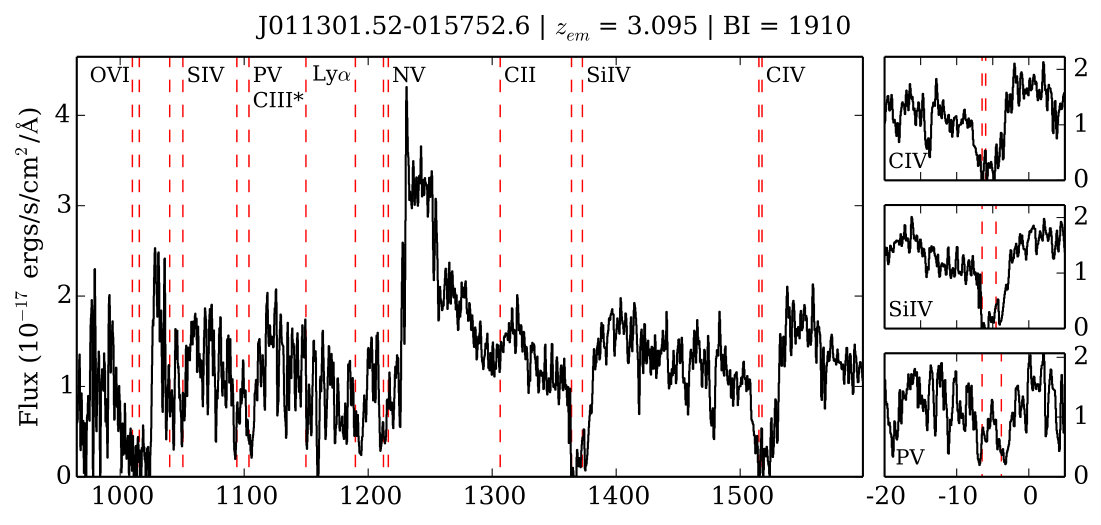 Figure 3
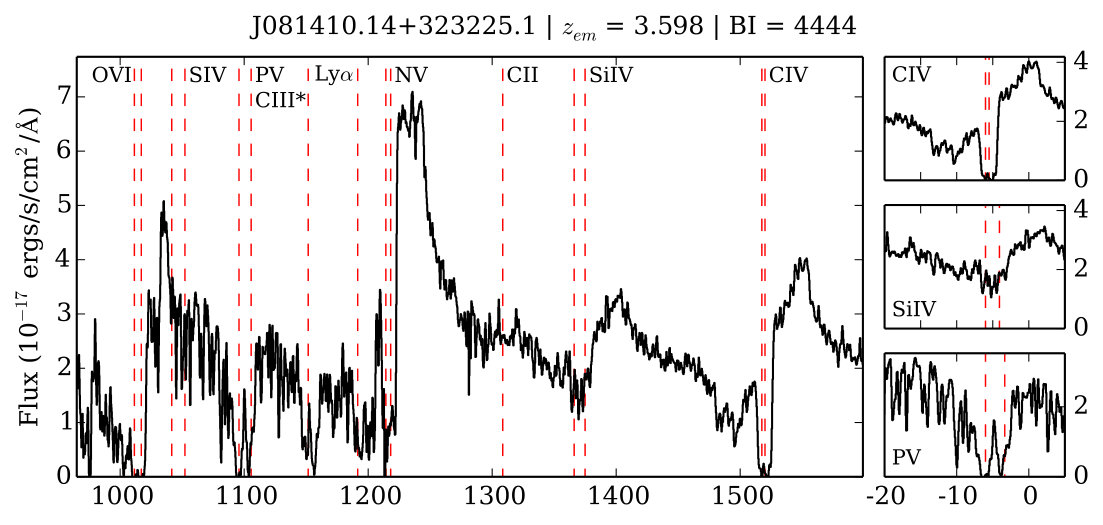 Figure 3
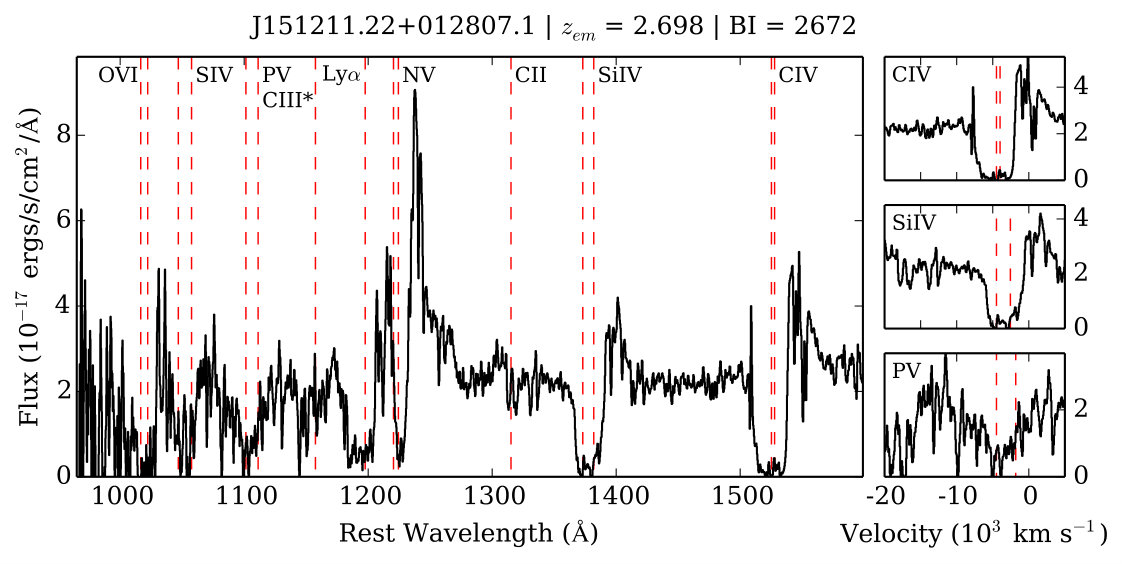 Figure 3
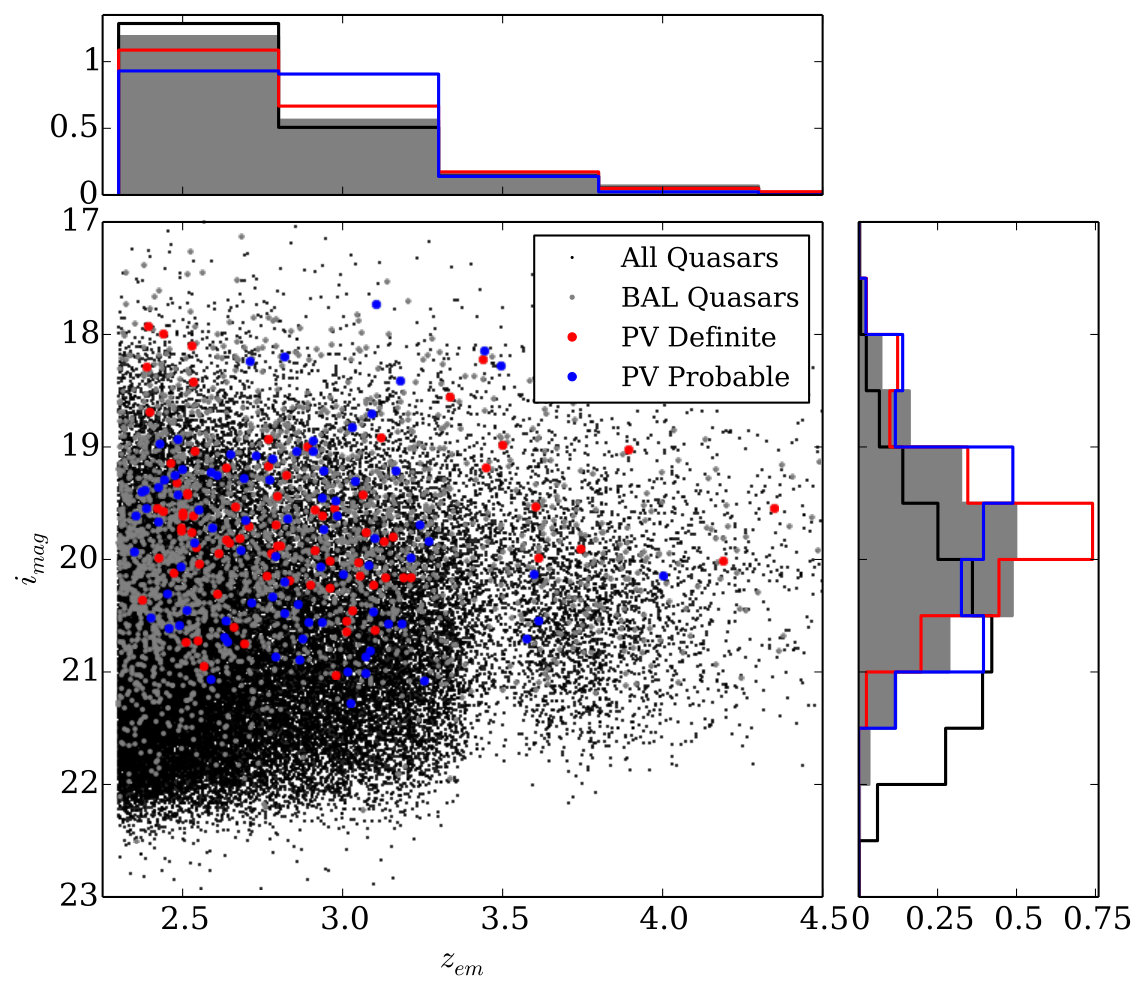 Figure 4
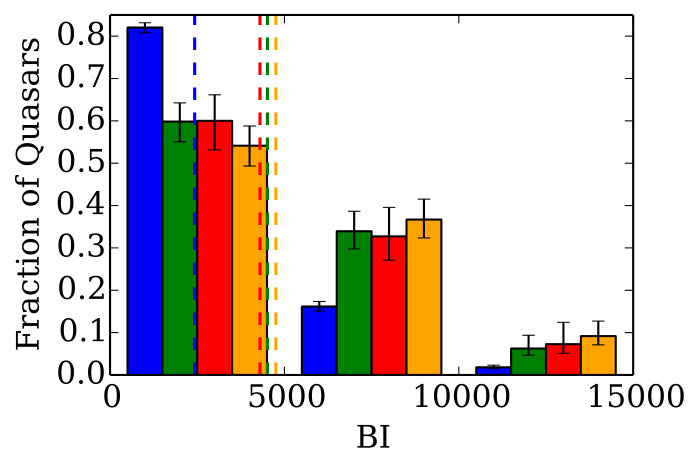 Figure 5
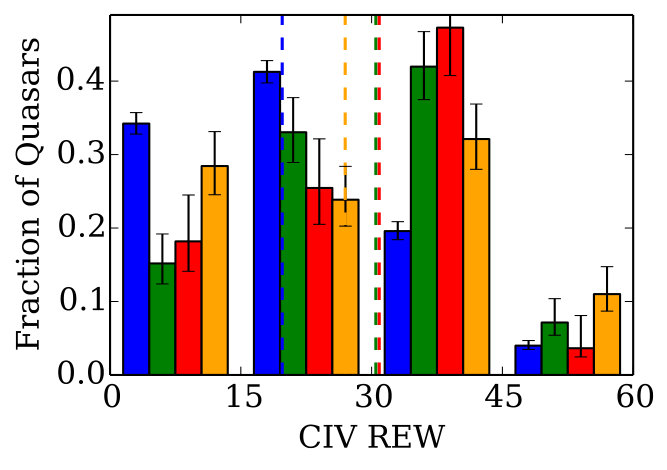 Figure 5
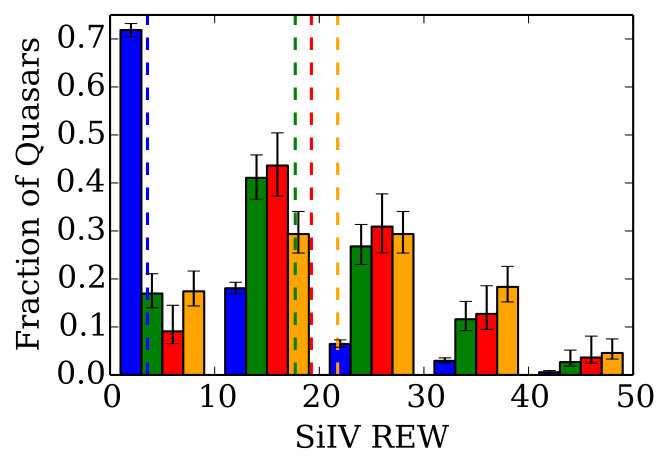 Figure 5
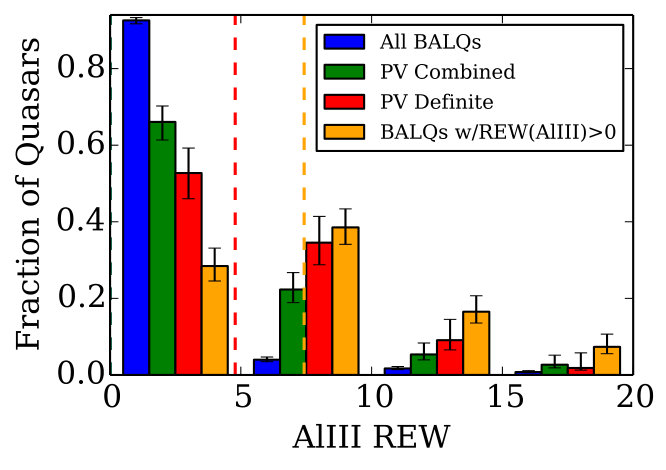 Figure 5
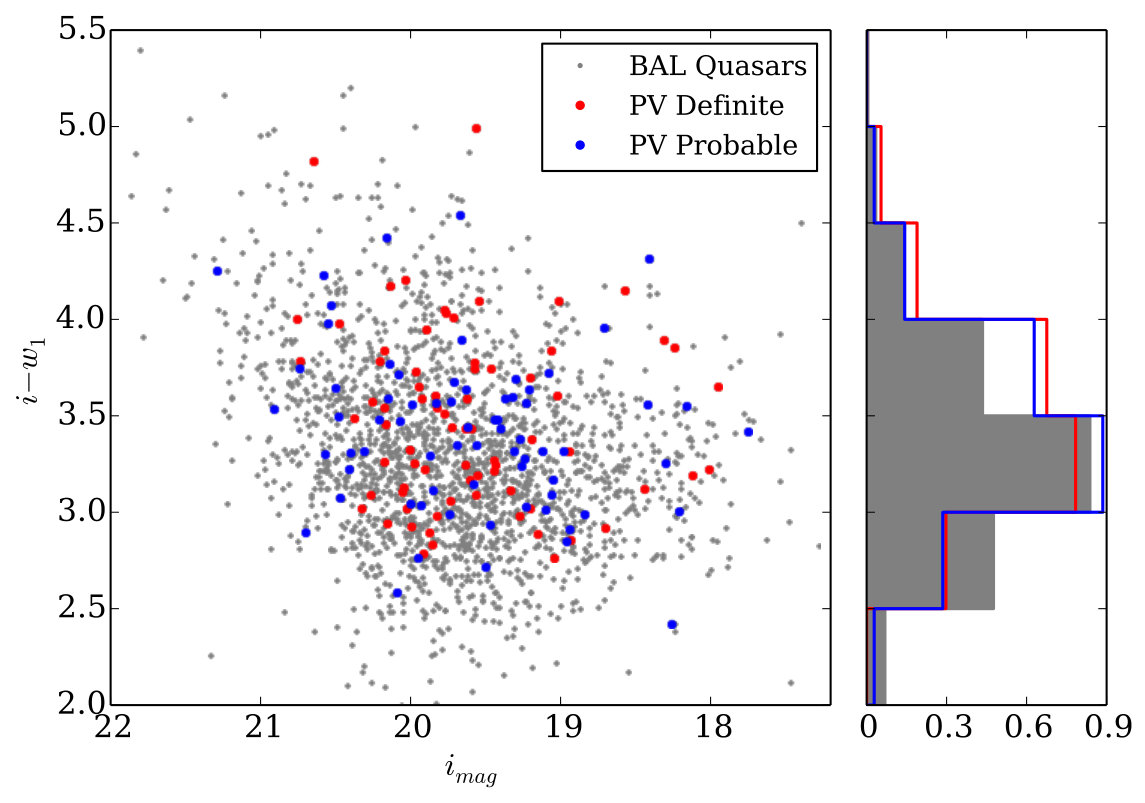 Figure 6
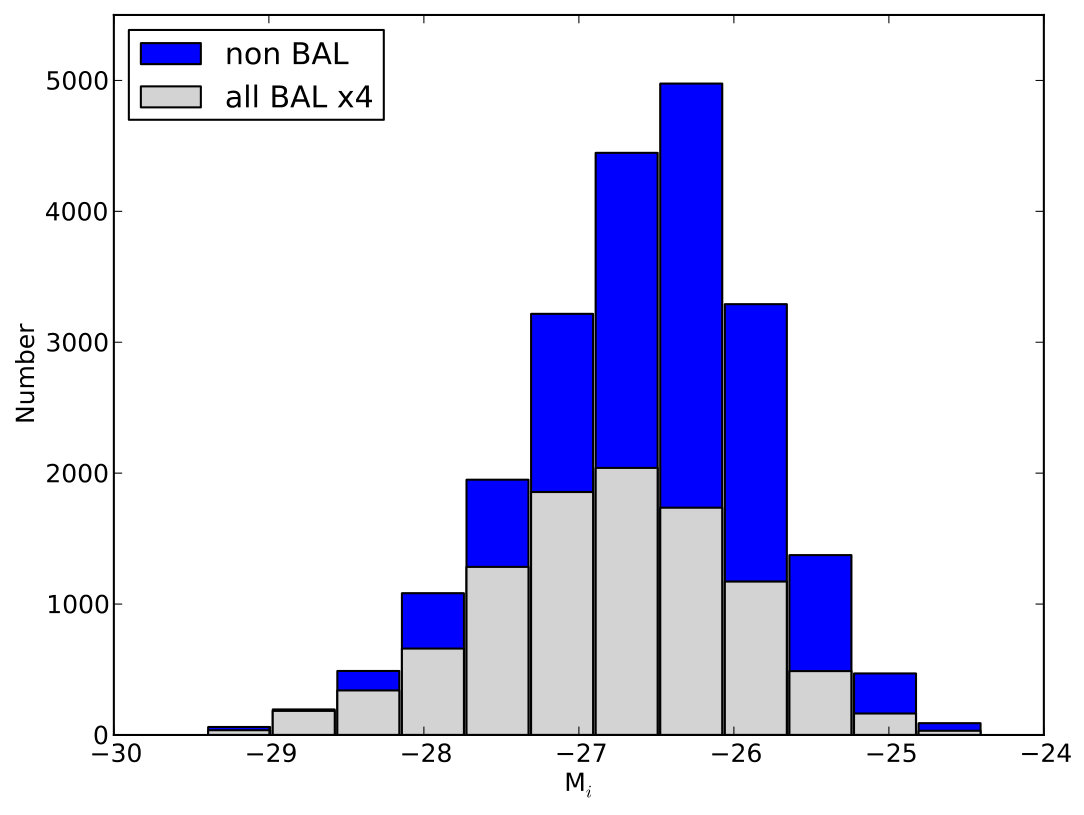 Figure 7
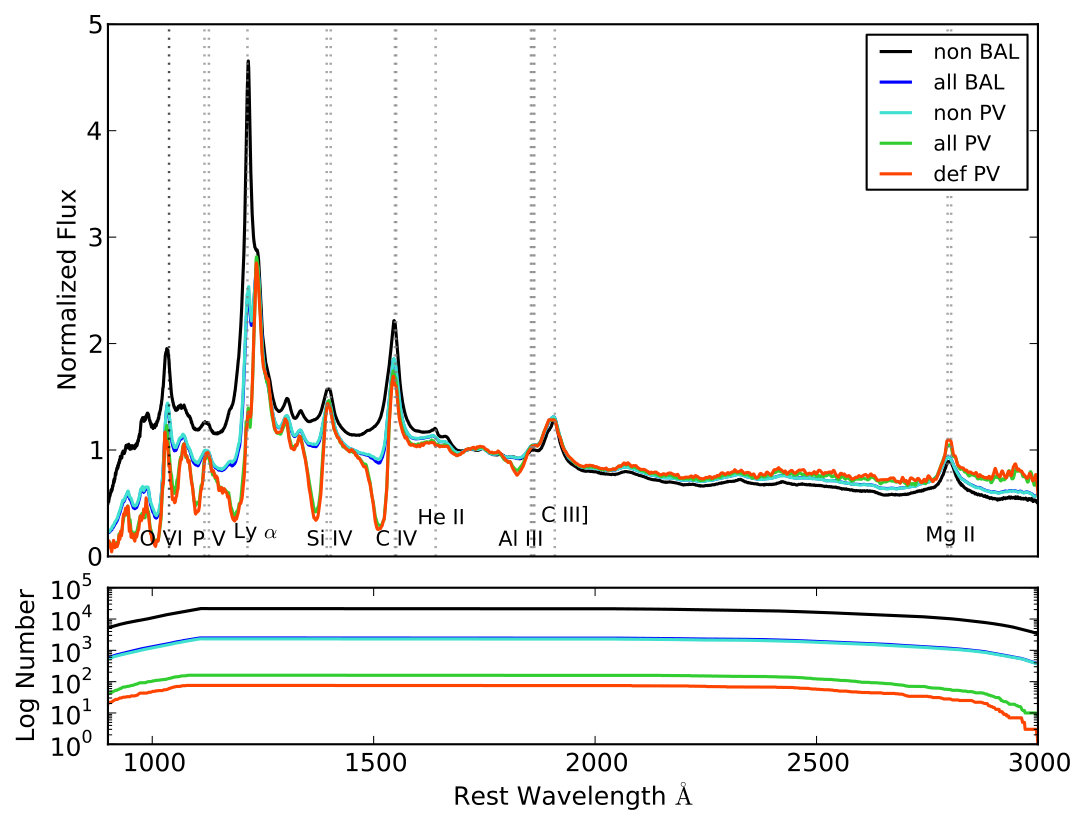 Figure 8
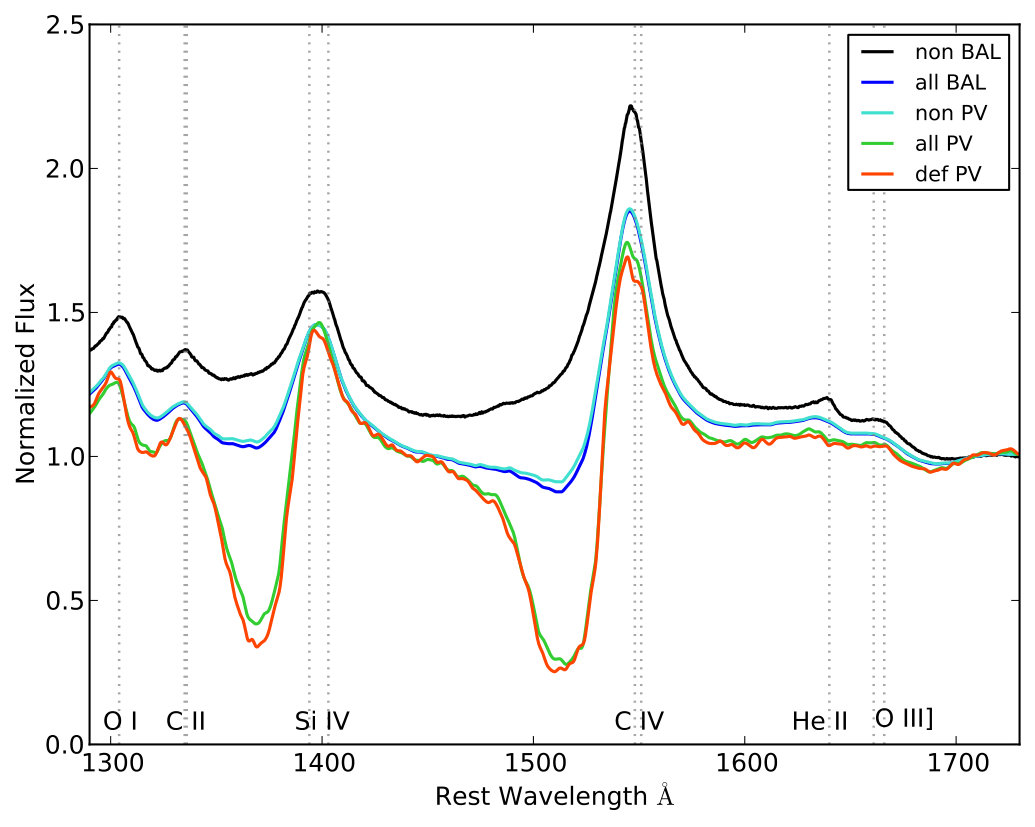 Figure 9
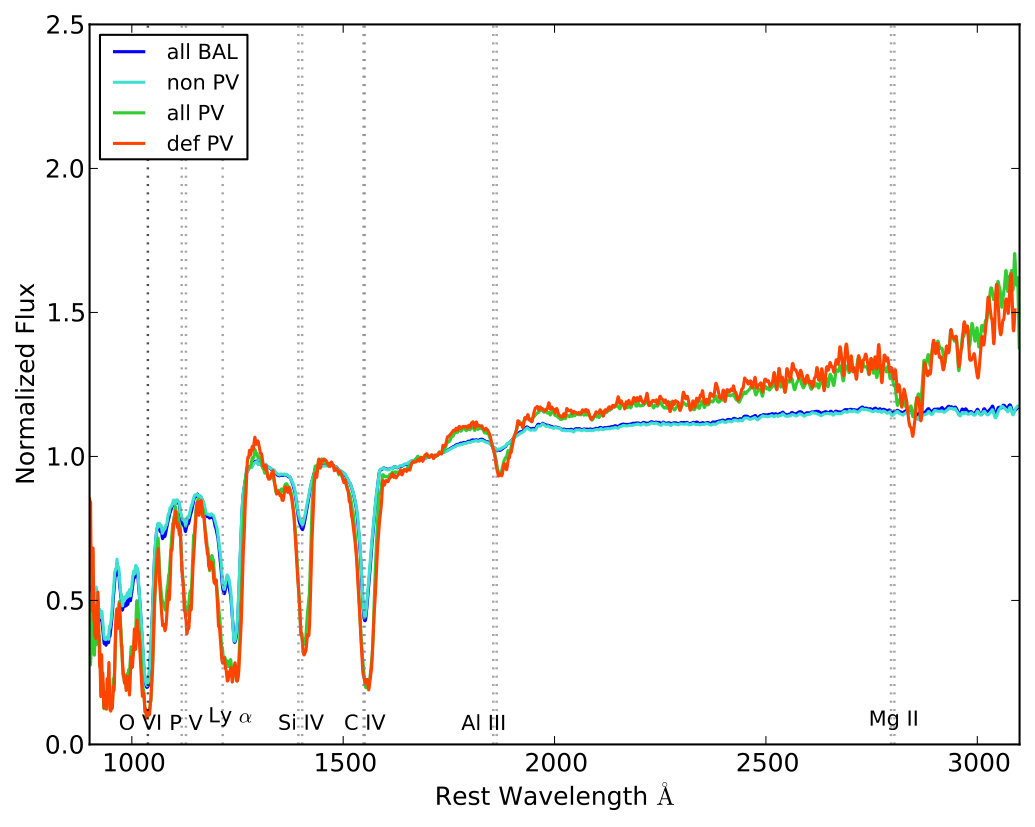 Figure 10
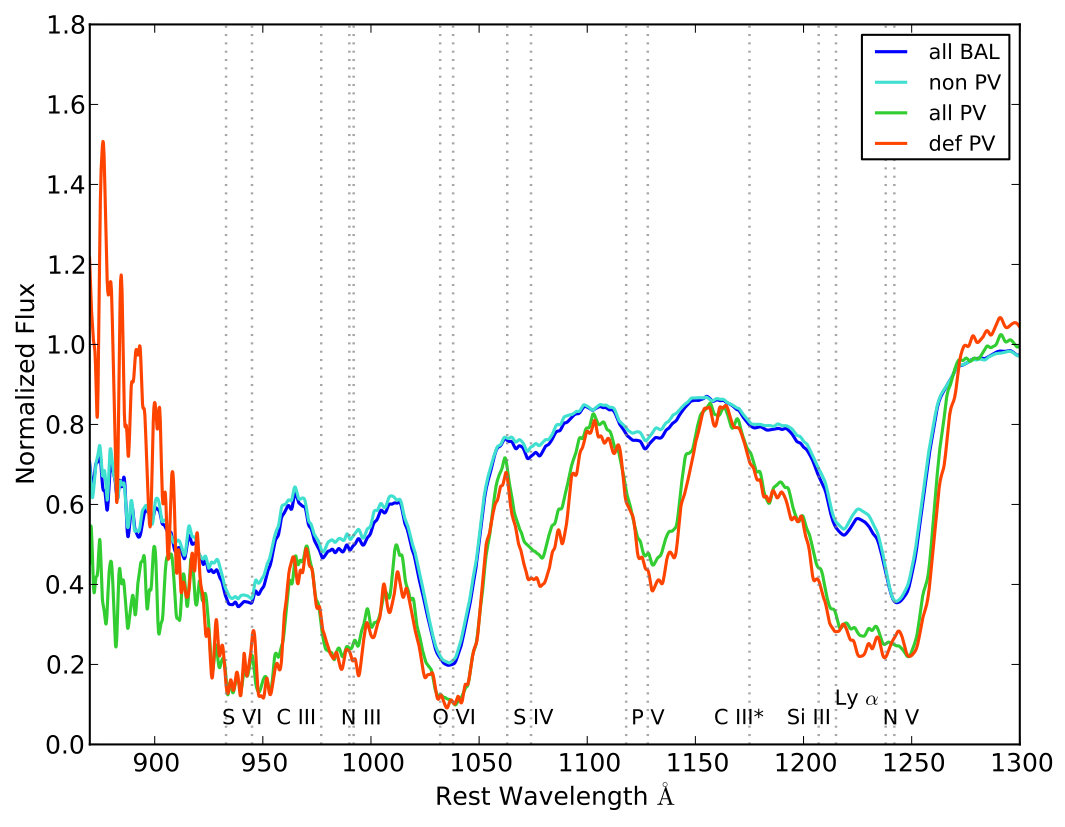 Figure 11
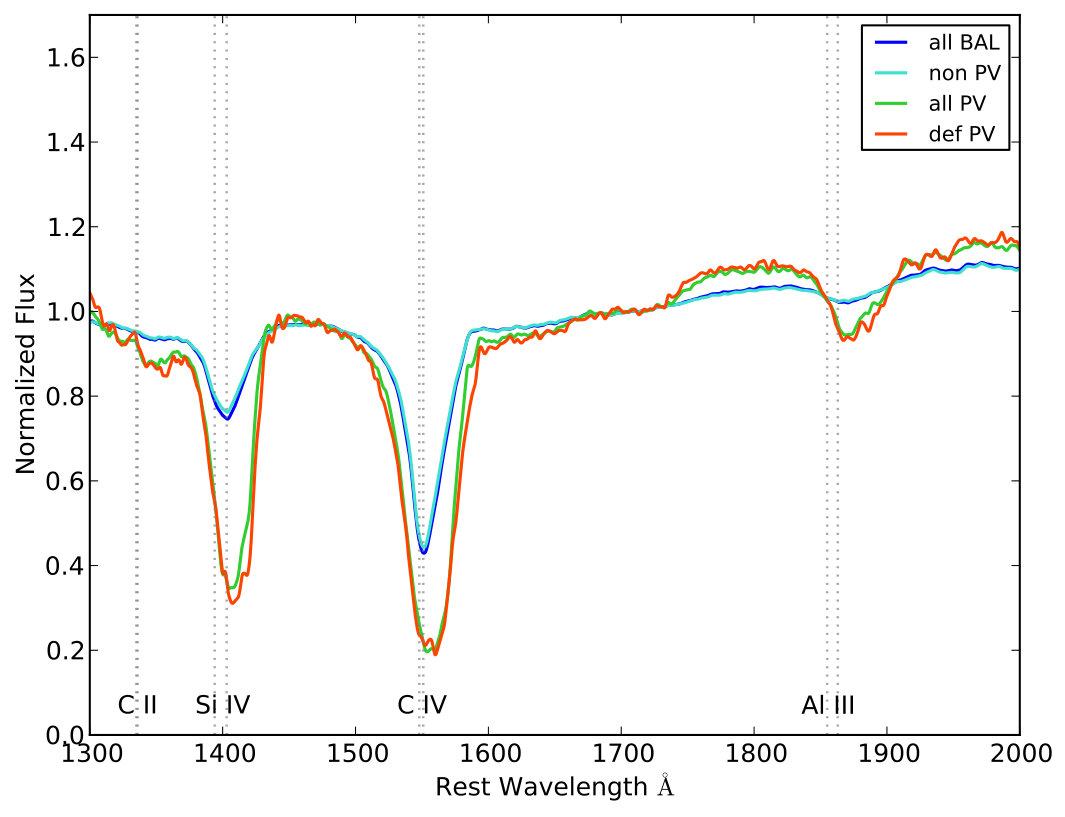 Figure 11
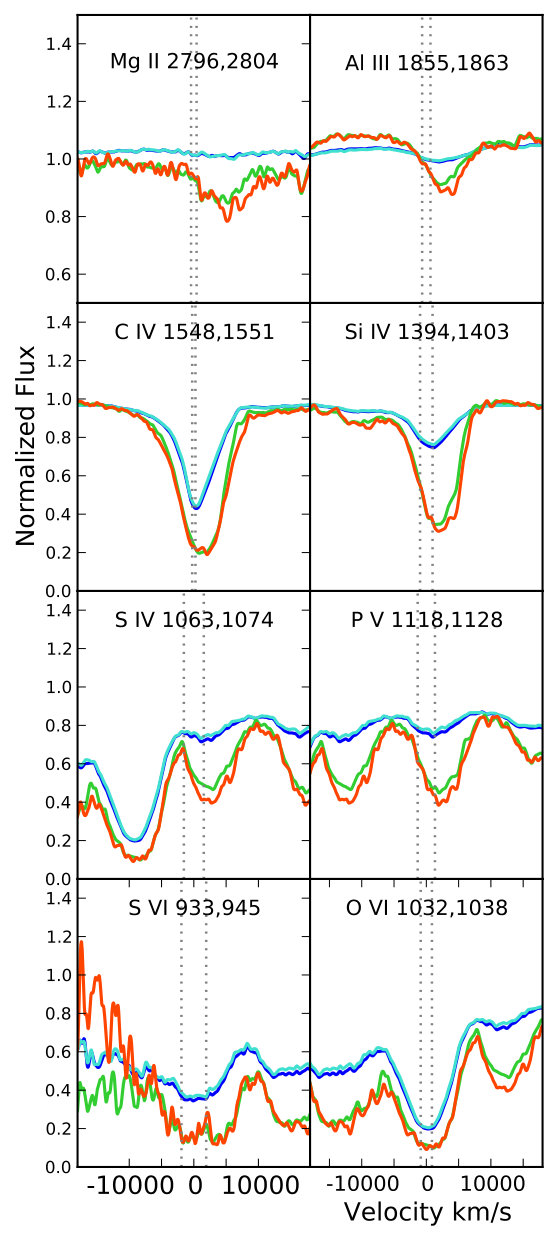 Figure 12
| SDSS Coord. Name | BI | REW(C iv) | REW(Si iv) | REW(Al iii) | ||
|---|---|---|---|---|---|---|
| (km s-1) | (Å) | (Å) | (Å) | |||
| J000202.16004216.2 | 2.432 | 20.0 | 350737 | 25.3 | 12.0 | 0.0 |
| J000902.63002638.5 | 2.510 | 20.7 | 193128 | |||
| J002709.73003020.3 | 3.106 | 19.8 | 11853350 | 65.0 | 39.8 | 9.4 |
| J004733.24020315.7 | 2.890 | 19.0 | 368671 | 6.5 | 28.6 | 13.1 |
| J010338.44020047.2 | 2.846 | 19.3 | 744473 | 41.2 | 24.4 | 0.0 |
| J010745.79005626.3 | 2.996 | 21.0 | 3214139 | 30.9 | 17.4 | 0.0 |
| J013652.52122501.5 | 2.399 | 17.9 | 532413 | 40.8 | 13.8 | 2.5 |
| J013802.07012424.4 | 2.530 | 18.1 | 1246311 | 65.1 | 38.1 | 7.2 |
| J014025.63002707.9 | 2.540 | 19.6 | 8232158 | 55.1 | 35.5 | 7.4 |
| J015032.87143425.6 | 4.188 | 20.0 | 8420271 | 47.5 | 31.2 | 8.8 |
| J015221.99062454.6 | 2.796 | 19.5 | 467063 | 31.9 | 23.9 | 9.0 |
| J015738.41105705.6 | 2.807 | 19.7 | 352374 | |||
| J022122.51044658.8 | 2.628 | 19.8 | 2155322 | |||
| J024946.49020104.1 | 2.571 | 19.9 | 158248 | 14.1 | 0.0 | 0.0 |
| J025000.59002431.0 | 2.792 | 20.0 | 425888 | 32.2 | 15.6 | 0.0 |
| J025042.45003536.7 | 2.397 | 18.3 | 48514 | 31.5 | 23.4 | 5.7 |
| J072444.07392711.8 | 2.438 | 19.6 | 275417 | 8.9 | 11.8 | 4.1 |
| J074610.12233837.5 | 3.129 | 19.8 | 6287859 | |||
| J075145.41174756.6 | 2.968 | 20.0 | 6591251 | 39.3 | 28.5 | 0.0 |
| J075445.02333215.6 | 2.690 | 19.7 | 544490 | 41.6 | 20.6 | 0.0 |
| J080029.38124836.9 | 3.090 | 19.4 | 550592 | 41.5 | 21.6 | 0.0 |
| J080040.95160913.0 | 3.529 | 19.0 | 4915268 | |||
| J080814.93442008.3 | 2.633 | 20.3 | 414376 | 30.4 | 20.1 | 0.0 |
| J081003.93522507.4 | 3.895 | 19.0 | 465129 | 26.7 | 16.3 | 0.0 |
| J082330.71111102.2 | 2.932 | 19.6 | 3151171 | 33.5 | 22.8 | 6.0 |
| J083403.37044818.3 | 3.096 | 20.6 | 2135245 | |||
| J083509.03033308.0 | 2.575 | 20.0 | 7382337 | |||
| J084221.94373331.0 | 2.381 | 20.4 | 119018 | 16.2 | 0.0 | 0.0 |
| J094602.54364701.1 | 3.230 | 20.2 | 4959205 | |||
| J101225.00405753.3 | 3.164 | 19.8 | 4641206 | 37.7 | 21.3 | 14.0 |
| J101324.20064900.3 | 2.766 | 18.9 | 257323 | 5.0 | 17.6 | 8.5 |
| J102154.00051646.3 | 3.439 | 18.2 | 945625 | 44.8 | 30.9 | 10.8 |
| J102225.90041824.2 | 3.029 | 20.5 | 1810374 | |||
| J102744.88041737.5 | 2.659 | 20.6 | 133 | |||
| J102947.67422619.5 | 2.542 | 20.7 | 2271127 | |||
| J103220.01025037.1 | 3.054 | 20.6 | 2955360 | |||
| J103242.71433605.3 | 3.491 | 19.2 | 268519 | 18.8 | 9.3 | 0.0 |
| J103958.20061119.7 | 3.152 | 20.2 | 848170 | |||
| J104846.63440710.7 | 4.347 | 19.6 | 1282677 | 65.0 | 43.8 | 9.5 |
| J104932.66044031.4 | 2.518 | 19.4 | 549256 | 40.2 | 21.2 | 3.9 |
| J105233.16015527.3 | 2.481 | 19.2 | 504933 | 29.5 | 15.3 | 0.0 |
| J105404.77020931.4 | 2.705 | 20.8 | 123680 | |||
| J105928.52011417.2 | 2.656 | 19.2 | 31529 | 23.6 | 10.7 | 0.0 |
| J114056.80002329.9 | 3.603 | 19.5 | 308586 | |||
| J114740.54005545.1 | 2.694 | 19.8 | 3238144 | 37.7 | 14.1 | 0.0 |
| J114847.08395544.8 | 3.001 | 19.6 | 6970324 | 43.3 | 25.5 | 0.0 |
| J115321.80371957.2 | 2.492 | 19.3 | 7022113 | 43.7 | 19.3 | 0.0 |
| J121937.13071157.7 | 2.592 | 21.0 | 2218135 | |||
| J122124.36043351.0 | 3.143 | 18.9 | 726767 | 40.6 | 26.0 | 5.9 |
| J124503.29010929.0 | 3.219 | 20.2 | 3213859 | |||
| J124557.16344511.7 | 2.500 | 19.6 | 243326 | 0.0 | 15.1 | 6.0 |
| J130902.37403901.5 | 2.440 | 18.0 | 282819 | 7.1 | 17.5 | 11.1 |
| J132604.26333041.1 | 2.513 | 19.7 | 860793 | 23.7 | 27.1 | 9.6 |
| J135536.89320323.7 | 2.772 | 20.2 | 430067 | 27.7 | 17.9 | 5.1 |
| J140323.37040640.4 | 2.775 | 19.9 | 1966231 | |||
| J141906.28362801.9 | 2.401 | 18.7 | 709115 | 33.8 | 33.6 | 26.0 |
| J142102.24355718.4 | 3.052 | 20.2 | 4336212 | 10.0 | 15.2 | 9.5 |
| J142107.42360920.2 | 2.663 | 19.5 | 3749124 | 24.2 | 13.3 | 0.0 |
| J143008.04063914.4 | 2.532 | 18.4 | 297047 | 13.0 | 19.1 | 5.5 |
| J143223.09000116.4 | 2.474 | 20.1 | 81719 | 11.5 | 17.1 | 0.0 |
| J143632.04053958.9 | 2.939 | 19.9 | 7139204 | 39.8 | 34.7 | 6.1 |
| SDSS Coord. Name | BI | REW(C iv) | REW(Si iv) | REW(Al iii) | ||
|---|---|---|---|---|---|---|
| (km s-1) | (Å) | (Å) | (Å) | |||
| J152316.17335955.5 | 3.633 | 20.0 | 368895 | |||
| J152656.78211113.8 | 2.431 | 19.6 | 367038 | 21.9 | 12.0 | 5.6 |
| J152657.97163803.0 | 2.961 | 20.3 | 3624264 | |||
| J152842.91193105.7 | 2.668 | 19.9 | 10863321 | 35.2 | 42.4 | 15.2 |
| J153330.03222924.4 | 2.850 | 20.2 | 5244834 | |||
| J154246.94054359.3 | 2.954 | 19.6 | 4102143 | 30.1 | 19.2 | 4.8 |
| J154727.18031313.6 | 2.499 | 19.6 | 209580 | 17.0 | 14.8 | 0.0 |
| J154910.90320620.7 | 3.078 | 20.0 | 3625159 | 30.6 | 12.2 | 0.0 |
| J160438.61181812.2 | 2.920 | 20.2 | 6061189 | 38.9 | 25.7 | 5.1 |
| J161050.39062039.5 | 2.524 | 19.4 | 683746 | 35.9 | 22.9 | 4.5 |
| J162554.62322626.5 | 3.745 | 19.9 | 4120250 | |||
| J164656.26224454.6 | 2.532 | 19.8 | 400226 | 13.7 | 26.7 | 14.8 |
| J165053.78250755.4 | 3.319 | 18.6 | 426919 | 35.1 | 17.9 | 7.3 |
| J165710.56233700.2 | 2.784 | 19.9 | 2942 | |||
| J172312.99385422.7 | 2.613 | 20.0 | 7229197 | |||
| J214855.68001452.6 | 2.488 | 19.8 | 280213 | 19.7 | 3.5 | 0.0 |
| J230721.90011118.0 | 2.780 | 19.2 | 289221 | 15.1 | 13.8 | 5.0 |
| J231923.84004127.6 | 2.547 | 19.1 | 34859 | 21.3 | 8.5 | 0.0 |
| J233829.30005933.8 | 3.019 | 20.6 | 3178302 | |||
| J234058.62011651.2 | 3.084 | 20.2 | 59321000 |
| SDSS Coord. Name | BI | REW(C iv) | REW(Si iv) | REW(Al iii) | ||
|---|---|---|---|---|---|---|
| (km s-1) | (Å) | (Å) | (Å) | |||
| J001610.79013608.0 | 2.839 | 19.7 | 136373 | |||
| J001824.95001525.8 | 2.443 | 19.4 | 7139118 | 46.9 | 17.1 | 0.0 |
| J002417.61000846.2 | 4.000 | 20.2 | 4179245 | 0.0 | 22.8 | 8.9 |
| J003859.34004252.2 | 2.495 | 20.1 | 939384 | 49.4 | 30.9 | 0.0 |
| J003937.53043025.6 | 2.819 | 20.2 | 4752277 | 19.1 | 24.7 | 9.4 |
| J004429.13015601.1 | 2.375 | 19.6 | 298139 | 21.9 | 6.7 | 0.0 |
| J005125.63023923.4 | 3.050 | 21.0 | 1381328 | |||
| J005708.72032251.1 | 2.928 | 20.6 | 48411520 | |||
| J010124.98023949.4 | 2.619 | 21.1 | 1889135 | |||
| J011124.65084442.2 | 2.641 | 20.7 | 1140301 | |||
| J011301.52015752.6 | 3.095 | 20.5 | 1911238 | |||
| J013413.22023409.7 | 2.394 | 19.4 | 549559 | 36.0 | 7.9 | 0.0 |
| J013442.35001452.4 | 3.207 | 20.6 | 316748 | 21.8 | 8.9 | 0.0 |
| J014141.32011205.7 | 3.157 | 20.6 | 171574 | 23.5 | 15.2 | 0.0 |
| J015949.48063932.1 | 2.865 | 20.9 | 25826 | |||
| J022007.64010731.1 | 3.423 | 18.2 | 56416 | 47.7 | 8.1 | 0.0 |
| J073656.27440308.7 | 2.700 | 19.9 | 12328 | 10.3 | 0.0 | 0.0 |
| J073751.52455140.5 | 2.390 | 19.6 | 380936 | 27.2 | 16.3 | 0.0 |
| J074734.15152153.0 | 2.395 | 20.5 | 135932 | |||
| J075014.40432635.2 | 3.173 | 19.2 | 574364 | 34.0 | 13.6 | 0.0 |
| J080343.77462345.9 | 2.458 | 20.3 | 375888 | |||
| J080904.19505543.9 | 3.118 | 20.8 | 3904474 | |||
| J081208.62534800.3 | 2.590 | 19.2 | 332128 | 22.2 | 0.0 | 0.0 |
| J081410.14323225.1 | 3.602 | 20.2 | 4445150 | 29.3 | 3.9 | 0.0 |
| J081454.35422453.4 | 2.350 | 19.9 | 168612 | |||
| J081508.91122401.2 | 2.798 | 20.9 | 3101248 | |||
| J081608.28210213.2 | 3.019 | 18.8 | 553650 | 33.5 | 16.3 | 0.0 |
| J082227.60404153.9 | 2.955 | 20.6 | 6899670 | 39.9 | 17.3 | 0.0 |
| J082249.76322712.3 | 2.495 | 18.9 | 26066 | 21.3 | 9.7 | 0.0 |
| J082543.23383829.2 | 2.996 | 20.1 | 336258 | 20.2 | 12.6 | 0.0 |
| J083120.08355833.8 | 3.079 | 20.9 | 111440 | |||
| J083715.90001521.6 | 2.449 | 19.0 | 601328 | 38.3 | 17.8 | 0.0 |
| J090035.30040846.4 | 2.809 | 20.3 | 425092 | 23.8 | 15.9 | 0.0 |
| J090658.65021729.2 | 2.655 | 20.7 | 4178134 | |||
| J093442.60001648.9 | 2.883 | 20.7 | 3300358 | |||
| J093707.90001041.8 | 2.531 | 19.9 | 3459245 | |||
| J094431.33033411.6 | 3.006 | 19.5 | 432489 | 27.7 | 19.0 | 0.0 |
| J094633.97365516.8 | 2.855 | 19.1 | 2721139 | 11.6 | 18.9 | 0.0 |
| J094906.04011249.9 | 2.743 | 19.1 | 311027 | 20.5 | 15.1 | 0.0 |
| J095333.70033623.7 | 3.268 | 19.8 | 6773330 | 38.6 | 32.7 | 0.0 |
| J095442.89432512.0 | 2.478 | 19.3 | 14542140 | 40.0 | 37.0 | 33.2 |
| J095508.25014627.6 | 2.607 | 19.3 | 357516 | 27.6 | 12.3 | 0.0 |
| J100047.38050203.7 | 2.645 | 20.6 | 3441206 | |||
| J100049.54005118.2 | 2.935 | 19.5 | 202133 | 25.0 | 2.6 | 0.0 |
| J101412.56394135.7 | 3.269 | 19.7 | 4880151 | 34.6 | 23.4 | 0.0 |
| J102251.29031529.4 | 3.583 | 20.6 | 2167510 | |||
| J104059.79055524.4 | 2.454 | 19.3 | 503858 | 12.3 | 25.6 | 11.2 |
| J104247.56061521.4 | 2.523 | 20.6 | 193550 | |||
| J105111.79420356.8 | 2.932 | 20.1 | 9993519 | 48.1 | 25.8 | 0.0 |
| J111541.03335202.6 | 2.889 | 20.4 | 3183423 | |||
| J112548.79004547.1 | 3.264 | 21.1 | 182039 | |||
| J114548.38393746.6 | 3.119 | 17.7 | 25203 | 21.2 | 9.3 | 0.0 |
| J114926.79321902.6 | 3.228 | 20.0 | 7222352 | 39.7 | 23.3 | 3.0 |
| J120447.15330938.7 | 3.610 | 18.4 | 1372118 | 51.9 | 64.5 | 42.3 |
| J120704.75033243.9 | 2.713 | 20.4 | 154756 | |||
| J120834.84002047.7 | 2.683 | 18.3 | 4172 | |||
| J121858.15005053.7 | 3.120 | 20.1 | 6801185 | 40.1 | 21.0 | 0.0 |
| J122254.15061041.3 | 2.441 | 19.7 | 8786128 | 49.1 | 20.9 | 0.0 |
| J124526.35341956.5 | 3.588 | 20.7 | 52512 | |||
| J130101.92382654.2 | 2.813 | 20.0 | 4187649 | |||
| J131037.33062347.8 | 3.040 | 19.3 | 205346 | 7.4 | 11.6 | 3.2 |
| J131333.01005114.3 | 2.940 | 19.2 | 3710139 | 31.4 | 22.0 | 7.4 |
| SDSS Coord. Name | BI | REW(C iv) | REW(Si iv) | REW(Al iii) | ||
|---|---|---|---|---|---|---|
| (km s-1) | (Å) | (Å) | (Å) | |||
| J132004.70363830.1 | 2.774 | 19.3 | 4663140 | 36.6 | 20.7 | 0.0 |
| J132139.86004151.9 | 3.091 | 18.7 | 475539 | 31.9 | 36.9 | 5.1 |
| J134504.32071349.0 | 3.048 | 21.3 | 397103 | |||
| J140105.31062917.8 | 2.383 | 19.4 | 4897151 | 34.8 | 16.2 | 9.9 |
| J140453.03035544.9 | 2.800 | 19.1 | 219085 | 19.6 | 9.6 | 0.0 |
| J140532.90022957.3 | 2.832 | 18.2 | 590319 | 39.3 | 12.6 | 0.0 |
| J141017.57010657.7 | 2.817 | 20.5 | 483275 | 30.0 | 19.2 | 0.0 |
| J141934.64050327.1 | 2.496 | 19.4 | 352622 | 20.8 | 10.7 | 0.0 |
| J145252.35061827.4 | 3.096 | 19.8 | 4462113 | 27.3 | 8.9 | 0.0 |
| J151102.00012659.0 | 2.924 | 19.1 | 456367 | 29.6 | 15.8 | 2.2 |
| J151211.22012807.1 | 2.705 | 19.7 | 267333 | 8.3 | 15.2 | 6.7 |
| J153124.37213305.4 | 2.972 | 19.7 | 11782387 | 38.4 | 27.7 | 17.7 |
| J153252.96023217.2 | 2.712 | 19.3 | 322555 | 38.7 | 21.8 | 3.9 |
| J153637.33060631.1 | 2.475 | 20.6 | 2849210 | |||
| J154435.61001928.0 | 2.659 | 19.1 | 185128 | 17.0 | 8.0 | 0.0 |
| J155514.85100351.3 | 3.505 | 18.3 | 840519 | 36.9 | 30.7 | 24.0 |
| J161626.54121955.7 | 2.975 | 19.6 | 5610110 | 23.3 | 41.1 | 18.2 |
| J163402.87251635.4 | 2.602 | 19.7 | 17948 | 12.7 | 5.7 | 0.0 |
| J165905.52342937.5 | 2.531 | 20.5 | 2765170 | |||
| J211137.38023941.9 | 3.180 | 18.4 | 608344 | 37.0 | 31.7 | 3.8 |
| J214244.85004528.2 | 2.498 | 19.2 | 343712 | 23.3 | 11.0 | 0.0 |
| J222725.45000936.1 | 2.566 | 19.6 | 560419 | 32.2 | 20.1 | 3.2 |
| J231656.44002240.9 | 3.057 | 21.0 | 3314615 | |||
| J235859.51020847.5 | 2.921 | 19.0 | 538983 | 31.4 | 12.6 | 0.0 |
Peer Reviews
No public reviews on file for this paper yet. If you reviewed it on a platform where reviews are public (OpenReview, ICLR, NeurIPS, ICML), you can paste yours below so the community can read it here.
Videos
No videos yet. Explain this paper in a talk, walkthrough, or lecture? Add one.
Quasars with P v broad absorption in BOSS data release 9
D. M. Capellupo1,2 , F. Hamann3,4, H. Herbst4, W. N. Brandt5,6,7, J. Ge4,I. Pâris8, P. Petitjean9, D. P. Schneider5,6, A. Streblyanska10,11, D. York12,13
1Department of Physics, McGill University, Montreal, Quebec, H3A 2T8, Canada
2McGill Space Institute, McGill University, Montreal, QC, H3A 2A7, Canada
3Department of Physics and Astronomy, University of California, Riverside, CA 92507, USA
4Department of Astronomy, University of Florida, Gainesville, FL 32611-2055, USA
5Department of Astronomy and Astrophysics, The Pennsylvania State University, University Park, PA 16802
6Institute for Gravitation and the Cosmos, The Pennsylvania State University, University Park, PA 16802
7Department of Physics, Pennsylvania State University, University Park, PA 16802, USA
8Aix Marseille Université, CNRS, LAM, (Laboratoire d’Astrophysique de Marseille), Marseille, France
9Institut d’Astrophysique de Paris, Université Paris 6-CNRS, UMR7095, 98bis Boulevard Arago, F-75014 Paris, France
10Instituto de Astrofisica de Canarias (IAC), E-38200 La Laguna, Tenerife, Spain
11Departamento de Astrofisica, Universidad de La Laguna (ULL), E-38205 La Laguna, Tenerife, Spain
12Department of Astronomy & Astrophysics, University of Chicago, Chicago, IL 60637
13The Enrico Fermi Institute, University of Chicago, Chicago, IL 60637 E-mail:[email protected] (DMC)
Abstract
Broad absorption lines (BALs) found in a significant fraction of quasar spectra identify high-velocity outflows that might be present in all quasars and could be a major factor in feedback to galaxy evolution. Understanding the nature of these flows requires further constraints on their physical properties, including their column densities, for which well-studied BALs, such as C iv \lambda$$\lambda1548,1551, typically provide only a lower limit because of saturation effects. Low-abundance lines, such as P v \lambda$$\lambda1118,1128, indicate large column densities, implying outflows more powerful than measurements of C iv alone would indicate. We search through a sample of 2694 BAL quasars from the SDSS-III/BOSS DR9 quasar catalog for such absorption, and we identify 81 ‘definite’ and 86 ‘probable’ detections of P v broad absorption, yielding a firm lower limit of 3.06.2% for the incidence of such absorption among BAL quasars. The P v-detected quasars tend to have stronger C iv and Si iv absorption, as well as a higher incidence of LoBAL absorption, than the overall BAL quasar population. Many of the P v-detected quasars have C iv troughs that do not reach zero intensity (at velocities where P v is detected), confirming that the outflow gas only partially covers the UV continuum source. P v appears significantly in a composite spectrum of non-P v-detected BAL quasars, indicating that P v absorption (and large column densities) are much more common than indicated by our search results. Our sample of P v detections significantly increases the number of known P v detections, providing opportunities for follow-up studies to better understand BAL outflow energetics.
keywords:
galaxies: active – quasars:general – quasars:absorption lines.
††pagerange: Quasars with P v broad absorption in BOSS data release 9–A††pubyear: 2002
1 Introduction
High velocity outflows, originating from quasar accretion discs, likely exist in all quasars and may be an important contributor to feedback to galaxy evolution. One of the signatures of these outflows is broad absorption lines (BALs) in quasar spectra. While numerous works have studied BALs, many properties of the outflows themselves are still uncertain. Further information on their location, column densities, mass outflow rates, and energetics is required to understand the nature of these flows.
In some cases, the distances of the flows from the central black hole can be inferred from BAL variability (Misawa et al., 2007; Moe et al., 2009; Capellupo et al., 2011; Capellupo et al., 2013; Capellupo et al., 2014; Hall et al., 2011; Rodríguez Hidalgo et al., 2011; Rodríguez Hidalgo et al., 2013) or from excited state lines with photoionization modelling (Moe et al., 2009; Dunn et al., 2010; Borguet et al., 2013).
Column density estimates, in general, provide only lower limits because of saturation. In an unknown number of cases, measuring the apparent optical depth of a BAL trough directly from the observed spectra provides only a lower limit on the true optical depth in the line, and thus the column density of the flow, because the absorbing gas only partially covers the background light source (e.g. Hamann, 1998; Arav et al., 1999; Gabel et al., 2003). Constraining the energetics of the flows requires knowledge of both the locations and the column densities of the outflows.
One method that overcomes this problem of saturation in BALs is searching for absorption in ions of low abundance. P v is such an ion, for P/C 0.001 in the Sun (Asplund et al., 2009). Besides its low abundance, P v is a good choice because it has a resonance doublet at wavelengths 1118 and 1128 Å, easily accessible from ground-based observations of quasars of moderate to high redshift, and its ionization is similar to much more abundant and commonly measured ions such as C iv \lambda$$\lambda1548,1551. P v absorption should be present if the column densities in the outflows are sufficiently large. Furthermore, if the relative abundances are similar to solar abundances, P v absorption implies that commonly observed BALs, such as C iv, are actually highly optically thick and the total outflow column densities are much larger than the apparent optical depths would indicate.
BAL quasars are typically identified based on the presence of C iv broad absorption. Several studies have used the assumption of solar abundances and a standard ionizing spectrum in photoionization models to determine the true C iv optical depths, as well as the true total column densities, based on the presence of P v absorption. Hamann (1998) finds that the true C iv optical depths are at least 800 times greater than the P v optical depth in idealized BAL clouds that are optically thin throughout the Lyman continuum. The ratio of C iv to P v optical depths might be as low as 100 in other situations with total column densities up to cm*-2*. Similar results, across a wide range of physical conditions, are found by Leighly et al. (2009); Leighly et al. (2011). Borguet et al. (2012) use many more observational constraints on the outflow in a particular quasar to determine a C iv/P v optical depth ratio of 1200. Therefore, the presence of even weak P v absorption indicates a highly saturated C iv BAL and, therefore, large total column densities.
Building upon the results of Hamann (1998) and Leighly et al. (2009); Leighly et al. (2011), Capellupo et al. (2014) estimate that the detection of a strong P v BAL, with apparent optical depth reaching as high as 1.5, indicates log 22.3 cm*-2*. Furthermore, they argue that the detection of variability in a saturated C iv trough, at the same velocities as the P v absorption, strongly favors the hypothesis of outflow clouds crossing our line of sight to the continuum source. This behaviour indicates distances much smaller than those determined via excited state line analysis (sub-parsec to pc scales versus kpc scales; Chamberlain et al. 2015 and references therein). Despite the smaller distance, Capellupo et al. (2014) estimate the ratio of the kinetic energy luminosity of the flow to the bolometric luminosity of the quasar to be of the order of magnitude necessary for feedback to the host galaxy (0.005 to 0.05; e.g. Prochaska & Hennawi 2009; Hopkins & Elvis 2010).
Altogether, these previous results demonstrate the importance of the detection of low abundance ions in understanding the energetics of BAL outflows. To date, however, detections of P v absorption have been limited to a handful of individual cases (Turnshek, 1988; Junkkarinen et al., 1997; Hamann, 1998; Borguet et al., 2012; Capellupo et al., 2014). Identifying clear detections of P v absorption in a large sample of BAL quasars would allow comparisons between BAL quasars with such detections and those without. Certain sub-groups of BAL quasars, namely LoBALs and FeLoBALs, are known to have different properties than the overall BAL population. For example, they tend to have redder colours than the overall BAL quasar population (e.g., Gibson et al., 2009). Filiz Ak et al. (2014) finds evidence for a correlation between the incidence of P v absorption and the existence of Si iv and Al iii absorption. It will be useful for the understanding of BAL quasars in general to further investigate how quasars with P v detections, which are indicative of large outflow column densities, are similar or different to BALs without P v absorption. Furthermore, a large list of P v detections will prove useful for future studies at other wavelengths that can further assess the energetics and other properties of quasars with P v detections as compared to those without.
Therefore, we perform a systematic search for P v absorption in the Sloan Digital Sky Survey III (SDSS-III; Eisenstein et al. 2011) Baryon Oscillation Spectroscopic Survey (BOSS; Dawson et al. 2013), which uses the SDSS 2.5-meter telescope at Apache Point Observatory (Gunn et al., 2006). The BOSS survey is ideally suited to this search as it was designed to target over 100,000 quasars at redshifts (Bolton et al., 2012; Ross et al., 2012), and, as a result, it contains one of the largest samples of BAL quasars. Compared to the original SDSS-I/II survey (York et al., 2000), the BOSS spectrograph (Smee et al., 2013) has smaller fibers, improved detectors, higher throughput, and a wider wavelength range, extending to 3600 Å at the blue end (Dawson et al., 2013). Despite the more favorable wavelength coverage, our search is limited to quasars at a redshift because of the location of the P v doublet.
Furthermore, since the wavelength of P v places it in the Ly forest, it is nearly impossible to rule out the existence of weak or narrow P v. Therefore, our systematic search will only be able to identify those BAL quasars with a clear detection of P v, at the same outflow velocities as the C iv BALs, which were originally used to identify BAL quasars among the BOSS quasar sample.
Section 2 describes our parent sample of BAL quasars and our method of searching for P v absorption. Section 3 discusses the general properties of the quasars with P v detections. In Section 4, we present composite spectra of BAL quasars both with and without P v detections, and we conclude with some discussion in Section 5.
2 Sample Selection and P v Search
The SDSS-III BOSS DR9 (Ahn et al., 2012) quasar (DR9Q) catalog (Pâris et al., 2012) includes measurements of the balnicity index (BI; Weymann et al. 1991), which is the standard indicator of a BAL quasar. In order to cover the full range of BAL strengths, we select those quasars with BI 0 and BI . Because of the wavelengths of the P v doublet, 1118 and 1128 Å, we must limit our sample to . The BOSS spectrograph provides coverage down to 3600 Å, which corresponds to 1090 Å in the rest-frame of a 2.3 object. These selection criteria produce a parent sample of 2694 BAL quasars.
Two of the authors, DMC and FH, independently visually inspected all 2694 of the DR9Q BAL quasars that met our BI criteria to search for detections of P v absorption. We examine both the full spectrum and the individual wavelength regions of the C iv absorption and potential Si iv and P v absorption. We used the velocities of the C iv and, if it is present, Si iv troughs to guide our search for P v. The location of P v in the Ly forest means that any potential P v absorption is likely to be blended with unrelated, intervening absorption. Another difficulty, particularly for those quasars near the lower redshift cutoff, is the decrease in the signal-to-noise ratio towards the blue end of the spectrum.
For these reasons, we divide our candidate P v detections into two lists: ‘definite’ and ‘probable’. Figs 1 to 3 show nine example spectra of these ‘definite’ and ‘probable’ P v-detected quasars (spectra of all the P v-detected quasars are available online). For each quasar, we plot the rest wavelength range 965 to 1600 Å, which includes lines from O vi 1037 through C iv. To the right of each spectrum are inset plots of the C iv, Si iv, and P v BALs. Broad, deep absorption at the same velocity, with similar velocity width and profile shape, as C iv and/or Si iv, in a relatively high signal-to-noise ratio spectrum, indicates a secure ‘definite’ detection of P v (for example, J002709+003020 in Fig. 1 and J124557+344511 in Fig. 2). If the signal-to-noise ratio is low, then we prefer to include such a detection in the ‘probable’ list, in order to be conservative in our classifications. In some cases, there is doublet structure at the expected location, matching the expected wavelength separation, of P v, providing a strong confirmation that it is a ‘definite’ detection of P v, such as in J013802.07+012424.4 and J214855.68-001452.6 in Fig. 1. There appears to be a doublet at the expected location of P v in J011301.52-015752.6 and J081410.14+323225.1 in Fig. 3, but the relatively low signal-to-noise ratio in J011301.52-015752.6 and the weak Si iv in J081410.14+323225.1 makes these ‘probable’ detections, rather than secure ‘definite’ detections.
The location of P v in the Ly forest and our reliance on C iv and/or Si iv absorption to guide our search introduces several biases. If the P v absorption is narrower than the C iv and/or Si iv absorption, it can be easily confused with Ly forest lines, leading to a bias against these narrow P v sources. Furthermore, previous work on individual cases of P v absorption have found that the shape of the Si iv trough is a better match to the shape of the P v absorption than is C iv (Junkkarinen et al., 1997; Capellupo et al., 2014). These effects bias us towards more P v detections in quasars that also have Si iv absorption. We are also biased towards higher signal-to-noise ratio spectra. The median signal-to-noise ratio is 6.3 and 6.6, respectively, for the ‘definite’ and ‘probable’ detections, whereas it is 4.5 for the parent BAL sample. In general, we are conservative in identifying P v detections, even in the ‘probable’ category, and we are therefore biased towards the strongest P v absorption features. Altogether, this means that a statistically complete sample is not possible. While weak, moderate, and narrow P v absorption lines are likely to be missed by our search, strong P v BALs are unlikely to be missed. Instead, our goal is to identify both ‘definite’ and ‘probable’ detections of P v BALs for comparisons to the overall BAL population and also for future follow-up observations of these P v detections.
Overall we identify 81 ‘definite’ and 86 ‘probable’ P v detections (out of 2694 BAL quasars), giving a firm lower limit of 3.0%, and ‘probable’ lower limit of 6.2%, for the incidence of P v absorption among BAL quasars. The SDSS coordinate names, as well as various properties from the DR9Q catalog, are listed in Table 1, for the ‘definite’ detections, and Table 2, for the ‘probable’ detections. Rest equivalent widths (REWs) for C iv, Si iv, and Al iii are listed in the DR9Q catalog only for spectra with a signal-to-noise ratio of at least 5 and a BAL with BI 500 km s*-1*.
3 Properties of P v Quasars
3.1 Overall Sample Properties
We first compare the photometric properties of the P v-detected sample with the overall BAL sample, using data tabulated in the DR9Q catalog. Fig. 4 displays the distribution of magnitude (effective wavelength of 7491Å) with redshift. To compare with all DR9 quasars, we show only the DR9 quasars with average signal-to-noise ratio 0.7 because all of our BAL spectra have signal-to-noise above this value. The figure indicates that the parent BAL quasar sample (gray shaded histogram) is well-matched in redshift to the overall quasar population (black histogram). However, the fraction of P v detections (blue and red histograms) in the redshift bin at z$$\sim3 is slightly higher than the parent BAL and overall quasar populations. This result is likely a selection effect because in the lowest redshift bin, the region of potential P v absorption is near the blue end of the spectrum, where the BOSS instrument is less sensitive. As for the distributions in magnitude, the BAL quasars clearly tend to be brighter than the overall quasar population. This behaviour is also likely a selection effect because BALs are easier to detect in higher signal-to-noise spectra (Gibson et al., 2009). The distributions of ‘definite’ and ‘probable’ P v detections, however, are consistent with the overall BAL population.
To compare the typical absorption line properties of the P v-detected quasars to the parent BAL population, we use the measurements of BI and REW tabulated in the DR9Q catalog, listed here in Tables 1 and 2 for the P v detections. Based on the DR9Q BI measurements, the average (median) BI for the ‘definite’ and ‘probable’ detections is 4550 (4000) km s*-1* and 4140 (3550) km s*-1*, respectively. The average (median) BI for the parent BAL sample is 1870 (1160) km s*-1*.
The DR9Q includes measurements of the REW of C iv, Si iv, and Al iii absorption for those quasars with BI 500 km s*-1* and signal-to-noise of at least 5 in the rest-frame UV spectrum (with these restrictions, the median BI for the parent BAL population is 2430 km s*-1* and for the P v detections is 4510 km s*-1*). Of the sources with ‘definite’ and ‘probable’ P v detections with REW measurements, 96% have a Si iv REW greater than 0, and 58% and 32%, respectively, have an Al iii REW greater than 0. In the overall DR9Q BAL quasar population, just 55% have a Si iv REW greater than 0 and 10% have an Al iii REW greater than 0 (this fraction of BOSS BAL quasars with Al iii absorption is consistent with earlier studies that determine that LoBALs comprise 10% of the overall BAL population; Trump et al. 2006). Keep in mind that we are biased towards P v detections in quasars with Si iv absorption because of our visual inspection procedure (Section 2), but these results are consistent with those of Filiz Ak et al. (2014), who observe many more instances of prominent P v absorption in BAL quasars with Al iii or Si iv BALs than those without.
Fig. 5 presents the distribution in BI, REW(C iv), REW(Si iv), and REW(Al iii) for all DR9Q BAL quasars, definite P v detections, combined ‘definite’ and ‘probable’ detections, and BAL quasars with REW(Al iii) 0. The median values of each parameter are indicated by the dashed lines, and the 1 error bars are based on the counting statistics for the number of measurements in each bin (Cameron, 2011). It is clear that the P v detections are skewed towards quasars with stronger C iv and Si iv BALs, as compared to the overall BAL population. The distributions also indicate that the P v detections tend to have similar C iv and Si iv BAL strengths as all BAL quasars with low-ionization absorption, which we designate here as ‘BALQs with REW(Al iii) 0.’
Fig. 6 displays the colour versus magnitude, where is one of four bands of the Wide-field Infrared Survey Explorer (WISE; Wright et al., 2010). The colour measures the spectral slope across the near-UV to optical wavelengths in the quasar rest-frame and is a good indicator of dust reddening for quasars at these redshifts (Hamann et al, in prep). There is a slight trend towards redder colours for the P v-detected quasars, compared to the overall BAL quasar population. This colour difference is probably related to the tendency for P v-detected quasars to have stronger absorption in low-ionization lines such as Al iii and Mg ii (see Fig. 5 and Section 4; also, Herbst et al. in preparation). These low-ionization features are a defining characteristic of LoBALs, which are known to have redder colours than BAL quasars without them (HiBALs; Sprayberry & Foltz, 1992; Brotherton et al., 2001; Trump et al., 2006; Gibson et al., 2009).
We also compare the FIRST radio measurements of P v detections to the overall BAL sample. Only of the parent quasar population and of the BAL quasars are detected by FIRST. In comparison, and of the ‘definite’ and ‘probable’ P v-detected quasars, respectively, have FIRST detections. Combining the ‘definite’ and ‘probable’ P v-detected quasars yields with FIRST detections. Given the errors due to small number statistics for the P v-detected quasars, the incidence of radio-loud quasars appears to be consistent between the P v-detected sample and the overall (optically-selected) quasar and BAL quasar populations.
3.2 Individual Spectra
Besides examining the overall properties of the different BAL quasar populations, it is informative to investigate the individual examples of P v absorption. P v absorption at the same velocity of C iv absorption with nonzero intensity indicates a saturated C iv trough and thus that the outflow is partially covering the AGN emission source (see Section 1). Fig. 1 includes three examples with a range of P v profile shapes, from broad and deep like the corresponding C iv BAL to a clearly identifiable doublet. In all three cases, the C iv feature reaches zero, or nearly zero, intensity. Fig. 2 shows three examples where the C iv BAL clearly does not reach zero intensity. The average covering fractions for the C iv absorption in these 3 cases ranges from 0.4 to 0.6. In quasars such as J103242+433605, P v absorption across a velocity range where C iv has a rounded or complex profile implies that this C iv profile shape is due to a velocity-dependent covering fraction, and not velocity-dependent optical depths.
Despite our bias towards finding only strong P v BALs (see Section 2), we observe that, in general, the P v absorption is not quite as deep as the corresponding C iv and Si iv absorption (see, for example, J013802+012424 in Fig. 1 and J151211+012807 in Fig. 3). However, the P v absorption is generally similar in width to the corresponding C iv and Si iv BALs, as seen in all the spectra in Figs. 1 to 3, at least in cases where it is not a resolved doublet. The depths of the C iv and P v BALs in the examples in Fig. 2 are similar. This result implies that the P v trough is also saturated with a covering fraction similar to C iv. There is some uncertainty in the depth of the P v absorption due to the possibility of unrelated Ly forest lines affecting the profile. However, in cases such as J124557+344511, where the shape of the P v absorption profile closely matches the C iv and/or Si iv profile, it is clear that the profile is shaped by a velocity-dependent covering fraction and not intervening absorption.
In general, the P v absorption profiles more closely resemble Si iv than C iv. For example, in J214855001452, both Si iv and P v have a clearly visible doublet, while the C iv spans a wider range in velocities. There are also cases such as J013802+012424 where the C iv BAL has a strong wing extending blueward, but this wing is less pronounced in Si iv and not seen in P v. However, there is also J081410+323225 (Fig. 3), where the flux within the P v absorption feature goes to zero, as in the C iv trough, but the Si iv absorption is much weaker.
Finally, the P v absorption in J013802+012424 (Fig. 1) is a doublet that appears to have the same depth in both components, indicating saturated absorption and optical depth >$$\sim3. This puts the optical depth of C iv at 1000 and gives very high values of the total column density in the outflow (see Section 5 for further discussion).
4 Composite Spectra
An approach to compare the overall properties of BAL quasars with P v detections to those without is to create composite spectra of each group. One strong advantage to analyzing composite spectra is that Ly forest lines in individual quasars average out in the composites, and, therefore, it becomes easier to identify intrinsic absorption of the different species blueward of Ly. Several earlier works, such as Reichard et al. (2003), Baskin et al. (2013), and Filiz Ak et al. (2014), have created composites of BAL quasars, and we expand on these earlier works with composites of quasars with clear P v absorption. We follow the procedures described in Herbst et al. in prep for generating the composites.
There are known flux calibration issues with the BOSS spectra (e.g. Pâris et al., 2011), so prior to creating the composite spectra, we apply a correction based on airmass to the individual spectra. The flux calibration issues and flux correction are described in Harris et al. (2016). While the corrections for individual quasars are uncertain, they are expected to be accurate, on average, for samples of quasars that are randomly located on the sky (e.g., in our composites).
We first create a composite of non-BAL quasars. To match properly the sample of BAL quasars with a sample of non-BAL quasars, we remove some of the fainter quasars to best match the distributions in absolute -magnitude (). This is intended to remove any luminosity-related biases, e.g. the Baldwin effect (Baldwin, 1977). We first impose a cut in signal-to-noise ratio. We experiment with different values of signal-to-noise ratio for this cutoff, and we find that requiring a signal-to-noise ratio of at least 1.5 produces the closest match between the distributions of BALs and non-BALs, without removing any of the definite detections of P v. This signal-to-noise ratio cut reduces the difference in median between the BAL and non-BAL samples from 0.87 to 0.50 mag. To improve further the match in , we randomly remove non-BAL quasars from the fainter bins until we obtain the best match between the two populations. This further reduces the difference in median between the two samples to 0.24 mag. Fig. 7 presents the resulting distributions of the non-BAL (blue) and BAL (grey) populations. With the exception of the additional signal-to-noise ratio cut, this is the same BAL population as described in Section 2.
We next normalize all the individual spectra by the continuum flux at 1700Å and take the median of all the spectra in these two populations. We compare these composites to the composites of three subgroups of BAL quasar spectra: the spectra of BAL quasars without detected P v absorption, all BAL quasars where we detect P v absorption, and only the definite detections of P v absorption. The results are displayed in Fig. 8.
An expansion of the Si iv and C iv absorption region is shown in Fig. 9. It is immediately clear that our P v detections tend to occur in those quasars with strong C iv and Si iv BALs, as indicated already by the examples in Figs 1 to 3 and also in Filiz Ak et al. (2014). The C iv and Si iv absorption in the parent BAL population and in the P v-detected quasars appear to occur at similar velocities and have similar shapes. The BALs are simply deeper in the P v-detected quasars. However, as discussed in Section 2, we are biased towards detecting only the strongest P v absorption features, as we are searching in the Ly forest.
It is also clear that non-BAL quasars tend to have stronger broad emission lines, including notably C iv and He ii 1640. In fact, there appears to be a progression from strong emission lines in non-BAL quasars, to moderate lines in the non-P v-detected BAL quasars, to the weakest lines in the P v-detected BAL quasars (again, we try to closely match the distribution in between the non-BAL and BAL samples in order to avoid biases like the Baldwin effect). This behaviour, particularly in He ii, is probably tied to a trend in the far-UV spectral energy distributions that increasingly favors radiative acceleration in higher column density BAL outflows with P v (see Section 5 below).
To analyze further the composite absorption troughs, we use the non-BAL spectra to remove the emission features. We first shift the BAL spectra to align the centers of the C iv BAL troughs, using the midpoint between the minimum (VMIN_CIV_2000) and maximum (VMAX_CIV_2000) velocity values of the troughs given in the DR9Q catalog (Pâris et al., 2012), to create absorber-frame composites. The non-BAL spectra are then shifted by the same distribution of shifts as the BAL spectra for each BAL category. This shifting blurs the emission features in the same way as the corresponding absorber-frame BAL composites, and dividing by the appropriately shifted non-BAL composite removes the emission features. The results are presented in Fig. 10, with the same colour scheme as Fig. 8.
Fig. 10 demonstrates that the BAL quasars with P v detections tend to have redder spectra than the overall BAL population, in agreement with Fig. 6, which shows that P v-detected quasars tend to be skewed toward redder colours as compared to the overall BAL population.
Fig. 10 also indicates a propensity for P v absorption to appear in LoBAL quasars. This is indicated by the clear Al iii and Mg ii absorption features in the P v quasar composites. In the overall BAL composite, the dip at Al iii is much shallower than in the P v composites, and there is no visible dip corresponding to Mg ii absorption. This is all in agreement with the results of Section 3, where it is shown that the incidence of Al iii absorption is much higher among the P v-detected quasars than in the overall BAL quasar population.
Finally, Fig. 11 presents expanded views of two regions of the composite spectrum of Fig. 10; the top panel is the region blueward of 1300Å, and the bottom panel is the region redward of 1300Å. Fig. 12 plots a selection of individual BALs from the normalized composite BAL spectra. In general, all of the lines (Mg ii, Al iii, C iv, Si iv, S iv, P v, S vi) are much deeper in the P v detections than in the parent BAL population. While the depth of O vi is also larger in the P v composites, the difference is not as striking as for the other lines. The bottom of the C iv and Si iv lines are also skewed toward different velocities in the all-BAL versus P v-only composites (Fig. 12). The same effect may be present in Al iii and P v, but the absorption in the all-BAL composites is too weak to make a firm conclusion. The O vi line, on the other hand, appears to be centered at the same velocities in all of the composites.
The P v absorption in the ‘definite’ composite is only slightly stronger than in the total P v composite, and the shapes of the P v feature are quite similar. This likely indicates that most, if not all, of the ‘probable’ detections are indeed actual P v detections. Furthermore, there is a clear depression in both the total BAL composite (dark blue curve) and the composite of BAL quasars without a P v detection (light blue curve) in the P v region. The fact that excluding our list of P v detections from the total BAL composite does not remove this depression indicates that our list of P v detections is missing, perhaps many, quasars with weaker P v features.
5 Discussion
We have identified 81 ‘definite’ and 86 ‘probable’ detections of P v absorption, from a parent sample of 2694 BAL quasars from the SDSS-III BOSS DR9 quasar catalog. While the P v-detected quasars are distributed similarly in redshift and luminosity as the overall BAL population (Fig. 4), they tend to have slightly redder colours (Fig. 6).
While our selection procedure and contamination by the Ly forest produces a bias towards finding only strong P v absorption, the absorption in other species, such as C iv and Si iv, is generally stronger than in the average BAL quasar. This is seen clearly when comparing the BI and REW distribution of all BAL quasars to just the quasars with P v detections (Fig. 5), as well as in the composite spectra of the two populations (e.g. Fig. 9). In fact, Si iv is present in nearly all (96%) of our P v detections, whereas it is only detected in 55% of the parent BAL population (Section 3.1; see also Filiz Ak et al. 2014).
P v, and to a lesser extent S iv and S vi, are low-abundance ions, and detections of these lines are important for constraining outflow energetics. The presence of absorption in these low abundance ions in BAL spectra indicates that other lines, such as C iv and Si iv are saturated. Previous studies using photoionization modeling, and the assumption of solar abundances, have found that the optical depth in C iv is much higher than in these low abundance ions. In particular, Dunn et al. (2012) show that the optical depth of C iv is 30 to 40 times greater than the optical depth of S iv, and various works have found that the C iv optical depth is at least 100 to 1200 times greater than the optical depth of P v (Hamann, 1998; Leighly et al., 2009; Leighly et al., 2011; Borguet et al., 2012). Thus, the presence of P v and S iv indicates saturated C iv lines, and saturated absorption lines are shaped by the covering fraction of the outflow relative to the continuum radiation source, and not by the optical depth of the line. Therefore, in cases where C iv does not reach zero intensity at the same outflow velocities as the P v and/or S iv absorption, the outflow is only partially covering the continuum source. All of this indicates that the column densities of the flows are much larger than inferred based on the C iv profile alone, with values of log determined to be 22 cm*-2*.
It is possible, however, that absorption lines that do not reach zero intensity do completely cover the background continuum source, but the BAL troughs do not reach zero because of scattered continuum light from a more extended region. This idea is consistent with some polarization data that reveal, in some cases, higher degrees of polarization in BAL troughs compared to the adjacent continuum (Ogle et al., 1999; Lamy & Hutsemékers, 2000, 2004; Brotherton et al., 2006, and refs therein). However, we present examples where P v absorption indicates saturated C iv absorption and thus a velocity-dependent covering fraction across the profile. This is inconsistent with the scenario of scattered light filling in the BAL troughs because it is unlikely that scattered light would produce such a velocity-dependent structure. In any case, whether or not the outflow completely covers the background source, the P v absorption still indicates saturated C iv absorption and large column densities.
Capellupo et al. (2014) use an estimate of the column density in one quasar, based on the detection of strong P v absorption, along with an estimate of the distance of the flow based on corresponding variability in P v and clearly saturated C iv absorption, to estimate the energetics of the flow. A column density, , of cm*-2* and a distance of 3.5 pc give a total mass of 4100 , an outflow rate of 12 M*☉* yr*-1*, and a kinetic energy luminosity of ergs s*-1*. This value is roughly 2% of the bolometric luminosity of the quasar, and is similar to the values quoted for a flow to have a significant impact on its host galaxy via feedback (e.g. Scannapieco & Oh, 2004; Hopkins & Elvis, 2010). The P v absorption in Capellupo et al. (2014) has an estimated optical depth up to 1.5. In the current work, where we identify cases in which the P v absorption has a resolved doublet with a one-to-one depth ratio (e.g., J013802+012424), the optical depth can be at least 2 times larger, giving even larger column densities, mass-loss rates, and kinetic energy than found in Capellupo et al. (2014).
In the current work, we find ‘definite’ or ‘probable’ detections of P v in 6% of the BAL quasars in our parent sample. Furthermore, the presence of absorption at the location of P v in the composite spectrum of all BAL quasars minus these P v detections (Fig. 12, light blue curve) indicates there are a number of instances of P v absorption that we missed. In fact, Herbst et al., in preparation, detect P v absorption even in composite spectra of just weak C iv BALs, indicating that P v absorption may be more common than our individual P v detections indicate. It is also unknown whether the detection of P v absorption depends on our line of sight to the flow. Therefore, a significant number of BAL outflows might have column densities similar to those of the quasar studied in Capellupo et al. (2014), whether or not they show P v absorption (although, BAL variability studies often show BALs at different velocities varying in concert, which supports the idea of a lower column density outflow that is more susceptible to changes in the global ionizing flux; see e.g. Filiz Ak et al. 2014).
With the detection of P v giving a lower limit on the column density of the flow, the main remaining variable in determining the energetics is the distance of the flow. Outflows likely exist at a range of distances, and larger distances yield higher kinetic luminosity estimates for a given column density (e.g. Capellupo et al., 2014; Chamberlain et al., 2015).
As mentioned in Section 4, the composite spectra show a weakening He ii emission line from the non-BAL quasar population to the BAL quasars to the P v quasars. A weaker He ii suggests there are fewer far-UV photons available to produce the He ii line, indicating a softer far-UV SED. Moreover, there is evidence of intrinsic X-ray weakness in some BAL quasars, as compared to non-BAL quasars (Luo et al., 2014). A harder spectrum would more highly ionize the outflowing gas, lowering its opacities and making it more difficult to accelerate (Baskin et al., 2013). Our results suggest that a softer far-UV continuum, identified by weaker He ii emission, can help to drive larger column density, more powerful outflows.
The skew towards redder colours in P v-detected quasars, as well as a much higher incidence of low-ionization absorption among P v-detected quasars, indicates an overlap between the populations of LoBAL quasars and quasars with strong P v absorption, as LoBALs also tend to have redder colours than the overall BAL population (Gibson et al., 2009). LoBALs are sometimes attributed to a younger stage of quasar evolution, with higher accretion rates and, perhaps, more powerful outflows in young, dusty host galaxies (Urrutia et al., 2009; Glikman et al., 2012, and references therein). Another possibility is that LoBALs are the result of orientation effects, where lower degrees of ionization and more dust extinction appear along lines of sight nearer the accretion disc plane (Hamann & Sabra 2004; Baskin et al. 2013; and figure 16 of Filiz Ak et al. 2014). Either of these interpretations could apply to quasars with P v absorption. The large column densities and more powerful outflows that P v absorption suggests could occur either in younger quasars or along sightlines closer to the accretion disc plane.
Further investigations utilizing the large sample of P v detections in this work will help to answer some of the remaining questions on the typical energetics of BAL flows.
Acknowledgments
We thank the referee for helpful comments on the manuscript. FH and HH acknowledge support from the USA National Science Foundation (NSF) grant AST-1009628. WNB acknowledges support from NSF grant AST-1516784.
Funding for SDSS-III has been provided by the Alfred P. Sloan Foundation, the Participating Institutions, the National Science Foundation, and the U.S. Department of Energy Office of Science. The SDSS-III web site is http://www.sdss3.org/.
SDSS-III is managed by the Astrophysical Research Consortium for the Participating Institutions of the SDSS-III Collaboration including the University of Arizona, the Brazilian Participation Group, Brookhaven National Laboratory, Carnegie Mellon University, University of Florida, the French Participation Group, the German Participation Group, Harvard University, the Instituto de Astrofisica de Canarias, the Michigan State/Notre Dame/JINA Participation Group, Johns Hopkins University, Lawrence Berkeley National Laboratory, Max Planck Institute for Astrophysics, Max Planck Institute for Extraterrestrial Physics, New Mexico State University, New York University, Ohio State University, Pennsylvania State University, University of Portsmouth, Princeton University, the Spanish Participation Group, University of Tokyo, University of Utah, Vanderbilt University, University of Virginia, University of Washington, and Yale University.
Appendix A List and Properties of ‘Probable’ Detections
The reference list from the paper itself. Each links out to its DOI / PubMed record.
- 1Ahn et al. (2012) Ahn C. P., Alexandroff R., Allende Prieto C., Anderson S. F., Anderton T., Andrews B. H., Aubourg É., Bailey S., Balbinot E., Barnes R., et al. 2012, Ap JS, 203, 21
- 2Arav et al. (1999) Arav N., Becker R. H., Laurent-Muehleisen S. A., Gregg M. D., White R. L., Brotherton M. S., de Kool M., 1999, Ap J, 524, 566
- 3Asplund et al. (2009) Asplund M., Grevesse N., Sauval A. J., Scott P., 2009, ARA&A, 47, 481
- 4Baldwin (1977) Baldwin J. A., 1977, Ap J, 214, 679
- 5Baskin et al. (2013) Baskin A., Laor A., Hamann F., 2013, MNRAS, 432, 1525
- 6Bolton et al. (2012) Bolton A. S., Schlegel D. J., Aubourg É., Bailey S., Bhardwaj V., Brownstein J. R., Burles S., Chen Y.-M., Dawson K., Eisenstein D. J., Gunn J. E., Knapp G. R., et al. 2012, AJ, 144, 144
- 7Borguet et al. (2013) Borguet B. C. J., Arav N., Edmonds D., Chamberlain C., Benn C., 2013, Ap J, 762, 49
- 8Borguet et al. (2012) Borguet B. C. J., Edmonds D., Arav N., Benn C., Chamberlain C., 2012, Ap J, 758, 69