Broadband sensitivity enhancement of detuned dual-recycled Michelson interferometers with EPR entanglement
Daniel D. Brown, Haixing Miao, Chris Collins, Conor Mow-Lowry, Daniel, T\"oyra, Andreas Freise

TL;DR
This paper explores how EPR entanglement squeezing can improve the sensitivity of detuned dual-recycled Michelson interferometers, like GEO 600, considering practical imperfections such as losses and asymmetries.
Contribution
It demonstrates the application of EPR entanglement squeezing to enhance interferometer sensitivity, accounting for real-world imperfections.
Findings
EPR entanglement squeezing improves shot-noise-limited sensitivity.
Losses and asymmetries impact the effectiveness of the scheme.
The method is applicable to existing gravitational wave detectors like GEO 600.
Abstract
We demonstrate the applicability of the EPR entanglement squeezing scheme for enhancing the shot-noise-limited sensitivity of a detuned dual-recycled Michelson interferometers. In particular, this scheme is applied to the GEO\,600 interferometer. The effect of losses throughout the interferometer, arm length asymmetries, and imperfect separation of the signal and idler beams are considered.
Click any figure to enlarge with its caption.
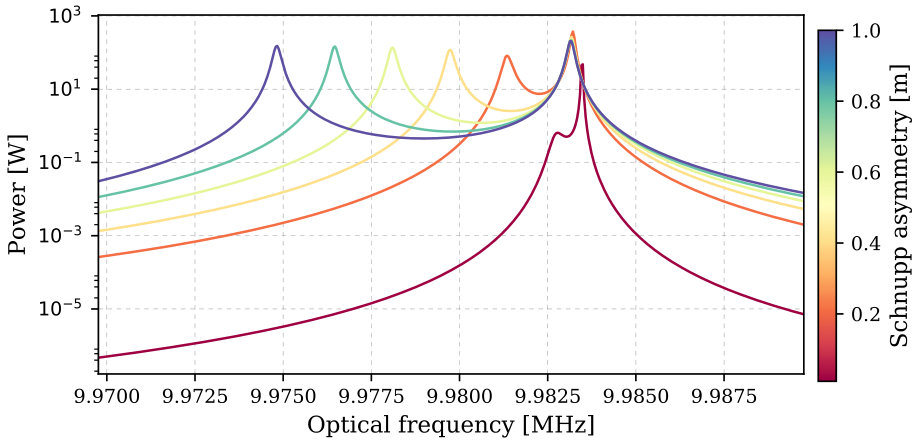 Figure 1
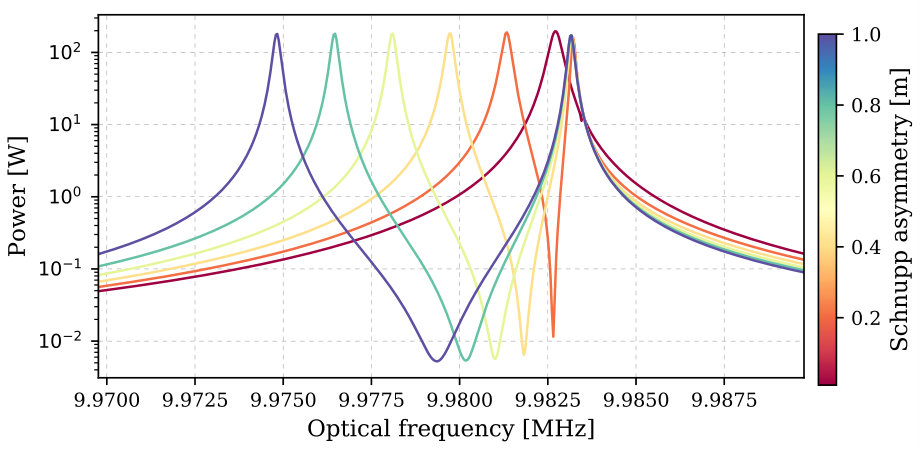 Figure 2
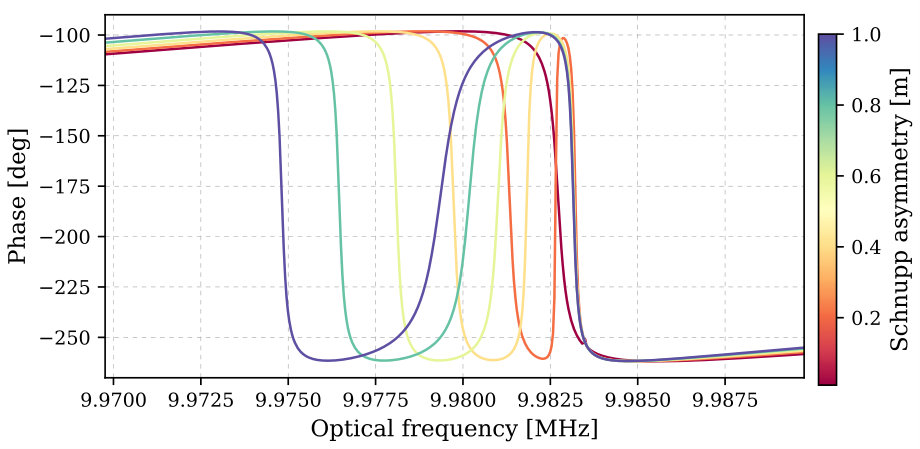 Figure 3
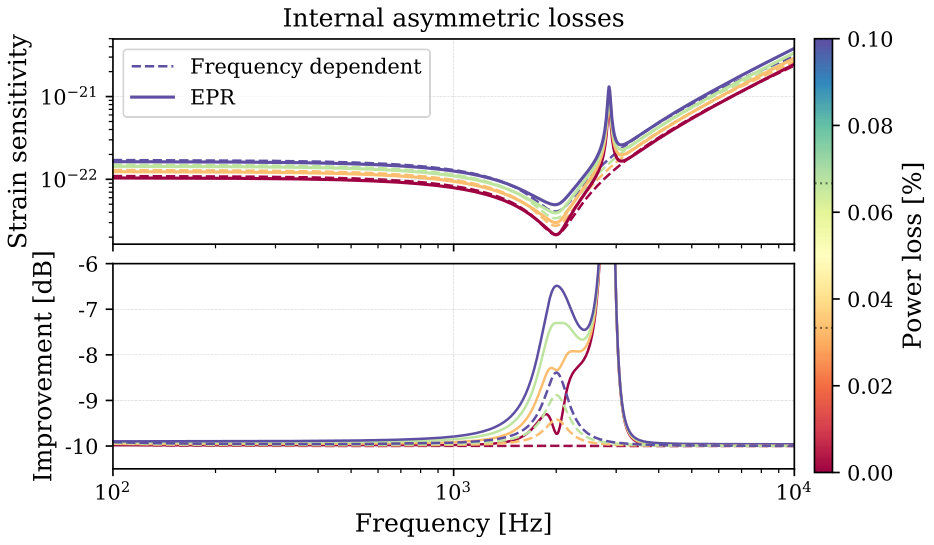 Figure 4
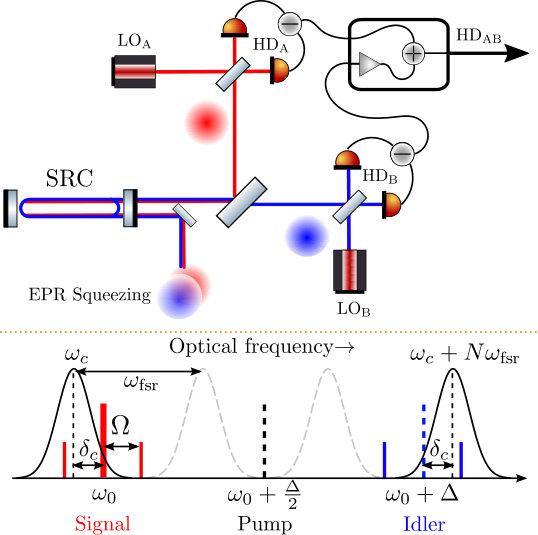 Figure 5
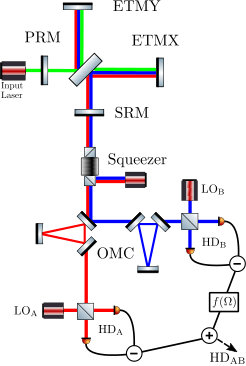 Figure 6
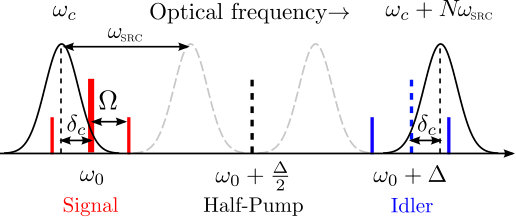 Figure 7
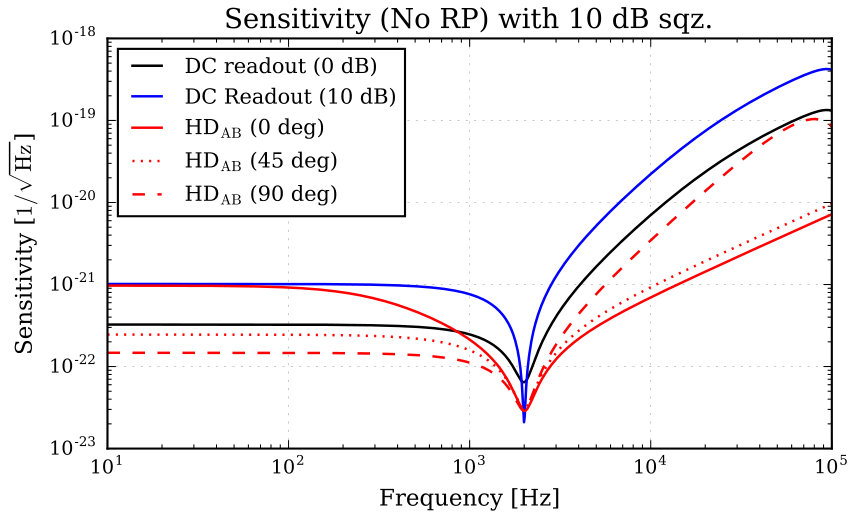 Figure 8
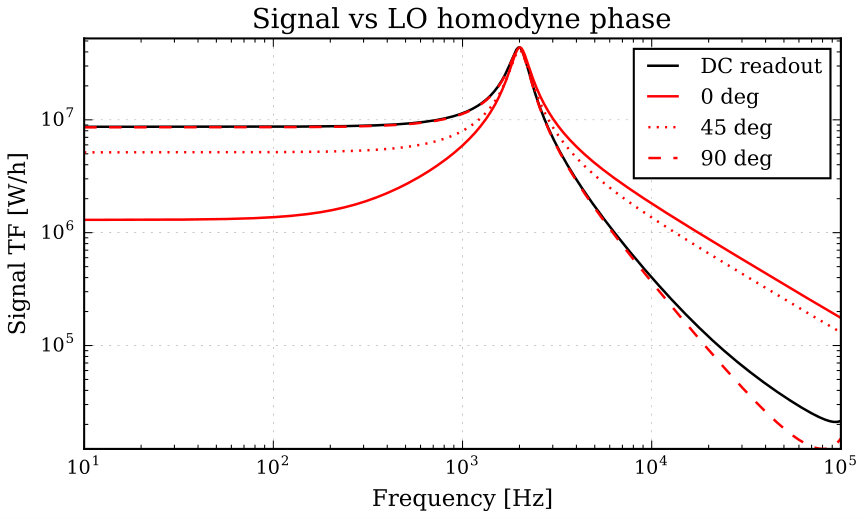 Figure 9
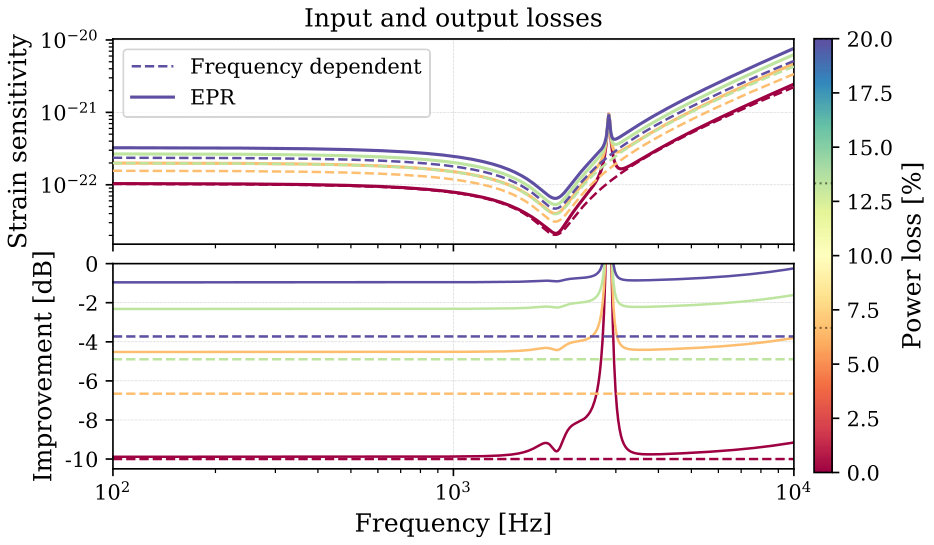 Figure 10
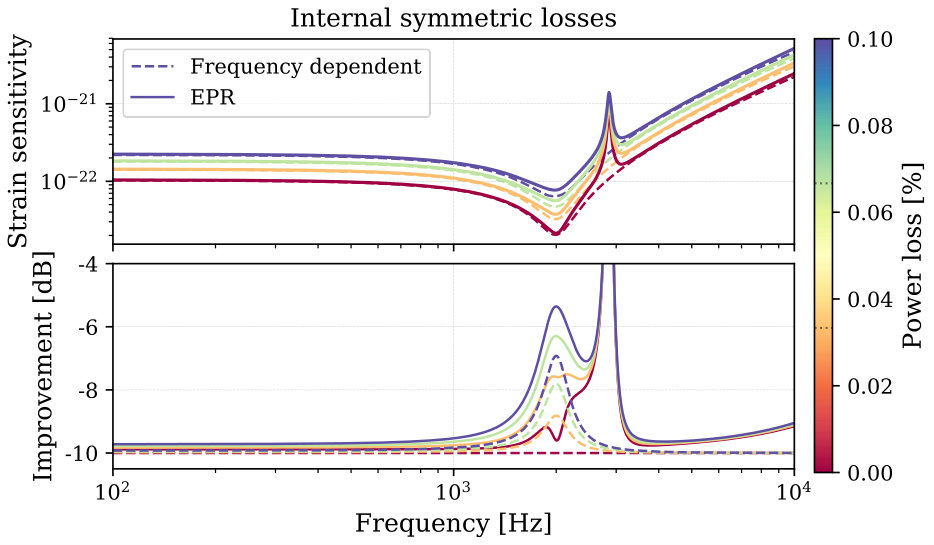 Figure 11
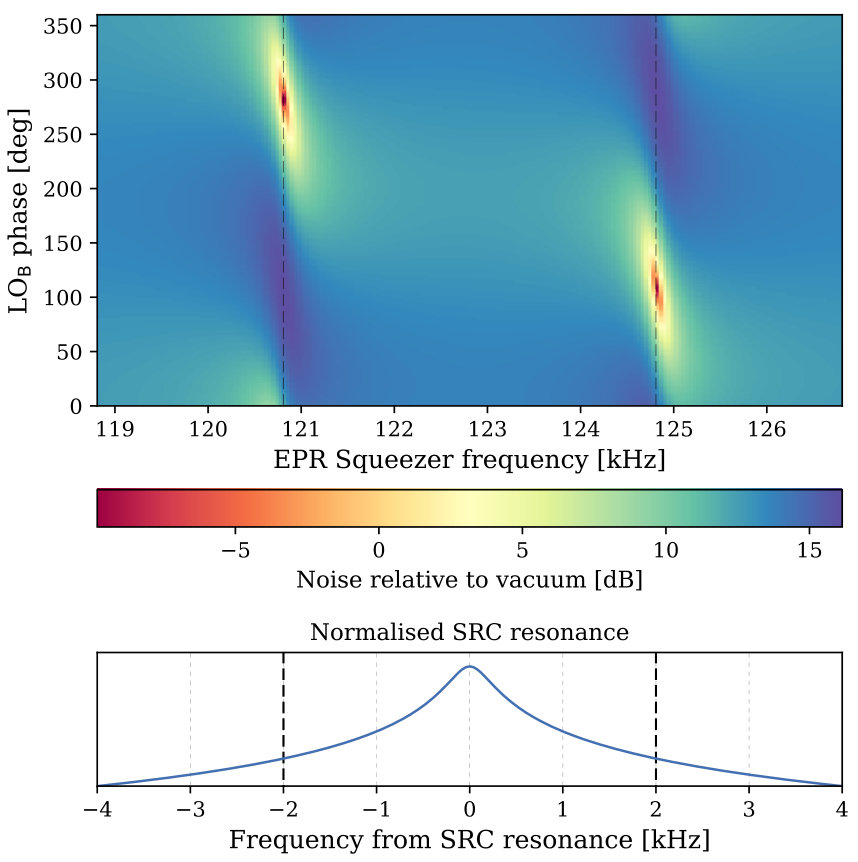 Figure 12
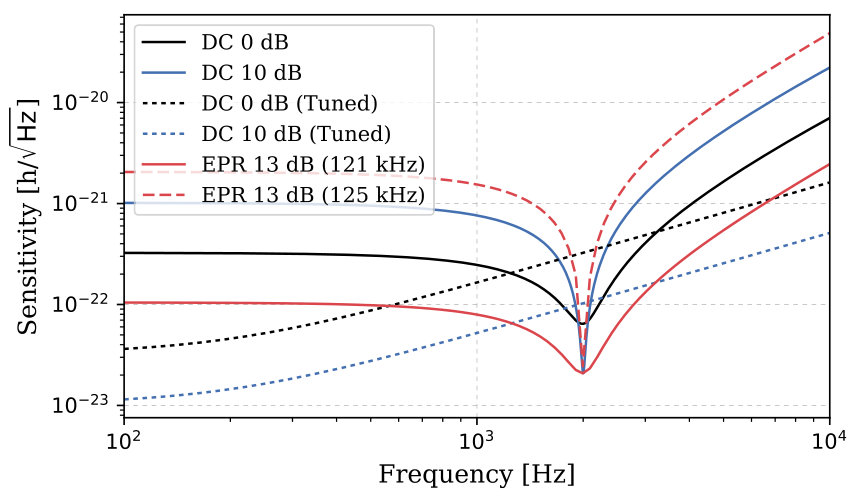 Figure 13
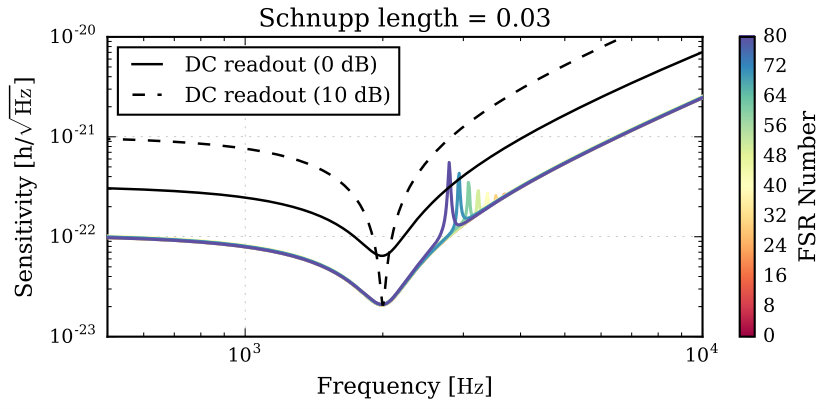 Figure 14
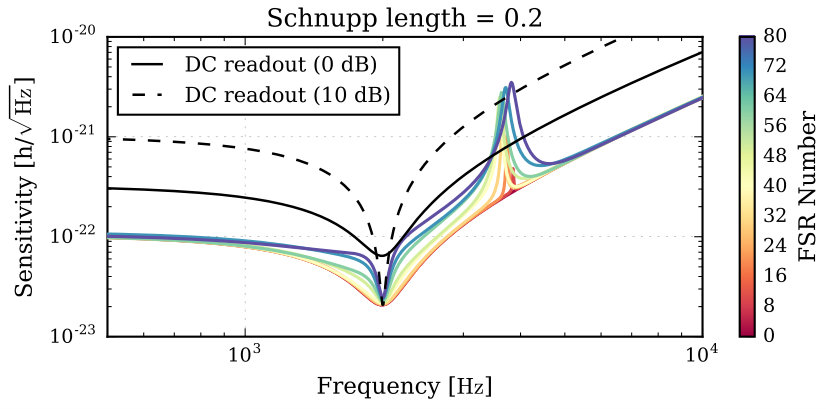 Figure 15
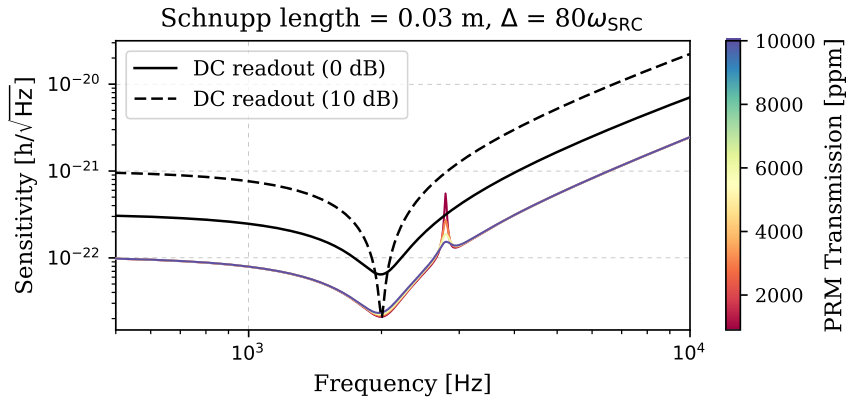 Figure 16
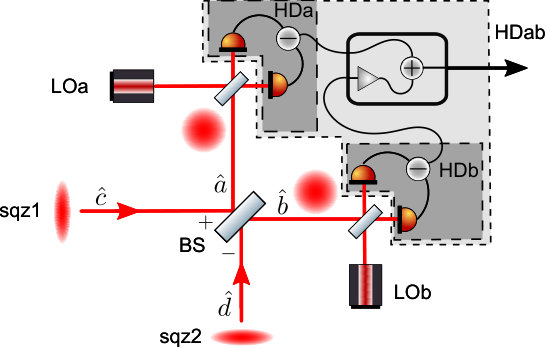 Figure 17
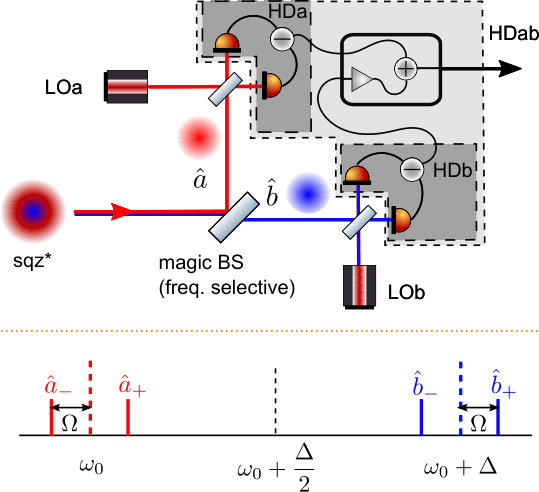 Figure 18
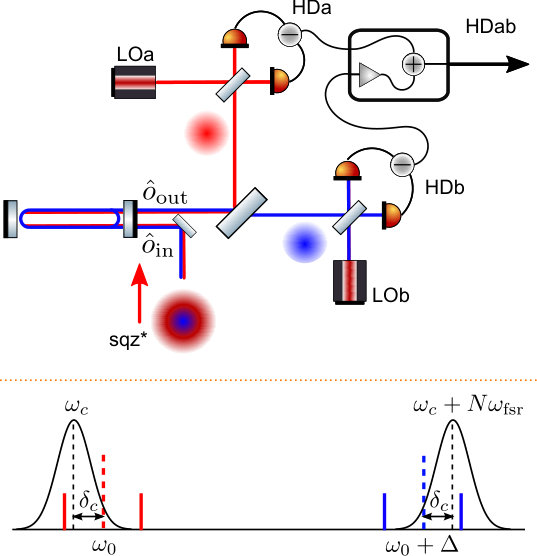 Figure 19
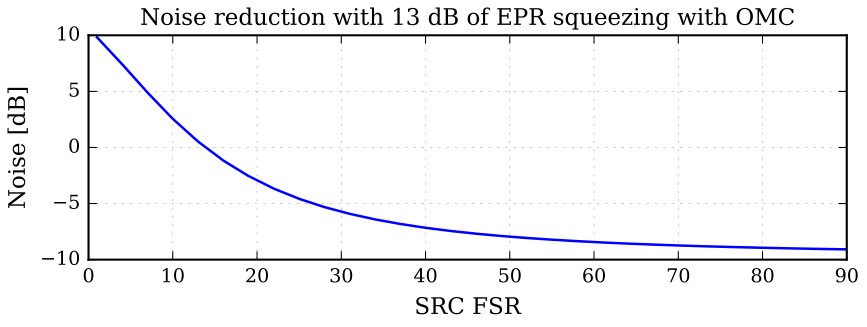 Figure 20
| Parameter | Value |
|---|---|
| Arm length | 1.2 km |
| SR length | 1 m |
| PR length | 1.15 m |
| 900 ppm | |
| 0.02 | |
| 0.5 | |
| 0 | |
| kHz | |
| MHz | |
| Input power | 2 W |
Peer Reviews
No public reviews on file for this paper yet. If you reviewed it on a platform where reviews are public (OpenReview, ICLR, NeurIPS, ICML), you can paste yours below so the community can read it here.
Videos
No videos yet. Explain this paper in a talk, walkthrough, or lecture? Add one.
Broadband sensitivity enhancement of detuned
dual-recycled Michelson interferometers with EPR entanglement
Daniel D. Brown
Haixing Miao
Chris Collins
Conor Mow-Lowry
Daniel Töyrä
Andreas Freise
School of Physics and Astronomy and Institute of Gravitational Wave Astronomy, University of Birmingham, Edgbaston, Birmingham B15 2TT, United Kingdom
Abstract
We demonstrate the applicability of the EPR entanglement squeezing scheme for enhancing the shot-noise-limited sensitivity of a detuned dual-recycled Michelson interferometers. In particular, this scheme is applied to the GEO 600 interferometer. The effect of losses throughout the interferometer, arm length asymmetries, and imperfect separation of the signal and idler beams are considered.
pacs:
I Introduction
Current and future generations of gravitational wave detectors will inject squeezed light to improve the quantum noise limited regions of their sensitivity PhysRevD.23.1693 ; schnabel2010quantum . Envisaged upgrades of gravitational wave detectors with a squeezed light source Oelker16 will require external filter cavities Evans2013 ; Kwee2014 to provide a broadband reduction in the quantum noise. These filter cavities rotate the squeezed state to provide amplitude-squeezing at low frequencies to reduce radiation pressure fluctuations and phase-squeezing at higher frequencies to reduce shot-noise. It has recently been proposed that a broadband reduction of quantum noise in gravitational wave detectors can be achieved using a pair of squeezed EPR-entangled beams to produce frequency-dependent squeezing Ma17 . This method promises to achieve a frequency-dependent optimisation of the injected squeezed light fields without the need for an external filter cavity. Although suitable filter-cavities can be designed, the additional cavity adds further complexity to the interferometer. EPR-squeezing offers an attractive solution to this by harnessing the quantum correlations generated between a pair of EPR entangled beams Reid89 ; PhysRevA.81.062301 ; PhysRevA.67.054302 ; PhysRev.47.777 and effectively utilising the interferometer itself as a filter cavity, thereby achieving a similar response with minimal additional optical components.
The GEO 600 detector in Germany Dooley2015 is currently the only gravitational wave detector to operate for an extended length of time taking science data using squeezed light to enhance its sensitivity SqueezingNature11 ; Affeldt14 . GEO is in a prime position to demonstrate the feasibility of this new technique in the complex setting of a long baseline interferometer. In this paper we take the theory suggested previously for the dual-recycled Fabry-Perot Michelson topology used by LIGO and apply it to GEO, a dual-recycled Michelson without arm cavities. The results in this paper were produced using the numerical interferometer simulation software FINESSE Freise04 ; phd.brown2015 , which allowed for the correct modelling of quantum noise behaviour taking into account the optical losses of the GEO interferometer.
EPR-squeezing was originally proposed to reduce shot-noise and radiation pressure noise at the same time. However, the motivation for its use in GEO would be slightly different: the sensitivity of GEO is not currently limited by radiation-pressure noise, as this is masked at low frequencies by technical noises. However, frequency-dependent squeezing would be required for GEO to use squeezing effectively in a detuned mode, in which the signal recycling cavity (SRC) and thus the peak sensitivity of the detector is tuned to a particular offset frequency. This mode of operation has become of interest again with new results suggesting that key information about neutron stars could be obtained from signal frequencies in the kilohertz region in the ringdown phase after a binary merger Rezzolla2016 . We can show that the EPR squeezing technique could be used to operate the GEO detector in such a condition with an effective use of squeezed light to reduce shot-noise with sufficient bandwidth at the peak sensitivity at frequencies around 2 kHz. We highlight optical design aspects to be considered for the scheme to be implemented and show how losses ultimately limit the achievable sensitivity improvements. The implementation in GEO 600 would not only allow the improvement of its sensitivity, it would also serve as a key technology demonstration for a possible implementation of EPR-squeezing in the LIGO detectors.
The structure of this article is as follows: in section II we outline the layout of the GEO detector and how the EPR-squeezing scheme could be implemented. In section III we model how macroscopic length asymmetries between the arms, the Schnupp asymmetry, must be carefully chosen for the EPR-squeezing scheme to work. Next, in section IV we look at the squeezing degradation that occurs at the output-mode-cleaners due to an imperfect separation of the signal and idler beams. Finally, in section V we see how optical losses throughout the interferometer also affect the sensitivity.
II Squeezing with EPR-entanglement in GEO
To describe the EPR-squeezing scheme we shall first consider the simplified layout shown in figure 1 along with the frequency spectrum depicted in figure 2. The pair of EPR entangled beams are generated by an optical parametric amplifier (OPA). The OPA is pumped at a frequency of , generating pairs of entangled sidebands around the signal (red) frequency , and the idler (blue) frequency . An incident gravitational wave will generate a pair of sidebands around the signal carrier at frequency . No carrier or signal is present around the idler frequency . Unlike the typical squeezing injection which entangles light at the frequencies , EPR-entanglement correlates fields at with fields at and with . This implies the quadratures around are correlated with those around , and thus we can reduce the noise at the signal frequency by making a measurement on the idler—the principal idea behind conditional squeezing.
The signal and idler beams are injected via a Faraday isolator into the output path of the interferometer and enter the interferometer through the signal recycling mirror (SRM). The resonance condition of the dual-recycled interferometer is set so that the main carrier light (green in figure 1) destructively interferes going towards the SRM and constructively back towards the power recycling mirror (PRM)—this is known as operating at the dark fringe. In this configuration light entering through the SRM is fully reflected back into this port by the interferometer. The SRM and the end test masses, ETMX and ETMY, form the two cavities SRX and SRY. The combination of both of these is referred to as the signal recycling cavity (SRC)—a similar argument is made for the PRM, forming PRX, PRY, and the PRC. Table 1 provides a list of parameter values used in this work for our GEO600 model.
The optical frequency difference between the idler and signal beams, , must be set such that it is close to an integer number of SRC free spectral ranges (FSR). In particular, with a SRC detuned by a frequency , the signal and idler frequency difference should be
[TABLE]
(See appendix D) for an interferometer free of any defects. In this work we study the effect of EPR-squeezing for an exemplary SRC detuning of 2 kHz including optical losses and asymmetries in the interferometer. The exact value of the frequency is not important for the arguments made here. It was chosen because in principle it allows the improvement of quantum noise unimpeded by other technical noises, and is possibly of interest in the analysis of signals from neutron star mergers.
The detection scheme requires that the signal and idler frequency components are spatially separated and measured individually via balanced homodyne detection. In practice this separation is achieved using a small cavity such as an output mode cleaner (OMC). This cavity must be impedance matched for transmission for one of the signal or idler beams and near anti-resonance for maximal reflection of the other. The signals from both homodyne detections are then optimally combined to produce the final output. For this particular GEO 600 configuration, with negligible radiation pressure effects, the optimal gain for the signal recombination is frequency independent and depends only on the amount of squeezing present at the output (see appendix):
[TABLE]
where is the squeezing factor. To summarise, four parameters need to be carefully tuned for an optimal readout: the separation frequency , both local oscillator (LO) phases of the homodyne readouts, and the gain factor for the signal recombination. For the interested reader a more mathematical description can be found in both the appendices of this paper and in the supplemental materials of reference (Ma17, ).
In order to tune the local oscillator phases we start with the homodyne detector measuring the signal beam, in figure 1 this is detector . The LO phase must be chosen to optimise the detector’s susceptibility to a gravitational wave signal with amplitude , the transfer function of such a signal to the output is shown in figure 3. The homodyne angle offers a trade-off between high and low frequency susceptibility. In this work we use the 90 degrees option as it provides the best broadband response and is similar to the DC readout scheme for comparing the EPR scheme against. The numerical value of this angle is of no importance for the EPR aspect of this scheme.
With the required signal homodyne phase being fixed, both and the homodyne phase must then be optimised. The optimal conditions for these parameters are those that provide the broadest sensitivity around the detuning frequency. This can be achieved by creating a cost function describing the squeezing improvement over the desired frequency range to use with an optimisation routine. However, a simpler approach was taken here: it is possible to compute the output at just the chosen detuning frequency and maximise the relative noise improvement compared to no squeezing injected. In this case we find two optimal points around each of the SRCs FSRs ( kHz). An example of this optimisation is shown in figure 4 for a detuning of 2 kHz. Here 13 dB of EPR squeezing is injected and dB of squeezing is seen (see appendix B on why a 3 dB loss is always present when using EPR squeezing). At 2 kHz above and below the SRC resonance we observe two optimal squeezing conditions. The lower optimal squeezer frequency provides the broadband squeezing required, as specified by equation 1, the higher value being the opposite and producing significant anti-squeezing away from the peak sensitivity. This is analogous to choosing the correct or incorrect squeezing angle using standard squeezing injection with DC readout. Also shown here for reference is the similarly achievable sensitivity when using an equivalent traditional squeezing input of 10 dB with the already used DC readout technique which cannot provide an optimal broadband sensitivity and is only equivalent to a correctly tuned EPR-squeezing scheme at the detuning frequency.
Using a lossless and symmetric GEO model and the optimal parameters found in figure 4, the EPR squeezing for both optimal parameter choices are compared to DC readout in figure 5. Here we see how an ideal frequency-dependent squeezing scheme can widen the sensitivity around the detuning frequency, below what would normally be achievable in the tuned interferometer case with frequency-independent squeezing. In the following sections we will consider how particular defects affect the performance of the EPR scheme.
III Schnupp asymmetry
Radio frequency (RF) optical modulation is employed in gravitational wave detectors for sensing and control of the position and alignment of optical components. This requires careful design of cavity lengths to ensure that particular frequencies resonate within them. In addition there is a macroscopic differential length difference between the two interferometer arms, known as the Schnupp asymmetry. This is required so that while the main carrier light is still near a dark fringe, some RF sidebands will couple into the output port and thus sense the SRM for control purposes. These RF modulation frequencies are typically of the order of several MHz, thus at similar frequencies to that which will be required for the EPR squeezing.
To implement the EPR squeezing scheme the Schnupp asymmetry should be chosen to satisfy design requirements for sensing schemes as well as ensure the higher frequency EPR fields are correctly detuned from an appropriate SRC resonance. To achieve this, the squeezer frequency should be set as an integer number, , of the Schnupp asymmetry FSR, thus both SRX and SRY are on resonance: , where is Schnupp length difference. For technical reasons it is desirable to keep as low as possible, in the range of 10s of MHz, and at a frequency that is well reflected by an OMC. The first value, , for a frequency MHz we would require m—which begins to be unpractically large.
The second option is to use as small a Schnupp asymmetry as possible instead. Shown in figure 6 is how using a Schnupp asymmetry of 3 cm and 20 cm in a simplified GEO model affects the squeezing. The typical feature that appears is an additional resonance peak due to the now different resonant conditions for SRX and SRY and the coupling this generates with the PRC. Appendix A highlights the behaviour of these additional peaks in more detail. Figure 6(c) demonstrates how the PRM transmission affects this additional resonance. By lowering the finesse of the PRC we can reduce this feature. However, to achieve similar sensitivities the input power would need to be increased due to the lower PRC recycling gain.
How the sensitivity is affected by the choice of SRC FSR is also shown in figures 6(a) and 6(b) up to the 80th FSR—this being equivalent to MHz. From these figures it is evident that large Schnupp asymmetries quickly degrade the broadband sensitivity as higher SRC FSRs are used. Thus a design requirement for using EPR-squeezing is to use the smallest Schnupp asymmetry possible. Currently the asymmetry is set to cm in GEO which should still allow the benefits of the EPR scheme to be experimentally demonstrated.
IV Separation of signal and idler
So far we have assumed a perfect separation of signal and idler in the detection process. Our models used an OMC with a very narrow linewidth to achieve this. The currently installed OMC at GEO 600 has a linewidth of MHz, or , thus the choice of must be larger than this.
Figure 7 shows the performance of EPR squeezing if we replace the perfect OMC with a realistic model of the OMC. The plot show the best reduction in noise as a function of in units of . With the OMC FSR being 435 MHz, the signal and idler will be ideally separated at MHz . This large separation is not practical and would require effectively no Schnupp asymmetry. However, reasonable noise reduction is possible up to , showing a reduction in efficiency of about 1 dB compared with an ideal separation of signal and idler.
V Susceptibility to optical losses
Optical losses within an interferometer will degrade any injected squeezed state by introducing uncorrelated pure vacuum noise. For current and future squeezing implementations losses will need to be carefully controlled—for EPR-squeezing the loss requirements are more strict. Although in practice losses will occur at each individual optical component, we can classify the losses into three categories: a combined input and output loss, and internal interferometer symmetric and asymmetric losses. To depict how these losses affect the sensitivity, a 2 kHz detuned GEO model was constructed using a Schnupp asymmetry of 5 cm, SRC FSRs, a perfectly separating narrow-band OMC, and 13 dB of EPR squeezing. We now compare how three types of loss affects both EPR-squeezing and an ideal frequency-dependent squeezing source.
The combined input and output losses refer to any loss on the squeezing input path and those on the output path after the SRM up to the photodiodes. Figure 8 shows how this loss alters the sensitivity of a detector using an ideal frequency-dependent squeezed source (dashed) and with EPR-squeezing (solid). Note that a 1% loss here means 1% on input plus another 1% on output. As expected from Ma‘s work Ma17 , EPR-squeezing is approximately twice as sensitive to optical losses compared to conventional frequency-dependent squeezing. Without losses a 10 dB improvement is seen with some degradation around the detuning frequency dip and the additional resonance from the Schnupp asymmetry. A 10% input and output loss results in a reduction to around 3 dB of broadband squeezing. It can also be seen that EPR-squeezing degrades faster for a given loss value compared to a perfect frequency-dependent source.
The internal loss in the interferometer such as clipping from finite optics, surface scattering, or absorption can be broken down into either symmetric or asymmetric losses between the two arms. Figure 9 depicts the sensitivity change due to a range of symmetric losses. At the detuning frequency we see the squeezing efficiency is affected by losses to a much greater degree due to the resonance of the signal-recycling cavity multiplying the effect of the loss. Similarly, the asymmetric losses, as shown in figure 10, also affect the sensitivity predominantly around the detuning frequency.
It is instructive to compare our result to current estimates of loss values at GEO600. Internal loss values (symmetric and asymmetric) are estimated to be . As we have shown, a loss at this level would result in a substantial reduction in the achievable squeezing around the detuning frequency. The input/output loss is expected to be in total, which is equivalent to a value around 15% in figure 8. Assuming such losses, 13 dB of EPR-squeezing could still provide a measurable noise reduction and thus be used for a proof-of-principle demonstration of this technique in a large-scale laser interferometer. However, for operating this scheme in future generations of gravitational wave detectors losses would need to be reduced significantly.
VI Conclusion
We have shown that GEO600 could use the EPR squeezing scheme to improve the shot-noise limited sensitivity with a detuning to 2 kHz without reducing the detector bandwidth. We have considered the frequency separation of the signal and idler beams to be in the MHz range for practical reasons. This in turn leads to the requirement that the Schnupp asymmetry must be kept as small as possible to suppress additional optical resonances and to provide the best broadband noise reduction. A Schnupp asymmetry of cm would be sufficient according to our results. The best value for the Schnupp asymmetry should be based on a trade-off between this effect and the transmission of the optical RF sidebands required for controlling the interferometer.
We have shown how the separation of signal and idler by a realistic OMC slightly reduces the efficiency of the scheme: the reduction of effective squeezing at around MHz using the cavity parameters for the current GEO OMC (excluding its losses) has been shown to be around 1 dB.
Optical losses are limiting the effectiveness of all quantum noise reduction techniques. We have demonstrated how the sensitivity of GEO 600 with EPR squeezing is affected by losses in the input and output path, and by losses inside the interferometer. These results can be used to derive requirements for potential upgrades for reducing current optical losses to a level that render the implementation of EPR squeezing feasible.
Overall we found no theoretical design aspects that would significantly hinder the application of EPR-squeezing in GEO. The current loss estimates within GEO600 suggest that EPR-squeezing would offer minimal benefits to the overall sensitivity of the detector without an addition reduction of the optical losses. However, GEO600 could provide an important experimental verification in an active detector of this technique which is considered an interesting alternative to conventional approach of using filter-cavities for detector upgrades and in future detector designs.
The authors would like to thank Yanbei Chen and James Lough for the idea to apply the EPR scheme in GEO 600, and Harald Lück, Hartmut Grote and the GEO 600 team for their support and useful discussions, in particular James Lough and Harald Lück for providing estimates of the optical losses in GEO 600. This work was supported by the Science and Technology Facilities Council Consolidated Grant (number ST/N000633/1) and H. Miao is supported by UK Science and Technology Facilities Council Ernest Rutherford Fellowship (Grant number ST/M005844/11). D. Töyrä is supported by funding from the People Programme (Marie Curie Actions) of the European Union’s Seventh Framework Programme FP7/2007-2013/ (PEOPLE-2013-ITN) under REA grant agreement number 606176.
Appendix A Peak behaviour: PRC-SRC Schnupp coupling
By introducing a coupling between the PRC and SRC, additional peaks appear in the sensitivity spectrum, as shown in figure 6. There are two regimes to consider: the weak (fig. 6(a)) and strong (fig. 6(b)) coupled cases. When a coupled cavity becomes strongly coupled an additional resonance is present. We can see this in figure 11. This shows the power build up in the PRC-SRC coupled cavity due to a 1 W optical field injected at the dark port for a range of asymmetries. This is injected at a frequency to model how the idler fields respond to a coupled system. For the signal fields this coupling is negligibly small and only a single resonance is seen.
With the idler sidebands seeing a different optical response from the signal sidebands the optimal sensitivity achievable is degraded as seen in the previous sections. In figure 11 we see for small Schnupp asymmetries the PRC power is lower and the SRC is a single peak. As the asymmetries are increased the PRC power is of the order or greater than that in the SRC and the two become strongly coupled. From here an additional resonance is visible which further separate in frequency space as the coupling strength increases.
In figure 6 we see the new resonance beginning to appear around 4 kHz. This is determined by the choice of . The idler is is offset from the SRC resonance by and the PRC resonance is . Thus at the idler’s upper sideband resonates in the PRC when coupling between the SRC and PRC is present.
In figure 6 this new resonance drifts shifts in frequency depending on the asymmetry and chosen . The broadband squeezing is achieved by correctly rotating the squeezed state, which is determined by the relative phase between the upper and lower signal and idler sidebands accumulated on reflection from a cavity (see 30). When determining the idler’s carrier frequency value by optimising , the lower frequency SRC peak is found to provide the best broadband noise reduction. Using the lower peak means that the upper idler sideband then interacts with the resonance conditions that appear. Figure 11(c) depicts the phase of an optical field reflected from the SRC over the frequency range of the idler sidebands. We can see there is a fast change in phase of the sideband around the SRC resonance. The new resonance, from the strongly coupled cavities, introduces a second phase jump resulting in an incorrect rotation of the squeezed state at particular frequencies. This being the reason for the additional peaks in figure 6.
Appendix B Entanglement at a beam splitter
As shown in figure 12, we denote the incoming entangled fields from the west port of the beamsplitter as and the south port as , and the outgoing field to the north port as and east port as . They satisfy the following input-output relation:
[TABLE]
In terms of the amplitude quadrature and phase quadrature , the above input-output relation can be rewritten as
[TABLE]
The covariance matrix of the ingoing field is defined as
[TABLE]
with being the quantum state of the optical field. Assuming that is amplitude squeezed and is phase squeezed (illustrated by the noise ellipse in figure 12) we have
[TABLE]
in which is the squeezing factor. The resulting covariance matrix for the outgoing field, using the input-output relation Eq. (4), is then
[TABLE]
We can see from this that the amplitude quadrature and phase quadrature for either the outgoing field or are not correlated, which is illustrated schematically by using noise circle in figure 12. However, and are mutually correlated, or equivalently forming a quantum entanglement, manifested by the nonzero off-diagonal terms in the covariance matrix . It is such a correlation that allows us to reduce the uncertainty (variance) of by making a measurement on , or vice versa. This is the main principle behind the conditional squeezing.
Suppose measures
[TABLE]
and measures
[TABLE]
We construct the following estimator for using the measurement outcome of :
[TABLE]
in which is some coefficient (filter function). The conditional variance of is defined as
[TABLE]
The optimal value for (Wiener filter) is given by
[TABLE]
Given the covariance matrix shown in Eq. (7) for the outgoing field, we have
[TABLE]
and
[TABLE]
Therefore, to get the minimum conditional variance for , we need to measure the proper such that
[TABLE]
which yields
[TABLE]
and
[TABLE]
in which the sign depends on the choice of in Eq. (15). This is the optimal gain factor to use when combining the signal and idler beams. Note, that this is a frequency independent factor, which is not the case when radiation pressure effects are dominant. In particular, given 10dB input squeezing for both and , the observed conditional squeezing is approximately equal to 7dB, i.e.,
[TABLE]
or that the EPR squeezing scheme results in an automatic 3 dB loss in squeezing.
Appendix C Entanglement in the squeezer
Here we analyse the case of entanglement (correlation) generated from a squeezer with a squeezing spectrum over a wide frequency range (usually up to 100MHz). The various relevant frequency for the fields are illustrated in figure 13. In particular, is half of the pump frequency of the squeezer. For the usual squeezing injection in gravitational-wave detector, this frequency normally coincides with the main carrier frequency. However, in the EPR squeezing scheme, it is intentionally offset from the carrier at by with of the order of MHz. As a result, the sidebands around and those around are correlated. Specifically, the optical field is correlated with , and is correlated with . To distinguish between the sidebands around and those around , we introduce
[TABLE]
Given frequency-independent squeezing source with squeezing factor and angle ( corresponds to phase squeezing), their correlations can be described by using spectral density, and we have
[TABLE]
where the single-sided spectral density is defined through
[TABLE]
With Eqs. (20), (21), and (22), we can derive the covariance matrix for , in terms of spectral density, as
[TABLE]
In the special case when (amplitude squeezing injection), the above covariance matrix becomes identical to Eq. (7), i.e.,
[TABLE]
Even though the generation of entanglement is different from the previous example shown in figure 12, the resulting structure of entanglement is almost the same, when looking at each frequency. Therefore, the reduction of uncertainty in , i.e., the conditional squeezing, by the measurement of follows the same logic as we previously discussed.
Appendix D Entangled squeezing and frequency independent recombination
with a simple detuned cavity
We now look at the effect of the optical cavity on the squeezing field, as shown schematically in figure 14. This optical cavity in theory represents the SRC of GEO600. In the sideband picture, the input-output relation is given by
[TABLE]
where is the cavity resonant frequency, and is the cavity bandwidth.
Take the sideband fields for example:
[TABLE]
where we have introduced cavity detuning and sideband phase :
[TABLE]
In the quadrature picture, the above input-output relation can be rewritten as
[TABLE]
Similar relation can also be established between and . As we can see, the quadrature is rotated by a frequency-dependent angle equal to
[TABLE]
When the cavity detuning changes sign, the rotation angle also changes sign correspondingly, namely,
[TABLE]
Therefore if we arrange the frequency in a way as illustrated in figure 14— is blue detuned with respect to while is red detuned with respect to with being the free spectral range of the cavity, will be rotated opposite to . From Eq. (15), this will ensure that the conditional squeezing achieves the minimum level at all frequencies, as seen in the main results of the paper.
The reference list from the paper itself. Each links out to its DOI / PubMed record.
- 1[1] Carlton M. Caves. Quantum-mechanical noise in an interferometer. Phys. Rev. D , 23:1693–1708, Apr 1981.
- 2[2] Roman Schnabel, Nergis Mavalvala, David E Mc Clelland, and Ping K Lam. Quantum metrology for gravitational wave astronomy. Nature communications , 1:121, 2010.
- 3[3] Eric Oelker, Tomoki Isogai, John Miller, Maggie Tse, Lisa Barsotti, Nergis Mavalvala, and Matthew Evans. Audio-band frequency-dependent squeezing for gravitational-wave detectors. Phys. Rev. Lett. , 116:041102, Jan 2016.
- 4[4] M. Evans, L. Barsotti, P. Kwee, J. Harms, and H. Miao. Realistic filter cavities for advanced gravitational wave detectors. Phys. Rev. D , 88:022002, Jul 2013.
- 5[5] P. Kwee, J. Miller, T. Isogai, L. Barsotti, and M. Evans. Decoherence and degradation of squeezed states in quantum filter cavities. Phys. Rev. D , 90(6):062006–, September 2014.
- 6[6] Yiqiu Ma, Haixing Miao, Belinda Heyun Pang, Matthew Evans, Chunnong Zhao, Jan Harms, Roman Schnabel, and Yanbei Chen. Proposal for gravitational-wave detection beyond the standard quantum limit through epr entanglement. Nat Phys , advance online publication:–, 05 2017.
- 7[7] M. D. Reid. Demonstration of the einstein-podolsky-rosen paradox using nondegenerate parametric amplification. Phys. Rev. A , 40:913–923, Jul 1989.
- 8[8] Boris Hage, Aiko Samblowski, and Roman Schnabel. Towards einstein-podolsky-rosen quantum channel multiplexing. Phys. Rev. A , 81:062301, Jun 2010.