Weather on Other Worlds. IV. H$\alpha$ emission and photometric variability are not correlated in L0$-$T8 dwarfs
P. A. Miles-P\'aez, S. A. Metchev, A. Heinze, D. Apai

TL;DR
This study investigates the relationship between magnetic activity and photometric variability in ultra-cool dwarfs, finding no correlation and suggesting dust clouds drive variability rather than magnetic phenomena.
Contribution
It provides the first extensive analysis showing that Hα emission and photometric variability are uncorrelated in L and T dwarfs, emphasizing dust clouds as the primary cause of variability.
Findings
Hα emission is common in early L dwarfs but rare in later types.
Photometric variability occurs across all L and T spectral types with no clear correlation to Hα emission.
Dust clouds are likely the main cause of variability, not magnetic activity.
Abstract
Recent photometric studies have revealed that surface spots that produce flux variations are present on virtually all L and T dwarfs. Their likely magnetic or dusty nature has been a much-debated problem, the resolution to which has been hindered by paucity of diagnostic multi-wavelength observations. To test for a correlation between magnetic activity and photometric variability, we searched for H emission among eight L3T2 ultra-cool dwarfs with extensive previous photometric monitoring, some of which are known to be variable at 3.6 m or 4.5 m. We detected H only in the non-variable T2 dwarf 2MASS J125453930122474. The remaining seven objects do not show H emission, even though six of them are known to vary photometrically. Combining our results with those for 86 other L and T dwarfs from the literature show that the detection rate of H…
Click any figure to enlarge with its caption.
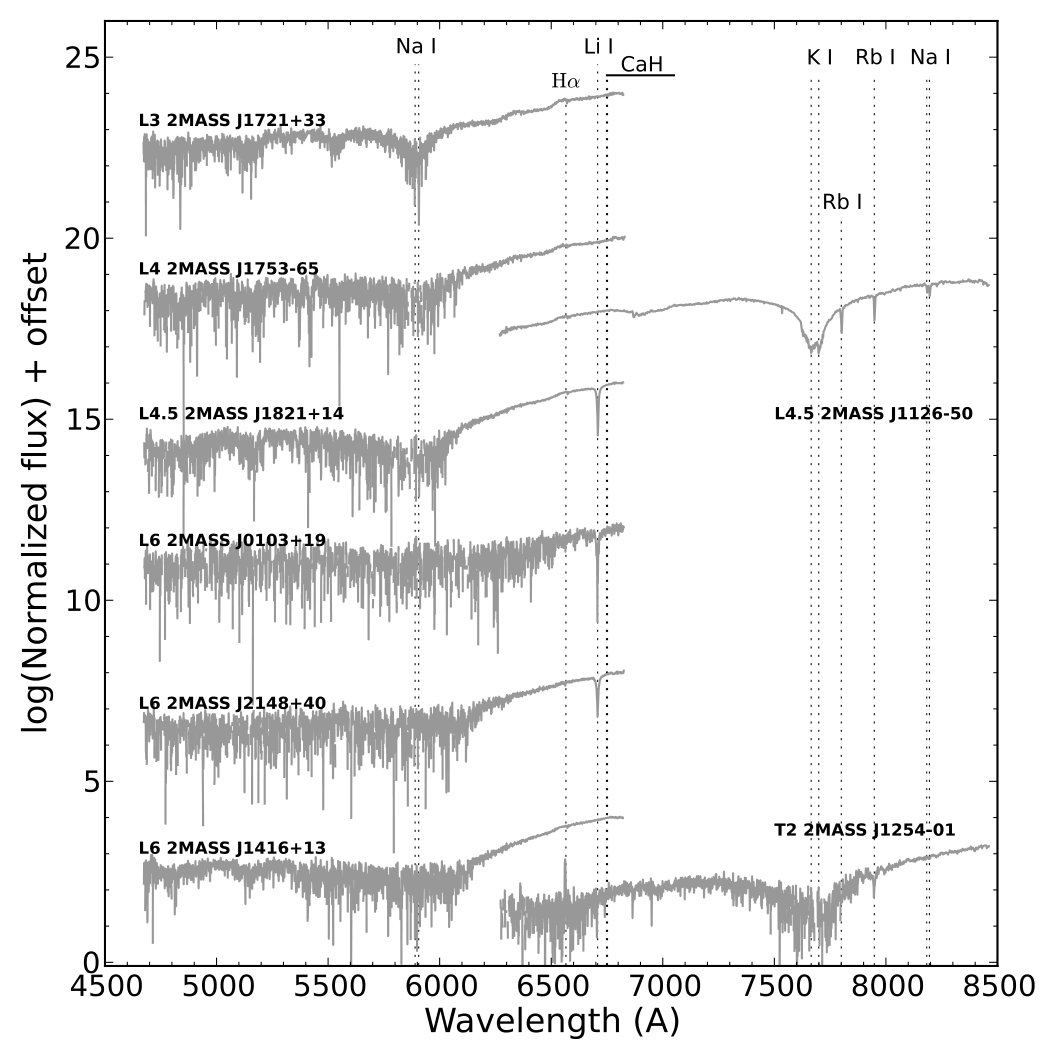 Figure 1
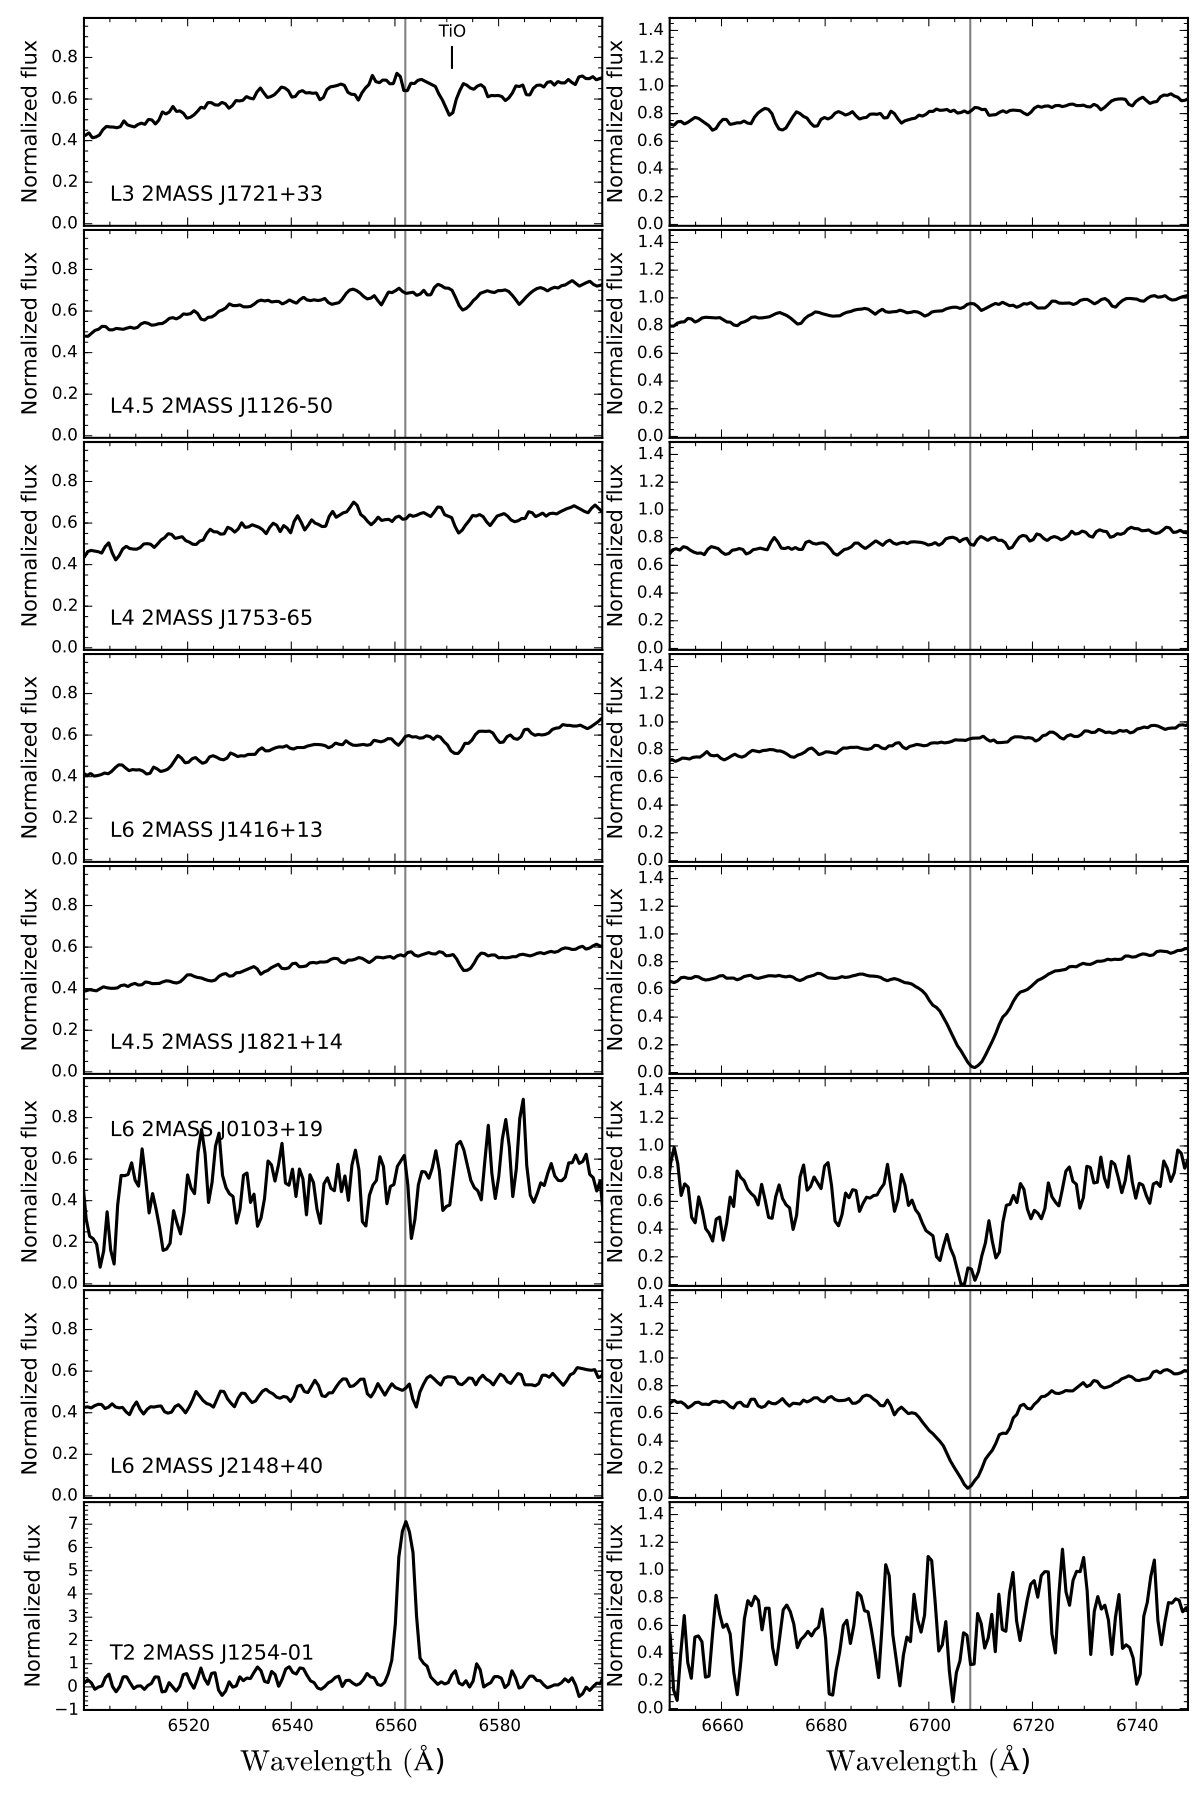 Figure 2
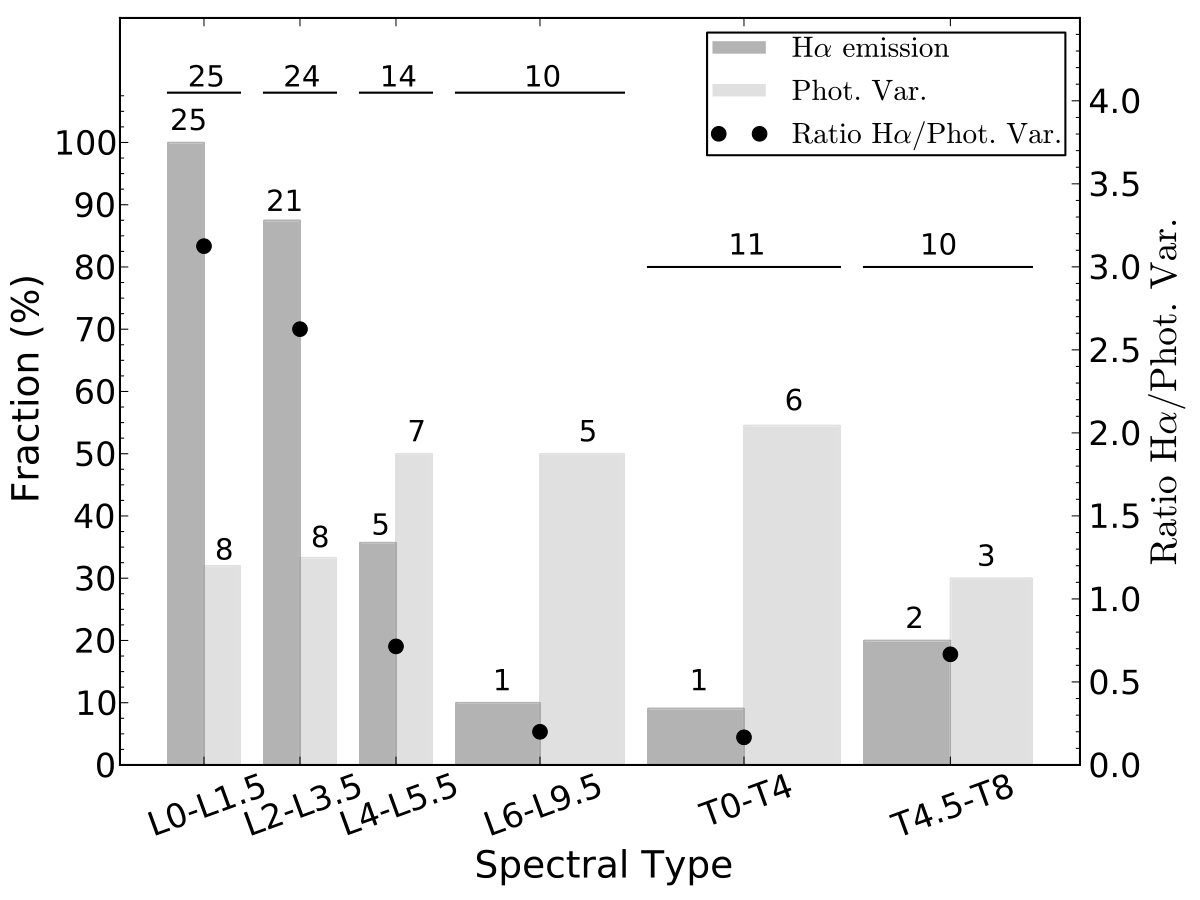 Figure 3
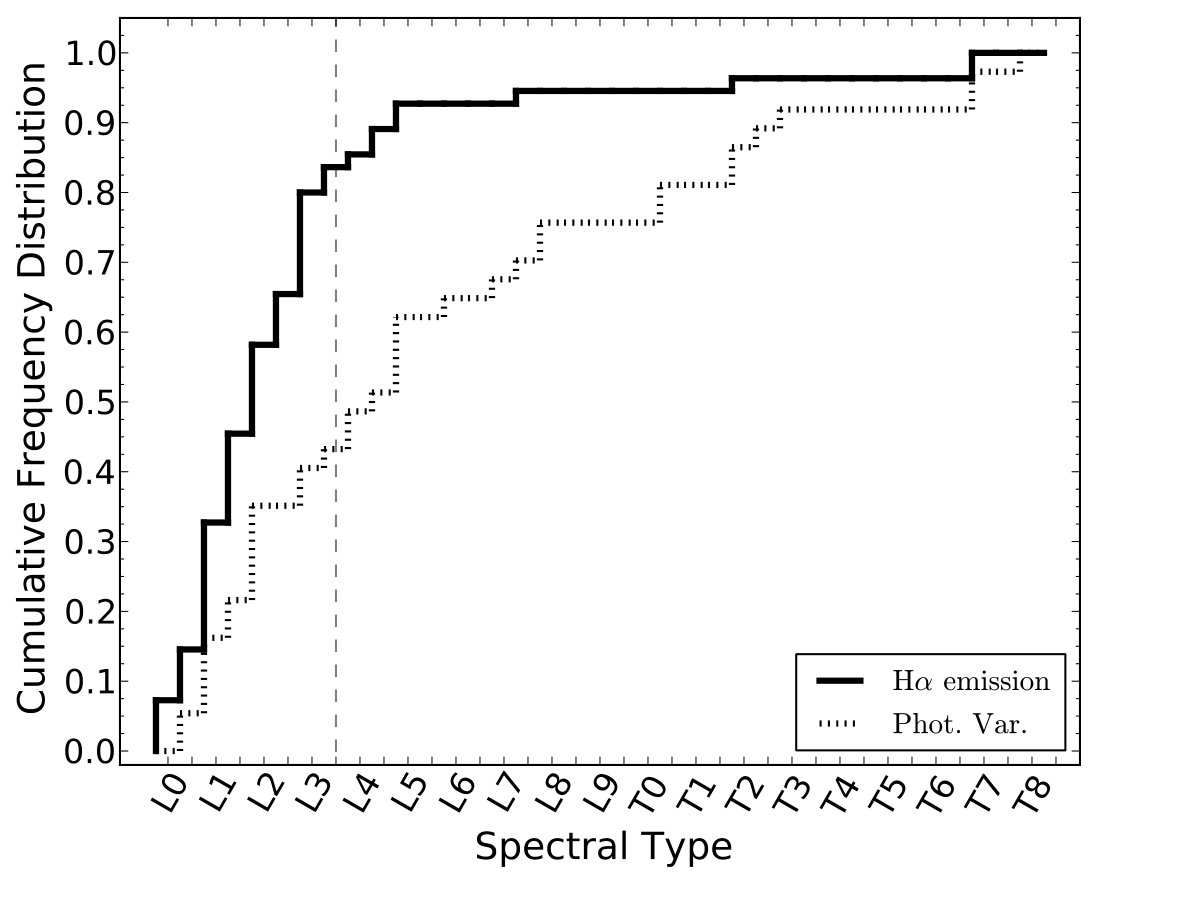 Figure 4
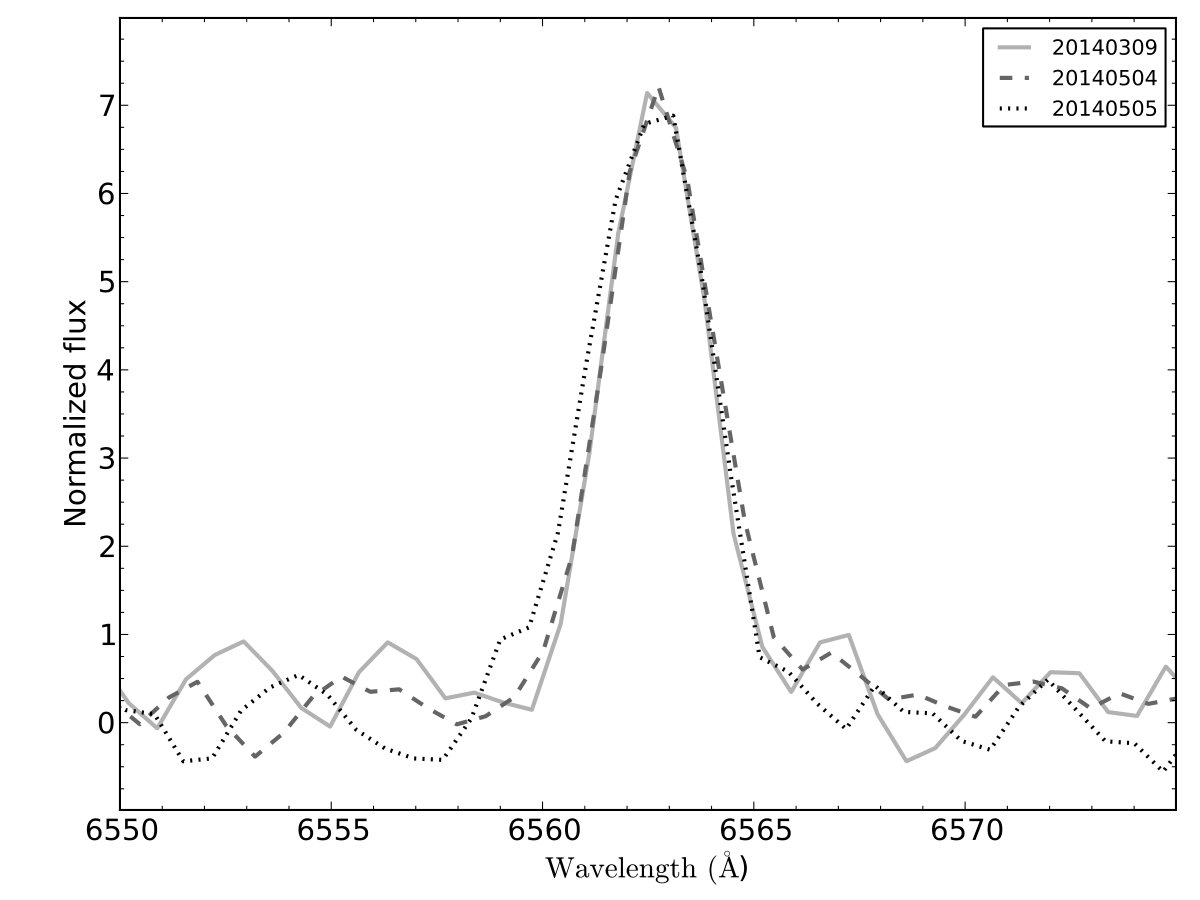 Figure 5
| Object | SpTaafootnotemark: | Var. periodaafootnotemark: (h) | (mag) | UT Date | Inst. | Config. | texpbbfootnotemark: (s) | Air Mass |
|---|---|---|---|---|---|---|---|---|
| 2MASS J010332031935361 | L6 | 2013 Sep 02 | GMOS-N | Blue | 6900 | 1.061.00 | ||
| 2013 Sep 29 | GMOS-N | Blue | 10900 | 1.001.11 | ||||
| 2MASS J112639915003550 | L4.5 | 2014 Mar 05 | GMOS-S | Red | 8900 | 1.121.08 | ||
| 2014 Mar 07 | GMOS-S | Red | 8900 | 1.071.25 | ||||
| 2MASS J125453930122474 | T2 | 2014 Mar 09 | GMOS-S | Red | 6925 | 1.141.19 | ||
| 2014 May 04 | GMOS-S | Red | 8925 | 1.301.14 | ||||
| 2014 May 05 | GMOS-S | Red | 8925 | 1.241.14 | ||||
| 2MASS J141624081348263 | L6 | 2014 Apr 23 | GMOS-N | Blue | 8780 | 1.071.40 | ||
| 2MASS J172103903344160 | L3 | 2014 May 01 | GMOS-N | Blue | 6900 | 1.061.03 | ||
| 2014 May 02 | GMOS-N | Blue | 1900 | 1.041.05 | ||||
| 2014 May 06 | GMOS-N | Blue | 1900 | 1.071.08 | ||||
| 2MASS J175345186559559 | L4 | 2013 Aug 30 | GMOS-S | Blue | 6900 | 1.231.25 | ||
| 2013 Aug 31 | GMOS-S | Blue | 12900 | 1.231.45 | ||||
| 2MASS J182128151414010 | L4.5 | 2013 Aug 26 | GMOS-N | Blue | 8900 | 1.011.09 | ||
| 2013 Aug 29 | GMOS-N | Blue | 6900 | 1.041.23 | ||||
| 2013 Aug 30 | GMOS-N | Blue | 2900 | 1.091.13 | ||||
| 2MASS J214816334003594 | L6 | 2013 Aug 08 | GMOS-N | Blue | 8900 | 1.211.07 | ||
| 2013 Sep 01 | GMOS-N | Blue | 5900 | 1.211.10 | ||||
| 2013 Sep 02 | GMOS-N | Blue | 3900 | 1.061.08 | ||||
| 2013 Sep 29 | GMOS-N | Blue | 5900 | 1.071.09 |
| Object | H | Li I |
|---|---|---|
| (Å) | (Å) | |
| J01031935 | -0.6 | 12.90.2 |
| J11265003 | -0.3 | 0.3 |
| J12540122 | -26.60.2 | 0.5 |
| J14161348 | -0.3 | 0.3 |
| J17213344 | -0.3 | 0.3 |
| J17536559 | -0.3 | 0.3 |
| J18211414 | -0.3 | 13.50.1 |
| J21484003 | -0.3 | 12.60.1 |
| Object | SpT | H? | Phot. var.? | Rot. Per. (h) | Filter | Duration (h) | () | Ref. |
|---|---|---|---|---|---|---|---|---|
| 2MASS J005842530651239 | L0 | Y | N | Cousins | 2.6 | 1.2 | 3, 29 | |
| 2MASS J031403441603056 | L0 | Y | N | Cousins | 2.0 | 0.7 | 21, 29 | |
| 2MASS J115938500057268 | L0 | Y | N | Cousins | 3.0 | 0.6 | 21, 29 | |
| 2MASS J220002013038327 | L0 | Y | N | Cousins | 3.2 | 4.4 | 21, 29 | |
| 2MASS J074642562000321A | L0.5 | Y | Y | 3.320.15 | 61.6aafootnotemark: | 0.3a | 21, 30 | |
| 2MASS J141224491633115 | L0.5 | Y | N | Cousins | 3.3 | 1.6 | 21, 7 | |
| 2MASS J144137160945590 | L0.5 | Y | N | Cousins | 8.2 | 1.2 | 28, 29 | |
| 2MASS J235150442537367B | L0.5 | Y | Y | Cousins | 7.0 | 0.9 | 21, 29 | |
| 2MASS J102248215825453 | L1 | Y | Y | Sloan | 3.5 | 1.4 | 21, 38 | |
| 2MASS J1045240014957 | L1 | Y | N | Cousins | 6.7 | 0.6 | 28, 29 | |
| 2MASS J104842810111580 | L1 | Y | Y | Cousins | 2.6 | 1.0 | 21, 29 | |
| 2MASSW J1108307683017 | L1 | Y | N | Sloan | 4.5 | 1.0 | 4, 38 | |
| 2MASS J143928361929149 | L1 | Y | N | , Cousins | 6.8, 1.2 | 1.1, 0.9 | 5, 9, 15, 21, 29 | |
| 2MASS J155515730956055 | L1 | Y | N | Cousins | 11.1b | 0.5 | 16, 21 | |
| WISEP J190648.47401106.8 | L1 | Y | Y | 8.9 h | Kepler | 2.3 yr | 0.5 | 40 |
| 2MASS J1300425 191235 | L1 | Y | Y | R, Cousinsc | 5.6, 22.9 | 1.1, 1.4 | 7, 15, 17, 28, 33 | |
| 2MASSI J0829066145622 | L1 | Y | N | Cousins | 3.2 | 0.8 | 29, 36 | |
| DENIS J090957.1065806 | L1 | Y | N | Cousins | 6.3 | 0.9 | 8, 29, 41 | |
| 2MASS J114557142317297 | L1.5 | Y | Y | Cousins | 9.3 | 1.8 | 5, 21 | |
| 2MASS J1334062194035 | L1.5 | Y | Y | Cousins | 6.8 | 1.8 | 5, 28 | |
| 2MASS J164522111319516 | L1.5 | Y | N | Cousins | 3.1 | 1.0 | 11, 21 | |
| 2MASS J205754090252302 | L1.5 | Y | N | Cousins | 4.4 | 1.0 | 11, 17, 21 | |
| 2MASSW J0832045012835 | L1.5 | Y | N | Cousins | 2.0 | 1.1 | 3, 29 | |
| 2MASSW J0135358120522 | L1.5 | Y | N | Sloan | 2.2 | 1.8 | 3, 38 | |
| DENIS J174534.6164053 | L1.5 | Y | N | Cousins | 2.7 | 1.4 | 29, 41 | |
| 2MASS J082834191309198 | L2 | Y | Y | 2.9 | Cousins | 11.4d | 1.3 | 14, 21 |
| 2MASS J0921141210444 | L2 | Y | Y | , Cousins | 1.4, 1.4 | 1.8, 1.0 | 28, 29 | |
| 2MASS J115539523727350 | L2 | Y | Y | 8 | Cousins | 23.8e | 0.5 | 11, 21 |
| Kelu1 | L2 | Y | Y | 1.80.05 | 13.0f | 0.1 | 8, 12, 21 | |
| 2MASS J001544763516026 | L2 | Y | N | Sloan | 2.8 | 0.5 | 3, 38 | |
| 2MASSW J0030438313932 | L2 | Y | N | 4.9 | 2.3 | 1, 5 | ||
| 2MASSI J0847287153237 | L2 | Y | N | Cousins | 7.6 | 1.0 | 29, 41 | |
| 2MASSI J1726000153819 | L2 | N | N | [3.6], [4.5] | 14, 7 | 0.29, 0.49 | 3, 37 | |
| 2MASSW J2208136292121 | L2 | N | Y | 3.50.2 | [3.6], [4.5] | 14, 7 | 0.07, 0.11 | 3, 37 |
| 2MASS J052338221403022 | L2.5 | Y | N | Cousins | 7.0 | 0.8 | 21, 29, 33 | |
| 2MASS J102921651626526 | L2.5 | Y | N | , | 2.5, 2.2 | 1.8, 1.1 | 19, 21 | |
| 2MASS J1047310181557 | L2.5 | Y | N | , Cousins | 3.5, 13.6g | 2.3, 1.0 | 28, 29 | |
| DENIS J081231.6244442 | L2.5 | Y | N | , Cousins | 3.4, 5.7 | 2.5, 0.9 | 41, 29 | |
| 2MASS J105847871548172 | L3 | Y | Y | 4.10.2 | [3.6], [4.5] | 8, 6 | 0.2, 0.2 | 1, 37 |
| 2MASS J0913032184150 | L3 | Y | N | 5.4 | 3.5 | 5, 28 | ||
| 2MASS J1203581001550 | L3 | Y | N | 6.8 | 0.6 | 5, 28 | ||
| 2MASS J150654411321060 | L3 | Y | N | , | 4.5, 5.2 | 1.8, 0.9 | 4, 19, 21 | |
| 2MASS J1615441355900 | L3 | Y | N | Cousins | 3.6 | 6.0 | 7, 28 | |
| 2MASS J2104149103736 | L3 | Y | N | Cousins | 16.4h | 1.1 | 28, 29 | |
| 2MASS J083558290548308 | L3 | Y | N | Cousins | 6.5 | 1.5 | 29, 36 | |
| 2MASS J114634492230527 | L3 | Y | N | 3.9 | 1.0 | 5, 36 | ||
| 2MASS J032613672950152 | L3.5 | Y | N | 2.5 | 1.6 | 1, 5 | ||
| 2MASS J003616171821104 | L3.5 | Y | Y | 2.70.3 | , [3.6], [4.5] | 10.5, 8, 6 | 0.9, 0.1, 0.1 | 30, 37, 43 |
| 2MASS J1705483051646 | L4 | Y | N | 3.04 | 0.02 | 28, 45 | ||
| 2MASS J16154255249532117 | L4 | N | Y | 24 | 3.6 | 5.9 | 7, 28 | |
| DENIS 12281547 | L4.5 | Y | N | Cousins, | 4.3, 3.4 | 1.3, 0.7 | 12, 29, 33, 44 | |
| 2MASSW J2224438015852 | L4.5 | Y | N | [3.6], [4.5] | 12, 8 | 0.14, 0.14 | 3, 37 | |
| 2MASS J13153094−2649513 | L5 | Y | N | Cousins | 2.9 | 1.3 | 27, 29 | |
| 2MASS J014435360716142 | L5 | Y | Y | aperiodic | Cousins | 14.5k | 1.5 | 13, 29 |
| 2MASSI J0421072630602 | L5 | N | N | [3.6], [4.5] | 14, 7 | 0.2, 0.2 | 24, 37 | |
| 2MASSW J0820299450031 | L5 | N | N | [3.6], [4.5] | 14, 7 | 0.4, 0.4 | 3, 37 | |
| DENISP J142527.97365023.4 | L5 | N | Y | 3.70.8 | 3.24 | 0.02 | 18, 45 | |
| 2MASSW J1507476162738 | L5 | N | Y | 2.50.1 | [3.6], [4.5] | 12, 8 | 0.14, 0.14 | 3, 22, 28, 37 |
| 2MASS J115013220520124 | L6 | N | N | [3.6], [4.5] | 14, 7 | 0.5, 0.6 | 26, 37 | |
| 2MASSI J0825196211552 | L7.5 | N | Y | 7.6 | [3.6], [4.5] | 12, 9 | 0.14, 0.14 | 21, 37 |
| 2MASS J154509013555271 | L7.5 | N | N | [3.6], [4.5] | 14, 7 | 0.8, 0.9 | 26, 37 | |
| Luhman 16A | L7.5 | N | Y | 4.5–5.5 | several epochs | 0.1–1.5 | 31, 34, 46, 47, 48 | |
| SDSS J042348.57–041403.5 | L7.5 | Y | N | 3.57 | 0.02 | 43, 45 | ||
| 2MASS J010752420041563 | L8 | N | Y | Irregular | [3.6], [4.5] | 14, 7 | 0.3, 0.2 | 18, 37 |
| 2MASS J163229111904407 | L8 | N | Y | 3.90.2 | [3.6], [4.5] | 8, 6 | 0.4, 0.3 | 1, 37 |
| 2MASSI J0328426230205 | L9.5 | N | N | [3.6], [4.5] | 14, 7 | 0.5, 0.6 | 3, 37 | |
| 2MASS J152039743546210 | T0 | N | N | [3.6], [4.5] | 14, 7 | 0.3, 0.4 | 26, 37 | |
| 2MASS J151643063053443 | T0.5 | N | Y | 6.7 | [3.6], [4.5] | 14, 7 | 0.4, 0.5 | 26, 37 |
| Luhman 16B | T0.5 | N | Y | 4.870.01 | several epochs | 0.1–1.5 | 31, 34, 46, 47, 48 | |
| 2MASS J085834673256275 | T1 | N | N | [3.6], [4.5] | 14, 7 | 0.3, 0.4 | 26, 37 | |
| 2MASS J213926760220226 | T2 | N | Y | 7.72 | 2.5 | 0.05 | 43, 45 | |
| SDSS J075840.33324723.4 | T2 | N | Y | 4.90.2 | 3.54 | 0.02 | 43, 45 | |
| 2MASS J12095613110040081 | T2T7.5 | N | N | [3.6], [4.5] | 14, 7 | 0.7, 0.7 | 37, 43 | |
| SIMP J013656.5093347.3 | T2.5 | N | Y | 2.38950.0005 | 4 nights | 0.5 | 25, 43 | |
| SIMP J162918.41033537.0 | T3 | N | Y | 6.92.4 | 4.03 | 0.01 | 43, 45 | |
| SDSS J102109.69030420.1 | T4 | N | N | 3.17 | 0.7 | 23, 33, 43 | ||
| 2MASS J05591914–1404488 | T4.5T5 | N | N | 3.52 | 0.07 | 43, 45 | ||
| 2MASSI J2254188312349 | T5 | N | N | [3.6], [4.5] | 14, 7 | 0.7, 0.7 | 37, 43 | |
| 2MASS J122554322739466 | T6 | N | N | 2.85 | 0.7 | 33, 43 | ||
| 2MASSI J1534498295227 | T6 | N | N | 3.88 | 0.7 | 33, 43 | ||
| SDSSp J162414.37002915.6 | T6T6 | N | N | 4 nights | 4.4 | 35, 43 | ||
| 2MASSW J1047539212423 | T7 | Y | N | 1.77ll | 9.9l | 1.1 | 39, 43 | |
| 2MASS J121711100311131 | T7 | N | Y | 3.2 | 0.07 | 43, 45 | ||
| 2MASS J123739196526148 | T7 | Y | Y | 2.5 | 2.3 | 6, 43 | ||
| 2MASSI J0415195093506 | T8 | N | Y | 3.79 | 0.01 | 43, 45 | ||
| 2MASS J072718241710012 | T7T8 | N | N | 5.0 | 1.1 | 32, 43 |
Peer Reviews
No public reviews on file for this paper yet. If you reviewed it on a platform where reviews are public (OpenReview, ICLR, NeurIPS, ICML), you can paste yours below so the community can read it here.
Videos
No videos yet. Explain this paper in a talk, walkthrough, or lecture? Add one.
Weather on Other Worlds. IV. H emission and photometric variability are not correlated in L0–T8 dwarfs
Paulo A. Miles-Páez11affiliation: Department of Physics & Astronomy and Centre for Planetary Science and Exploration, The University of Western Ontario, London, Ontario N6A 3K7, Canada, ([email protected]) , Stanimir A. Metchev11affiliation: Department of Physics & Astronomy and Centre for Planetary Science and Exploration, The University of Western Ontario, London, Ontario N6A 3K7, Canada, ([email protected]) 22affiliation: Department of Physics & Astronomy, Stony Brook University, Stony Brook, New York 11743, USA , Aren Heinze33affiliation: Institute for Astronomy, University of Hawaii, 2680 Woodlawn Drive, Honolulu, HI 96822, USA
Dániel Apai44affiliation: The University of Arizona, Department of Astronomy, 933 North Cherry Avenue, Tucson, AZ 85721, USA 55affiliation: The University of Arizona, Department of Planetary Sciences and Lunar and Planetary Laboratory, 1629 East University Boulevard, Tucson, AZ 85721, USA
Abstract
Recent photometric studies have revealed that surface spots that produce flux variations are present on virtually all L and T dwarfs. Their likely magnetic or dusty nature has been a much-debated problem, the resolution to which has been hindered by paucity of diagnostic multi-wavelength observations. To test for a correlation between magnetic activity and photometric variability, we searched for H emission among eight L3–T2 ultra-cool dwarfs with extensive previous photometric monitoring, some of which are known to be variable at 3.6 m or 4.5 m. We detected H only in the non-variable T2 dwarf 2MASS J125453930122474. The remaining seven objects do not show H emission, even though six of them are known to vary photometrically. Combining our results with those for 86 other L and T dwarfs from the literature show that the detection rate of H emission is very high (94%) for spectral types between L0 and L3.5 and much smaller (20%) for spectral types L4, while the detection rate of photometric variability is approximately constant (30%–55%) from L0 to T8 dwarfs. We conclude that chromospheric activity, as evidenced by H emission, and large-amplitude photometric variability are not correlated. Consequently, dust clouds are the dominant driver of the observed variability of ultra-cool dwarfs at spectral types at least as early as L0.
brown dwarfs — stars: activity — stars: low-mass — stars: rotation — stars: variables
1 Introduction
Observational studies have shown that ultra-cool dwarfs (spectral types M7) can display spectro-photometric variability with typical timescales of a few hours (Bailer-Jones & Mundt, 2001; Gelino et al., 2002; Littlefair et al., 2008; Artigau et al., 2009; Radigan et al., 2012; Apai et al., 2013; Koen, 2013; Radigan et al., 2014; Crossfield et al., 2014; Yang et al., 2016). Accurate spectroscopic time series using the Hubble Space Telescope and precise 3–5 m monitoring with the Spitzer Space Telescope, as part of the Storms and Weather on Other Worlds campaigns, indicate that atmospheric spots responsible for this variability are ubiquitous on L3–T8 dwarfs (Buenzli et al., 2014; Metchev et al., 2015). Some of these observations, combined with state-of-the-art radiative transfer models, have shown that the detected spots can generally be attributed to atmospheric dust clouds that modulate the object’s brightness as it rotates (Artigau et al., 2009; Marley et al., 2010; Radigan et al., 2012; Morley et al., 2012; Apai et al., 2013; Yang et al., 2015). However, the consistent detection of variability in the warmest spectral types of ultra-cool dwarfs (late-M and early L) also points to another possibility: magnetically induced chromospheric activity and hot or cold star spots, similarly to F-M stars, for which magnetic activity can produce spots (Strassmeier, 1994) that lead to photometric variability (e.g., Hooten & Hall 1990; Henry et al. 1995, or Strassmeier et al. 1997).
Magnetic activity can be revealed in different ways, for example, as emission lines from the chromosphere (e.g., Ca II H and K lines) or from the transition region (e.g., C IV), coronal X-rays, radio emission, and/or spots and flares (Reid, 2013, and references therein). In most cases the observation of these activity indicators is extremely challenging for ultra-cool dwarfs: observations at X-rays and radio wavelengths are limited to the closest ultra-cool dwarfs; while Ca II H and K emissions (3968, 3933 Å) are almost undetectable given the low fluxes of ultra-cool dwarfs at 6000 Å. Several works on F-M stars have shown that H emission is also an appropriate tracer of magnetic activity as it correlates with the Ca II H and K lines (Zarro & Rodgers, 1983; Pasquini & Pallavicini, 1991; Montes et al., 1995), the C IV line (Rutten et al., 1991), and/or X-rays emission (Doyle, 1989; Young et al., 1989). H emission is one of the most suitable activity indicators in ultra-cool dwarfs, which emit most of their flux at red optical and near-infrared wavelengths. Observations of H emission have revealed that virtually all SDSS late-M dwarfs are chromospherically active (Schmidt et al., 2007; West et al., 2011). While for L dwarfs, Schmidt et al. (2007, 2015) observed a decreasing fraction of H emitters into the L s; and Pineda et al. (2016) found that 9.2 of L4–T8 dwarfs show H emission. Star spot-like cool regions with frozen-in magnetic field lines are not expected in the highly neutral atmospheres of ultra-cool dwarfs (Mohanty & Basri, 2003). However, energetic magnetic field discharges (10 kG) are a potential source of chromospheric heating (“hot spots”) as seen in some late-M and early-L dwarfs (e.g., Berger, 2002, 2006; Berger et al., 2008; Yu et al., 2011). More recently, optical and radio aurorae have also been proposed as likely drivers of some of the observed photometric variability at optical and near-infrared wavelengths (Hallinan et al., 2015; Kao et al., 2016).
The likely magnetic or dusty nature of the atmospheric inhomogeneities of ultra-cool dwarfs has been a much-debated problem almost since the discovery of the first brown dwarfs (Tinney & Tolley, 1999; Martín et al., 2001; Bailer-Jones, 2002; Lane et al., 2007). Recent multi-wavelength photometric studies in early L dwarfs have shown sinusoidal periodicities that are well-explained by a thick long-lived cloud. Heinze et al. (2013) presented data for the L3 dwarf DENIS-P J1058.71548 in the , 3.6 m, and 4.5 m bands, and showed that it is difficult to account for the observed photometric variability by magnetic phenomena unless they are combined with cloud inhomogeneities. Also, Gizis et al. (2015) showed that the optical light curve of the L1 dwarf WISEP J190648.47401106.8 has remained stable for 2 years and in phase with other light curves at 3.6 m and 4.5 m, while its variable H emission is not synchronized with the light curves. Such observational evidence points to the existence of a long-lived cloud.
Nonetheless, with chromospheric activity expected to produce star spot-like inhomogeneities, it is important to address the question whether star spots, rather than dust clouds, may dominate the photometric variability of active ultra-cool dwarfs. We address this problem through a combination of deep optical spectroscopy of a sample of eight ultra-cool dwarfs, whose photometric light curves have been studied to a high precision with Spitzer, and a literature sample of 86 photometrically and spectroscopically observed L0-T8 dwarfs. We seek to answer whether the combined sample shows a correlation between magnetic activity—probed by the detection of H emission—and photometric variability. We briefly describe our sample in Section 2 and the observations and data reduction in Section 3. The main results of our survey and its combination with literature data are presented in Sections 4–5. We discuss their implications for the correlation between observed chromospheric activity and photometric variability in Section 6, and summarize our findings in Section 7.
2 Sample selection
We selected seven L3–L6 dwarfs and one T2 brown dwarf from the sample of Metchev et al. (2015). Our targets are among the brightest (J$$\sim13.2–16.3 mag) dwarfs studied in that work, in which they were continuously monitored in the 3.6 m and 4.5 m bands for a total of 16–21 h by using the IRAC instrument on Spitzer.
Five objects exhibited photometric periodicities in the 2.7–19 h range, attributed to rotation. Another of our targets seems to be a long periodicity variable with a time scale greater than 50 h, and the remaining two did not show any photometric variability within 0.91% in either of the 3.6 m and 4.5 m bands.
The full names of our targets, their spectral types, variability period (if measured), and -band magnitudes are listed in columns 1–4 of Table 1. Henceforth we will use abridged names for the targets. For more details about the objects we refer to Metchev et al. (2015).
3 Observations
We used the two copies of the Gemini Multi-Object Spectrograph (GMOS; Hook et al., 2004) mounted on the 8 m Gemini North and Gemini South telescopes to collect optical spectra of our targets. Observations were carried out in queue mode between August 2013 and May 2014.
Five of our targets (J010319, J141613, J172133, J182114, and J214840) were observed from the North using the R831*-G5302 grating and the remaining three (J112650, J125401, and J175365) from the South with the R831-*G5322 grating. At both telescopes we used a slit of 0.75 (pixel scale of 0.08″) with a binning of 2 pixels, which yielded a resolution of 6 Å in our spectra. In each campaign we also used the second order-blocking filter GG455 to avoid contamination of our data with stray light from wavelengths 5000 Å. For six of our targets we used a central wavelength of 5712 Å (“blue configuration”), and for the other two a central wavelength of 7300 Å (“red configuration”). Data collected with the blue and red configurations cover 4670–6820 Å and 6270–8460 Å, respectively. For each target we collected between 8 and 21 individual spectra, by dithering along the spectroscopic slit, with typical exposure times of 780–900 s. On each night we also recorded spectra of CuAr lamps with the same instrumental setup as used for the science targets. No standard spectrophotometric stars were observed in any observing epoch, thus, our final spectra were not calibrated in flux. In columns 5–9 of Table 1 we provide for each target: dates of observations, instrument used, instrumental configuration, number of individual spectra collected multiplied by individual exposure time, and the range of airmass covered.
We used the Gemini package within the Image Reduction and Analysis Facility software (IRAF) for bias subtraction and flat fielding of the data. We extracted the spectra using the IRAF apextract standard routines. We employed typical aperture widths of 20 pixel centered on the spectroscopic traces, which we fit with second- to fourth-order Legendre polynomials. We estimated sky backgrounds from two 20-pixel-wide bands, centered 20–30 pixels away from the trace of the object. Figure 1 shows the final wavelength-calibrated (with a typical uncertainty of 0.1–0.2 Å) and median-combined spectra for all eight targets.
4 Results from our survey
4.1 H emission
The main motivation of our survey is the search for H emission in a set of targets for which we have exquisitely precise determinations of the presence or absence of photometric variability. As seen in Figure 1, we detect H in only one of the eight targets: the field T2 dwarf J125401, which is not known to vary photometrically. H emission from this T2 dwarf was already reported by Burgasser et al. (2003). The remaining seven targets in our sample—all L dwarfs—do not show any sign of H emission, even though five of them exhibit photometric variability compatible with rotation.
Figure 2 shows the locations of the H Å and Li I Å lines. H emission is not detectable even at low levels among the seven L dwarfs. We collected spectra of most of our targets, with the exception of the L6 dwarf J141613, on at least two different nights. Weak signs of H are not seen in the individual spectra, either. Therefore, it is unlikely that we have missed a phase of emission. Note that the photospheric H absorption—seen from F to mid M stars—is not expected in the spectra of ultra-cool dwarfs (M7) since their photospheres are too cool to populate the level of hydrogen significantly. Thus, H can only be present as an emission line if there is a chromospheric heating (Cram & Mullan, 1985; Giampapa, 1985; Giampapa & Liebert, 1986; Basri, 2000).
We measured the pseudo-equivalent width (pEW) of the H emission line detected in J1254–01 by first subtracting the neighboring continuum determined from a 45 Å-wide region (excluding the 10 Å centered in the H line), and then summing the flux contained in the central 10 Å as done in Pineda et al. (2016). We also integrated the flux in different regions of the continuum and adopted the average value as the uncertainty in our pEW. For the remaining 7 targets without H emission, we adopted the same procedure for estimating 3 upper limits. These values are given in Table 4.1.
The reference list from the paper itself. Each links out to its DOI / PubMed record.
- 1Allard et al. (2001) Allard, F., Hauschildt, P. H., Alexander, D. R., Tamanai, A., & Schweitzer, A. 2001, Ap J, 556, 357
- 2Apai et al. (2013) Apai, D., Radigan, J., Buenzli, E., et al. 2013, Ap J, 768, 121
- 3Artigau et al. (2009) Artigau, É., Bouchard, S., Doyon, R., & Lafrenière, D. 2009, Ap J, 701, 1534
- 4Bailer-Jones (2002) Bailer-Jones, C. A. L. 2002, A&A, 389, 963
- 5Bailer-Jones & Lamm (2003) Bailer-Jones, C. A. L., & Lamm, M. 2003, MNRAS, 339, 477
- 6Bailer-Jones & Mundt (2001) Bailer-Jones, C. A. L., & Mundt, R. 2001, A&A, 367, 218
- 7Basri (2000) Basri, G. 2000, ARA&A, 38, 485
- 8Berger (2002) Berger, E. 2002, Ap J, 572, 503