Enhancing sideband cooling by feedback--controlled light
Massimiliano Rossi, Nenad Kralj, Stefano Zippilli, Riccardo Natali,, Antonio Borrielli, Gregory Pandraud, Enrico Serra, Giovanni Di Giuseppe,, David Vitali

TL;DR
This paper demonstrates that feedback-controlled light can significantly enhance sideband cooling of an optomechanical system, achieving a 7.5 dB improvement and potentially surpassing quantum backaction limits.
Contribution
The authors introduce a phase-sensitive feedback scheme that improves optomechanical cooling by manipulating pump field fluctuations, a novel approach in the field.
Findings
Achieved 7.5 dB improvement in sideband cooling with feedback.
Operating in the anti-squashing regime enhances cooling performance.
Potential to surpass quantum backaction cooling limits.
Abstract
We realise a phase-sensitive closed-loop control scheme to engineer the fluctuations of the pump field which drives an optomechanical system, and show that the corresponding cooling dynamics can be significantly improved. In particular, operating in the counter-intuitive "anti-squashing" regime of positive feedback and increased field fluctuations, sideband cooling of a nanomechanical membrane within an optical cavity can be improved by 7.5~dB with respect to the case without feedback. Close to the quantum regime of reduced thermal noise, such feedback-controlled light would allow going well below the quantum backaction cooling limit.
Click any figure to enlarge with its caption.
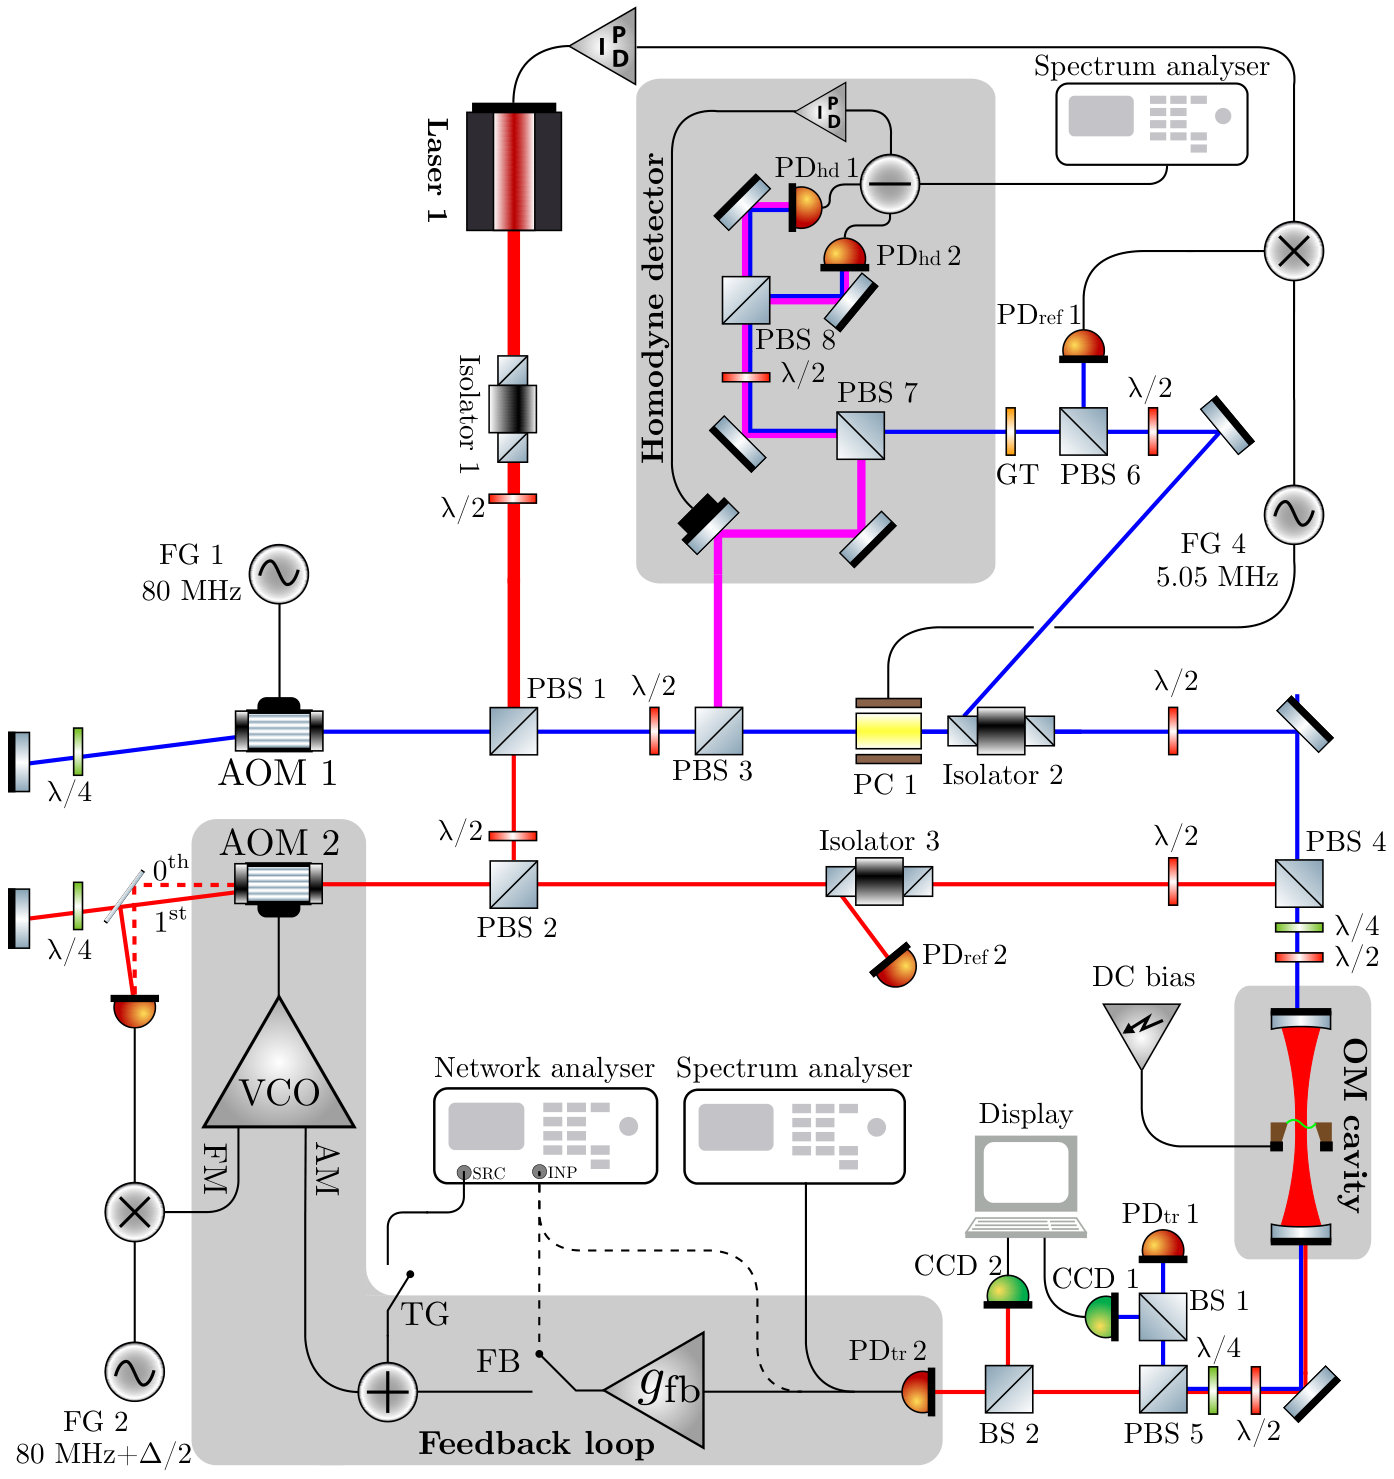 Figure 1
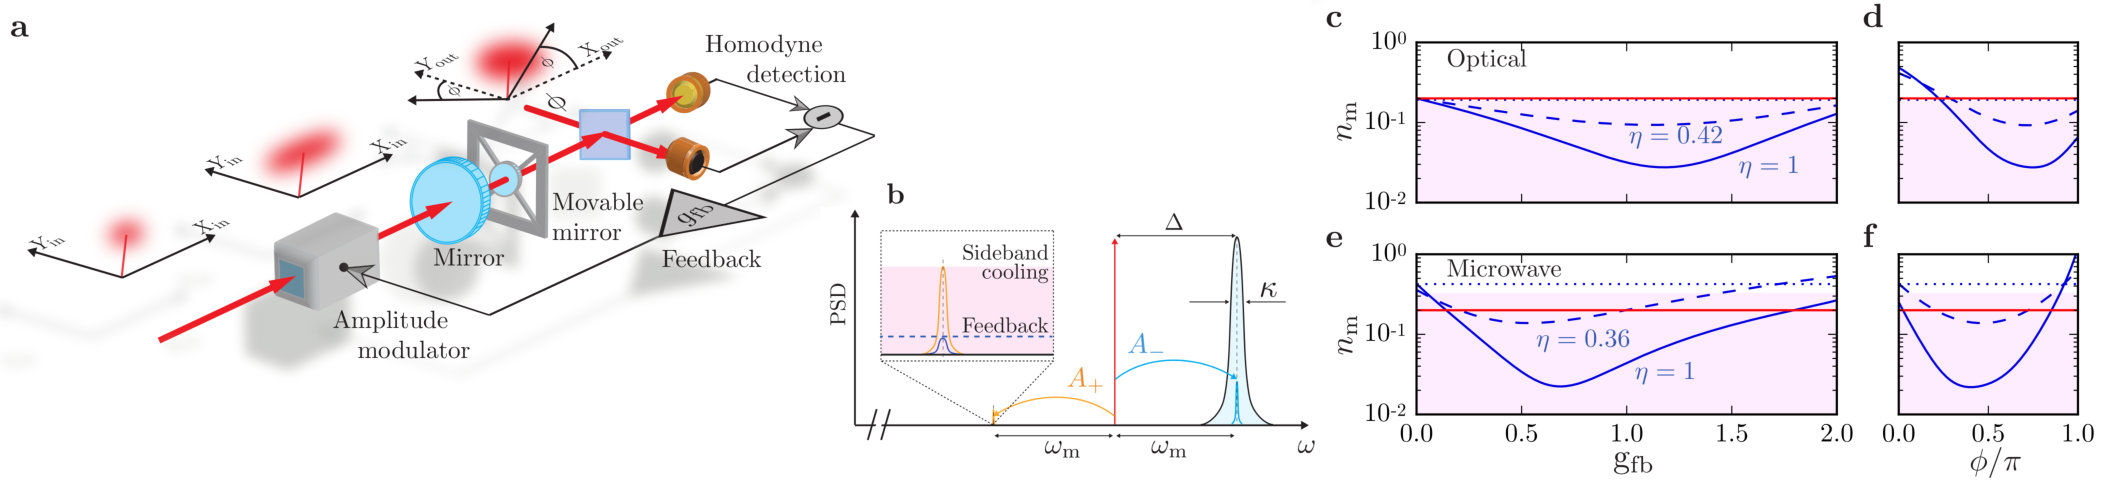 Figure 1
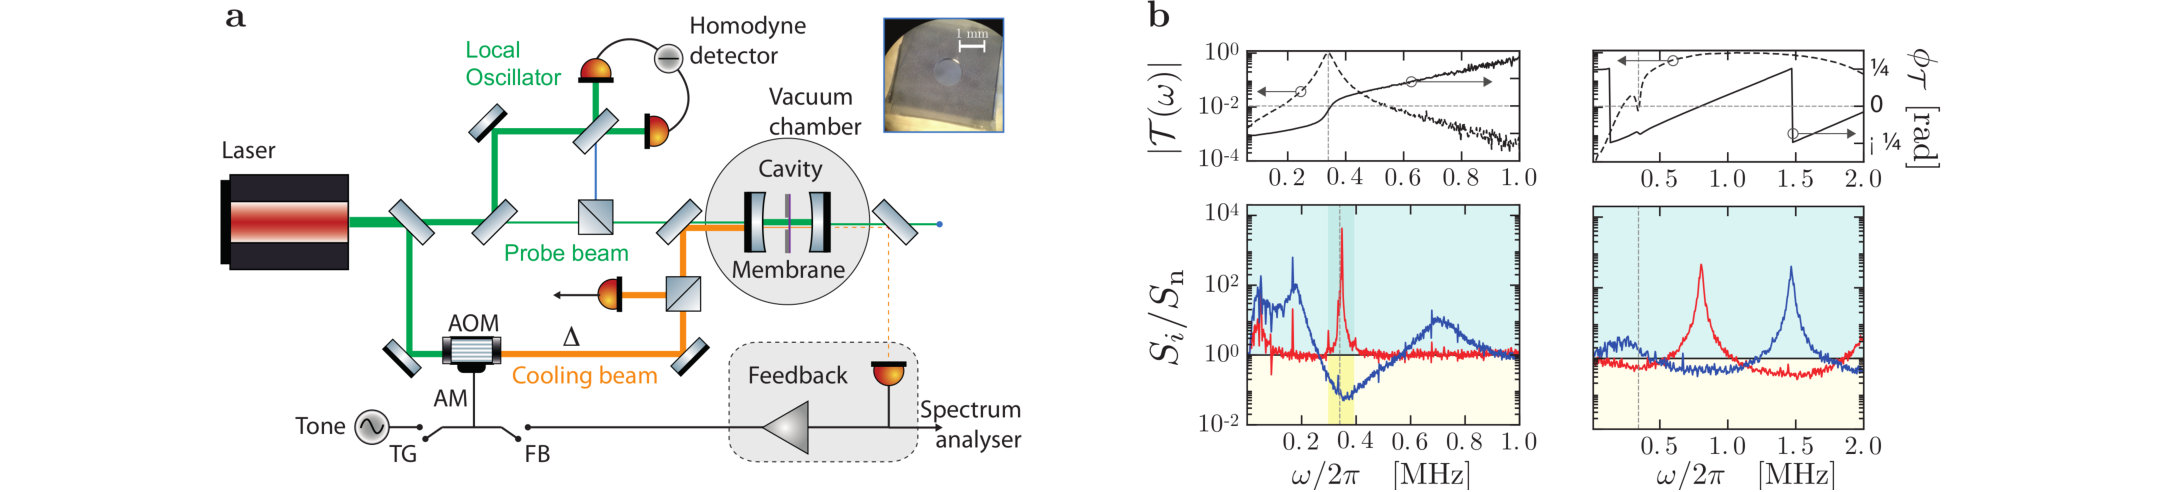 Figure 2
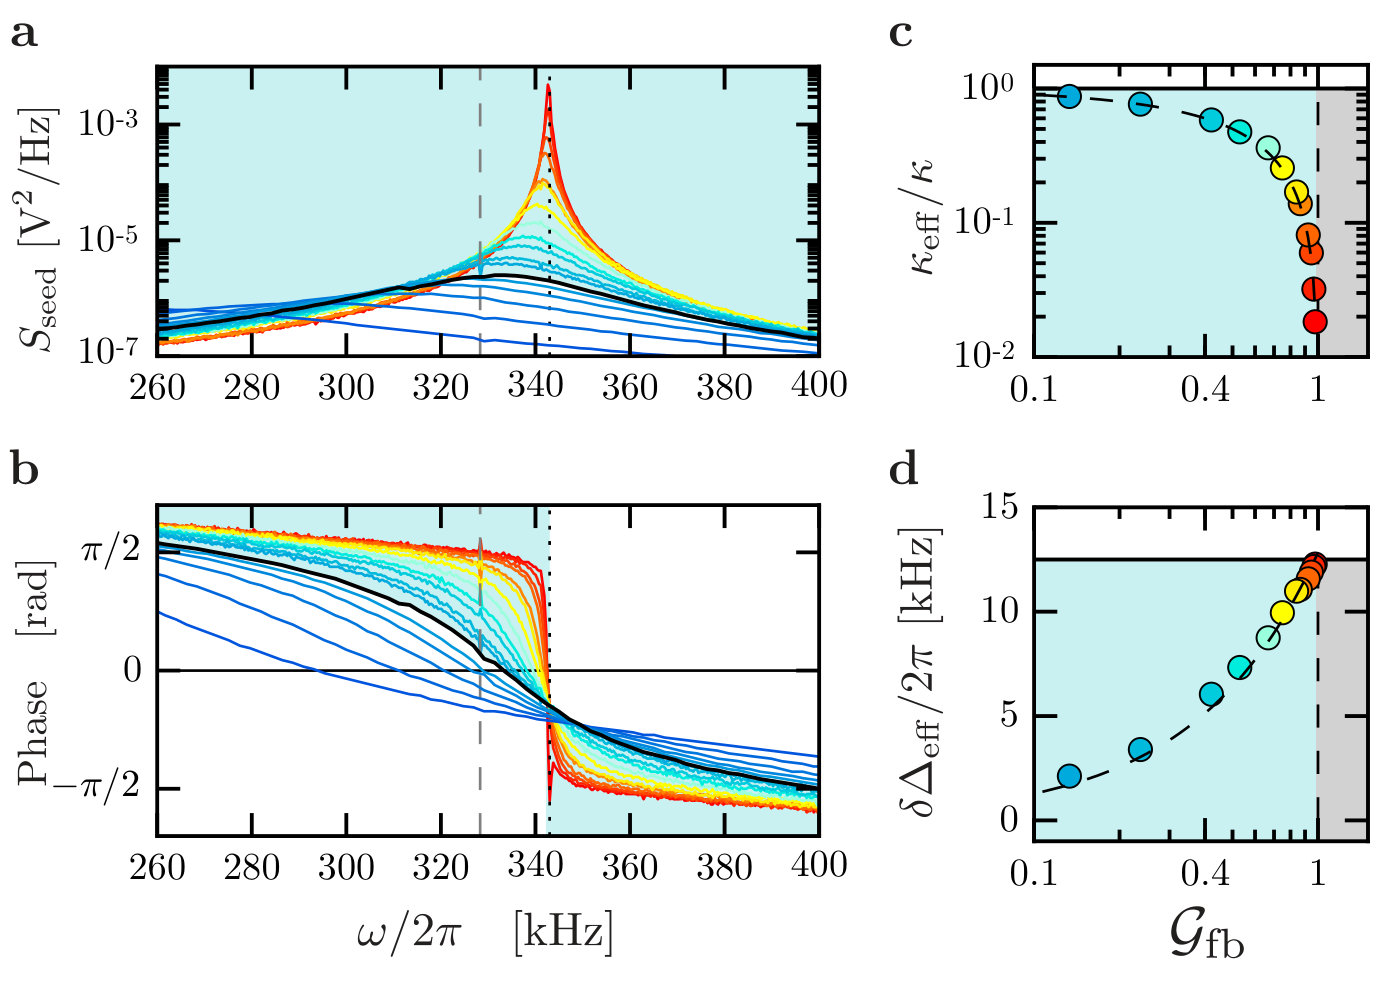 Figure 3
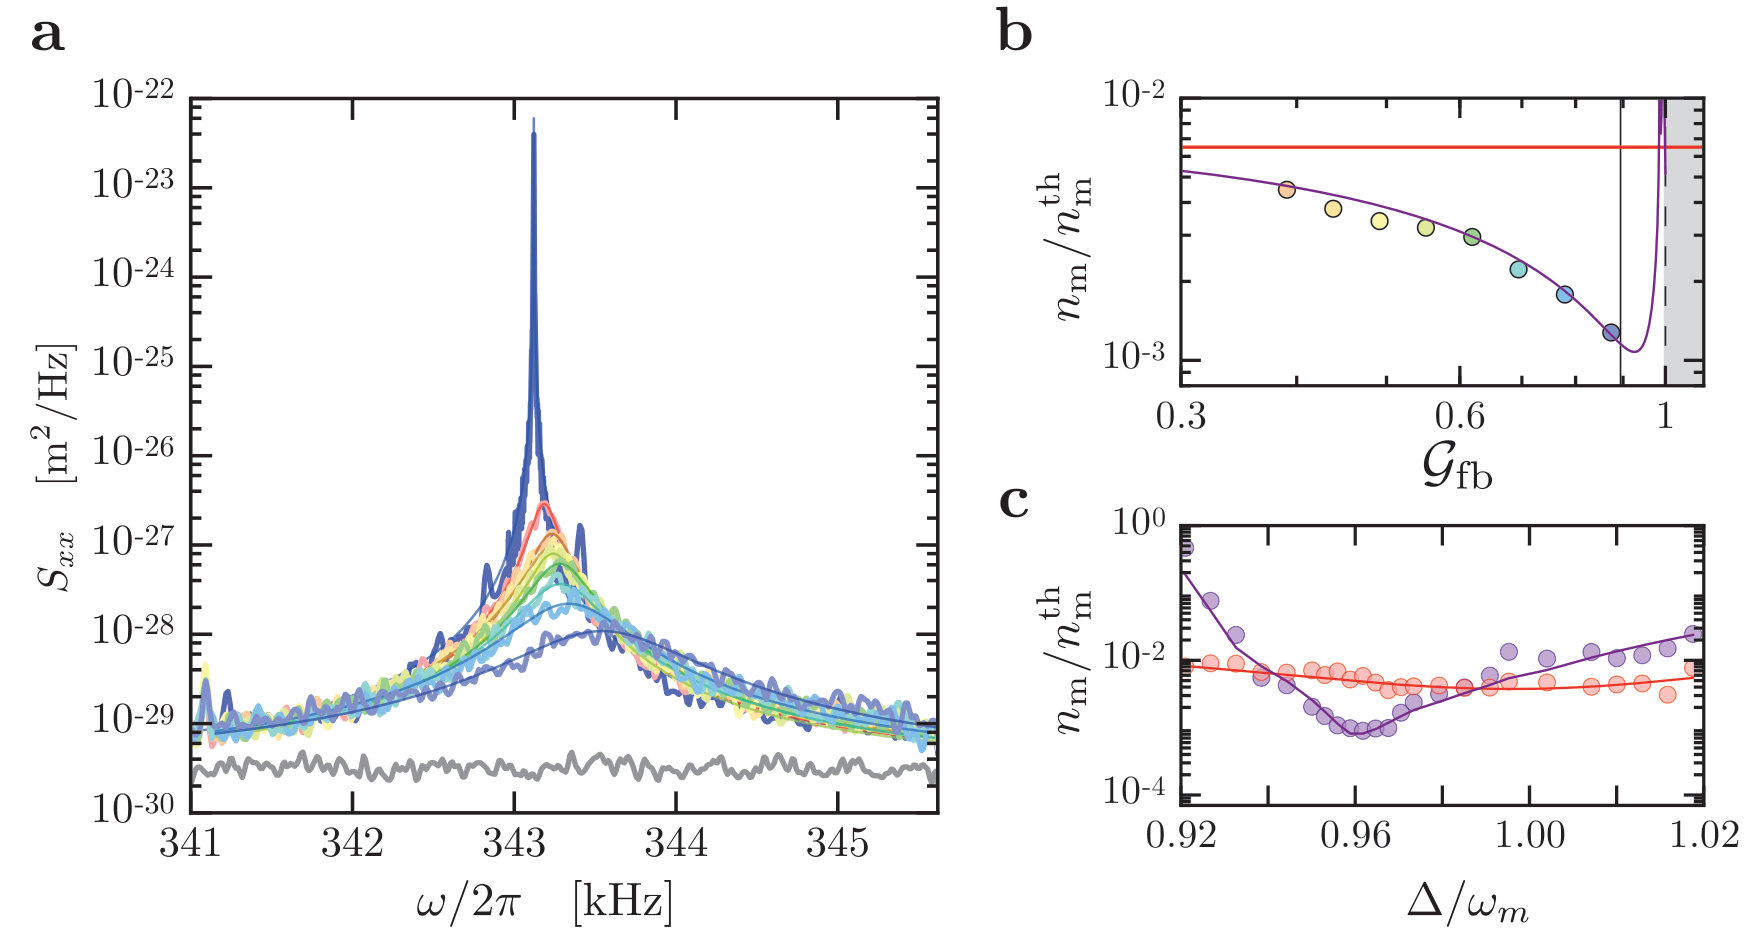 Figure 4
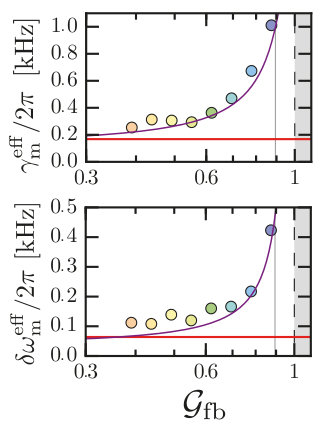 Figure 6
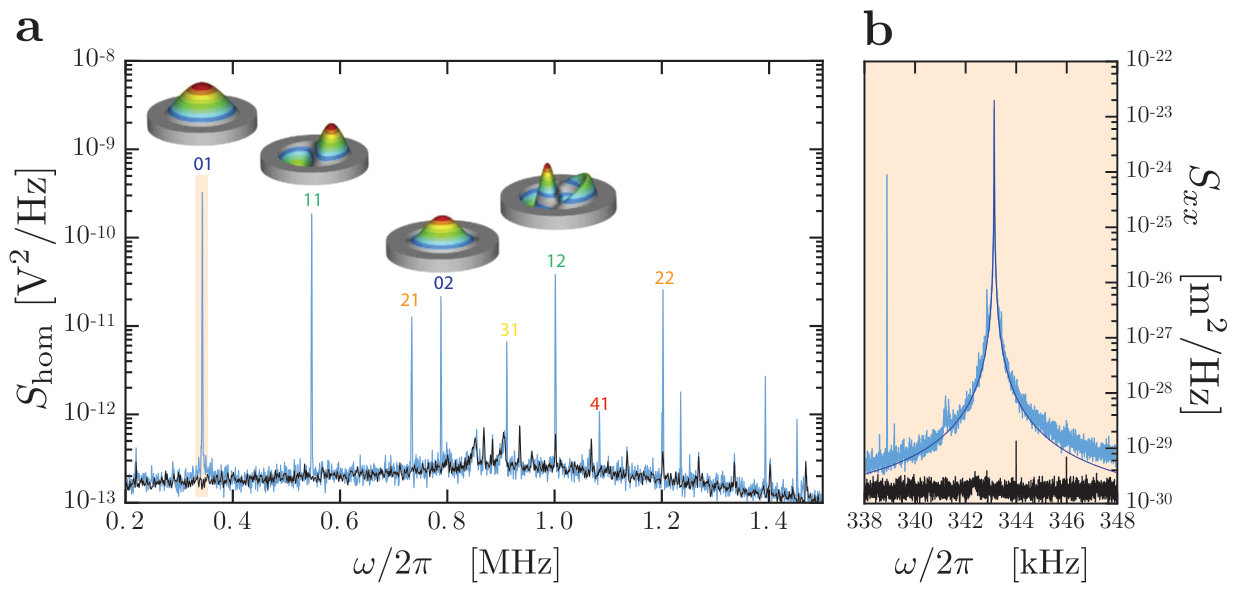 Figure 7
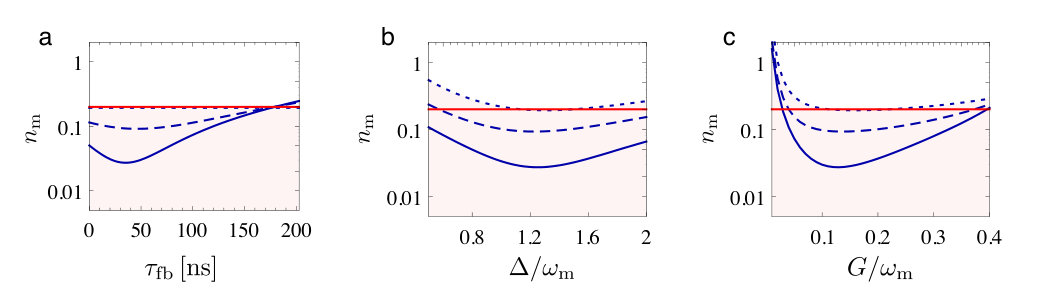 Figure 8
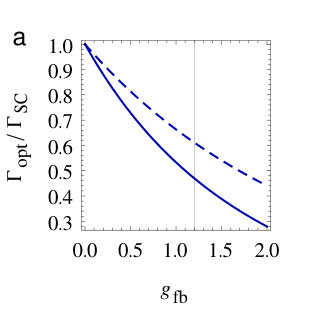 Figure 9
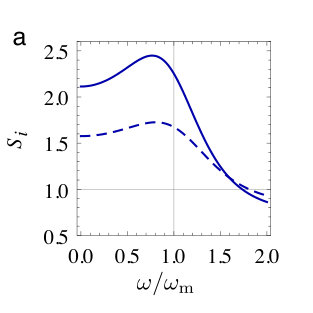 Figure 10
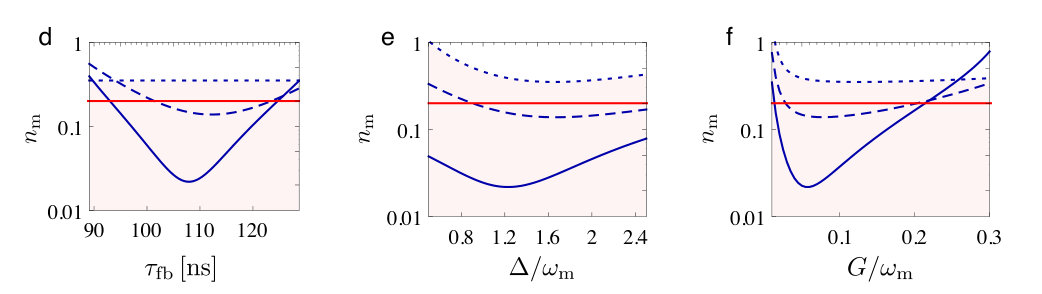 Figure 11
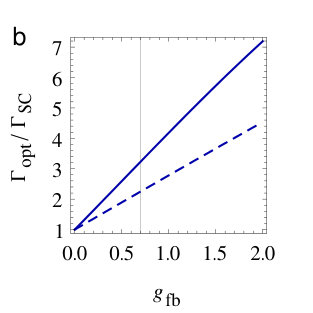 Figure 12
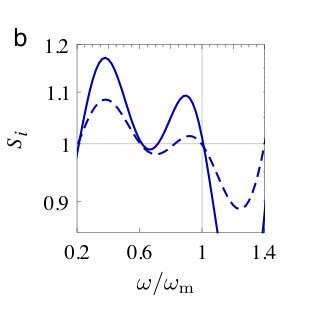 Figure 13
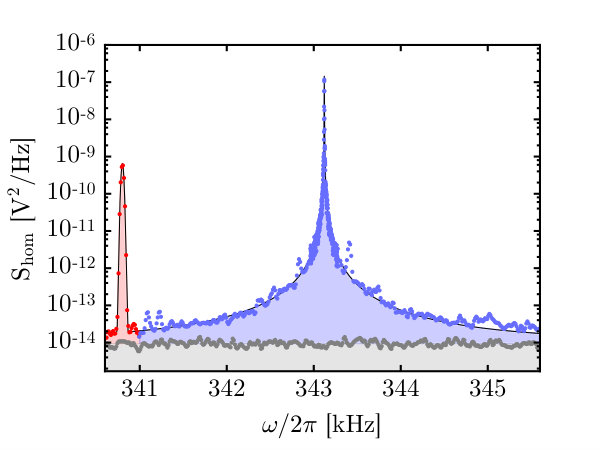 Figure 14
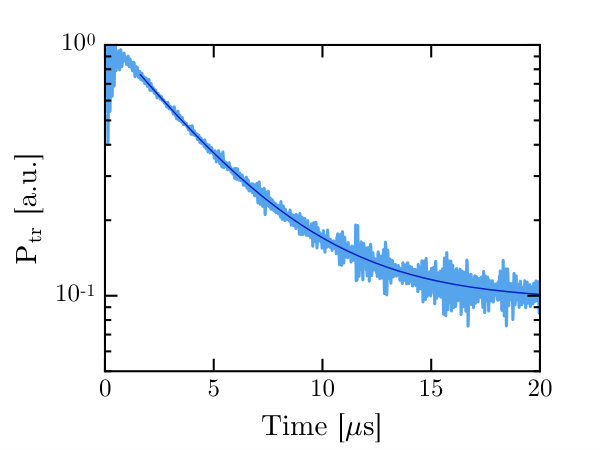 Figure 15
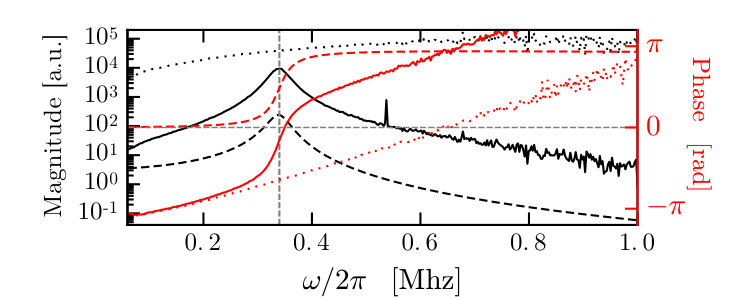 Figure 16
Peer Reviews
No public reviews on file for this paper yet. If you reviewed it on a platform where reviews are public (OpenReview, ICLR, NeurIPS, ICML), you can paste yours below so the community can read it here.
Videos
No videos yet. Explain this paper in a talk, walkthrough, or lecture? Add one.
Enhancing sideband cooling by feedback–controlled light
Massimiliano Rossi
School of Higher Studies “C. Urbani”, University of Camerino, 62032 Camerino (MC), Italy
School of Science and Technology, Physics Division, University of Camerino, 62032 Camerino (MC), Italy
Nenad Kralj
School of Science and Technology, Physics Division, University of Camerino, 62032 Camerino (MC), Italy
Stefano Zippilli
Riccardo Natali
School of Science and Technology, Physics Division, University of Camerino, 62032 Camerino (MC), Italy
INFN, Sezione di Perugia, 06123 Perugia (PG), Italy
Antonio Borrielli
Institute of Materials for Electronics and Magnetism, Nanoscience-Trento-FBK Division, 38123 Povo (TN), Italy
Gregory Pandraud
Delft University of Technology, Else Kooi Laboratory, 2628 Delft, The Netherlands
Enrico Serra
Delft University of Technology, Else Kooi Laboratory, 2628 Delft, The Netherlands
Istituto Nazionale di Fisica Nucleare, TIFPA, 38123 Povo (TN), Italy
Giovanni Di Giuseppe
David Vitali
School of Science and Technology, Physics Division, University of Camerino, 62032 Camerino (MC), Italy
INFN, Sezione di Perugia, 06123 Perugia (PG), Italy
CNR-INO, L.go Enrico Fermi 6, I-50125 Firenze, Italy
Abstract
We realise a phase–sensitive closed–loop control scheme to engineer the fluctuations of the pump field which drives an optomechanical system, and show that the corresponding cooling dynamics can be significantly improved. In particular, operating in the counter–intuitive “anti–squashing” regime of positive feedback and increased field fluctuations, sideband cooling of a nanomechanical membrane within an optical cavity can be improved by 7.5 dB with respect to the case without feedback. Close to the quantum regime of reduced thermal noise, such feedback–controlled light would allow going well below the quantum backaction cooling limit.
Feedback loops based on real–time continuous measurements WisemanBook are commonly used for stabilisation purposes, and they have also been successfully applied to the stabilisation of quantum systems Sayrin2011realtime ; Riste2013 ; Wilson2015Measurement-bas . Typically a system is continuously monitored and the acquired signal drives the actuator which in turn drives the system to the desired target. Here we demonstrate a novel approach to closed–loop control in which the feedback acts on an additional control field which is used to drive the system of interest. In particular, the actuator acts on the control field in order to engineer its phase and amplitude fluctuations. The resulting feedback–controlled in–loop field is then exploited to manipulate the system and improve its performance. In–loop optical fields have been studied for decades both theoretically Shapiro1987Theory-of-light ; Taubman1995Intensity-feedb ; Wiseman1998In-Loop-Squeezi ; Wiseman1999Squashed-states and experimentally Buchler1999Suppression-of- ; Sheard2005Experimental-de . A lot of effort has been made to reduce (squash) the noise exhibited by the field fluctuations inside the loop. However, in–loop sub–shot–noise fluctuations cannot be recognised as squeezed below the vacuum noise level, for two different reasons: firstly, the free field commutation relations are no longer valid for time events separated by more than the loop delay–time, since in–loop fields are not free fields Wiseman1999Squashed-states ; secondly, the corresponding out–of–loop fields exhibit super–shot–noise fluctuations Shapiro1987Theory-of-light . Nevertheless, useful applications of these fields have been proposed and realised, e.g. suppression of the radiation pressure noise Buchler1999Suppression-of- , removal of classical intensity noise Sheard2005Experimental-de , and atomic line narrowing Wiseman1998In-Loop-Squeezi . The common basis of these works is the negative feedback regime. Negative feedback has also been successfully employed in mechanical Cohadon1999 ; Poggio2007Feedback-Coolin ; Vinante2008Feedback-Coolin , and cavity optomechanical systems Wilson2015Measurement-bas , where an electromagnetic field is used to probe a mechanical resonator, and in turn to control the feedback actuator, which acts directly on the mechanical oscillator. Engineered light fluctuations in the form of squeezed light have also been used in optomechanical systems to improve both the detection sensitivity McKenzie2002Experimental-De ; LIGO2013 ; Peano2015Intracavity-Squ ; Clark2016Observation-of- and the cooling efficiency Schafermeier2016aa ; Clark ; Asjad2016Suppression-of- . In the present work we show that it is possible to manipulate, with a feedback system [see Figure 1 (a)], the fluctuations of the laser field that drives an optomechanical system to enhance optomechanical sideband cooling AspelmeyerRMP ; Teufel2011 ; Chan2011 ; Peterson2016Laser-Cooling-o . Our analysis demonstrates the effectiveness of this approach in two very different parameter regimes, and shows that the light fluctuations can be properly adapted to reduce the effects of the dominant heating processes under very different physical situations. At low temperature, when standard sideband cooling is limited by backaction noise, we show that the Stokes heating processes can be coherently suppressed by destructive interference so that the quantum backaction limit can be surpassed. At high temperature, when the performance of sideband cooling is restrained by thermal noise, the feedback can be operated close to instability in order to enhance inelastic light scattering processes and to improve the cooling rate.
A vibrational mode of a mechanical object coupled to a cavity field can be cooled by laser light when the cavity is resonant with anti–Stokes processes, whereby incident photons are scattered to higher frequencies, accompanied by a corresponding reduction in mechanical energy [see Figure 1 (b)]. Residual Stokes processes, instead, heat the mechanical resonator. The rates for Stokes () and anti–Stokes () processes determine the ultimate efficiency of the cooling process, such that in the absence of other sources of noise cooling is constrained by backaction noise, which sets the lower limit to mechanical excitations . The parameters and depend upon the fluctuations of the cavity light, which can be manipulated enclosing the cooling light in a feedback loop. The feedback operates measuring a generic field quadrature and using the detected signal to modulate the input amplitude quadrature , while the conjugate phase quadrature remains untouched. In particular, is modified according to the feedback relation
[TABLE]
where is the electronic feedback transfer function and and , defined in Supplemental Material SM , describe the response of the output field to the input amplitude and phase fluctuations respectively; i.e., in the absence of feedback the detected output field quadrature is , and additional noise terms not relevant to the discussion are omitted both in Eq. (1) and in the inline equation SM .
The corresponding mechanical scattering rates SM ,
[TABLE]
are proportional to the square of the optomechanical coupling strength , and are given by the superposition of two contributions. The first term is related to the standard sideband laser cooling, which can be expressed in terms of the susceptibility of a cavity with linewidth and detuning . The second term is instead determined by the feedback loop. The function describes the response of the cavity field amplitude to the input amplitude fluctuations, i.e. in the absence of feedback it can be expressed in terms of the input field as (once more, additional noise terms are omitted). It is important to note that the feedback term sums up coherently, and can be properly optimised to enhance the performance of sideband cooling. Specifically, Stokes processes can be fully suppressed, (and therefore the backaction limit is surpassed), when the cavity and feedback contributions interfere destructively and cancel each other, which is achieved setting the feedback gain value to . So far we have assumed perfect detection efficiency, meaning that all the light lost by the cavity is detected and employed in the loop. In practice, at finite detection efficiencies, Stokes processes cannot be fully suppressed. Nevertheless, also in realistic cases a strong reduction of is observed, and this approach can outperform the best up–to–date results obtained for systems operating at the quantum backaction limit, both in the optical Peterson2016Laser-Cooling-o and in the microwave Clark regime, as shown in Figure 1(c)–(f). These results correspond to situations in which thermal noise is so low that standard sideband cooling is essentially limited by backaction noise. In general, thermal fluctuations, characterised by the number of thermal excitations , compete with the effect of the cooling light to determine the stationary phonon occupancy , where and are the mechanical and optical damping rates, respectively. Hence, at high temperature aiming at barely suppressing Stokes processes becomes ineffective. However, in this regime, the effects of thermal noise can be strongly reduced by operating the feedback close to instability such that is increased to large values, at the expense of increasing the backaction limit .
We have tested this high temperature regime with a double–sided, –long symmetric cavity Karuza:2012fk ; Karuza2013aa , with a decay rate 20.15\text{,}\mathrm{kHz}. A $\mathrm{SiN}$ membrane is placed in the middle of the optical cavity [Thompson:2008uq ](#bib.bib28); [Karuza:2012fk ](#bib.bib26). It is a highly stressed circular membrane, with a diameter of $1.2\text{\,}\mathrm{mm}$, a thickness of $97\text{\,}\mathrm{nm}$, and negligible optical absorption [Serra2016Microfabricatio ](#bib.bib29). We focus on the fundamental mechanical mode, characterised by a resonance frequency $\omega_{\mathrm{m}}=2\pi\times$343.13\text{\,}\mathrm{kHz} and a decay rate 1.18\text{,}\mathrm{Hz}. The optomechanical coupling is $G=g_{0}\sqrt{2\,n_{c}}$, with $n_{c}$ the number of cavity photons and $g_{0}$, the single–photon coupling, tunable by translating the membrane within the cavity standing wave [SM ](#bib.bib25). Two beams, the probe (green lines) and the cooling beam (orange lines), are derived from a $1064\text{\,}\mathrm{nm}$ master laser (see Figure [2](#S0.F2)). The former, which is not part of the feedback loop, is used to lock the laser frequency to the cavity resonance, and to reveal the mechanical displacement by homodyne detection. The cooling beam, detuned from the relevant cavity resonance by $\Delta=2\pi\times$330\text{\,}\mathrm{kHz} is, instead, enclosed in the feedback loop. The amplitude quadrature (corresponding to ) of the transmitted (reflected) field is directly detected with a single photodiode and the resulting photocurrent, eventually filtered and amplified [in Figure 2(a) the filter is applied to the transmitted light], is fed back to the input field by amplitude modulating (AM) the acousto–optic modulator (AOM) SM .
We first measure the in–loop light properties by placing the membrane at a node of the cavity field to rule out the optomechanical interaction. The feedback loop is fully characterised by measuring the open–loop transfer function , which includes both the electronic and the optical response of the system [see Figure 2(b), top, and SM ]. The electronic part, , is generally complex due to the feedback delay–time , which, in our case, is . When the feedback loop is closed, the amplitude noise fluctuations are modified, as shown in Figure 2(b), bottom; the noise becomes frequency–dependent, with regions below (noise squashing) and above (noise anti–squashing) the noise level with no feedback Shapiro1987Theory-of-light ; Wiseman1999Squashed-states . The feedback–controlled cavity also shows a modified susceptibility in the anti–squashing regime, as can be verified by sending a weak classical seed field, larger than all noises, but too small to affect the mean cavity amplitude. In the regime of our system, and small delay time (so that a single anti-squashing resonance [see Fig. 2 (b)] contributes to the dynamics), and for frequencies close to the cavity resonance, the seed experiences an effective cavity susceptibility , with and , where is the normalised feedback gain, which is at the feedback stability threshold defined by , and the phase of the feedback response function at the detuning SM . Experimentally we determine by measuring the closed–loop transfer function for different feedback gains (see Figure 3). By increasing the gain the system approaches the feedback stability threshold, i.e. tends to 0, as shown in Figure 3(c)–(d). We were able to reach a minimum effective cavity linewidth 250\text{,}\mathrm{Hz} and a detuning $\Delta_{\mathrm{eff}}\approx 2\pi\times$342.5\text{\,}\mathrm{kHz}.
So far we have characterised the feedback system with and we have determined the properties of the cavity experienced by the resonator which do not depend on the optomechanical interaction (i.e. the values of and ). These measurement are sufficient to perfectly reproduce the exprimental cooling results reported below. The positive feedback regime (anti–squashing), which we focus on, enhances light amplitude noise. We show that driving an optomechanical cavity with the resulting in–loop field improves cooling by increasing the optical cooling rate. The membrane is now placed in a position in which 0.84\text{,}\mathrm{H}\mathrm{z} [SM ](#bib.bib25). Without feedback, a beam of $33\text{\,}\mathrm{\SIUnitSymbolMicro W}$ red detuned by $\Delta=2\pi\times$330\text{\,}\mathrm{kHz} [see Figure 4(a)] cools the membrane by dynamical backaction AspelmeyerRMP from room temperature to an effective temperature of . As the transmission feedback loop is closed and the gain is varied, the mechanical susceptibility, determined with the out-of-loop probe field, is shifted and broadened, as seen from Figure 4(a) and SM . The corresponding reduction of the effective mechanical energy reported in Figure 4(b) in terms of the number of mechanical excitations , and computed by numerical integration of the spectra SM , demonstrates an enhancement of the cooling rate, which settles the minimum effective temperature to 350\text{,}\mathrm{mK} for an optimal gain of $\mathcal{G}_{\mathrm{fb}}\sim 0.9$. Having fixed the optimal gain, we measured the effective mechanical energy as a function of the detuning [Figure [4](#S0.F4)(c)], reaching the minimum phonon number for the optimal bare detuning $\Delta^{\mathrm{opt}}=2\pi\times$329.4\text{\,}\mathrm{kHz}. This value is consistent with the one estimated by using the measured feedback phase margin at the detuning frequency, -0.59\text{,}\mathrm{rad}$$, and by setting the feedback gain at instability, , and the effective detuning at the optimal resolved sideband cooling condition , that is .
Our results demonstrate that the in–loop field fluctuations obtained in the counter–intuitive regime of positive feedback can be exploited for enhancing the cooling efficiency in an optomechanical system. In the regime of low thermal noise we find theoretically that our approach allows the backaction limit to be beaten by almost an order of magnitude, both in the optical and the microwave regime [see Figure 1(c)–(f)], as a result of the engineered intracavity field fluctuations, which contribute to the coherent cancellation of Stokes processes, and hence to the reduction of the backaction limit. This result is analogous to that discussed in Clark ; Asjad2016Suppression-of- , which makes use of squeezed light, but is achieved with a significantly simpler setup which does not require quantum nonlinearities. The foreseen dynamics should be observable including the feedback system in, for example, the experimental setup of Refs. Clark ; Peterson2016Laser-Cooling-o . This would require using homodyne detection, with a properly optimised phase of the detected quadrature, and sufficiently large detection efficiency. With our setup, which instead does not work at cryogenic temperature, we operate the feedback close to the instability and achieve an enhancement of the cooling rate of , with a corresponding reduction of the phonon number of (see Figure 4). In this limit the effectiveness of the feedback is associated with a reduction of the cavity linewidth, which increases the optomechanical cooperativity. The fact that the enhancement of the cooling rate is not reflected in an equal reduction of the number of mechanical excitations is due to the concomitant increase of the backaction limit in this high temperature regime, which prevents further cooling of the resonator SM . The generic technique that we have demonstrated can be adopted in a broad range of applications, whenever a system of interest is controlled with an electromagnetic field subject to a phase–sensitive measurement, in the classical as well as the quantum regime.
Acknowledgements.
We acknowledge the support of the European Union’s Horizon 2020 research and innovation program under grant agreement No 732894 (FET Proactive HOT).
I Theory
Here we introduce the general model at the basis of the findings reported in the Letter, and discuss additional complementary theoretical results valid in the low noise limit.
The system dynamics can be analysed in terms of quantum Langevin equations for the evolution of annihilation and creation operators of cavity photons and , and phononic excitations of the mechanical mode and . We assume the usual linearised regime of optomechanics, where the operators describe fluctuations around steady state average values Genes2008Ground-state-co_SM . It is therefore convenient to analyse it in Fourier space. The corresponding equations are
[TABLE]
where is the detuning between cavity resonance and the laser frequency, (and analogously for other creation and annihilation operators), is the phase shift of the cavity field with respect to the input due to the non-resonant driving, and is the environmental noise operator directly coupled to the mechanical resonator with rate , characterised by an average number of thermal excitations , such that . We have included several dissipation channels for the cavity, with corresponding vacuum noise operators , and , which are coupled to the system with rates , and respectively, and such that the total cavity decay rate is . This allows one to analyse different scenarios in which the feedback works by measuring either the reflected field (the feedback acts on the same output channel which is measured) or the transmitted one (detection and actuation are applied on different channels). This model describes, for example, a Fabry-Pérot cavity made of two mirrors with decay rates and respectively. Instead stands for additional internal losses.
The cavity output, either from the first or the second mirror, is detected and used to modulate the amplitude of the input through the first mirror, i.e. given the detected photocurrent (the specific form of which is given below), the input operator is
[TABLE]
where is the input with no feedback and is the feedback transfer function for which . This corresponds to a modulation of the amplitude quadrature (where is the input field amplitude with no feedback), while the input phase quadrature remains unaffected by the feedback. The output fields are given by the standard input-output relations
[TABLE]
where is the phase shift of the output from the first mirror with respect to the corresponding input. Specifically the feedback works by measuring (via homodyne detection) a field quadrature of one of the two outputs of the form
[TABLE]
where refers to the case with feedback in reflection and in transmission, respectively. Assuming a finite detection efficiency , the photocurrent is then given by
[TABLE]
where indicates additional vacuum noise due to non-ideal detection. Note that in the case of perfect detection efficiency reduces to the output quadrature .
Eqs. (I)–(5) form a system of linear equations for the output and the system operators, which can be solved to determine the system steady state.
I.1 Photocurrent
Eqs. (I)–(5) can be solved to determine an analytical expression for the feedback photocurrent in terms of the photocurrent with no feedback, which we indicate as . Due to the linearity of the system they are proportional to each other,
[TABLE]
with the proportionality factor measuring how much the light gets squashed (reduced fluctuations) or anti–squashed (enhanced fluctuations) under the effect of the feedback scheme. The function describes the response of the detected output quadrature to input amplitude fluctuations, namely , where the dots stand for additional terms proportional to other input noise operators. The explicit form of is
[TABLE]
where the values of the parameters , and depend on whether the feedback is based on the detection of the reflected field (output 0) or on the detection of the transmitted field (output 1): specifically, for the feedback in reflection , and , instead for the feedback in transmission , and . Furthermore, is the cavity susceptibility which for an empty cavity is given by . Correspondingly, the feedback photocurrent power spectrum, defined by the relation , is given by the square modulus of the squashing factor
[TABLE]
I.2 Cavity response to an additional seed: modified cavity susceptibility
In order to probe the response of the cavity under the effect of the feedback, one can include an additional tone in the modulation of the AOM with an amplitude much larger than the fluctuations, but in any case much smaller than the pump field. Here we focus on the scheme based on the detection of the transmitted field, in the resolved sideband limit, which is relevant to our experiment. The corresponding photocurrent spectrum at the seed frequency [] reveals how the cavity susceptibility is modified by the feedback loop. The response function takes the form
[TABLE]
In the limit of small cavity linewidth and for a relatively short delay–time in the feedback response , a single pole of this function close to the cavity resonance is relevant to the system dynamics. Particularly, in the case of a feedback system based on the detection of the transmitted field (relevant to our experiment) it can be approximated (for frequency close to the cavity resonance ) as
[TABLE]
The effective cavity linewidth and detuning are
[TABLE]
where is the complete open–loop transfer function, which is reported in Figure 2(b), top. It is convenient to express these relations in terms of a normalised gain factor
[TABLE]
which is defined so that it takes the value at the feedback stability threshold, i.e. when . Equations (11)–(12) can be rewritten as
[TABLE]
in agreement with the expressions reported in the Letter for , and where is the phase of the open–loop transfer function .
I.3 Cooling
Analytical expressions for the Stokes and anti–Stokes rate can finally be computed in the weak coupling limit (). They are proportional to the power spectrum of the cavity quadrature evaluated for an empty cavity and at the mechanical frequency. Specifically
[TABLE]
with . The explicit result for the spectrum is
[TABLE]
where and for the feedback based on the detection of the reflected field, while and for the one that measures the transmitted field. We have also introduced the function
[TABLE]
which accounts for the effect of feedback on the mechanical processes, and where , defined by the relation , describes the response of the cavity field quadrature to input amplitude modulations, such that with the dots indicating additional terms proportional to other noise operators. When all the light lost by the cavity is detected and employed in the feedback loop (that is and a single output channel is involved), Eq. (I.3) recovers Eq. (2) of the Letter. In the more general case of finite detection efficiency, an additional term appears in the scattering rates, which inhibits the possibility to fully suppress Stokes scattering. This implies that, in the low temperature limit, it is, in principle, more efficient to work in reflection with a one-sided cavity. In this case all the light lost by the cavity can, in principle, be detected and used to achieve optimal suppression of Stokes scattering.
Fig. 1 complements the theoretical findings of the Letter, obtained by solving the complete model defined by Eq. (I), in the limit of low thermal noise. It shows that, under realistic conditions, the scheme is sufficiently stable also against variations of other parameters of the system. Fig. 2 shows that light fluctuations do not have to be suppressed altogether to achieve optimal cooling. In other words, here the feedback is not used to suppress the field noise, instead fluctuations should be properly tailored and set to specific values in order to coherently suppress unwanted heating processes. Finally, Fig. 3 shows that, in the low temperature limit, the cooling time does not change significantly with respect to standard sideband cooling.
Resolved sideband limit, high temperature limit and feedback based on the transmitted field
Let us now analyse this result in the limit relevant to our experiment. In the resolved sideband limit the spectrum in Eq. (I.3), evaluated for the scheme based on the detection of the transmitted field operated close to the feedback stability threshold, can be expressed in terms of the effective susceptibility defined in Eq. (10). Correspondingly, the cooling dynamics can be mapped to standard sideband cooling in an optical cavity with linewidth , but starting from a larger effective temperature.
Specifically we find that, in the resolved sideband limit and for frequencies close to the optical detuning, ,
[TABLE]
where we have neglected the second term in the expression for which appears in the numerator of Eq. (18). Instead for frequencies we find
[TABLE]
where now we have neglected the first term in the expression for .
Correspondingly, when the cavity detuning is set at the mechanical frequency in order to optimize the anti-Stokes processes, we find that
[TABLE]
with
[TABLE]
and where we have neglected additional terms proportional to . In this limit the cooling rate is
[TABLE]
moreover, the parameter determines the new backaction limit given by that can be significantly larger than the standard one given instead by . It is useful to express the corresponding steady state phonon number as the one achieved by standard sideband cooling in a cavity with linewidth . In this picture we can interpret the enhanced backaction limit as an effective enhanced temperature according to the relation
[TABLE]
where the effective number of thermal excitations is
[TABLE]
We can use Eq. (24) to express as a function of the other measured quantities, namely the number of excitations of the cooled resonator at , the initial number of excitations at , and the optomechanical coupling strength. The latter can in turn be expressed in terms of the number of excitations to which the oscillator is cooled by standard sideband cooling (, corresponding to ) as . Thereby we find
[TABLE]
In particular, in our experiment we can estimate that the backaction limit has been increased from an equivalent temperature of nK (corresponding to ) to mK (corresponding to ). Similarly, we estimate that the effective temperature, defined in Eq. (25), has been enhanced by roughly K (corresponding to ).
We can also rewrite Eq. (24) in order to express how much the phonon number is reduced with respect to the standard sideband cooling result . We find
[TABLE]
When , this value can always be made smaller than . Specifically, the minimum is found for , and the corresponding minimum value is
[TABLE]
which is always strictly smaller than . In particular, in the limit of high temperature, for perfect detection efficiency, and for a symmetric cavity, the minimum number of excitations is
[TABLE]
II Experiment
A detailed experimental scheme is reported in Figure 4. The frequencies of a probe (blue line) and a cooling (red line) beam, derived from a master laser, are shifted by two acousto–optic modulators (AOMs) in a double passage configuration. The AOM on the probe beam, held on resonance with the cavity by means of a Pound–Drever–Hall locking scheme Black2001An-introduction_SM , is always driven at . The membrane displacement is revealed by detecting the phase of the reflected probe beam employing a balanced homodyne detector Yuen1983Noise-in-homody_SM . The orthogonally polarised probe and local oscillator (purple line) beams are combined and then split by two sets constituted of a waveplate and a polarising beam–splitter.
A detuning is imparted on the cooling beam by means of a commercial VCO, which is controlled by a phase–locked–loop (PLL), derived by demodulating the beating tone between the and order diffracted beams at the frequency of $$80\text{,}\mathrm{MHz} (the divisor 2 being due to double passage through the AOM). A feedback loop on the cooling field is implemented by driving the VCO amplitude modulation input (AM) with the amplified and filtered () electronic signal acquired by detecting the light intensity either transmitted or reflected by the cavity. Two sets of waveplates put in front of each cavity mirror allow one to split the transmitted cooling and probe beams with a high extinction ratio by exploiting orthogonal polarisations. The open–loop transfer functions of the feedback, i.e. the curves reported in the top of panel b) in Figure 2 of the Letter, are measured by closing the switch TG on the network analyser tracking generator, which provides a frequency swept tone to the VCO input, adding in turn a seed on the cooling beam; the electronic signal is analysed with the switch FB open. The closed–loop transfer function, that is the effective cavity response in Figure 3 of the Letter, is instead measured by closing the switch FB and analysing directly the photocurrent. The amplitude noise fluctuations, i.e. the curves reported in the bottom of Figure 2(b) of the Letter, are revealed by analysing directly the photocurrent with the switch TG open and FB closed. To calibrate the feedback gain , we increase the filter gain up to the loop instability, i.e. and then added commercial calibrated attenuators. Cavity and membrane are both embedded in a vacuum chamber operating at .
II.1 Cavity decay rate
The cavity decay rate was characterised by employing a ring–down technique, i.e. measuring the exponential decay of the light intensity leaking out from the cavity, as shown in Figure 5. Here the membrane is placed in a cavity field node to rule out the optomechanical coupling. The fitted
decay rate is 2\kappa=2\pi\times$$40.3\text{\,}\mathrm{kHz}. An independent measurement obtained by scanning the probe beam frequency and fitting the data with a lorentzian lineshape results in , in accordance with the time measurement. In general, the cavity decay rate depends on the membrane position along the cavity Serra2016aa_SM . For the optomechanical experiment reported in the Letter the membrane position determines a cavity decay rate 2\kappa=2\pi\times$$43\text{\,}\mathrm{kHz}.
II.2 Single–photon coupling calibration
The calibration of the single–photon optomechanical coupling is obtained by following the technique employed in Ref. Gorodetksy2010Determination-o_SM . An external calibration monotone with frequency near the mechanical one (\omega_{\mathrm{cal}}=2\pi\times$$340.8\text{\,}\mathrm{kHz}), is added to the phase modulation of the probe beam used for locking (\omega_{\mathrm{PDH}}=2\pi\times$$5.05\text{\,}\mathrm{MHz}) by means of a Pockels cell.
A typical homodyne result of the thermal noise of the fundamental mode of the circular membrane is shown in Figure 6. We identify two main contributions in the spectrum: the blue symbols are due to displacement fluctuations of the fundamental mechanical mode, while the red ones account for the calibration tone. The single–photon optomechanical coupling is estimated by comparing the area of the two contributions, by knowing the temperature, and by properly calibrating the Pockels cell modulation depth, . The modulation depth is independently calibrated by means of a heterodyne technique, showing a linear behaviour in the range 10–. The amplitude modulation of the calibration tone used for estimating , as in Figure 6, was . The single–photon optomechanical coupling amounts to g_{0}=2\pi\times$$0.84\text{\,}\mathrm{Hz}. The optomechanical coupling from the Letter is related to by the relation , where is the mean photon number in the cavity, with the input power of the cooling beam.
II.3 Circular membrane normal modes
For a circular membrane with a radius , the transverse deformation functions of normal modes, neglecting bending effects for a high–stress taut membrane, are a product of the radial and angular contributions ElmorePhysicsWave_SM
[TABLE]
where , , is the n–th Bessel function of the first kind, and the j–th zero of . The normal mode oscillates in time with eigenfrequency
[TABLE]
where is the sound velocity in the material, is the surface tension and is the mass density. Apart from the case , all the eigenfrequencies are doubly degenerate: the two phases are nonzero and arbitrary, satisfying the condition , which guarantees the orthogonality of the modes.
The effective mass is another important property which differs for circular membranes as compared to the square ones Serra2016aa_SM . Generally speaking, the mechanical oscillator displacement should be addressed with a three–dimensional vector. However, it is usual in optomechanics to map the vibrational motion in a scalar quantity, . In doing this, the normalisation of the normal mode functions can be arbitrarily chosen, leading to an ambiguity in the definition of the mass. Nevertheless, independently of the normalisation adopted, the potential energy stored in the oscillator must be . This relation establishes a way to define an effective mass. For a circular membrane we have
[TABLE]
where is the physical mass of the resonator. For , we have .
The characterisation of normal modes of the circular membrane used in the experiment, with radius and thickness , is made by putting it in the middle of the optical cavity and monitoring, with a balanced homodyne detector, the phase of the reflected probe beam. Due to its low optical power and to the resonant condition, dynamical backaction from this beam can safely be neglected.
In Figure 7(a) a broadband spectrum is reported. The black trace is the detection shot–noise. In the light–blue trace, several peaks are present and they can be recognised as the normal modes [labeled by (n,j)] of the circular membrane put in the middle of the cavity. To characterise the fundamental mode (0,1), which is used throughout the work, we zoomed in, as shown in b, and fitted the resulting lineshape, estimating a resonance frequency 343.13\text{,}\mathrm{kHz} and decay rate $\gamma_{\mathrm{m}}\simeq 2\pi\times$1.18\text{\,}\mathrm{Hz}. The leftmost narrow feature in Figure 7(b) is the calibration tone used for estimating .
II.4 Decomposition of the open–loop response
By exploiting orthogonal polarisations, the transmitted cooling and probe beams are split with high extinction ratio. The total open–loop transfer function is measured by collecting the light of the cooling beam with a single InGaAs photodiode and converting the photocurrent into a voltage signal by means of a transimpedance amplifier. The network analysis is performed on the signal after a high–pass electronic filter, a PD controller, with a corner frequency of .
In Figure 8, black and red solid lines represent, respectively, the magnitude and phase of the complete open–loop transfer functions. In order to properly characterise the feedback, the measured open–loop response is decomposed in the cavity and the electronic transfer function. The cavity transfer function (dashed lines) inferred from the measured decay rate (see II.1) and the detuning, is subtracted from the complete open–loop response, leaving the electronic filter transfer function (dotted lines) used for obtaining the theoretical effective temperature. is estimated from the slope of the electronic feedback phase to be .
II.5 Cooling
As visible from the spectra in Figure 4(a) of the Letter, the mechanical susceptibility is broadened and shifted as the feedback loop is closed in transmission and the gain is increased. In Figure 9 we quantify these effects by plotting explicitly the effective mechanical decay rate and resonance shift , inferred from the best fits of the said spectra.
The effective mechanical energy [cf. Figure 4(b) and (c) of the Letter], i.e. the effective temperature, is also inferred from the noise displacement spectra. Firstly, the noise displacement fluctuations of the fundamental mode of the mechanical oscillator, at room temperature, are recorded blocking the cooling beam and turning off the feedback. Since the probe beam is weak and resonant, we assume that there are no radiation pressure effects. Knowing the single–photon coupling , and assuming an equilibrium temperature of and an effective mass of , the spectra are calibrated in displacement units. Once the radiation–pressure interaction and the feedback are restored, assuming the validity of the equipartition theorem Genes2008Ground-state-co_SM , the effective temperature is inferred from the displacement variance, evaluated by a numerical integration of the calibrated measured spectra, after shot–noise subtraction (which is always 10 dB below each spectrum). The temperature is reduced by a factor given by the ratio of the estimated variances and the one obtained without radiation–pressure interaction and feedback.
References
- (1)
C. Genes, D. Vitali, P. Tombesi, S. Gigan, and M. Aspelmeyer.
Phys. Rev. A 77, 033804 (2008).
- (2)
J. B. Clark, F. Lecocq, R. W. Simmonds, J. Aumentado, and J. D. Teufel.
Nature 541, 191–195 (2017).
- (3)
R. W. Peterson et al.
Phys. Rev. Lett. 116, 063601 (2016).
- (4)
T. P. Purdy, P. L. Yu, R. W. Peterson, N. S. Kampel, and C. A. Regal,
Phys. Rev. X 3, 031012 (2013).
- (5)
F. Mallet et al.
Phys. Rev. Lett. 106, 220502 (2011).
- (6)
E. D. Black,
Am. J. Phys. 69, 79–87 (2001).
- (7)
H. P. Yuen, and V. W. S. Chan,
Opt. Lett. 8, 177–179 (1983).
- (8)
E. Serra et al.
AIP Adv. 6, 065004 (2016).
- (9)
M. L. Gorodetksy, A. Schliesser, G. Anetsberger, S. Deleglise, and T. J. Kippenberg,
Opt. Express 18, 23236–23246 (2010).
- (10)
W. C. Elmore and M. A. Heald,
Physics of waves.
(Dover, 1985).
The reference list from the paper itself. Each links out to its DOI / PubMed record.
- 1(1) H. M. Wiseman and G. J. Milburn, Quantum Measurement and Control (Cambridge University Press, Cambridge, 2010)
- 2(2) C. Sayrin et al. , Nature 477 , 73 (2011).
- 3(3) D. Risté et al. , Nature 502 , 350 (2013).
- 4(4) D. J. Wilson et al. , Nature 524 , 325 (2015).
- 5(5) M. S. Taubman et al. , J. Opt. Soc. Am. B 12 , 1792 (1995).
- 6(6) H. M. Wiseman, J. Opt. B: Quantum Semiclass. Opt. 1 , 459 (1999).
- 7(7) J. H. Shapiro et al. , J. Opt. Soc. Am. B 4 , 1604 (1987).
- 8(8) H. M. Wiseman, Phys. Rev. Lett. 81 , 3840 (1998).