An Optical Catalog of Galaxy Clusters Obtained from an Adaptive Matched Filter Finder Applied to SDSS DR9 Data
Panchajanya Banerjee, Thad Szabo, Elena Pierpaoli, Gerardo Franco,, Maria Ortiz, Aris Oramas, Brianna Tornello

TL;DR
This paper introduces a new galaxy cluster catalog from SDSS DR9 using an adaptive matched filter, providing detailed properties and comparing its performance with existing catalogs like redMaPPer and WHL.
Contribution
The paper presents a novel galaxy cluster catalog with improved matching accuracy and comprehensive analysis, extending previous catalogs with a larger, more reliable sample.
Findings
97% match with Abell clusters for the richest clusters
Higher number of matches with X-ray clusters at high luminosity
Wider sample than redMaPPer, fewer objects than WHL
Abstract
We present a new galaxy cluster catalog constructed from SDSS DR9 using an Adaptive Matched Filter technique. Our main catalog has 46,479 galaxy clusters with richness in the redshift range 0.045 0.641 in 11,500 of the sky. Angular position, richness, core and virial radii and redshift estimates for these clusters, as well as their error analysis are provided. We also provide an extended version with a lower richness cut, containing 79,368 clusters. This version, in addition to the clusters in the main catalog, also contains those clusters (with richness ) which have a one-to-one match in the DR8 catalog developed by Wen et al (WHL). We obtain probabilities for cluster membership for each galaxy and implement several procedures for the identification and removal of false cluster detections. We compare our catalog with other…
Click any figure to enlarge with its caption.
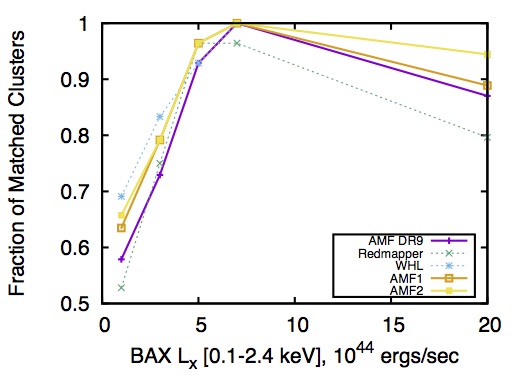 Figure 1
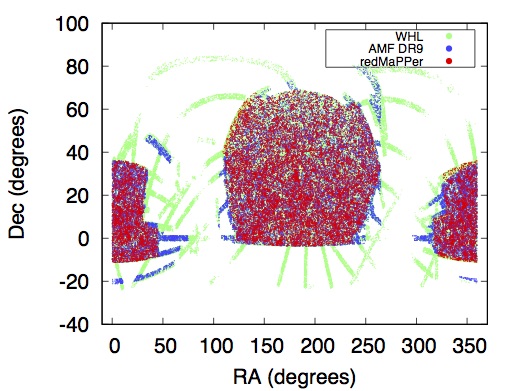 Figure 2
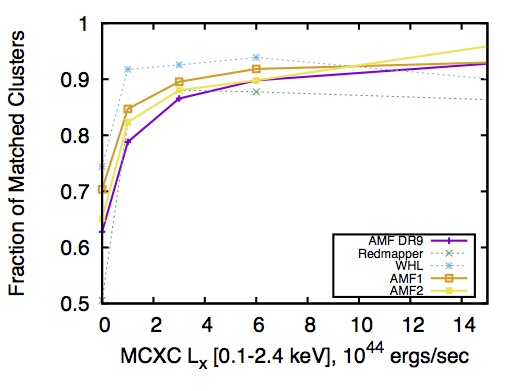 Figure 3
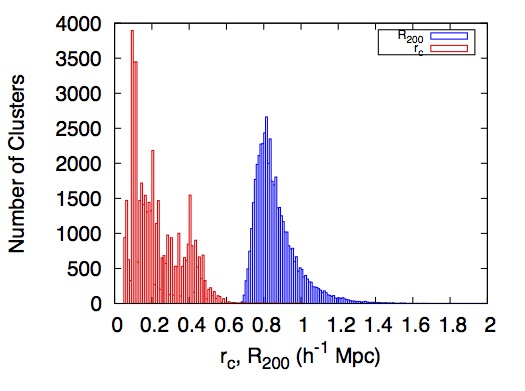 Figure 4
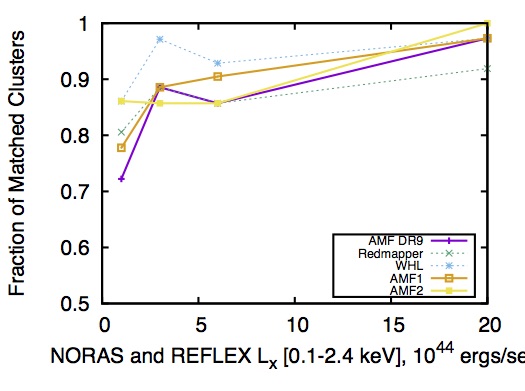 Figure 5
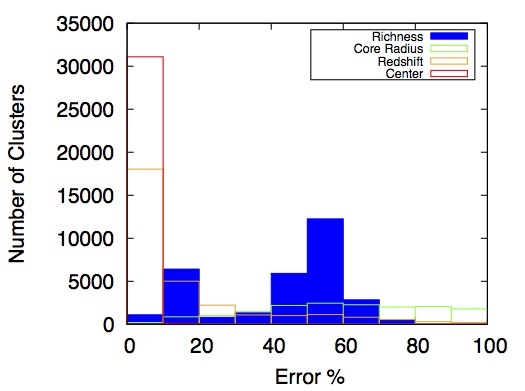 Figure 6
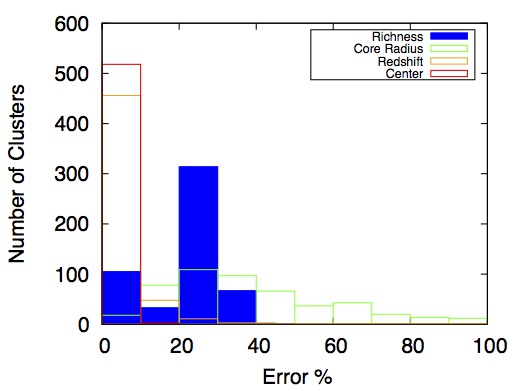 Figure 7
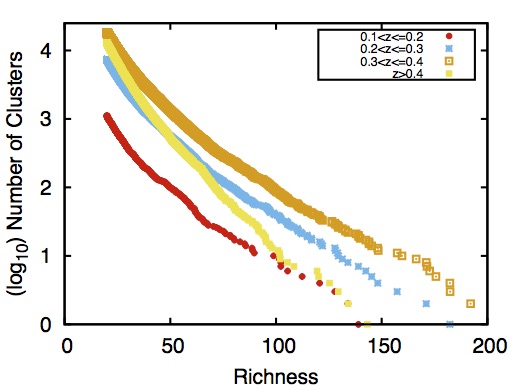 Figure 8
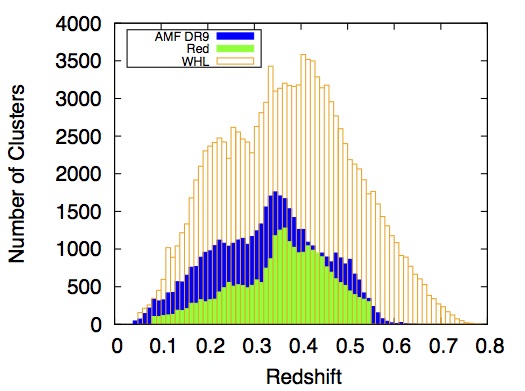 Figure 9
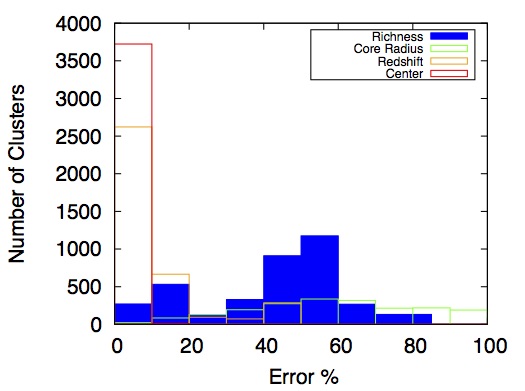 Figure 10
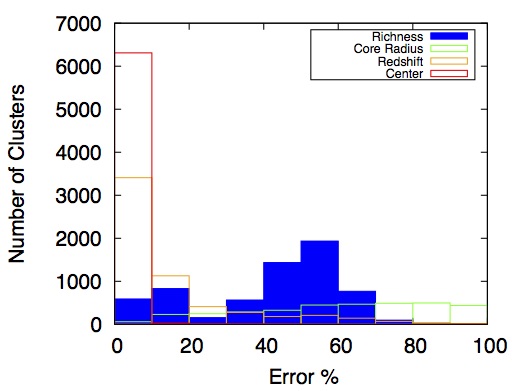 Figure 11
| Richness | Clusters | AMF DR9 | redMaPPer | WHL |
|---|---|---|---|---|
| 0 | 410 | 0.68 | 0.55 | 0.86 |
| 1 | 742 | 0.81 | 0.74 | 0.91 |
| 2 | 195 | 0.92 | 0.84 | 0.95 |
| 3 | 38 | 0.97 | 0.90 | 0.97 |
| AMF DR9 Clusters | redMaPPer Misses | WHL Matches | ||
|---|---|---|---|---|
| 20 | 40 | 39004 | 0.70 | 0.54 |
| 40 | 60 | 4431 | 0.26 | 0.72 |
| 60 | 80 | 920 | 0.21 | 0.77 |
| 80 | 100 | 282 | 0.21 | 0.69 |
| 100 | 168 | 0.20 | 0.71 | |
| AMF DR9 Clusters | redMaPPer Misses | WHL Matches | ||
|---|---|---|---|---|
| 0.1 | 0.2 | 6325 | 0.72 | 0.68 |
| 0.2 | 0.3 | 10831 | 0.66 | 0.64 |
| 0.3 | 0.4 | 15179 | 0.60 | 0.50 |
| 0.4 | 0.5 | 9597 | 0.59 | 0.47 |
| 0.5 | 0.55 | 2873 | 0.71 | 0.37 |
| BAX Clusters | AMF DR9 | redMaPPer | WHL | AMF1 | AMF2 | ||
|---|---|---|---|---|---|---|---|
| 2 | 178 | 0.58 | 0.53 | 0.69 | 0.64 | 0.65 | |
| 2 | 4 | 48 | 0.73 | 0.75 | 0.83 | 0.79 | 0.79 |
| 4 | 6 | 28 | 0.93 | 0.96 | 0.93 | 0.96 | 0.96 |
| 6 | 8 | 28 | 1.0 | 0.96 | 1.0 | 1.0 | 1.0 |
| 8 | 54 | 0.87 | 0.80 | 0.94 | 0.89 | 0.94 |
| MCXC Clusters | AMF DR9 | redMaPPer | WHL | AMF1 | AMF2 | ||
|---|---|---|---|---|---|---|---|
| 1 | 172 | 0.63 | 0.51 | 0.74 | 0.70 | 0.65 | |
| 1 | 2 | 85 | 0.79 | 0.82 | 0.92 | 0.85 | 0.82 |
| 2 | 4 | 67 | 0.87 | 0.88 | 0.93 | 0.90 | 0.88 |
| 4 | 8 | 49 | 0.90 | 0.88 | 0.94 | 0.92 | 0.90 |
| 8 | 29 | 0.93 | 0.86 | 0.90 | 0.93 | 0.97 |
| X-ray Clusters | AMF DR9 | redMaPPer | WHL | AMF1 | AMF2 | ||
|---|---|---|---|---|---|---|---|
| 2 | 36 | 0.72 | 0.81 | 0.86 | 0.78 | 0.86 | |
| 2 | 4 | 35 | 0.89 | 089 | 0.97 | 0.89 | 0.86 |
| 4 | 8 | 42 | 0.86 | 0.86 | 0.93 | 0.91 | 0.86 |
| 8 | 37 | 0.97 | 0.92 | 0.97 | 0.97 | 1.0 |
| Column Number | Format | Description |
|---|---|---|
| 1 | I5 | AMF DR9 cluster number |
| 2 | F10.4 | Right Ascension of the cluster |
| 3 | F10.4 | Declination of the cluster |
| 4 | F8.4 | Redshift estimate |
| 5 | F10.4 | Likelihood |
| 6 | F10.4 | Richness () |
| 7 | F7.3 | |
| 8 | F7.3 | Core radius for the cluster in Mpc |
| 9 | F8.3 | Concentration, |
| 10 | F9.4 | Stripe.Richness |
| 11 | I5 | BAX Matching Cluster ID (if present) |
| 12 | I5 | MCXC Matching Cluster ID (if present) |
| 13 | I5 | redMaPPer Matching Cluster ID (if present) |
| 14 | I5 | WHL Matching Cluster ID (if present) |
| Column Number | Format | Description |
|---|---|---|
| 1 | I5 | AMF DR9 cluster number |
| 2 | F10.4 | Richness () error (68 ) |
| 3 | F10.4 | error (95 ) |
| 4 | F10.4 | Core radius () error (68 ) |
| 5 | F10.4 | error (95 ) |
| 6 | F10.4 | Redshift () error (68) |
| 7 | F10.3 | error (95) |
| 8 | F10.3 | Error in centering (68 ) |
| 9 | F10.3 | Error in centering (95 ) |
Peer Reviews
No public reviews on file for this paper yet. If you reviewed it on a platform where reviews are public (OpenReview, ICLR, NeurIPS, ICML), you can paste yours below so the community can read it here.
Videos
No videos yet. Explain this paper in a talk, walkthrough, or lecture? Add one.
An Optical Catalog of Galaxy Clusters Obtained
from an Adaptive Matched Filter Finder Applied to SDSS DR9 Data
P. Banerjee11affiliation: Department of Physics and Astronomy, University of Southern California, Los Angeles, CA 90089, USA , T. Szabo22affiliation: Department of Physics and Astronomy, Cerritos College, Norwalk, CA 90650, USA , E. Pierpaoli11affiliation: Department of Physics and Astronomy, University of Southern California, Los Angeles, CA 90089, USA , G. Franco22affiliation: Department of Physics and Astronomy, Cerritos College, Norwalk, CA 90650, USA , M. Ortiz22affiliation: Department of Physics and Astronomy, Cerritos College, Norwalk, CA 90650, USA , A. Oramas22affiliation: Department of Physics and Astronomy, Cerritos College, Norwalk, CA 90650, USA , B. Tornello22affiliation: Department of Physics and Astronomy, Cerritos College, Norwalk, CA 90650, USA
[email protected],[email protected],[email protected]
Abstract
We present a new galaxy cluster catalog constructed from the Sloan Digital Sky Survey Data Release 9 (SDSS DR9) using an Adaptive Matched Filter (AMF) technique. Our catalog has 46,479 galaxy clusters with richness in the redshift range 0.045 0.641 in 11,500 of the sky. Angular position, richness, core and virial radii and redshift estimates for these clusters, as well as their error analysis, are provided as part of this catalog. In addition to the main version of the catalog, we also provide an extended version with a lower richness cut, containing 79,368 clusters. This version, in addition to the clusters in the main catalog, also contains those clusters (with richness ) which have a one-to-one match in the DR8 catalog developed by Wen et al (WHL). We obtain probabilities for cluster membership for each galaxy and implement several procedures for the identification and removal of false cluster detections.
We cross-correlate the main AMF DR9 catalog with a number of cluster catalogs in different wavebands (Optical, X–ray). We compare our catalog with other SDSS-based ones such as the redMaPPer (26,350 clusters) and the Wen et al. (WHL) (132,684 clusters) in the same area of the sky and in the overlapping redshift range. We match 97 of the richest Abell clusters (Richness group 3), the same as WHL, while redMaPPer matches of these clusters. Considering AMF DR9 richness bins, redMaPPer does not have one-to-one matches for 70 of our lowest richness clusters (), while WHL matches 54 of these missed clusters (not present in redMaPPer). redMaPPer consistently does not possess one-to-one matches for 20 AMF DR9 clusters with , while WHL matches 70 of these missed clusters on average. For comparisons with X-ray clusters, we match the AMF catalog with BAX, MCXC and a combined catalog from NORAS and REFLEX. We consistently obtain a greater number of one-to-one matches for X–ray clusters across higher luminosity bins ( ergs/sec) than redMaPPer while WHL matches the most clusters overall. For the most luminous clusters (), our catalog performs equivalently to WHL. This new catalog provides a wider sample than redMaPPer while retaining many fewer objects than WHL.
cosmology: galaxies, clusters, optical, catalogs
\extrafloats
100
1 Introduction
Galaxy clusters are the most massive gravitationally bound systems in the universe and their study has been pursued for various different reasons, both astrophysical and cosmological. Cluster surveys allow the determination of clustering properties of density fields providing information on the large scale structure (Bahcall, 1988; Postman et al., 1992; Coleman et al., 1992; Carlberg et al., 1996; Bahcall et al., 1997; Seljak, 2000; Reid et al., 2010; Guo et al., 2013). Due to their high galaxy density, implying a higher probability of galaxy collisions, clusters are excellent laboratories for studying galaxy evolution (Dressler, 1980; Butcher & Oemler, 1978; Garilli et al., 1999; Goto et al., 2003a, b; Mei et al., 2009; Maughan et al., 2012). They can act as gravitational lenses, providing a way to constrain cluster masses, as well as to study distant galaxies (Blain et al., 1999; Smail et al., 2002; Metcalfe et al., 2003; Santos et al., 2004; Sheldon et al., 2009; Okabe & Smith, 2015). The galaxy cluster mass function allows for the determination of several cosmological parameters, including the mass density, , and the matter power spectrum normalization (Pierpaoli, et al., 2001; Reiprich & Böhringer, 2002; Seljak, 2002; Pierpaoli, et al., 2003; Dahle, 2006; Pedersen & Dahle, 2007; Rines et al., 2007; Rozo et al., 2009; Angrick et al., 2011; Sereno et al., 2015) as well as the dark energy equation of state (Allen et al., 2008; Mantz et al., 2014) and neutrino masses (Wang et al., 2005; Carbone at al., 2012). Galaxy clusters have also been used to constrain dark matter annihilation (Ackerman et al., 2010; Huang et al., 2012; Ackerman et al., 2015) Cluster abundances and their internal structure have been used as tests for modified gravity (Rapetti et al., 2008; Diaferio & Ostorero, 2009; Jennings et al., 2012). More recently, the measurement of gravitational redshifts from cluster surveys has provided additional opportunities for verifying GR and probing other gravitational physics (Wojtak et al., 2011; Wegner, 2011; Kaiser, 2013; Croft, 2013; Jimeno et al., 2015).
Galaxy clusters are observed in several bands, such as optical, radio, microwave and X–ray. In the optical, they are observed through the over-density of galaxies or their color properties, and in the radio and X–ray through the emission of their intra–cluster medium (ICM). Optical observations were the first ones to be performed (Abell, 1958) but X–ray surveys of recent years have discovered hundreds of clusters up to high redshifts () (Ebeling et al., 2010; Piffaretti et al., 2011; Mehrtens et al., 2012; Mirkazemi et al., 2015). Radio surveys aiming at detecting galaxy clusters through their Sunyaev–Zel’dovich (SZ) effect have been undertaken as well (Williamson et al., 2011; Novaes et al., 2012; Ade at al., 2015; Bleem et al., 2015). The X–ray and the optical bands trace different physical components, so they represent very distinct probes of the state of the cluster. The variety of detection methods and cross-verification between them will provide a better understanding of cluster physics and the selection function and biases for each detection method, therefore improving the precision in deriving cosmological constraints.
Here, we focus on observations of clusters in the optical band in the Sloan Digital Sky Survey (SDSS). We present a catalog of galaxy clusters constructed from an adaptive matched filter (AMF) technique (Dong et al., 2008; Postman et al., 1996; Kepner et al., 1999; Kim et al., 2002) and following up on the work of Szabo et al. (Szabo et al., 2011, hereafter, AMF DR6). SDSS provides data for luminosities in five bands (u-g-r-i-z) and redshift estimates for millions of galaxies in about one-third of the sky. Using this data, it is possible for automated algorithms, such as the AMF, to compile cluster catalogs objectively by identifying over-densities in galaxy distributions.
We present the catalog extracted from the SDSS DR9 by applying the AMF technique tailored to handle SDSS data (Dong et al., 2008). We compare this catalog (hereafter AMF DR9) with other optical catalogs such as the Abell catalog (Abell, 1958), the redMaPPer by Rykoff, et al, compiled from SDSS DR8, and with the catalog extracted from the SDSS DR8 by Wen et al. (2011) (hereafter, WHL). Our finder uses over-densities as a starting point for determining the presence of a cluster. However, unlike many other cluster determination methods (Murphy et al., 2012; Rykoff et al., 2014a), it does not make a priori assumptions about the color or number of bright galaxies. Thus, our technique has the potential to detect clusters which do not have a bright red galaxy. We obtain probability estimates for cluster membership for each galaxy and implement several procedures to minimize spurious objects and false cluster detections.
In section 2, we discuss the specifics and nature of the SDSS data used. We present the AMF cluster finder and details on its application to the SDSS data in section 3. In section 3 we also outline the process used to remove duplicate and spurious clusters. Section 4 discusses the characterization of the galaxy cluster catalog. In section 5 we compare our catalog with the ones compiled by WHL, and redMaPPer, as well as with different X-ray cluster catalogs. Section 6 is dedicated to the conclusions.
A standard CDM cosmology is assumed, with = 0.3 and = 0.7, and H0 = 100 h km s*-1* Mpc*-1*.
2 SDSS Data
The Sloan Digital Sky Survey III (Eisenstein et al., 2011) follows the SDSS-I and II projects (York et al., 2000). SDSS-III uses the 2.5 m wide-field Sloan Foundation Telescope (Gunn et al., 2006) at Apache Point Observatory (APO), and fiber-fed multi-object spectrographs to carry out multiple surveys. Their aim is to study dark energy (Baryon Oscillation Sky Survey, BOSS), to assist in the search for extrasolar planets (MARVELS), and to study the structure of the Milky Way Galaxy(SEGUE-2 and APOGEE) (Ahn et al., 2012). The SDSS is a five-band CCD imaging survey of in the North Galactic Cap and the Southern Galactic Cap. The imaging survey is carried out in drift-scan mode (opening the camera shutter for long periods to image a continuous strip of the sky). The survey provides data in five SDSS filters, which are labelled u-g-r-i-z and range in wavelength from 355.1 nm to 893.1 nm, and in magnitude limits from 22.0 to 20.5 respectively (with 95 completeness for point sources). The main galaxy sample has a median redshift of z = 0.1, and there are spectra for luminous red galaxies up to z = 0.7.
In this paper we construct a cluster catalog for Data Release 9 (DR9) of the Sloan Digital Sky Survey and have used the photometric redshifts provided by Carliles et al. obtained by the Random Forest method. In the AMF DR6 catalog (Szabo et al., 2011), the authors had chosen to use the photometric redshifts determined by (Oyaizu et al., 2008) using a Neural Network method. When compared to other catalogs, a representative sample of preliminary DR9 clusters showed less scatter in redshift when using Random Forest photometric redshifts compared to other photometric redshift estimates.
This ninth data release (DR9) of the SDSS project includes 535,995 new galaxy spectra (median z0.52), along with the data presented in previous data releases (Ahn et al., 2012). The SDSS DR9 fixed a systematic error in the astrometry in the imaging catalogs in DR8 (Aihara et al., 2011).
All galaxy measurements were extracted via an SQL query from the Galaxy view on the CasJobs DR9 database using the FLAGS as described in Appendix A to obtain a complete sample of galaxies with good photometry to minimize falsely flagged galaxies. The data is then placed in stripes according to the geometry of the survey. The current catalog is constructed using -band data information only, it being the band where the sensitivity of the SDSS CCDs are the highest, in addition to having a well understood luminosity function for for the r-band.
3 The Cluster Finder
3.1 Method
We use an Adaptive Matched Filter cluster finder method (Postman et al., 1996; Kawasaki et al., 1998; Kepner et al., 1999; Kim et al., 2002; Dong et al., 2008; Szabo et al., 2011). The idea behind the AMF is the matching of the data from the optical galaxy survey (SDSS) with a filter based on a model of the distribution of galaxies (Kepner et al., 1999). In our finder, we use the same methodology as that used to construct the AMF DR6 catalog (Szabo et al., 2011). The AMF technique does not explicitly use the red sequence to select clusters (Annis et al., 2002; Miller et al., 2005; Koester et al., 2007; Rykoff et al., 2014a). So this technique is not restricted only to old, red E/S0 galaxies as in color-based cluster finding methods, and can theoretically detect clusters of any type in color.
A cluster radial surface density profile, a galaxy luminosity function, and redshift information are used to construct filters in position, magnitude, and redshift space, from which a cluster likelihood map is generated. We assume an NFW density profile and a Gaussian model for photometric redshift uncertainties for filters in position and redshift respectively. For the magnitude filter, we adopt a luminosity profile described by a central galaxy plus a standard Schechter luminosity function with a characteristic luminosity (Schechter, 1976). Cluster and field galaxy luminosity functions are not modeled separately. The existence of brightest cluster galaxies (BCGs) near the cluster centers is incorporated into the cluster galaxy luminosity model as a component separate from the main Schechter function for satellites. The BCG luminosity is assumed to follow a single power law with an exponent of 0.22 with cluster richness and we take the width of the Gaussian to be 0.56 mag. We have updated the coefficient for the evolution of absolute magnitude of BCGs with respect to cluster richness. An exponent of 0.22 and a gaussian width of 0.56 was found to be a better fit to the data, as compared to the previous iteration of the AMF finder (Szabo et al., 2011), with its values of 0.26 and 0.44 respectively.
The peaks in the likelihood map are where the matches between the survey data and the cluster filters are optimized and thus correspond to candidate cluster centers. The algorithm provides the best-fit estimates of cluster properties including redshift, radius and richness. The likelihood of each galaxy belonging to a particular cluster (and thus a method of membership assessment) is also provided.
The parameters of the new cluster (redshift , core radius and richness ) are varied in order to maximize the increase in likelihood. The cluster radius is the distance from the central galaxy where the over-density of galaxies is 200 times the critical density . We assume that the average galaxy density is representative of the mean mass density (Jenkins et al., 2001). The richness is the total luminosity within in terms of , where brightens with redshift. (Loveday et al., 1992; Lilly et al., 1995; Nagamine et al., 2001; Blanton et al., 2003; Loveday, 2004; Baldry et al., 2005; Ilbert et al., 2005; Faber, 2007; Bouwens et al., 2015). The richness is related to the number galaxy counts within a cluster.
The actual center of mass for a galaxy cluster should not necessarily be located on a galaxy, especially given how dark matter comprises most of the mass within a cluster. Therefore, all initially identified clusters with are re-centered. During the re-centering process, we relax the hypothesis that clusters are centered on a galaxy. The center positions and the characterizations of the clusters are refined, and the likelihoods for each cluster are re-evaluated by varying the new hypothetical center. Of the original clusters, are found to have their centers displaced by 10 kpc
The presented catalog contains 46,479 clusters with 20 over an area of 11,500 deg2.
subsectionCatalog Refinements
The original cluster catalog, compiled using the methodology mentioned above, contained 54,277 galaxy clusters from the SDSS DR9 data. In the original version of the catalog, there were several instances of clusters lying on the fringes of stripes, or whose footprint showed considerable star interference. There were also instances of one galaxy being assigned to more than one cluster. In this section, we describe the work done to remove these clusters.
3.1.1 Cut-off Clusters
A ‘cut-off’ cluster is classified as a cluster with an irregular shape, considerably deviated from circularity in 2-dimensions, possibly cut-off by the edge of a stripe or showing star interference. We wrote a cluster cut-off code to be sensitive to the shape of the cluster. Eventually through the individual inspection of cluster footprints, we established a deviation from circularity as a viable criterion for eliminating a cluster. The finder showed unreliable performance for this difference from circularity, producing false clusters, or clusters whose richnesses were unreasonably large. Some allowance for discrepancies (up to 16) is necessary due to the granular nature of the data sample. This criterion was relaxed slightly with redshift (taking into account the decrease in cluster angular size for clusters and the reduction in visible galaxies due to magnitude limitations at higher z) to 20 for clusters with z 0.5. There were 2407 clusters which were removed using this method.
3.1.2 Probability of Membership Estimates
The finder code itself prevents the detection of the same cluster within a stripe, but we ensure that multiple detections across different stripes are eliminated. If a galaxy has a high probability of being in one cluster, but a low probability to belong to another cluster, it is sorted into the former cluster. If a set of galaxies have a substantially high probability of belonging to two clusters, it is probably the same cluster. The 48 cutoff for this ’high’ probability was determined by creating a list of clusters that belonged to adjacent stripes and whose centers were separated by less than 0.1 degrees and were within 0.05 of each other in redshift. The galaxy probabilities for these clusters were analyzed for a trend that would provide a threshold for galaxies that belonged to both clusters. A list of 6264 duplicates were provided, and the lower richness cluster was slated for removal in each case.
Of the 8671 clusters selected through these criteria, 807 were selected for removal by both methods. There is a possible issue of the shared galaxy criterion removing a low richness cluster in a match, than the cut-off criterion removing the higher richness one. The list of clusters to cull was examined for these cases, and 66 clusters that were originally removed by this overlap were then restored, using the lower richness, non-cut-off cluster.
With the above steps followed, we reduced the AMF DR9 catalog from 54,277 to 46,479 clusters.
4 The AMF Catalog
We present the AMF DR9 catalog of galaxy clusters.
This section presents the main properties of the clusters in AMF DR9 such as the richness , redshift and core radius , along with the distributions of these quantities for the catalog. The associated error-ranges are also presented.
We provide a description of the deliverables and the data retrieval procedure in the Appendix.Table 7 provides a list of the columns, descriptions and formatting for the catalog.
4.1 Characteristics
The position of the clusters in the sky is represented in fig. 1, for the three major optical catalogs considered in the paper.
The distribution of cluster density per deg2 varies from stripe to stripe, with a variation of 2.7-3.9 for stripes in the Northern Galactic Cap and a variation of 3.6-4.9 for stripes in the Southern Galactic Cap. The density variations are most likely due to large scale structure and the survey depth (Peacock et al., 2001).
The minimum of the included clusters is 20, while the maximum richness is 219.36. The core radius varies from 0.059 to 1.015 Mpc. The redshift range of our catalog is between 0.045 and 0.641.
The distribution of our clusters in richness for different redshift bins is shown in Fig. 2.
The ratio of high richness objects over low richness ones decreases for increasing redshift, which is reasonable, because the catalog is likely not complete for . Therefore, the drop in the number of very rich clusters compared to the low richness ones may be due to limitations of the finder.
Fig 3 shows the redshift distribution (in the same region of the sky) of the major optical catalogs used for comparison in this paper (See Section 5).
Histograms of the core radius and R200 are presented in Fig. 4.
4.2 Error Determination
The AMF finder provides the maximum likelihood values for and and for the angular position of the cluster center. We use the likelihood determination procedure to find errors in these parameters as follows. The likelihood for each cluster was recomputed on a finer grid, considering galaxies within 2 and 3 of the cluster center. Errors for each quantity are found by exploring the likelihood surface in two of the parameters, while keeping the others fixed. The lowest value of error percentages from the various permutations was retained. For example, errors in richness were found by fixing the values and the angular positions of cluster centers while varying and z values. The other likelihood surface variations (varying , with cluster center positions and fixed, and varying cluster center positions, while keeping and fixed) resulted in higher error percentages.
We look for the extrema of the parameters which give a difference in likelihood from the maximum value and then determine the boundaries of the 68, 90 and 95 confidence regions. Errors for individual clusters are reported in the catalog, and include the mean errors for the 68 and 95 confidence intervals for each quantity. Using the set of errors generated, we plot the frequency distributions versus one of the defining characteristics of the catalog (z, etc.).
Figs 5 - 8 show histograms of the error percentages for the 68 C.L; for each of the four quantities considered (richness, core radius, redshift and angular position). The different plots analyze subsamples of the highest/lowest richness and redshift bins.
The error in richness is seen to increase as richness decreases, which seems viable as the addition or subtraction of one galaxy creates a larger percentage difference in smaller clusters. Typical errors range from around 50 for lower richness clusters () to 20-26 for the highest richness clusters ( 100). Errors in decrease with increasing (Not shown here). This is an expected trend as the average for clusters in the published catalog increases with richness.
The core radius is found to be poorly constrained. Previous studies have indicated that an NFW profile fit for optical clusters tends to have a large error in (Navarro, Frenk, and White, 1997; Di Cintio et al., 2014; Sereno et al., 2016). We also assume clusters are virialized but the finder is sensitive to any over-density. The error in is smallest for the richest clusters. There is no clear trend in errors for redshift, but the errors (at a 68 confidence level) decrease with increasing core radius. The high percentage errors in core radius most likely are due to the fact that there are not enough galaxies in clusters to accurately map the assumed NFW profile.
The error percentages in redshift are low and decrease steadily as a function of richness. There is a slight decreasing trend in the error percentages as we go to higher redshift clusters. A similar trend is seen for increasing core-radii. The errors in angular positions of the cluster centers are also found to be uniformly low, which implies a stable centering.
5 Comparisons with Other Catalogs
We check for one-to-one clusters in the AMF catalog with clusters from other catalogs by searching within a given radius and redshift from each AMF cluster center. We adopt a search radius of 1.5 Mpc (which is about twice the minimum value of in our catalog) while we allow for a maximum redshift difference of 0.05, which is about twice the typical error in redshift for our catalog. In the rare cases when there is more than one match between AMF DR9 and the other catalog (usually multiple clusters in the other catalog matching one AMF cluster), we retain the matching cluster with the highest optical richness/luminosity. We also take into account the individual cluster errors, in and z and determine the number of one-to-one matches in each bin for luminosity or redshift. In addition to this, we check for matches with the redMaPPer and WHL optical catalogs. For comparisons with redMaPPer and WHL, we use the standard matching conditions mentioned for the AMF DR9 catalog. The various labels for the one-to-one matches with our catalog are:
- •
AMF DR9: We use the main AMF DR9 catalog for finding one-to-one matches, allowing a search radius of 1.5 Mpc, and a maximum redshift difference of 0.05. AMF DR9 has 44,805 clusters in the redshift range [0.1,0.55].
- •
AMF1: In addition to the main catalog, we use clusters with a minimum of 10 as opposed to 20 for the published catalog. However, we retain only those lower richness clusters that also have one-to-one matches in the WHL catalog under the standard matching conditions (see AMF DR9 above). We allow a maximum redshift difference of 0.05. This extended version of the catalog contains 79,368 clusters overall, and 75,819 clusters in the redshift range [0.1,0.55]. We present this version with the caveat that we have not run the extensive refinement with regards to cluster selection as we have done with the final presented version of the AMF DR9 catalog.
- •
AMF2: We match with main AMF DR9 catalog but we take three times the individual error in of each cluster (that is, we expand the angular radius of the cluster by 3 times the percentage error in ), also using 3 times the redshift error for the same cluster while matching.
5.1 A summary of the catalogs used for comparison
5.1.1 Optical Catalogs
Abell The Abell catalog is divided into Richness Groups, ranging from 0-5, in increasing order of number of galaxies within a cluster. In the area considered (see 5.2.1), there are 1385 Abell clusters in Richness Groups 0-3.
redMaPPer The redMaPPer is a red-sequence cluster finder (Rykoff et al., 2014a). The finder identifies 26350 clusters in 10,000 of data acquired from SDSS DR8 in the range z . The richness is defined as the sum of the membership probabilities over all galaxies within a scale-radius . In the redshift range [0.1,0.55], redMaPPer has 26,143 clusters.
WHL The WHL cluster catalog (Wen et al., 2011) uses the photometric redshifts of galaxies from the Sloan Digital Sky Survey III (DR8) to identify 132,684 clusters in the redshift range of z . The clusters are identified using a friends-of-friends algorithm (Botzler et al., 2004). The cluster richness is defined as , where is the evolved characteristic luminosity of galaxies in the r-band, and is the total r-band luminosity within . In the redshift range [0.1,0.55], WHL has 116,308 clusters.
5.1.2 X–ray Catalogs
We use the following X–ray Catalogs as a basis for comparisons between the different optical catalogs.
BAX We use data from the multi-wavelength X–ray Clusters Database (BAX) (Sadat et al., 2004) as updated on February 11, 2011. The BAX database contains 1714 clusters in total in the redshift range z . In the area considered (see 5.3) and in z [0.1,0.55], there are 454 BAX clusters.
MCXC The meta-catalogue of X-ray detected clusters of galaxies (MCXC) (Piffaretti et al., 2011). The MCXC is based on publicly available ROSAT All Sky Survey-based (NORAS, REFLEX, BCS, SGP, NEP, MACS, and CIZA) and serendipitous (160SD, 400SD, SHARC,WARPS, and EMSS) cluster catalogues. The MCXC database contains 1744 clusters in total in the redshift range z . In the area considered (see 5.3) and in z [0.1,0.55], there are 402 MCXC clusters.
NORAS REFLEX The NORAS and REFLEX survey catalogs (Böhringer et al., 2000, 2004) describe a statistically complete flux-limited sample (0.1-2.4 keV) of galaxy clusters from the ROSAT-All Sky Survey in the Northern and Southern Galactic caps respectively. We use a combined cluster sample from the 2 catalogs, totaling 825 clusters, of which 150 clusters lie in the area considered (see 5.3) and in z [0.1,0.55].
5.2 Matches between AMF DR9 and other optical catalogs
5.2.1 Matches with Abell clusters
For matches with the Abell catalog, we bin in Abell Richness Groups and implement an areacut which overlaps the area coverages of the AMF DR9, redMaPPer and WHL catalogs. We divide the footprint into three segments and check for one-to-one matches between the aforementioned optical catalogs and the Abell clusters in the following RA and Dec ranges:
RA (0,30), Dec (-10,30) 2. 2.
RA (130,245), Dec (-3,70) 3. 3.
RA (320,36), Dec (-5,30)
Table 1 show the relative numbers (matching fractions) of one-to-one matches between the Abell catalog and the other optical cluster catalogs, for various Abell Richness Groups.
We check for one-to-one cluster matches with the Abell cluster catalog, with a matching rate for the richest Abell clusters (Richness Group 3). The Abell clusters, especially the richest ones, are well-established galaxy clusters and it is reasonable that the AMF DR9 has a high rate of one-to-one matches with these clusters. These are the brightest clusters in the sky, visually identifiable without the help of algorithms, so even with the caveat of not possessing redshift estimates for these clusters, we expect most of these clusters to be identified in any optical cluster catalog. AMF DR9 finds as many one-to-one Abell matches for Richness Group 3 as WHL, while consistently matching a higher cluster fraction than redMaPPer across all Abell Richness Groups. For this comparison, the number of clusters in AMF, redMaPPer and WHL are 44,805, 26,143, and 116,308 respectively.
5.2.2 Matches with redMaPPer and WHL
We examine, in the same area coverage, and in the same overlapping redshift range z [0.1,0.55], how many AMF clusters (in richness bins) do not posses one-to-one matches in redMaPPer and whether these missed AMF clusters have one-on-one matches in WHL under the same matching conditions. Table 2 shows these comparisons. Table 3 displays the same comparison but for AMF DR9 redshift bins. From these tables it is evident that among the clusters present in the AMF DR9 catalog (with no one-to-one matches with redMaPPer), a large fraction ( for AMF clusters with ) is matched by the other optical catalog considered (WHL). In the redshift range z [0.3,0.5] redMaPPer misses of the AMF DR9 clusters considered, while, of these clusters without a one-to-one match in redMaPPer, WHL matches .
5.3 Matches with X–ray catalogs
The AMF DR9 and other optical catalogs are compared to various X–ray catalogs (BAX, MCXC and a combination of the NORAS and REFLEX catalogs) in order to test the luminosity completeness of the optical catalogs. For matches, we bin in X–ray luminosity and implement an areacut which overlaps the area coverages of the AMF DR9, redMaPPer and WHL catalogs. We divide the footprint into three segments and check for one-to-one matches between the aforementioned optical catalogs and the X–ray clusters in the following RA and Dec ranges:
RA (0,30), Dec (-10,35) 2. 2.
RA (120,245), Dec (-3,60) 3. 3.
RA (320,36), Dec (-10,30)
We compare the catalogs within the overlapping redshift z [0.1,0.55]. We ensure that each bin considered has at least 20 clusters, to minimize the chance of statistical anomalies. Tables 4, 5 and 6 provide the matching fractions for X–ray luminosity bins with the various optical catalogs considered. The completeness plots for luminosity are shown in Figs 9 - 11.
We consistently obtain a greater number of one-to-one matches for X–ray clusters across higher luminosity bins () than redMaPPer while WHL matches the most clusters overall. For the most luminous clusters (), our catalog performs equivalently to WHL. WHL identifies fainter objects as clusters (it has a lower richness cut), and has many more clusters as a result. redMaPPer also contains fewer clusters per unit volume than the other optical catalogs considered (Rykoff et al., 2014b), so it is to be expected that WHL seems more ’complete’ for X–ray clusters. WHL also has a lower richness cut () for clusters so it matches a higher number of lower luminosity X–ray clusters compared to AMF DR9 and redMaPPer. When we match with the extended AMF catalog (AMF1), we see a marked improvement in number of X–ray cluster matches for X–ray clusters, while implementing a matching with and z errors (AMF2) results in more matches for higher luminosity X–ray clusters (). The matching fractions for X–ray clusters with are more than or equal to that from WHL. For these comparisons, the number of clusters in AMF, redMaPPer and WHL are 44,805, 26,143 and 116,308 respectively.
An investigation of the high luminosity X–ray clusters does not reveal a clear trend in clusters without a one-to-one optical match. Investigating the X–ray cluster center coordinates on the SDSS DR9 Skyserver, we usually find a bright object (typically a star with r-band mag 10) within 2 arc minutes. In some cases, we match the missed X–ray cluster with the AMF DR9 catalog if we relax the original redshift matching criterion (). This leads us to believe that our finder might be triggered by very bright objects nearby, identifying a cluster with the same galactic coordinates but with a lower value of z. The reasons why other optical catalogs (redMaPPer and WHL) do not match these luminous X–ray clusters merit further investigation. We test the reasonable assertion that the increased number of one-to-one matches after including the extra clusters for AMF1 are just random variations. The extended AMF catalog adds 32,889 clusters (with a corresponding WHL cluster) to the main AMF DR9 catalog, so we generate 10 random catalogs with 32,889 clusters each (with the RA and Dec randomized) with the same redshift as the added clusters. We then compare the numbers of one-to-one matches between these randomly generated catalogs and the actual added clusters. We find that the randomly generated catalogs uniformly match less X–ray clusters than the added clusters to the extended catalog. On average, the randomly generated clusters match of the extra clusters for X–ray clusters with , and of the extra AMF clusters for X–ray clusters with .
6 Conclusions
In this paper we present a new optical catalog of 46,479 galaxy clusters with richness extracted from the SDSS DR9. The catalog extends from z=0.045 to 0.641 on an area of 11,500 deg2. The catalog was constructed using a maximum likelihood technique based on a matched filter approach. This allows for the simultaneous determination of richness , core radius , redshift, with associated errors. The technique does not rely on the red sequence for cluster detection, potentially allowing for the detection of galaxy clusters that do not possess a central luminous red galaxy. In addition to the main version of the catalog (AMF DR9), we also provide a second extended version with a lower richness cut. This version, in addition to the main catalog, also contains those clusters (with richness ) which have a one-to-one match in the DR8 catalog developed by Wen et al (WHL). This extended version of the catalog contains 79,368 clusters. Details for retrieval of the catalog data are provided in Appendix B.
We cross-correlate the main AMF DR9 catalog with a number of cluster catalogs in different wavebands (Optical, X–ray). We compare our catalog with other SDSS-based ones such as the redMaPPer catalog (26,350 clusters) and the Wen et al. (WHL) catalog (132,684 clusters) in the same area of the sky and in the overlapping redshift range. We match 97 of the richest Abell clusters (Richness group 3), the same as WHL, while redMaPPer matches of these clusters. Considering AMF DR9 richness bins, redMaPPer does not have one-to-one matches for 70 of our lowest richness clusters (), while WHL matches 54 of these missed clusters (not present in redMaPPer). redMaPPer consistently does not possess one-to-one matches for 20 AMF DR9 clusters with , while WHL matches 70 of these missed clusters on average. In the redshift range z [0.3,0.5] redMaPPer misses of the AMF DR9 clusters considered, while, of these clusters without a one-to-one match in redMaPPer, WHL matches .
Optical catalogs differ in their data selection methodologies, construction of photometric redshift estimates as well as the cluster identification criteria, but we compare AMF DR9, redMaPPer and WHL across overlapping redshift ranges in the same area of the sky. For the comparisons, the AMF DR9, redMaPPer and WHL have 26,143, 44,805 and 116,308 clusters respectively. We consistently obtain a greater number of one-to-one matches for X–ray clusters across higher luminosity bins () than redMaPPer while WHL matches the most clusters overall. For the most luminous clusters (), our catalog performs equivalently to WHL. When we match with the extended AMF catalog, we see a marked improvement in number of X–ray cluster matches for X–ray clusters, while implementing a matching with and z errors results in more matches for higher luminosity X–ray clusters (). The matching fractions for X–ray clusters are more than or equal to that from WHL.
The AMF DR9 is a new optical cluster catalog with multiple checks in place across several stages, from data selection to cluster finding, to ensure no objects are falsely flagged as clusters and with fairly stringent criteria for identifying an object as a cluster, thus ensuring the reliability of the parameters provided.
Acknowledgments
T.S., G.F., A.O., M.O., and B.T. acknowledge support from Department Of Education grant P031C110164-15. EP thanks the Aspen Center for Physics for their hospitality during the preparation of this work. PB was partially supported by the WiSE major support for faculty, awarded to EP. Funding for the Sloan Digital Sky Survey (SDSS) has been provided by the Alfred P. Sloan Foundation, the Participating Institutions, the National Aeronautics and Space Administration, the National Science Foundation, the U.S. Department of Energy, the Japanese Monbukagakusho, and the Max Planck Society. The SDSS Web site is http://www.sdss.org/. The SDSS is managed by the Astrophysical Research Consortium (ARC) for the Participating Institutions.
Appendix A Appendix: Photometric Flags for the SDSS Galaxy Sample
The following flags were set in our CAS Jobs queries to the SDSS database in order to ensure that our data sample had good photometry.
select g.objid as id_no, g.ra as ra, g.dec as dec, isnull(z.z,-9999) as z,
isnull(z.zerr,-9999) as zerr,
isnull(zrf.z,-9999) as zrf, isnull(zrf.zerr,-9999) as zrferr,
isnull(s.z,-9999) as sz, isnull(s.zerr,-9999) as szerr,
isnull(s.scienceprimary,-99) as sci_prim,
g.dered_u as mu, g.dered_g as mg, g.dered_r as mr,
g.dered_i as mi, g.dered_z as mz,
g.err_u as muerr, g.err_g as mgerr, g.err_r as mrerr,
g.err_i as mierr, g.err_z as mzerr
into mydb.ra150_200_dec_35_45_jul2014
from galaxy g
left outer join photoz as z on z.objid=g.objid
left outer join photozrf as zrf on zrf.objid=g.objid
left outer join specobj as s on s.bestobjid=g.objid
where ((case when (g.type_g=3) then 1 else 0 end) +
(case when (g.type_r=3) then 1 else 0 end) +
(case when (g.type_i=3) then 1 else 0 end)) > 1
AND ((case when (g.dered_g < 11) then 1 else 0 end)
-
(case when (g.dered_r < 11) then 1 else 0 end)
-
(case when (g.dered_i < 11) then 1 else 0 end)) < 1
AND g.ra >= 150.0 AND g.ra < 200.0
AND g.dec >= 35.0 AND g.dec < 45.0
AND ((g.flags_r & 0x10000000) != 0)
AND ((g.flags_r & 0x8100000c00a0) = 0)
AND (((g.flags_r & 0x400000000000) = 0) or (g.psfmagerr_r0.2))
AND (((g.flags_r & 0x100000000000) = 0) or (g.flags_r & 0x1000) = 0)
AND abs(g.dered_g - g.dered_r) < 4.5
AND abs(g.dered_r - g.dered_i) < 4.5
AND g.dered_r<=22.0
From the SDSS DR9 database we select objects of type Galaxy, with clean photometry, using the flags recommended by SDSS. We also specify that the object cannot be saturated, or have its center very close to a saturated pixel. The apparent magnitude in the r-band is 22. Further exclusions are for objects with an apparent (extinction-corrected) magnitude 11 (no galaxy at z=0.05 or more distant appears this bright in the sky), and for objects that have color profiles that do not match a galaxy. There should not be a difference of 4.5 magnitudes (a factor of 63 in brightness) between adjacent bands for any population of stars.
Appendix B Appendix: Retrieving The Catalog
Table 7 lists the columns in the main AMF DR9 catalog and the extended catalog,
In addition to these, we also provide a table of the error estimates for , , z and for each cluster for the catalog, where available. These columns are listed below in Table 8.
We also provide a list of probabilities for each galaxy belonging to a cluster. All data are provided in the ASCII format. The catalogs will be uploaded to a website once the paper is accepted for publication.
The reference list from the paper itself. Each links out to its DOI / PubMed record.
- 1Abazajian et al. (2009) Abazajian, K. N., Adelman-Mc Carthy, J. K., Agüeros, M. A., et al. 2009, Ap JS, 182, 543
- 2Abell (1958) Abell, G. O. 1958, Ap JS, 3, 211
- 3Ackerman et al. (2010) Ackermann, M., et al. 2010, J. Cosmology Astropart. Phys, 2010.05, 025.
- 4Ackerman et al. (2015) Ackermann, M., et al. 2015, Ap J, 812.2, 159.
- 5Adelman-Mc Carthy, et al. (2008) Adelman-Mc Carthy, J. K., Agüeros, M. A., Allam, S. S., et al. 2008, Ap JS, 175, 297
- 6Adelman-Mc Carthy, et al. (2007) Adelman-Mc Carthy, J. K., Agüeros, M. A., Allam, S. S., et al. 2007, Ap JS, 172, 634
- 7Ahn et al. (2012) Ahn, C.P., Alexandroff, R., Allende, C.P., et al. 2012, Ap JS, 203, 21
- 8Aihara et al. (2011) Aihara, H., Prieto, C.A., An, D., et al. 2011, Ap JS, 195, 26