Spatial gene drives and pushed genetic waves
Hidenori Tanaka, Howard A. Stone, David R. Nelson

TL;DR
This paper models the spatial spread of gene drives in populations, identifying conditions for safe deployment and methods to contain or stop their spread using reaction-diffusion equations and threshold-based safeguards.
Contribution
It introduces a reaction-diffusion model for gene drives, defining a narrow parameter range for safe spread, and proposes strategies for containment using sensitized drives and barriers.
Findings
Gene drives require specific selective disadvantage range (0.5<s<0.697) for safe spread.
A threshold 'critical propagule' prevents accidental spread of gene drives.
Sensitizing drives and barriers can effectively halt spatial spread.
Abstract
Gene drives have the potential to rapidly replace a harmful wild-type allele with a gene drive allele engineered to have desired functionalities. However, an accidental or premature release of a gene drive construct to the natural environment could damage an ecosystem irreversibly. Thus, it is important to understand the spatiotemporal consequences of the super-Mendelian population genetics prior to potential applications. Here, we employ a reaction-diffusion model for sexually reproducing diploid organisms to study how a locally introduced gene drive allele spreads to replace the wild-type allele, even though it possesses a selective disadvantage . Using methods developed by N. Barton and collaborators, we show that socially responsible gene drives require , a rather narrow range. In this "pushed wave" regime, the spatial spreading of gene drives will be initiated…
Click any figure to enlarge with its caption.
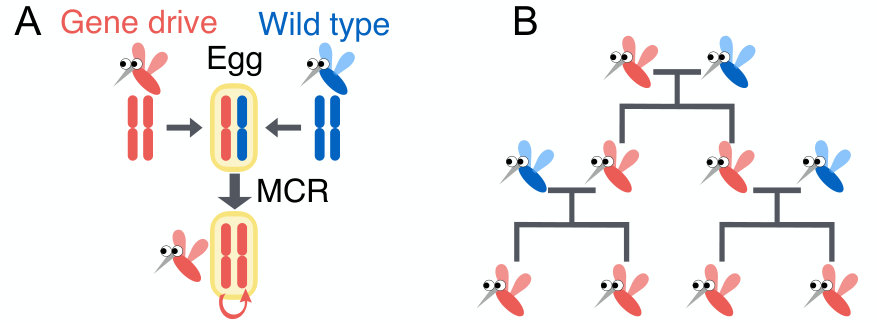 Figure 1
 Figure 2
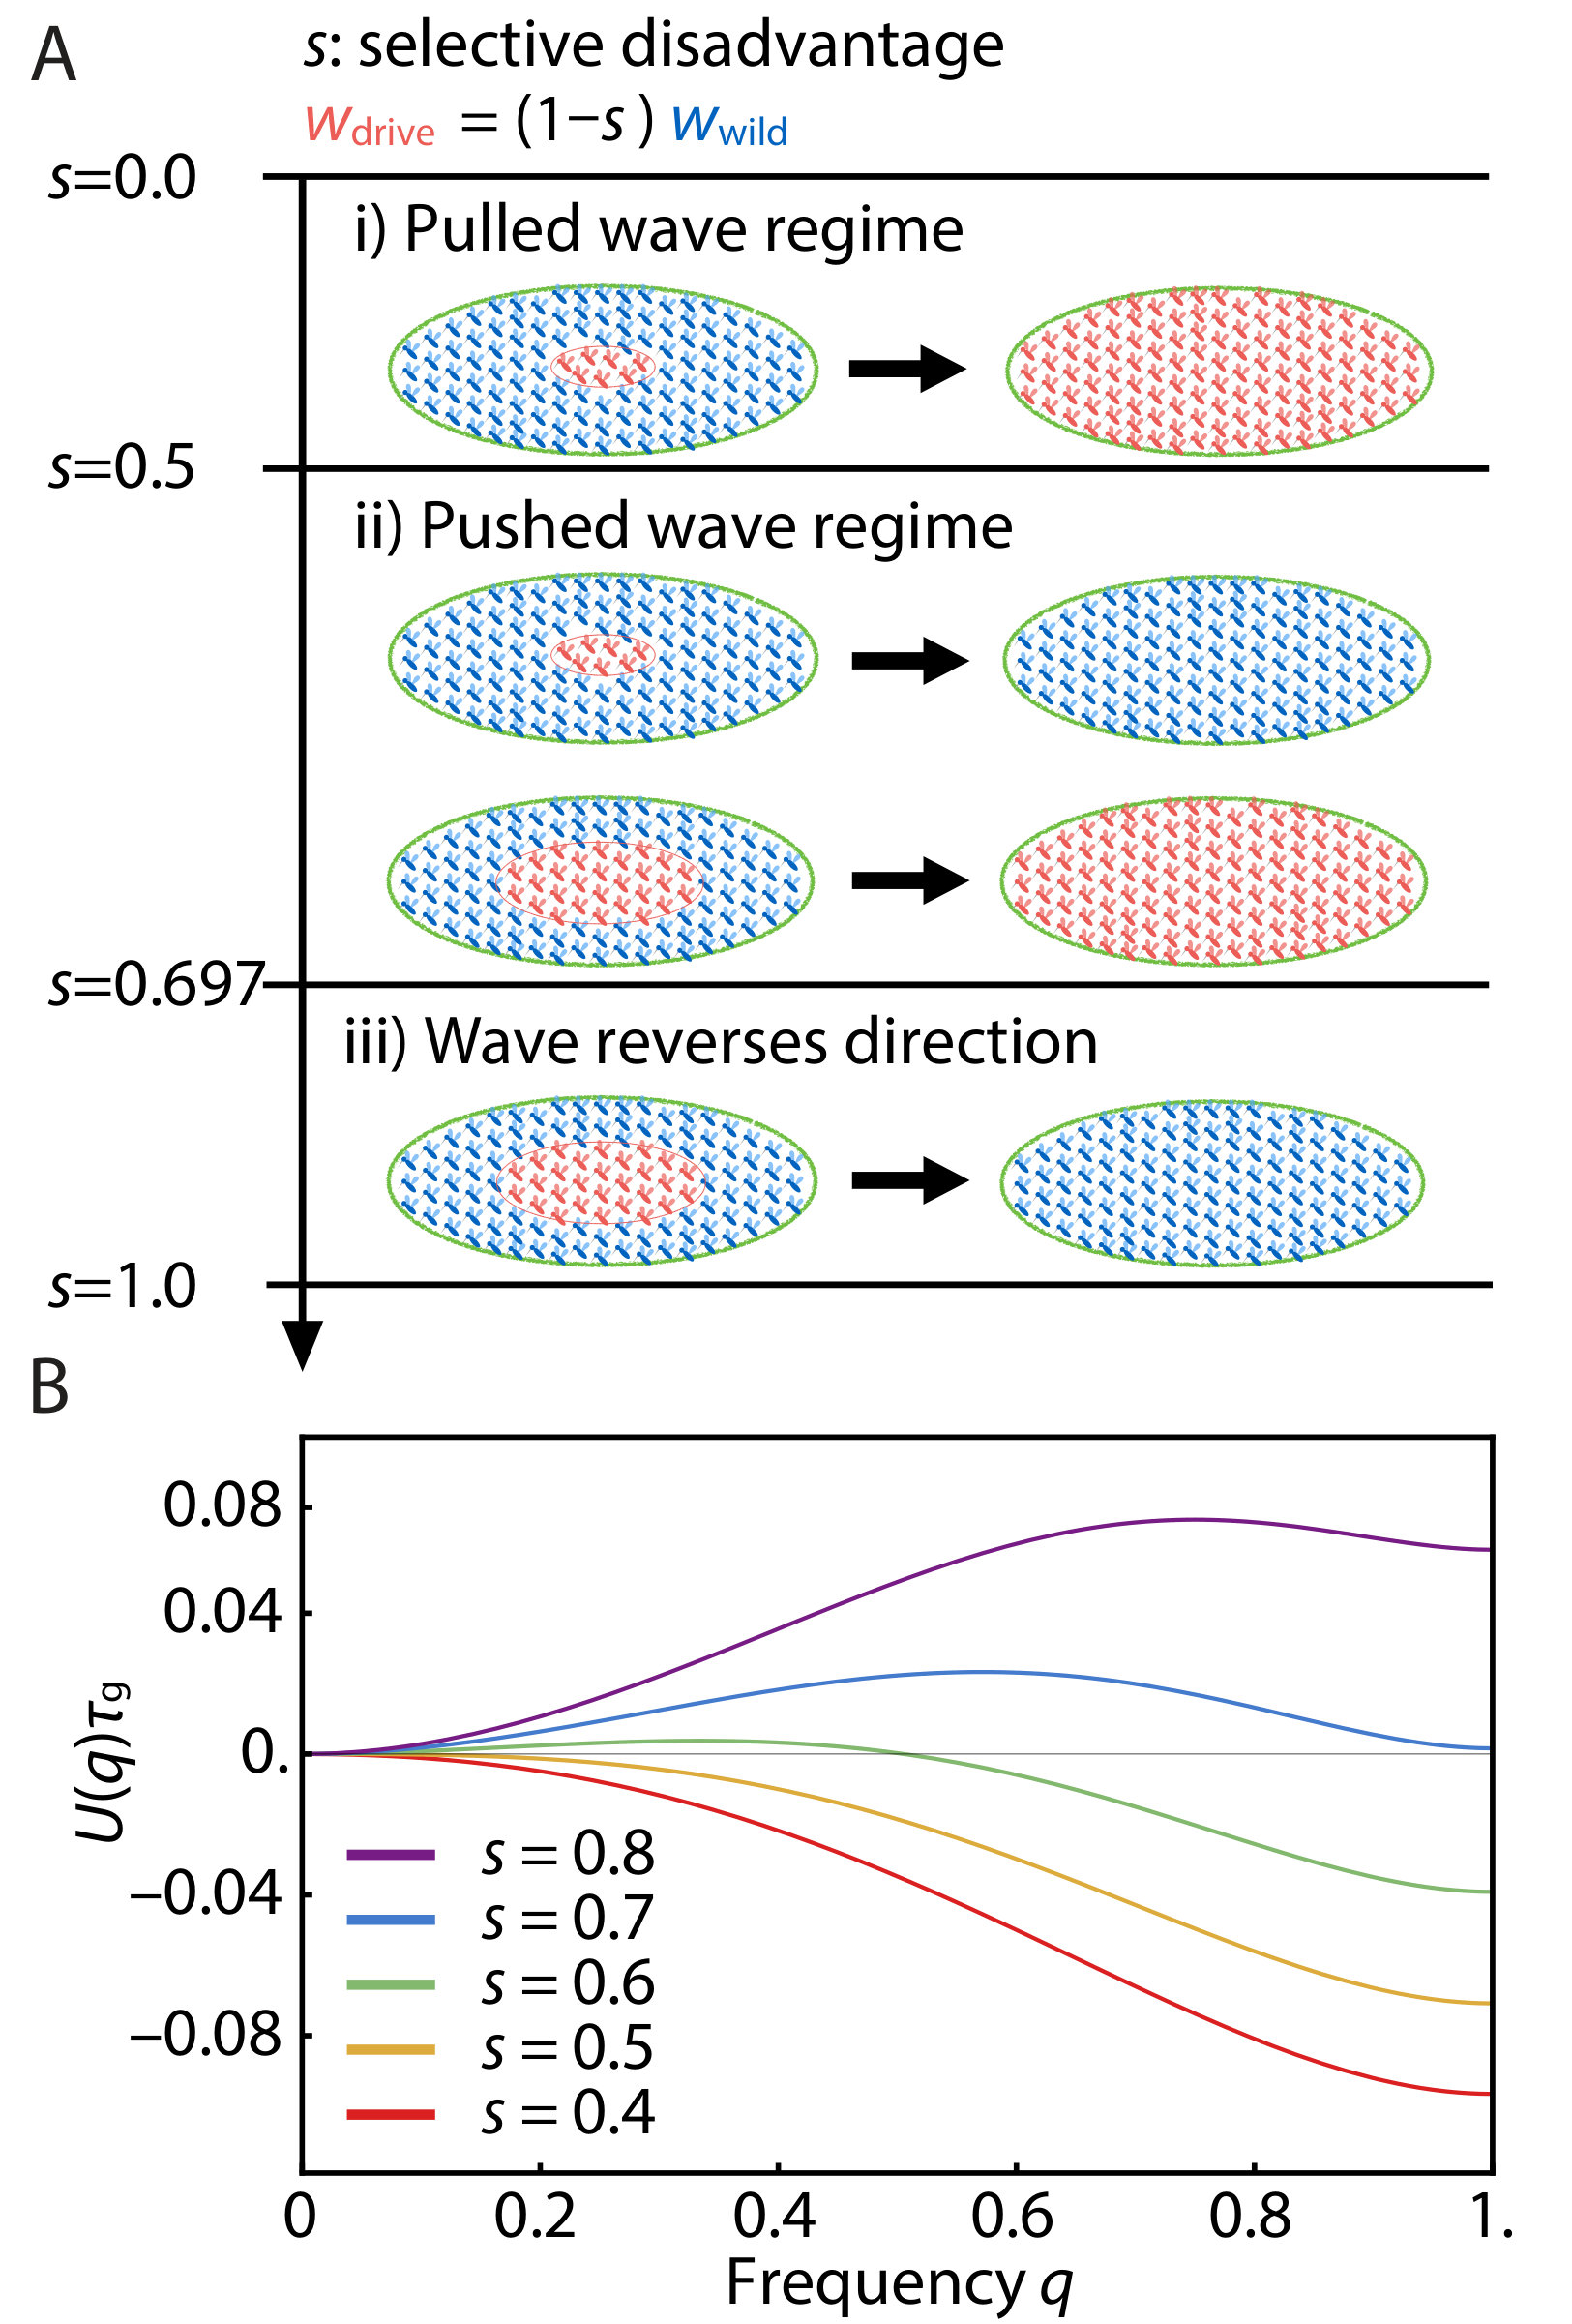 Figure 3
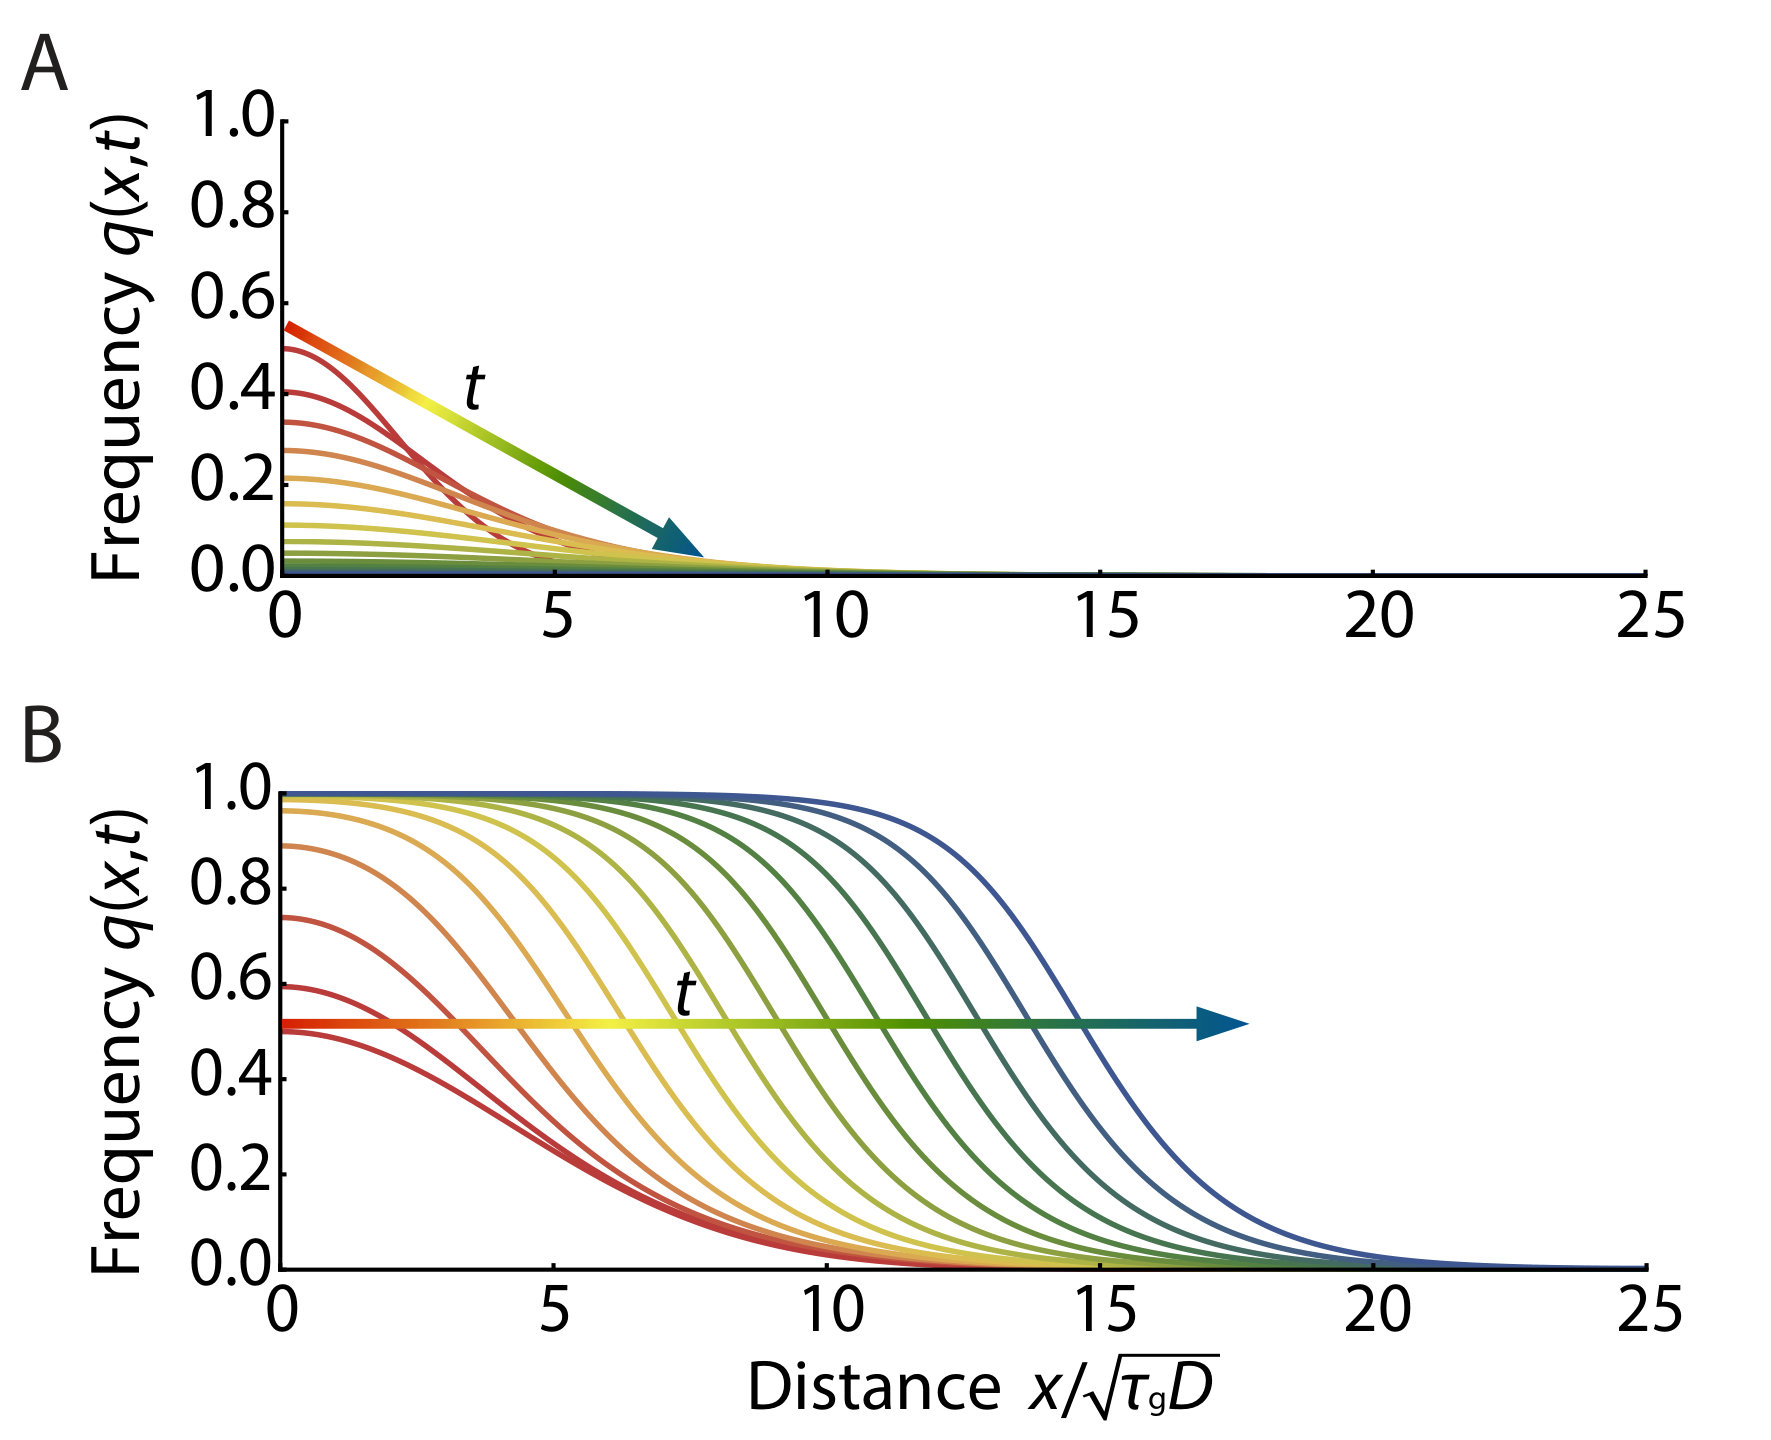 Figure 4
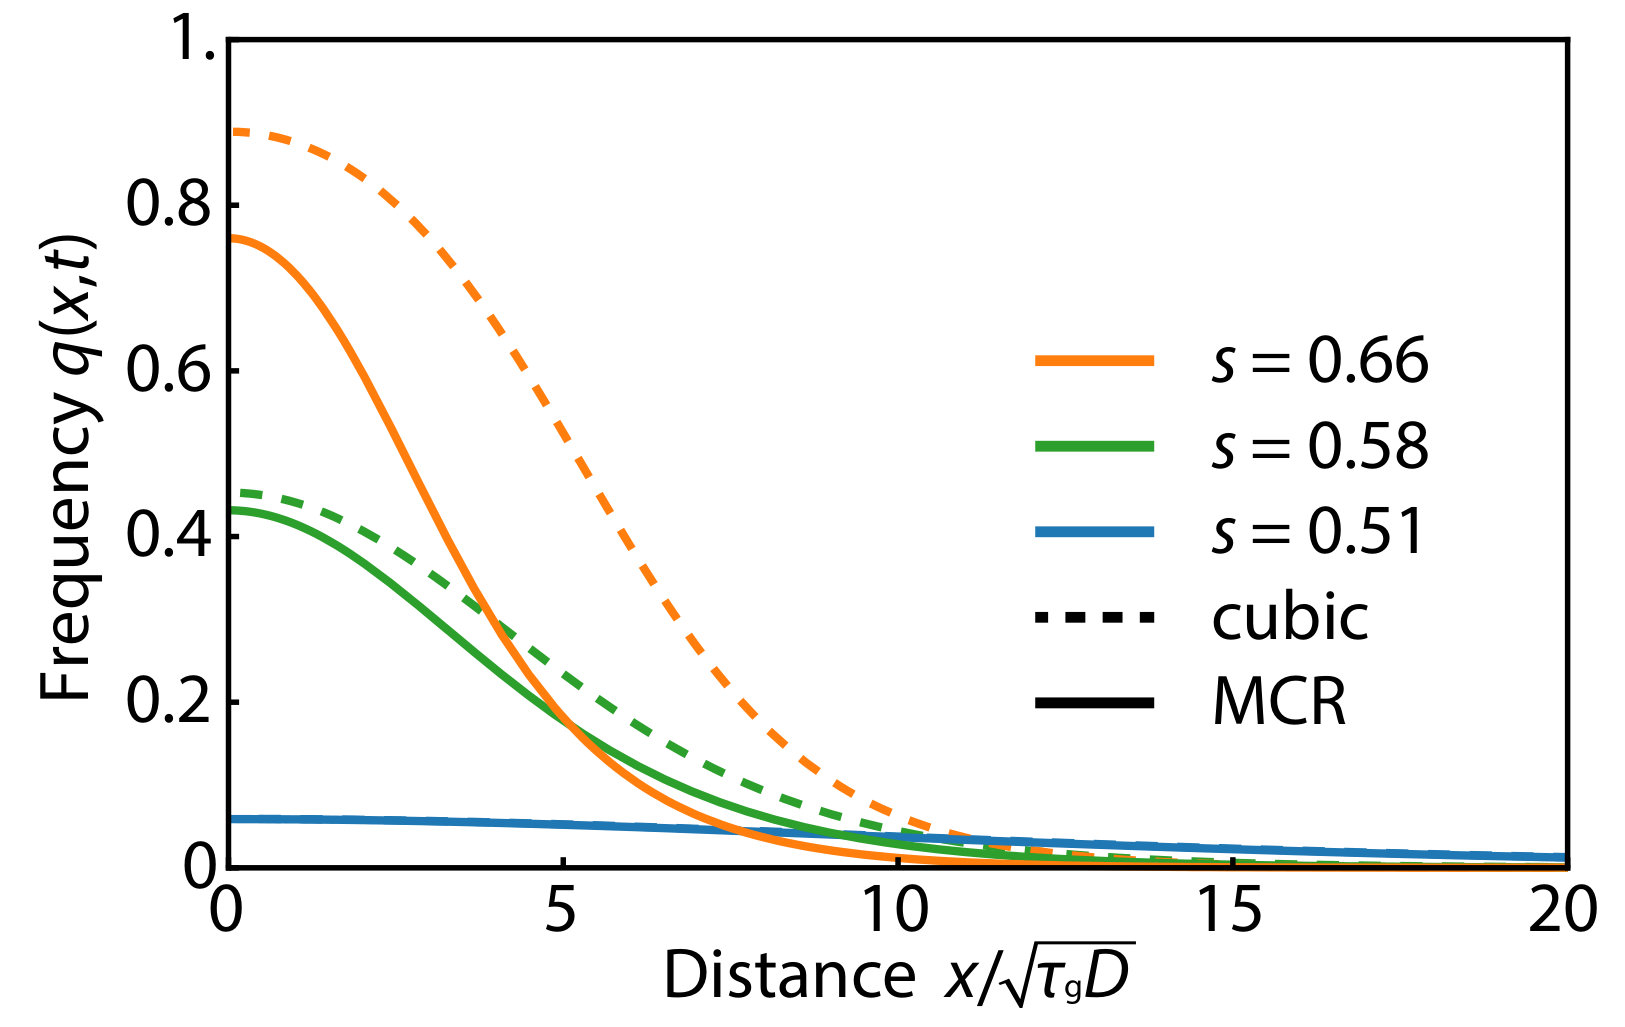 Figure 5
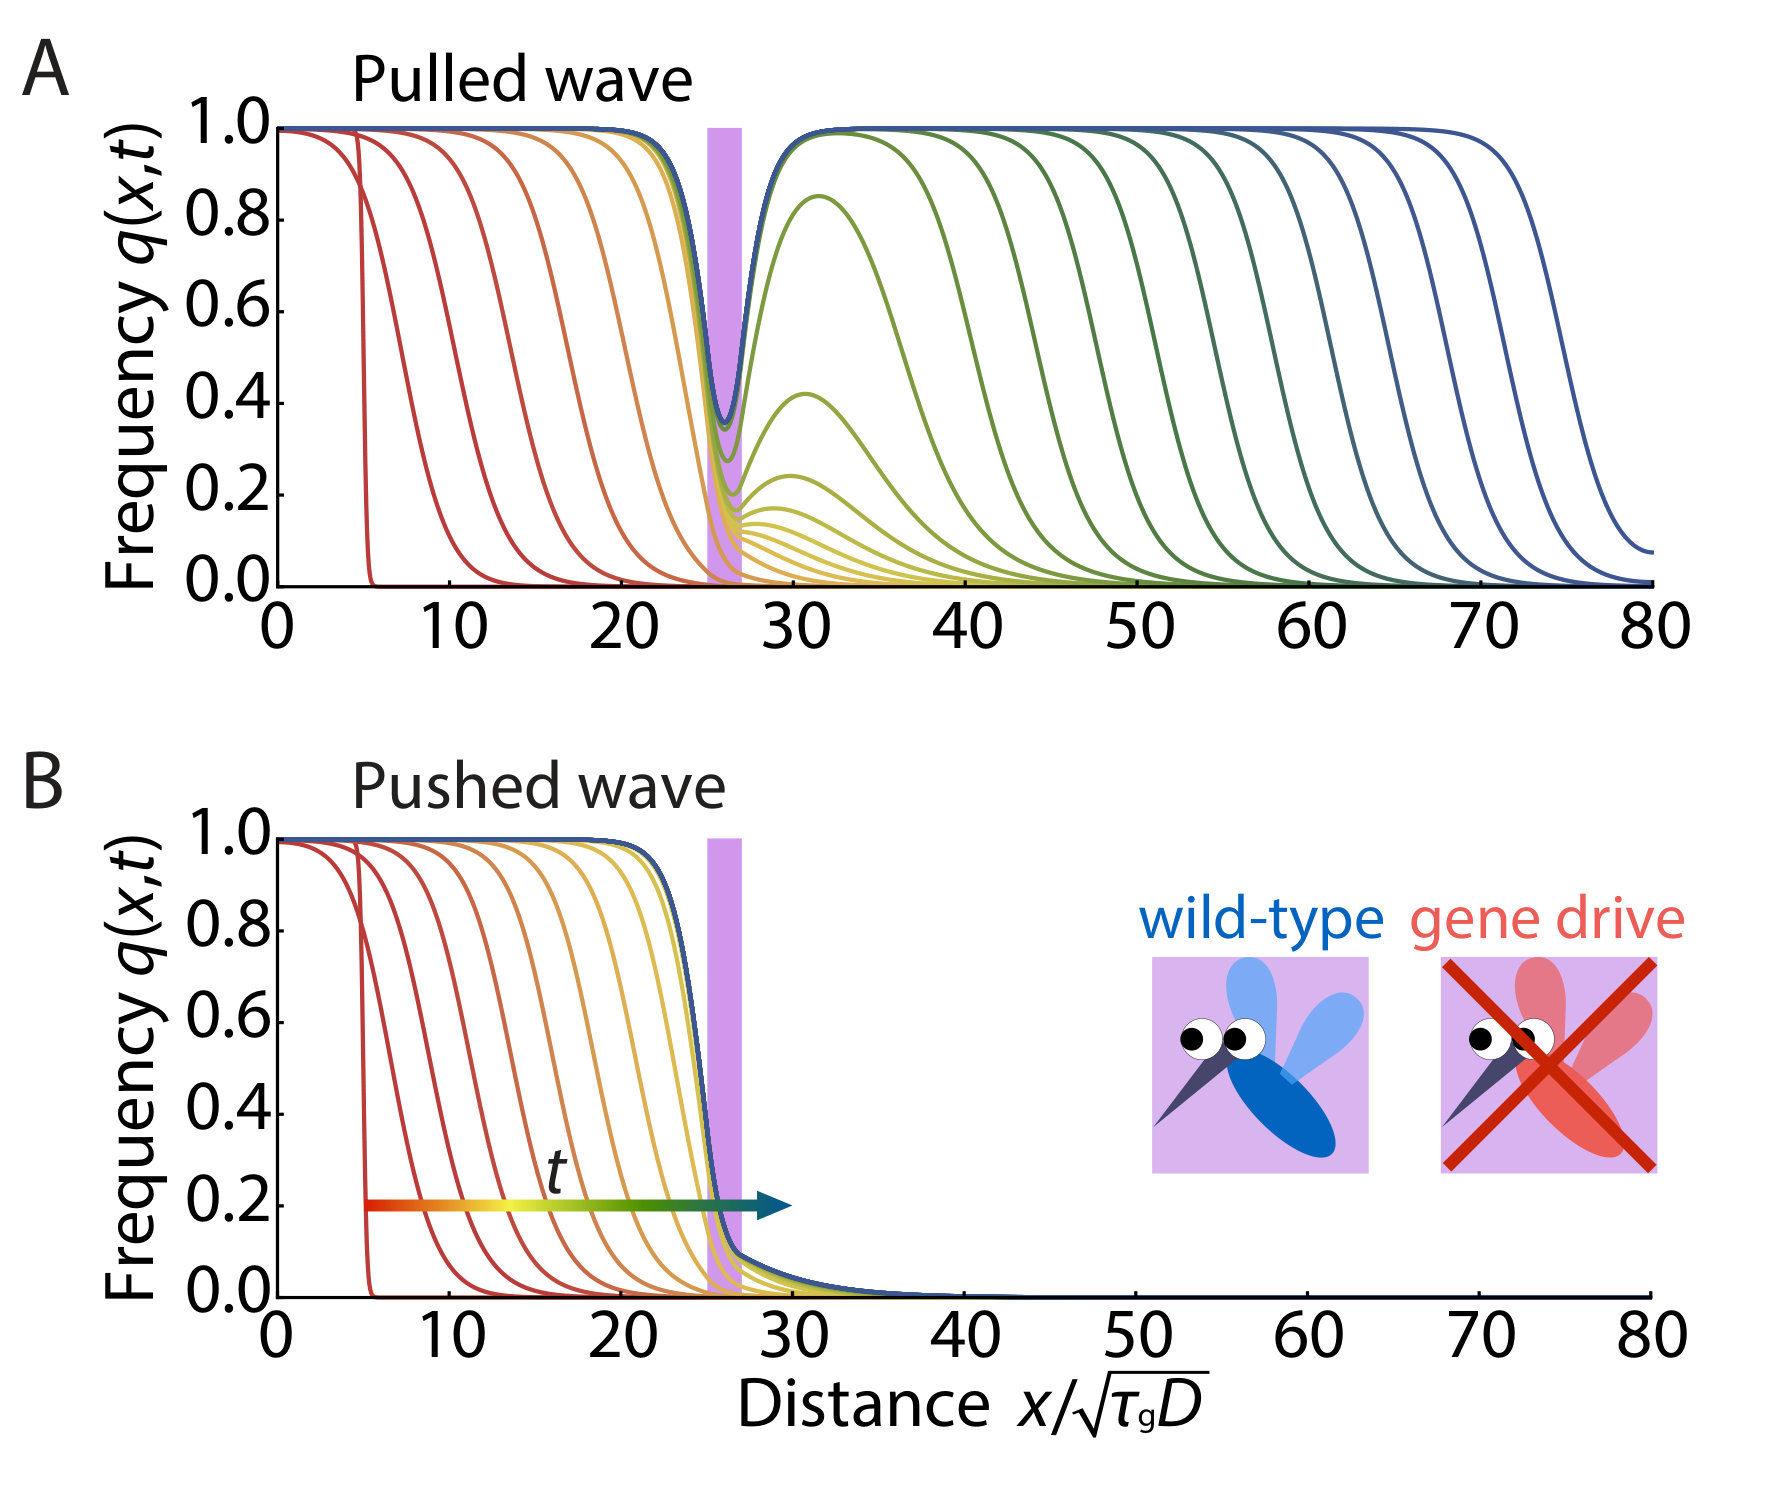 Figure 6
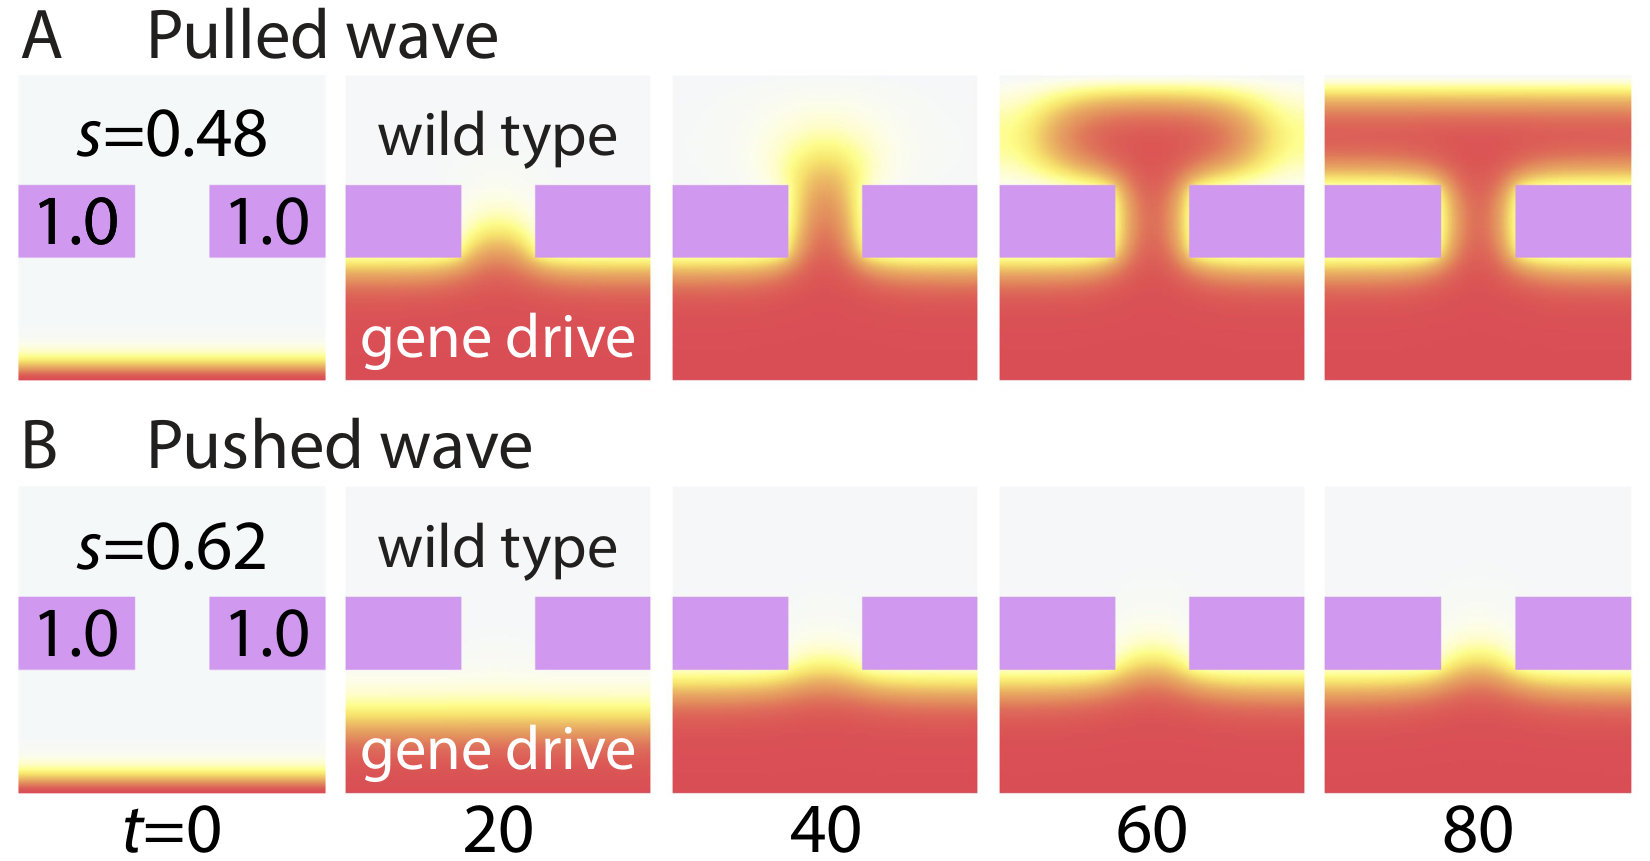 Figure 7
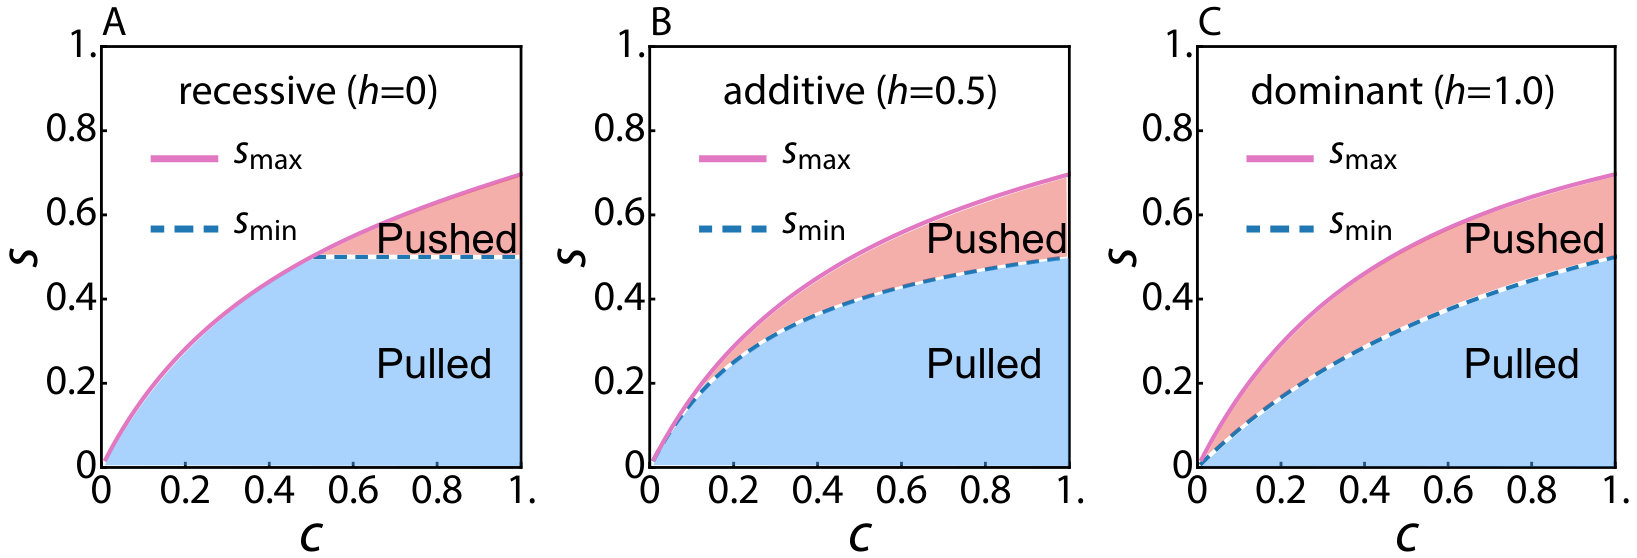 Figure 8
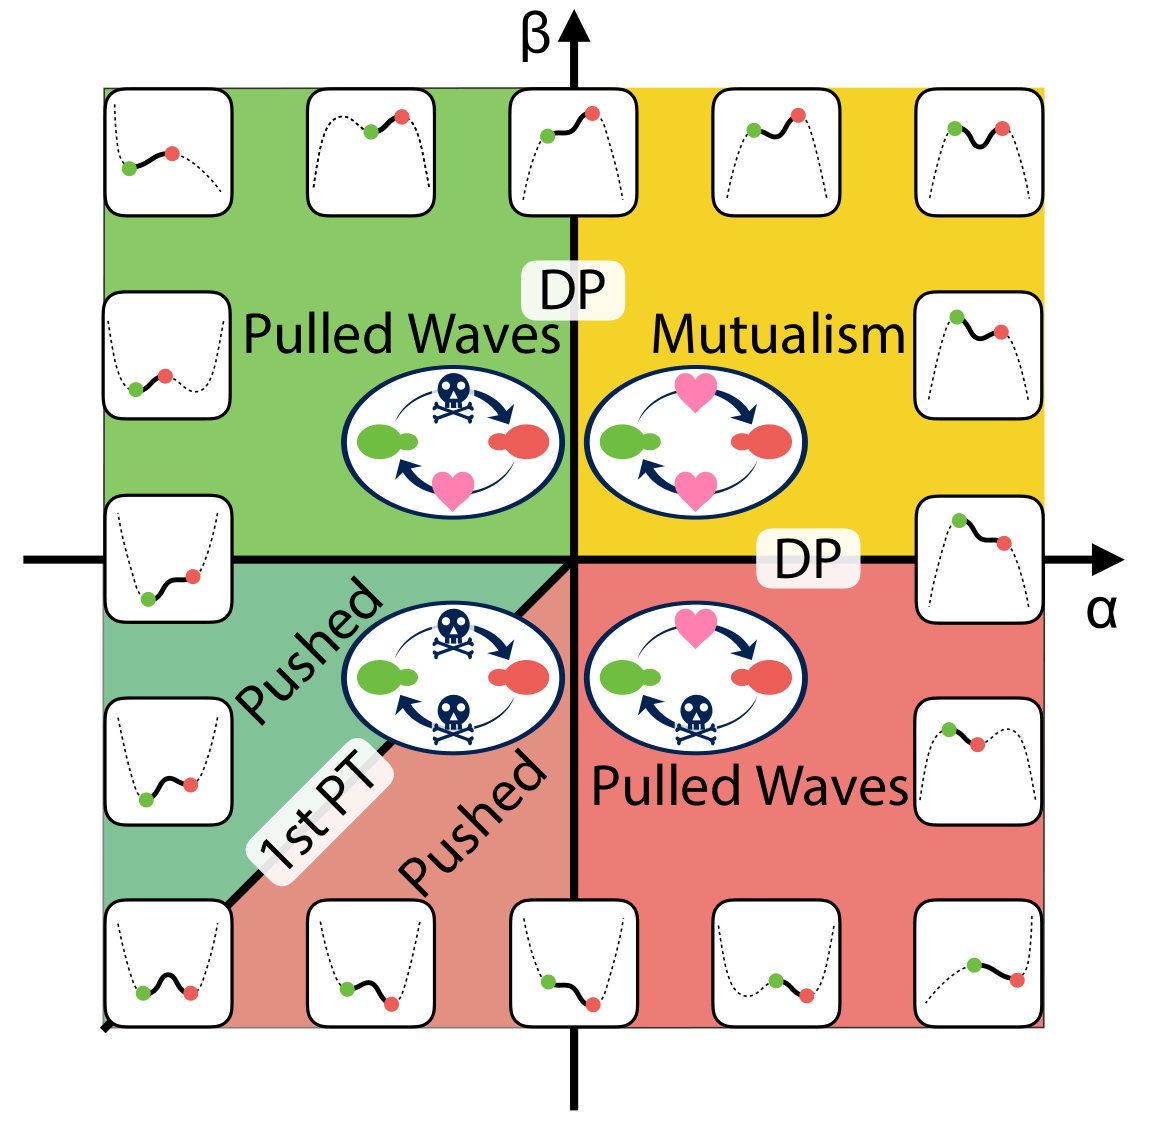 Figure 9
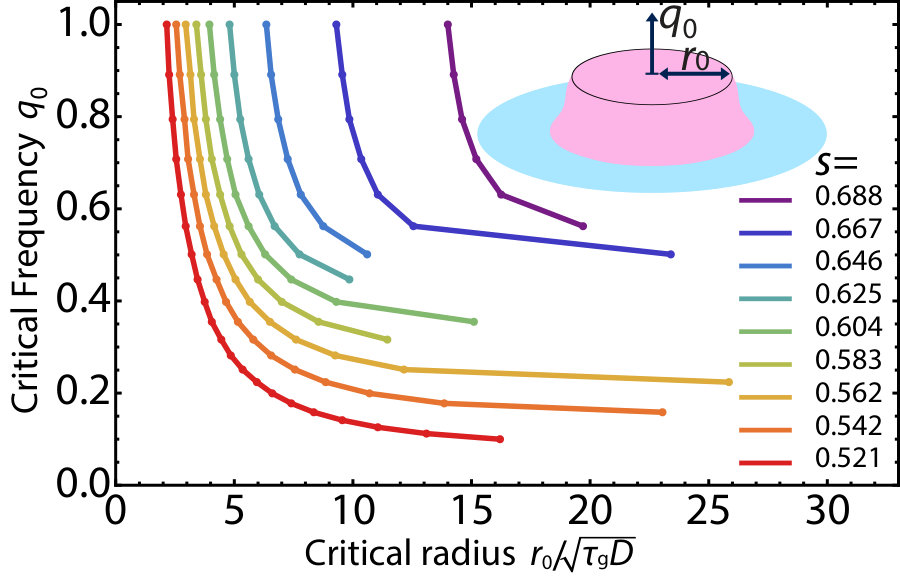 Figure 10
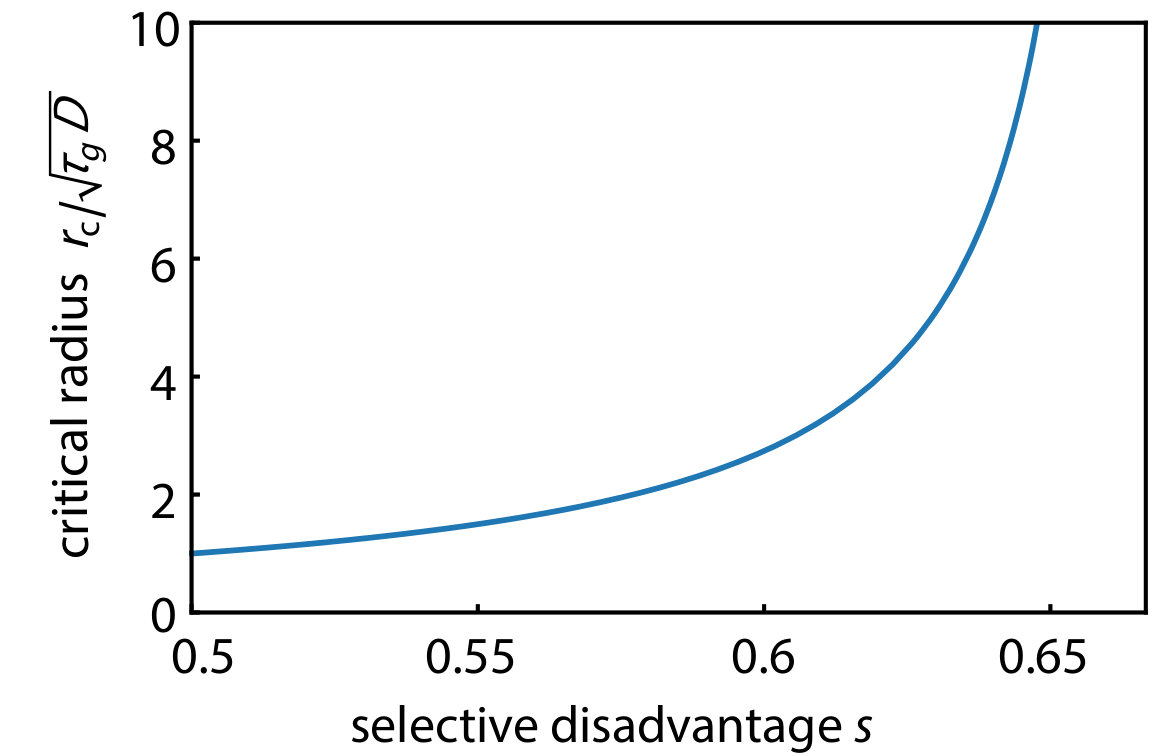 Figure 11
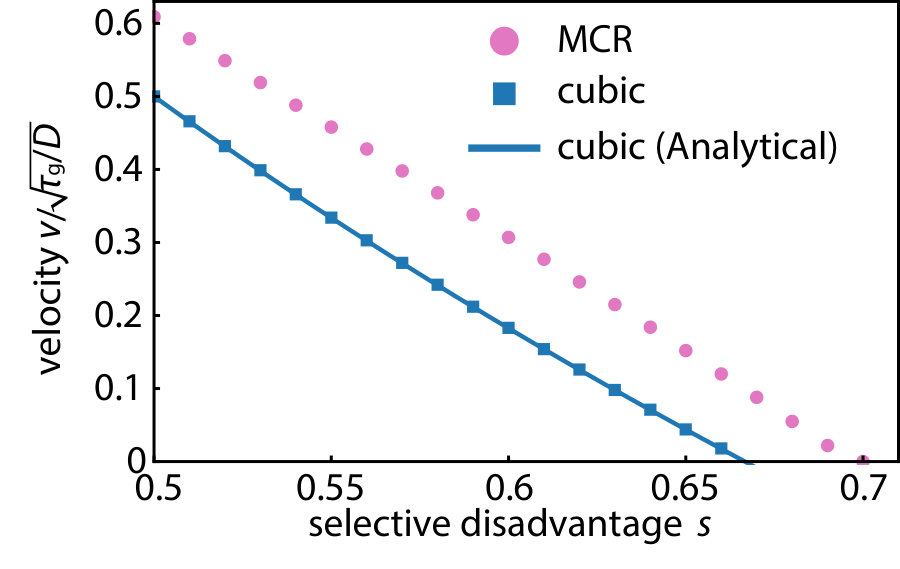 Figure 12
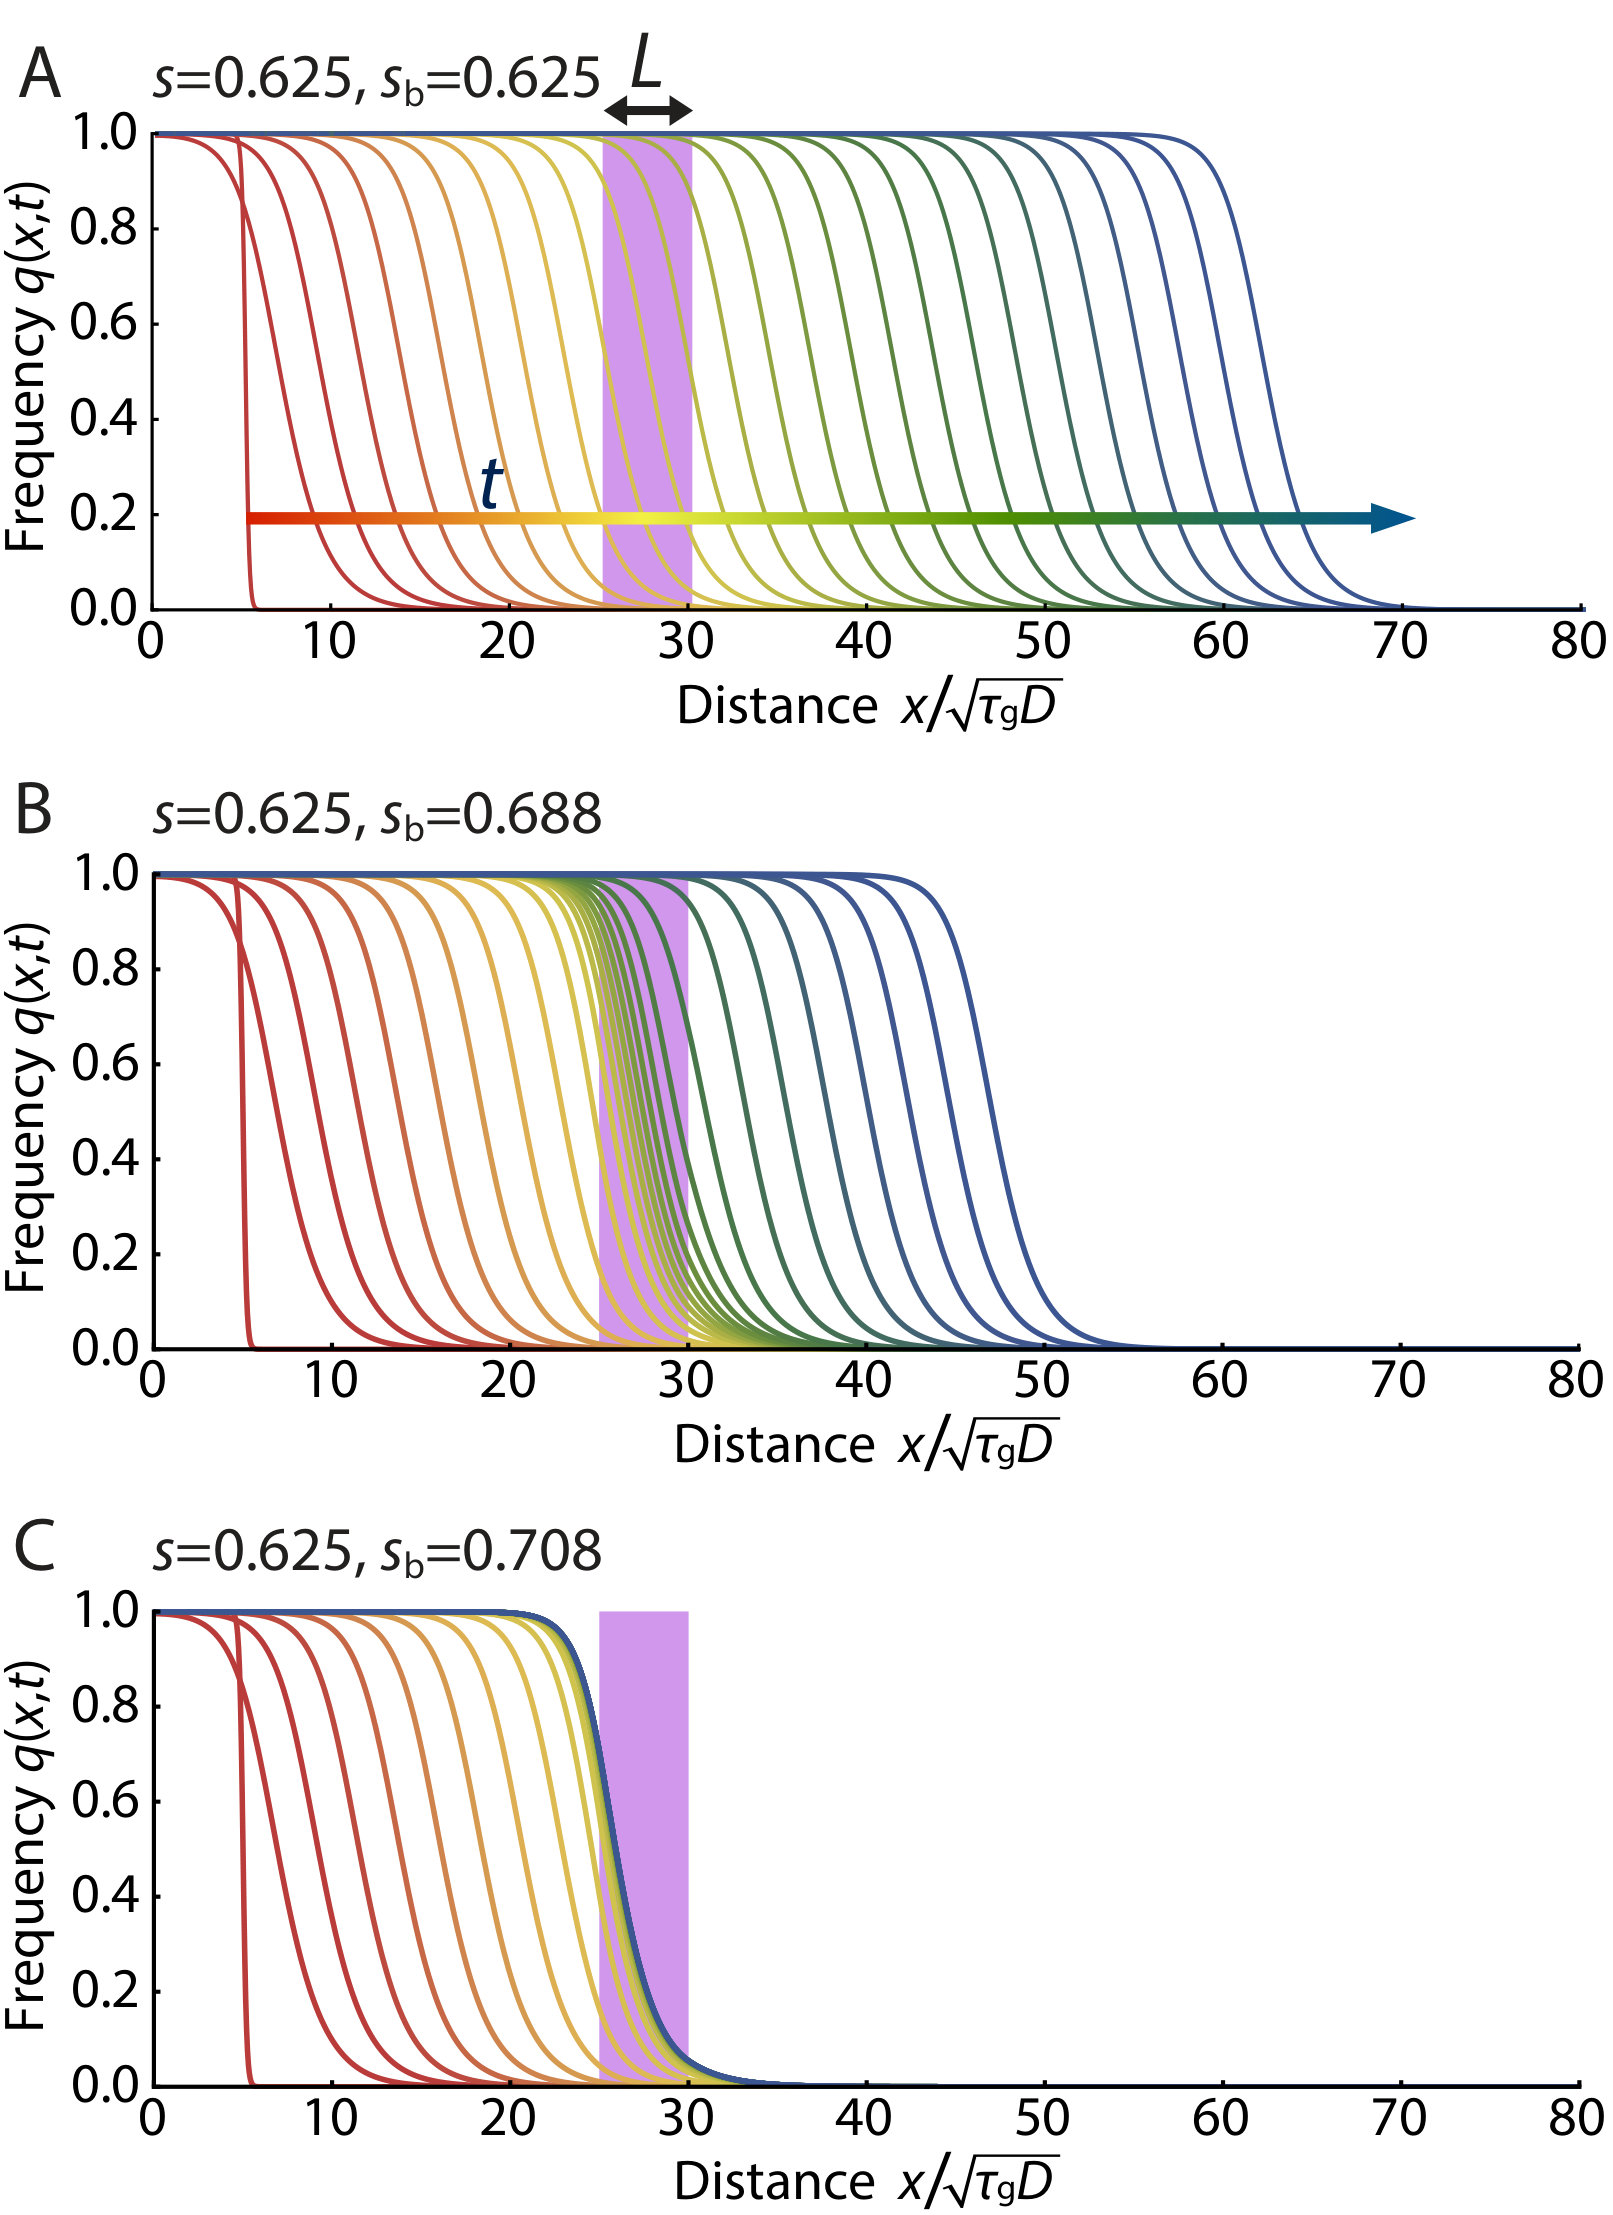 Figure 13
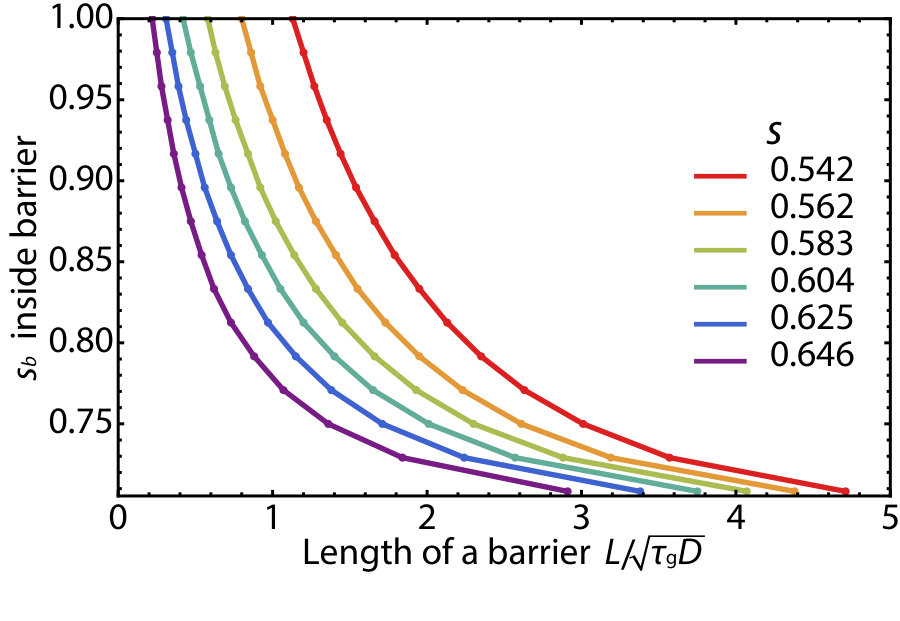 Figure 14
Peer Reviews
No public reviews on file for this paper yet. If you reviewed it on a platform where reviews are public (OpenReview, ICLR, NeurIPS, ICML), you can paste yours below so the community can read it here.
Videos
No videos yet. Explain this paper in a talk, walkthrough, or lecture? Add one.
Spatial gene drives and pushed genetic waves
Hidenori Tanaka
School of Engineering and Applied Sciences, Harvard University, Cambridge, MA 02138
Kavli Institute for Bionano Science and Technology, Harvard University, Cambridge, MA 02138
Howard A. Stone
Department of Mechanical and Aerospace Engineering, Princeton University, NJ 08544, USA
David R. Nelson
School of Engineering and Applied Sciences, Harvard University, Cambridge, MA 02138
Departments of Physics and Molecular and Cellular Biology, Harvard University, Cambridge, MA 02138, USA
Abstract
Gene drives have the potential to rapidly replace a harmful wild-type allele with a gene drive allele engineered to have desired functionalities. However, an accidental or premature release of a gene drive construct to the natural environment could damage an ecosystem irreversibly. Thus, it is important to understand the spatiotemporal consequences of the super-Mendelian population genetics prior to potential applications. Here, we employ a reaction-diffusion model for sexually reproducing diploid organisms to study how a locally introduced gene drive allele spreads to replace the wild-type allele, even though it possesses a selective disadvantage . Using methods developed by N. Barton and collaborators, we show that socially responsible gene drives require , a rather narrow range. In this “pushed wave” regime, the spatial spreading of gene drives will be initiated only when the initial frequency distribution is above a threshold profile called “critical propagule”, which acts as a safeguard against accidental release. We also study how the spatial spread of the pushed wave can be stopped by making gene drives uniquely vulnerable (“sensitizing drive”) in a way that is harmless for a wild-type allele. Finally, we show that appropriately sensitized drives in two dimensions can be stopped even by imperfect barriers perforated by a series of gaps.
The development of the CRISPR/Cas9 system Cong et al. (2013); Jinek et al. (2013); Mali et al. (2013); Wright et al. (2016), derived from an adaptive immune system in prokaryotes Marraffini (2015), has received much recent attention, in part due to its exceptional versatility as a gene editor in sexually-reproducing organisms, compared to similar exploitations of homologous recombination such as zinc-finger nucleases (ZFNs) and the TALENS system Jiang and Marraffini (2015); Wright et al. (2016). Part of the appeal is the potential for introducing a novel gene into a population, allowing control of highly pesticide-resistant crop pests and disease vectors such as mosquitoes Alphey (2014); Burt (2014); Esvelt et al. (2014); Gantz and Bier (2016). Although the genetic modifications typically introduce a fitness cost or a “selective disadvantage”, the enhanced inheritance rate embodied in CRISPR/Cas9 gene drives nevertheless allows edited genes to spread, even when the fitness cost of the inserted gene is large. The idea of using constructs that bias gene transmission rates to rapidly introduce novel genes into ecosystems has been discussed for many decades Curtis et al. (1968); Foster et al. (1972); Burt (2003); Sinkins and Gould (2006); Gould (2008); Deredec et al. (2008). Similar “homing endonuclease genes” (in the case of CRISPR/Cas9, the homing ability is provided by a guide RNA) were considered earlier by ecologists in the context of control of malaria in Africa North et al. (2013); Eckhoff et al. (2017).
As a hypothetical example of a gene drive applied to a pathogen vector requiring both a vertebrate and insect host, consider plasmodium, carried by mosquitoes and injected with its saliva into humans (Fig. 1). Female mosquitoes typically hatch from eggs in small standing pools of water and, after mating, search for a human to feed on. They then lay their eggs and repeat the process, thus spreading the infection over a few gonotrophic cycles. A gene drive could alter the function of a protein manufactured in the salivary gland of female mosquitoes from, say, type , anesthetizing nerve cells when it bites humans, to instead type , clogging up essential chemoreceptors in plasmodium and thus killing these eukaryotes. In the absence of a gene drive, there would be a selective disadvantage or fitness cost to losing this protein. Even if the fitness cost were zero, it is unlikely that this new trait would be able to escape genetic drift in large populations. However, as we describe below, the trait could spread easily if linked to a gene drive that converts heterozygotes to homozygotes with efficiency close to 1 (Fig. 1A). Remarkably, high conversion rates have already been achieved with the mutagenic chain reaction (“MCR”) realized by the CRISPR/Cas9 system Cong et al. (2013); Jinek et al. (2013); Mali et al. (2013) for yeast () DiCarlo et al. (2015), fruit flies () Gantz and Bier (2015) and malaria vector mosquito, Anopheles stephensi with engineered malaria resistance () Gantz et al. (2015).
However, the gene drives’ intrinsic nature of irreversibly altering wild-type populations raises biosafety concerns Esvelt et al. (2014), and calls for confinement strategies to prevent unintentional escape and spread of the gene drive constructs Akbari et al. (2015). While various genetic design or containment strategies have been discussed Chan et al. (2011); Henkel et al. (2012); Esvelt et al. (2014); Gantz and Bier (2015), and a few computational simulations were conducted Huang et al. (2011); North et al. (2013); Eckhoff et al. (2017), the spatial spreading of the gene drive alleles has received less attention.
To understand such phenomena in a spatial context, we will exploit a methodology developed by N. Barton and collaborators, originally in an effort to understand adaptation and speciation of diploid sexually reproducing organisms in genetic hybrid zones Barton (1979, 1989); Barton and Turelli (2011). We apply these techniques to a spatial generalization of a model of diploid CRISPR/Cas9 population genetics proposed by Unckless et al. Unckless et al. (2015), and highlight two distinct ways in which gene drive alleles can spread spatially. The non-Mendelian (or “super-Mendelian” Noble et al. (2017)) population genetics of gene drives are remarkable because individuals homozygous for a gene drive can in fact spread into wild-type populations even if they carry a positive selective disadvantage (Fig. 1B). First, for small selective disadvantages ( in our case), the spatial spreading proceeds via a well-known Fisher-Kolmogorov-Petrovsky-Piskunov wave Fisher (1937); Kolmogorov et al. (1937). Such pulled genetic waves Stokes (1976); Lewis (2016); Gandhi et al. (2016) are driven by growth and diffusive dispersal at the leading edge, and are difficult to slow down and stop.
However, for somewhat larger selective disadvantages () we find that propagation proceeds instead via a pushed genetic wave Stokes (1976); Lewis (2016); Gandhi et al. (2016), where the genetic wave advances via accentuated growth from populations somewhat behind the front that spill over the leading edge. These waves, characterized by a strong Allee effect Lewis and Kareiva (1993); Taylor and Hastings (2005), are more socially responsible than the pulled Fisher waves because: (i) only inoculations whose spatial size and density exceed a critical nucleus, or “critical propagule”Barton and Turelli (2011) are able to spread spatially, thus providing protection against a premature or accidental release of a gene drive, (ii) the gene drive pushed waves can be stopped by making them uniquely vulnerable to a specific compound (“sensitizing drive” Esvelt et al. (2014)), which is harmless for a wild-type allele, and (iii) appropriately sensitized gene drives can be stopped even by barriers punctuated by defects, analogous to regularly spaced fire breaks used to contain forest fires. Similar pushed or “excitable” waves also arise, for example, in neuroscience, in simplified versions of the Hodgkin-Huxley model of action potentials Nelson (2004). When the selective disadvantage associated with the gene drive is too large ( in our model) the excitable wave reverses direction and the region occupied by the gene drive homozygotes collapses to zero.
The same mathematical analyses applies to spatial evolutionary games of two competing species in one dimension, which are governed by a class of reaction-diffusion equations that resemble the gene drive system. The fitnesses of the two interacting red and green species (, ) are related to their frequencies (, ) by , where is a background fitness, assumed identical for the two alleles for simplicity. The mutualistic regime in the first quadrant of Fig. 2 has been studied already Korolev and Nelson (2011), including the effect of genetic drift, with two lines of directed “percolation” transitions out of a mutualistic phase. Here, we apply the methods of Barton and Turelli (2011) to study the evolutionary dynamics near the line of first-order transitions that characterize the competitive exclusion regime in the third quadrant of Fig. 2. Because the mathematics parallels the analysis inspired by gene drive systems in the main text, we relegate discussion of this topic to the SI Appendix, which also discusses conversion efficiencies , an analogy with nucleation theory, laboratory tests and other matters.
Mathematical model of the CRISPR gene drives
We start with a Hardy-Weinberg model Hartl and Clark (1997) and incorporate a mutagenic chain reaction (“MCR”) with conversion rate to construct a model for a well-mixed system. This model is the limiting case of “” in the work of Unckless et al Unckless et al. (2015). Conversion efficiencies can be handled by similar techniques. First, we consider a well-mixed diploid system with a wild-type allele and a gene drive allele with frequencies and respectively at time , with . Within a random mating model, the allele frequencies after one generation time are given by
[TABLE]
and the ratios of fertilized eggs with diploid types , and are . In a heterozygous egg, the CRISPR/Cas9 machinery encoded on a gene drive allele converts the wild-type allele into a gene drive allele . Here, we assume a perfect conversion rate in the embryo, as has been approximated already for yeast DiCarlo et al. (2015) and fruit flies Gantz and Bier (2015). Genetic engineering will typically reduce the fitness of individuals carrying the gene drive alleles compared to wild-type organisms, which have already gone through natural evolution and may be near a fitness maximum.
The selective disadvantage of a gene drive allele is defined by the ratio of the fitness of wild-type organisms to the fitness of individuals carrying the gene drive,
[TABLE]
(In the limit no heterozygous individuals are born Unckless et al. (2015).) Taking the fitness into account, the allele frequencies after one generation time are
[TABLE]
where and . Upon approximating by , we obtain a differential equation
[TABLE]
which governs population dynamics of the mutagenic chain reaction with conversion efficiency in a well-mixed system. To take spatial dynamics into account, we add a diffusion term Barton and Turelli (2011) and obtain a deterministic reaction-diffusion equation for the MCR model, namely
[TABLE]
which will be the main focus of this article. For later discussions, we name the reaction term of the reaction-diffusion equation,
[TABLE]
The reaction term reduces to a simpler cubic expression
[TABLE]
by ignoring in the denominator, which is a reasonable approximation if the selective disadvantage is small. This form of the reaction-diffusion equation has been well studied, as reviewed in Barton and Turelli (2011).
Although population genetics is often studied in the limit of small , is in fact fairly large in the regime of pushed excitable waves of most interest to us here, . Hence, we will keep the denominator of the reaction term, as was also done in Barton and Turelli (2011) with a different reaction term. Comparison of results for the full nonlinear reaction term with those for the cubic approximation will give us a sense of the robustness of the cubic approximation. Although it might also be of interest to study corrections to the continuous time approximation arising from higher order time derivatives in (contributions from are formally of order ), this complicated problem will be neglected here; see, however, Turelli and Barton (2017) for a study of the robustness of the continuous time approximation, motivated by a model of dengue-suppressing Wolbachia in mosquitoes.
Initiation of the pushed waves
The reaction terms and have three identical fixed points, and ~{}q^{*}\big{(}=\frac{2s-1}{s}\big{)}. As discussed in the SI Appendix in connection to classical nucleation theory in physics, and following Barton (1979), we can define the potential energy function
[TABLE]
to identify qualitatively different parameter regimes. In a well-mixed system, without spatial structure, the gene drive frequency obeys Eq. 4, and evolves in time so that it arrives at a local minimum of . For the spatial model of interest here, shows qualitatively distinct behaviors in three parameter regimes depending on the selective disadvantage (see Fig. 3A). We plot the potential energy functions in these parameter regimes in Fig. 3B.
i) First, when , fixation of a gene drive allele for all is the unique stable state and there is no energy barrier to reach the ground state starting from . In this regime, any finite frequency of gene drive allele locally introduced in space (provided it overcomes genetic drift) will spread and replace the wild-type allele. The frequency profile will evolve as a pulled traveling wave with wave velocity . Such a wave was first found by Fisher Fisher (1937) and by Kolmogorov, Petrovsky and Piskunov Kolmogorov et al. (1937) in the 1930s, in studies of how locally introduced organisms with advantageous genes spatially spread and replace inferior genes. However, the threshold-less initiation of population waves of engineered gene drives with relatively small selective disadvantages seems highly undesirable, since the accidental escape of a single gene drive construct can establish a population wave that spreads freely into the extended environment.
ii) There is a second regime for in which the potential energy function exhibits an energy barrier between and . In this regime, a pushed traveling wave can be excited only when a threshold gene drive allele frequency is introduced over a sufficiently broad region of space that exceeds the size of a critical nucleus, which we investigate in the next section. The existence of this threshold acts as a safeguard against accidental release. In addition, such excitable waves are easier to stop as we will discuss later. It appears that gene drives in this relatively narrow intermediate regime are the most desirable from a biosafety perspective.
iii) When , the fixation of a gene drive allele throughout space is no longer absolutely stable (Fig. 3B), and a gene drive population wave cannot be established. Indeed, the excitable wave reverses direction for . An implicit equation for results from equating , which yields
[TABLE]
where we used . When , the locally introduced gene drive allele contracts rather than expands relative to the wild-type allele and simply dies out. See SI Appendix for the analogous results with an arbitrary conversion rate ().
Critical nucleus in the pushed wave regime
When the selective disadvantage is in the intermediate regime, , we can control initiation of the pushed excitable wave by the initial frequency profile of the gene drive allele as shown in Fig. 4. For example, in Fig. 4A, an initially introduced gene drive allele (in the form of a Gaussian) diminishes and dies out since the width of the initial frequency distribution is not sufficient to excite the population wave. In contrast, the results in Fig. 4B show the successful establishment of the excitable wave starting from a sufficiently broad (Gaussian) initial distribution of a gene drive allele. Roughly speaking (provided ), two conditions must be satisfied to obtain a critical propagule: (1) The initial condition at the center of the inoculant must exceed , the local maximum of the function plotted in Fig. 3; and (2) The spatial spread of the inoculant must satisfy where the dimensionless constant depends on . Thus, the initial width should exceed the width of the pushed wave that is being launched.
We show the spatial concentration profile that constitutes that (Gaussian) critical nucleus just sufficient to initiate an excitable wave in Fig. 5. The solid lines represent numerically obtained critical nuclei of the MCR model. Note the consistency for with the pushed excitable waves shown in Fig. 4. The dashed lines represent analytically derived critical propagules of the cubic model as a reference (see SI Appendix for details). Fig. 5 shows that the cubic model overestimates the height of critical propagule, particularly for larger . The difference between the reaction terms of the MCR model (see Eq. 6) and that of its cubic approximation (see Eq. 7), arises from the term in the denominator of Eq. 5. In the biologically relevant regime , is always positive and is satisfied, which explains why there is a larger critical propagule in the cubic approximation, and the discrepancy is larger for larger . The critical nucleus with a step-function-like circular boundary is studied both numerically and analytically in two dimensions in the SI Appendix.
Stopping of pushed, excitable waves by a selective disadvantage barrier
Thus far, we have found that (i) we can control initiation of the spatial spread of a gene drive provided , and (ii) the pushed population waves in this regime slow down and eventually stop (and reverse direction) when , see SI Appendix. In this section, we examine alternative ways to confine an excitable gene drive wave to attain greater control over its spread in this regime.
Imagine exploiting the CRISPR/Cas9 system to encode multiple functionalities into the gene drive machinery Cong et al. (2013); Jinek et al. (2013); Mali et al. (2013); Gantz and Bier (2015). For example, one could produce genetically engineered mosquitoes that are not only resistant to malaria, but also specifically vulnerable to an insecticide that is harmless for the wild-type alleles. Such a gene drive, which is uniquely vulnerable to an otherwise harmless compound, is a sensitizing drive Esvelt et al. (2014). The effect of laying down insecticide in a prescribed spatial pattern on a sensitizing drive can be incorporated in our model by increasing the selective disadvantage to a value within a “selective disadvantage barrier” region.
In Fig. 6, we numerically simulate the mutagenic chain reaction model defined by Eq. 5 in one dimension with a barrier of strength placed in a region . When the selective disadvantage outside the barrier is small and the population wave travels as the pulled Fisher wave, even a tiny fraction of MCR allele diffusing through the insecticide region can easily reestablish the population wave, as shown in Fig. 6A. However, when the system is in the pushed wave regime , the wave can be stopped provided the spatial profile of the gene drive allele that leaks through does not constitute a critical nucleus, as illustrated in Fig. 6B. See the SI Appendix for numerically calculated plots of the critical width and barrier selective disadvantage needed to stop pushed waves for various values of .
Excitable Wave Dynamics with Gapped Barriers in Two Dimensions
In the previous section, we showed that pushed excitable waves can be stopped by a selective disadvantage barrier in one dimension. However, in two dimensions, it may be difficult to make barriers without defects. Hence, we have also studied the effect of a gap in a two-dimensional selective disadvantage barrier. We find that while the gene drive population wave in the Fisher wave regime always leaks through the gaps, the excitable wave with can be stopped, provided the gap is comparable or smaller than the width of the traveling wave front. In Fig. 7, we illustrate the gene drive dynamics for two different parameter choices. Both in Fig. 7A and B, the strength of the selective disadvantage barrier is set to be and the width of the gap in the barrier is set to be . The engineered selective disadvantage in the non-barrier region differs in the two plots. In Fig. 7A , so the gene drive wave propagates as a pulled Fisher wave and the wave easily leaks through the gap. If genetic drift can be neglected, we expect that Fisher wave excitations will leak through any gap however small. However, when the selective disadvantage barrier is in the pushed wave regime , the population wave can be stopped by a gapped selective disadvantage barrier as shown in Fig. 7B. To stop a pushed excitable wave, the gap dimensions must be smaller than the front width; alternatively, we can say that the gap must be smaller than size of the critical nucleus.
Discussion
The CRISPR/Cas9 system has greatly expanded the design space for genome editing and construction of mutagenic chain reactions with non-Mendelian inheritance. We analyzed the spatial spreading of gene drive constructs, applying reaction-diffusion formulations that have been developed to understand spatial genetic waves with bistable dynamics Barton (1979, 1989); Barton and Turelli (2011). For a continuous time and space version of the model of Unckless et al Unckless et al. (2015), in the limit of conversion efficiency, we found that a critical nucleus or propagule is required to establish a gene drive population wave when the selective disadvantage satisfies . Our model led us to study termination of pushed gene drive waves using a barrier that acts only on gene drive homozygotes, corresponding to an insecticide in the case of mosquitoes. In this parameter regime, the properties of pushed waves allow safeguards against the accidental release and spreading of the gene drives. One can, in effect, construct switches that initiate and terminate the gene drive wave. In the future, it would be interesting to study the stochasticity due to finite population size (genetic drift), which is known to play a role in the first quadrant of Fig. 2 Korolev and Nelson (2011); Lavrentovich and Nelson (2014). We expect that genetic drift can be neglected provided , where is an effective population size, say, the number of organisms in a well-mixed critical propagule. See the SI Appendix for a brief discussions on genetic drift. It could also be important to study the effect of additional mutations on an excitable gene drive wave, particularly those that move the organism outside the preferred range . Finally we address possible experimental tests of the theoretical predictions. Since it seems inadvisable to conduct field tests without thorough understanding of the system, laboratory experiments with microbes would be a good starting point. Recently, the transition from pulled to pushed waves was qualitatively investigated with haploid microbial populations Gandhi et al. (2016). Because the mutagenic chain reaction has already been realized in S. Cerevisiae DiCarlo et al. (2015), it may also be possible to test the theory in the context of range expansions on a Petri dish, as has already been done for haploid mutualistic yeast strains in Müller et al. (2014). Here, the frontier approximates a one dimensional stepping stone model, and jostling of daughter cells at the frontier leads to an effective diffusion constant in one dimension Korolev et al. (2010); Hallatschek et al. (2007). Finally, as illustrated in Fig. S2, the mathematics of the spatial evolutionary games in one dimension parallels the dynamics of diploid gene drives in the pushed wave regime, providing another arena for experimental tests, including the effects of genetic drift.
Numerical Simulations
To simulate the dynamics governed by Eq. 6 in Figs. 4,6,7 and S6, we used the method of lines and discretized spatial variables to map the partial differential equation to a system of coupled ordinary equations (“ODE”). Then we solved the coupled ODEs with a standard ODE solver. The width of the spatial grids were varied from to always making sure that the mesh size was much smaller than the width of the fronts of the pushed and pulled genetic waves we studied.
Acknowledgement
We thank N. Barton, S. Block, S. Sawyer, T. Stearns, and M. Turelli for helpful discussions and two anonymous reviewers for useful suggestions. N. Barton also provided a critical reading of our manuscript. Work by HT and DRN was supported by the National Science Foundation, through grants DMR1608501 and via the Harvard Materials Science Research and Engineering Center via grant DMR1435999. HAS acknowledges support from NSF grants MCB1344191 and DMS1614907.
Supporting Information (SI)
Contents
- .1 Nucleation theory of the gene drive population waves
- .2 The range of the pushed wave regime with an arbitrary conversion rate
- .3 Spatial evolutionary games in one dimension
- .4 Calculation of the critical propagules in one dimension
- .5 Critical radius and allele concentration in two dimensions
- .6 Line tension, energy difference and analogy with nucleation theory in two dimensions
- .7 Wave velocities of the excitable waves
- .8 Calculation of the speed of the excitable waves
- .9 Critical barrier strength
- .10 Fluctuations due to finite population size
.1 Nucleation theory of the gene drive population waves
Here we identify different parameter regimes of various types of gene drive waves by establishing an analogy between zero temperature nucleation theory and the reaction-diffusion equation of the prescribed mutagenic chain reaction,
[TABLE]
using the methods reviewed in Barton and Turelli (2011). First, we introduce a potential energy function
[TABLE]
and rewrite Eq. S1 as
[TABLE]
It is useful to recast the reaction-diffusion dynamics in terms of a functional derivative
[TABLE]
where the functional is given by
[TABLE]
and we have
[TABLE]
Since always decreases in time,
[TABLE]
plays the role of the free energy in a thermodynamic system.
The potential energy function with various selective disadvantages is plotted in Fig. 3. becomes the absolute minimum when and population waves behave as pushed waves, because both and are locally stable Barton (1979, 1989); Barton and Turelli (2011). The pushed gene drive wave stalls out when the two stable points have the same potential energy (blue curve in Fig. 3). The maximum value of the selective disadvantage supporting the pushed wave of the gene drive allele can be derived by equating , which leads to
[TABLE]
The excitable gene drive wave of primary interest to us thus arises when the selective disadvantage satisfies
[TABLE]
.2 The range of the pushed wave regime with an arbitrary conversion rate
In the main text, we assumed perfect conversion efficiency () of the mutagenic chain reaction. However, in reality, some fraction of the reactions can be unsuccessful and the conversion rate will be . As a result there will be heterozygous individuals with fitness , where controls dominance of the gene drive allele. When , the gene drive allele is dominant and the fitness of the heterozygous genotype is . The choices correspond to the recessive and additive cases respectively. As derived by Unckless et al. Unckless et al. (2015), the reaction term in Eq. 5 is now given by
[TABLE]
There are again three fixed points where the third fixed point is
[TABLE]
Following Unckless et al. (2015), we find that first becomes positive for , where
[TABLE]
For , and the spatial dynamics is again controlled by pulled waves. We can also calculate by recalculating the potential function analogy discussed in SI, Sec A and in the main text,
[TABLE]
and numerically solving for to obtain given , with the results shown in Fig. S1. The gene drive spreads spatially as a pushed excitable wave for . Note that the relevant range of when shrinks compared to .
.3 Spatial evolutionary games in one dimension
In this SI section, we show that genetic waves mathematically quite similar to the pushed gene drive waves studied here arise in spatial evolutionary games of two interacting asexual species that are colored red (“”) and green (“”) using the analogy with nucleation theory introduced in the previous SI section. We start from the continuum description of the one dimensional stepping stone model (following Korolev et al. (2010); Korolev and Nelson (2011)),
[TABLE]
where is the frequency of red species and is the spatial diffusion constant representing migration. The last term, where is an Ito correlated Gaussian white noise source and , proportional to an inverse effective population size, represents genetic drift. We henceforth neglect genetic drift and set this term to zero. The function represents the difference in relative reproduction rates between the two species, and is given by Korolev et al. (2010)
[TABLE]
where and are fitnesses of alleles and . If is a background reproduction rate, we have
[TABLE]
where the interactions between the two competing variants are characterized by constants and . With the definitions above, we have
[TABLE]
which leads to a reaction term similar to that in Eq. 5 and introduces an additional fixed point into the dynamics of Eq. S14 at in addition to . A diagram summarizing the dynamics of this model is shown in Fig. 2. This “phase diagram” was worked out including genetic drift in Eq. S14 which affects the shape and location of the phase transition lines in the first quadrant of Fig. 1. Korolev and Nelson (2011). If the genetic drift term in Eq. S14 is neglected, the lines labelled “DP” in Fig. 2 would coincide with the positive and axes and would merge at the origin. Upon setting in Eq. S14, we employ the argument presented above and define a potential energy function,
[TABLE]
The schematic picture of in different parameter regimes is drawn in Fig. S2. The mutualistic regime () has already been studied in detail, including effects of genetic drift Korolev and Nelson (2011). By studying shapes of the potential energy function we identify two important parameter regimes. In the bistable regime (dark green), there is a finite energy barrier between the two locally stable states and a nucleation process is required to establish an excitable wave.
However, in the Fisher wave regimes (light green and light red), there is no energy barrier to reach the unique stable configuration and thus nucleation is not required. The two regimes are separated by the two black solid lines or , which are limits of metastability. We also draw a solid black line between the two bistable states along , where the pushed waves stall out. This line is analogous to a line of first-order transitions. When , the integral in Eq. S18 for the effective thermodynamic potential is given by
[TABLE]
When , we can simplify
[TABLE]
and the integral gives
[TABLE]
When , and 1\ll\big{|}\frac{g}{\alpha}+\frac{1}{2}\big{|}, we have
[TABLE]
and
[TABLE]
The last term diverges at , but we focus on the weak interaction limit 1\ll\big{|}\frac{g}{\alpha}+\frac{1}{2}\big{|}, where the biologically relevant regime will not be affected. If we substitute into Eq. S19, we recover Eq. S23, as expected.
.4 Calculation of the critical propagules in one dimension
In this SI section, we describe details of the calculation of the critical propagules shown in Fig. 5. Reaction-diffusion equations in one dimension with a general reaction term can be written as
[TABLE]
The critical propagule profile can be defined as a stationary solution of Eq. S24, i.e.,
[TABLE]
Upon multiplying both sides by and integrating we obtain,
[TABLE]
If we assume a symmetric critical propagule about , so that at , we can obtain from
[TABLE]
Since the slope is given by
[TABLE]
we obtain the critical propagule profile by integrating both sides from to . The calculations described above can be carried out analytically for the cubic reaction term Eq. 7 and critical propagules for are plotted in Fig. 5 with dashed lines. For the full MCR equation, the corresponding numerical results are plotted with solid lines.
.5 Critical radius and allele concentration in two dimensions
In practice, it is important to model the distribution of MCR alleles to be released locally to initiate its traveling genetic wave in a two-dimensional space. Upon assuming circular symmetry of the traveling wave solution, the reaction-diffusion equation governing the radial frequency profile of the MCR allele reads in radial coordinates,
[TABLE]
The only correction to the one dimensional case is the derivative term , which can be neglected relative to in the limit of . However, we keep this term in the calculation of the critical nucleus as this term is not negligible where is comparable to or smaller than the width of the excitable wave being launched. In our numerical calculations, instead of a Gaussian initial condition, it is convenient to introduce the gene drive allele with a uniform frequency over a circular region with radius . Indeed, in an actual release of a gene drive organism, it is plausible that the release would be implemented by creating a gene drive concentration in a circular region of radius with a sharp boundary. To model the radial frequency profiles, we used a circularly symmetric steep logistic function as an initial condition,
[TABLE]
instead of a step function to insure numerical stability. Fig. S3 shows the parameter regimes where a pushed wave is excited for various selective disadvantages . The pushed waves successfully launched for initial conditions whose parameters are above the curves , shown for a variety of selective disadvantages in the pushed wave regime.
.6 Line tension, energy difference and analogy with nucleation theory in two dimensions
The scenario studied in the previous section (sharp boundary, adjustable initial drive concentration and inoculation radius ) seems appropriate for many engineered releases of gene drives, at least in situations with large effective population sizes , so that genetic drift can be neglected. (See the discussion of genetic drift in SI Sec. J.)
However, when genetic drift is important, stochastic contributions like the term in, e.g., Eq. S14, can act on spatial gradients at the interfaces of pushed and pulled waves Polechová and Barton (2011, 2015) in a manner somewhat reminiscent of thermal fluctuations near a first-order phase transition. Provided strong genetic drift is able to produce something analogous to local thermal equilibrium after a gene drive release, it is interesting to explore an analogy with classical nucleation theory. Nucleation leads to a pushed wave when . One might then expect the two-dimensional analog of the total energy function discussed in SI Sec. A for an equilibrated circular droplet with and radius in two dimensions to take the form
[TABLE]
where we have assumed a sharp interface between saturated gene drive and wild-type states. Here, , the “energy” difference between the gene drive and wild type, causes the droplet to expand, and the role of an energy barrier to nucleation is played by the line tension term Barton and Hewitt (1985). This is indeed the case. For simplicity, we illustrate the nucleation approach with the cubic reaction term given by Eq. 7 in the main text.
First, we assume the logistic form of the spatial profile derived in the 1d limit by Barton and Turelli Barton and Turelli (2011)
[TABLE]
and the line tension term is
[TABLE]
in the limit of . The energy difference is given by
[TABLE]
and the critical radius of the nucleus which corresponds to the saddle point barrier of the free energy landscape is
[TABLE]
as plotted in Fig. S4. This result shows the divergence of in the limit of and the above approximation () becomes exact in this limit. The diverging shown in Fig. S4 is qualitatively consistent with the behavior found for the simplified gene drive initial condition in two dimensions shown in Fig. S3 in the limit
.7 Wave velocities of the excitable waves
The reaction-diffusion equation admits traveling wave solutions with a continuous family of velocities. It selects the slowest speed asymptotically in the large time limit Van Saarloos (2003). The pink circular dots in Fig. S5 are numerically calculated asymptotic wave velocities for the MCR model in the pushed wave regime. We also plot the known wave velocity for the cubic approximation Barton (1979, 1989); Barton and Turelli (2011) for comparison. Due to the larger reaction term (see discussion in Fig. 5), the wave velocity for the MCR model is always faster than the cubic approximation given the same selective disadvantage . In both cases, a larger selective disadvantage decreases the wave velocity, which eventually becomes zero at for the MCR model and the slightly smaller value within the cubic approximation.
.8 Calculation of the speed of the excitable waves
In this section, we review the numerical method for calculating the speed of the excitable waves, following Barton and Turelli (2011). First, we assume a traveling waveform of the solution
[TABLE]
with boundary conditions
[TABLE]
By substituting into
[TABLE]
we obtain
[TABLE]
If we define the gradient as a function of , we arrive an ordinary differential equation
[TABLE]
with boundary conditions
[TABLE]
It is known that there exists a unique velocity of the excitable wave that has solution of the above differential equation with the boundary condition Keener and Sneyd (1998). We used a shooting method to determine such and plotted the results in Fig. S5.
.9 Critical barrier strength
Fig. S6 shows how the excitable wave can be slowed down and finally stopped by increasing the strength of a selective disadvantage barrier . As a reference, we first show dynamics of the excitable wave without a barrier ( matches the selective disadvantage outside) in Fig. S6A. When a small barrier is erected (), the excitable wave significantly slows down within the barrier as expected from the results shown in Fig. S5. However, the wave recovers and propagates through the barrier as in Fig. S6B. When the barrier strength exceeds a critical value (in Fig. S6C we plot the case ) the excitable wave is stopped.
In Fig. S7, we plot the critical width and selective disadvantage within the one dimensional barrier region just sufficient to stop the excitable population wave of the gene drive species. The values are numerically obtained by placing the barrier in a region . For example, when the selective disadvantage outside the barrier region is set to be , the excitable gene drive wave can be stopped by increasing by within the barrier region of thickness .
.10 Fluctuations due to finite population size
In this section, we estimate effects of fluctuations due to a finite population size using mosquitos as an example. First, we define the effective spatial population size to be the number of mosquitos with which an individual might conceivably mate during its generation time Hartl and Clark (1997). Given a diffusion constant , the two dimensional area an individual can explore during its life time is and the effective population size in two dimensions is
[TABLE]
where is the area density of organisms. Here, we estimate using parameters appropriate to mosquitos: Deredec et al. (2011), and to get . With such a large effective population size, we believe that the dynamics can be well described by the deterministic limit explored here. Fluctuations can play a role for systems with smaller populations and such effects have been thoroughly investigated in the physics literatures Brunet and Derrida (1997); Van Saarloos (2003); Brunet and Derrida (2015); Cohen et al. (2005); Hallatschek and Korolev (2009). Pulled waves are more sensitive to fluctuations, with a Fisher wave velocity that changes according to
[TABLE]
where is the velocity of the pulled wave in the deterministic limit Brunet and Derrida (1997).
The reference list from the paper itself. Each links out to its DOI / PubMed record.
- 1Cong et al. (2013) L. Cong, F. A. Ran, D. Cox, S. Lin, R. Barretto, N. Habib, P. D. Hsu, X. Wu, W. Jiang, L. A. Marraffini, et al. , Science 339 , 819 (2013).
- 2Jinek et al. (2013) M. Jinek, A. East, A. Cheng, S. Lin, E. Ma, and J. Doudna, Elife 2 , e 00471 (2013).
- 3Mali et al. (2013) P. Mali, L. Yang, K. M. Esvelt, J. Aach, M. Guell, J. E. Di Carlo, J. E. Norville, and G. M. Church, Science 339 , 823 (2013).
- 4Wright et al. (2016) A. V. Wright, J. K. Nuñez, and J. A. Doudna, Cell 164 , 29 (2016).
- 5Marraffini (2015) L. A. Marraffini, Nature 526 , 55 (2015).
- 6Jiang and Marraffini (2015) W. Jiang and L. A. Marraffini, Annu Rev Microbiol 69 , 209 (2015).
- 7Alphey (2014) L. Alphey, Annu Rev Entomol 59 , 205 (2014).
- 8Burt (2014) A. Burt, Philos Trans R Soc Lond B Biol Sci 369 , 20130432 (2014).