Multiphoton-Excited Fluorescence of Silicon-Vacancy Color Centers in Diamond
James M. Higbie, John D. Perreault, Victor M. Acosta, Chinmay, Belthangady, Paul Lebel, Moonhee H. Kim, Khoa Nguyen, Vasiliki Demas, Vikram, Bajaj, Charles Santori

TL;DR
This study measures the two-photon fluorescence cross section of silicon-vacancy centers in diamond, demonstrating their potential for deep tissue biological imaging with lower detection thresholds compared to nitrogen vacancy centers.
Contribution
It provides the first measurement of the two-photon excitation cross section of SiV centers and compares their performance to NV centers, highlighting their advantages for bioimaging.
Findings
Measured two-photon fluorescence cross section of SiV$^-$ in diamond.
Found SiV centers have over an order of magnitude lower detection threshold than NV centers.
Observed increase in two-photon cross section with decreasing wavelength.
Abstract
Silicon-vacancy color centers in nanodiamonds are promising as fluorescent labels for biological applications, with a narrow, non-bleaching emission line at 738\,nm. Two-photon excitation of this fluorescence offers the possibility of low-background detection at significant tissue depth with high three-dimensional spatial resolution. We have measured the two-photon fluorescence cross section of a negatively-charged silicon vacancy (SiV) in ion-implanted bulk diamond to be at an excitation wavelength of 1040\,nm. In comparison to the diamond nitrogen vacancy (NV) center, the expected detection threshold of a two-photon excited SiV center is more than an order of magnitude lower, largely due to its much narrower linewidth. We also present measurements of two- and three-photon excitation spectra, finding an increase in the two-photon cross…
Click any figure to enlarge with its caption.
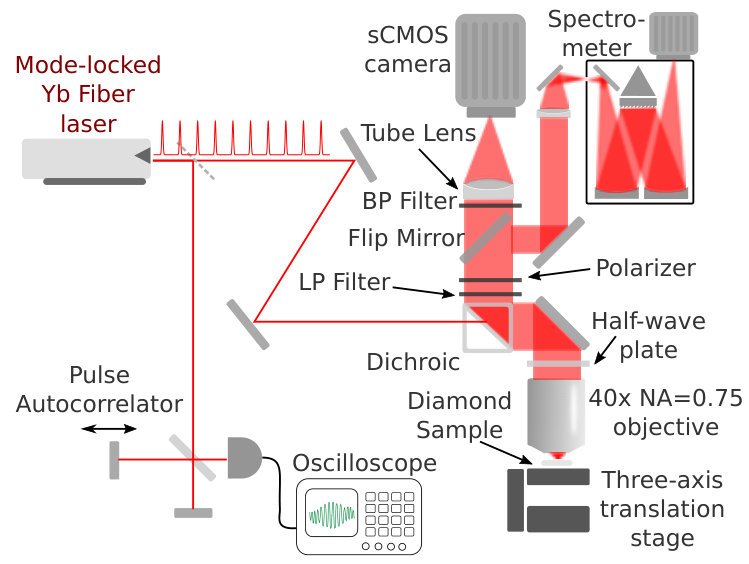 Figure 1
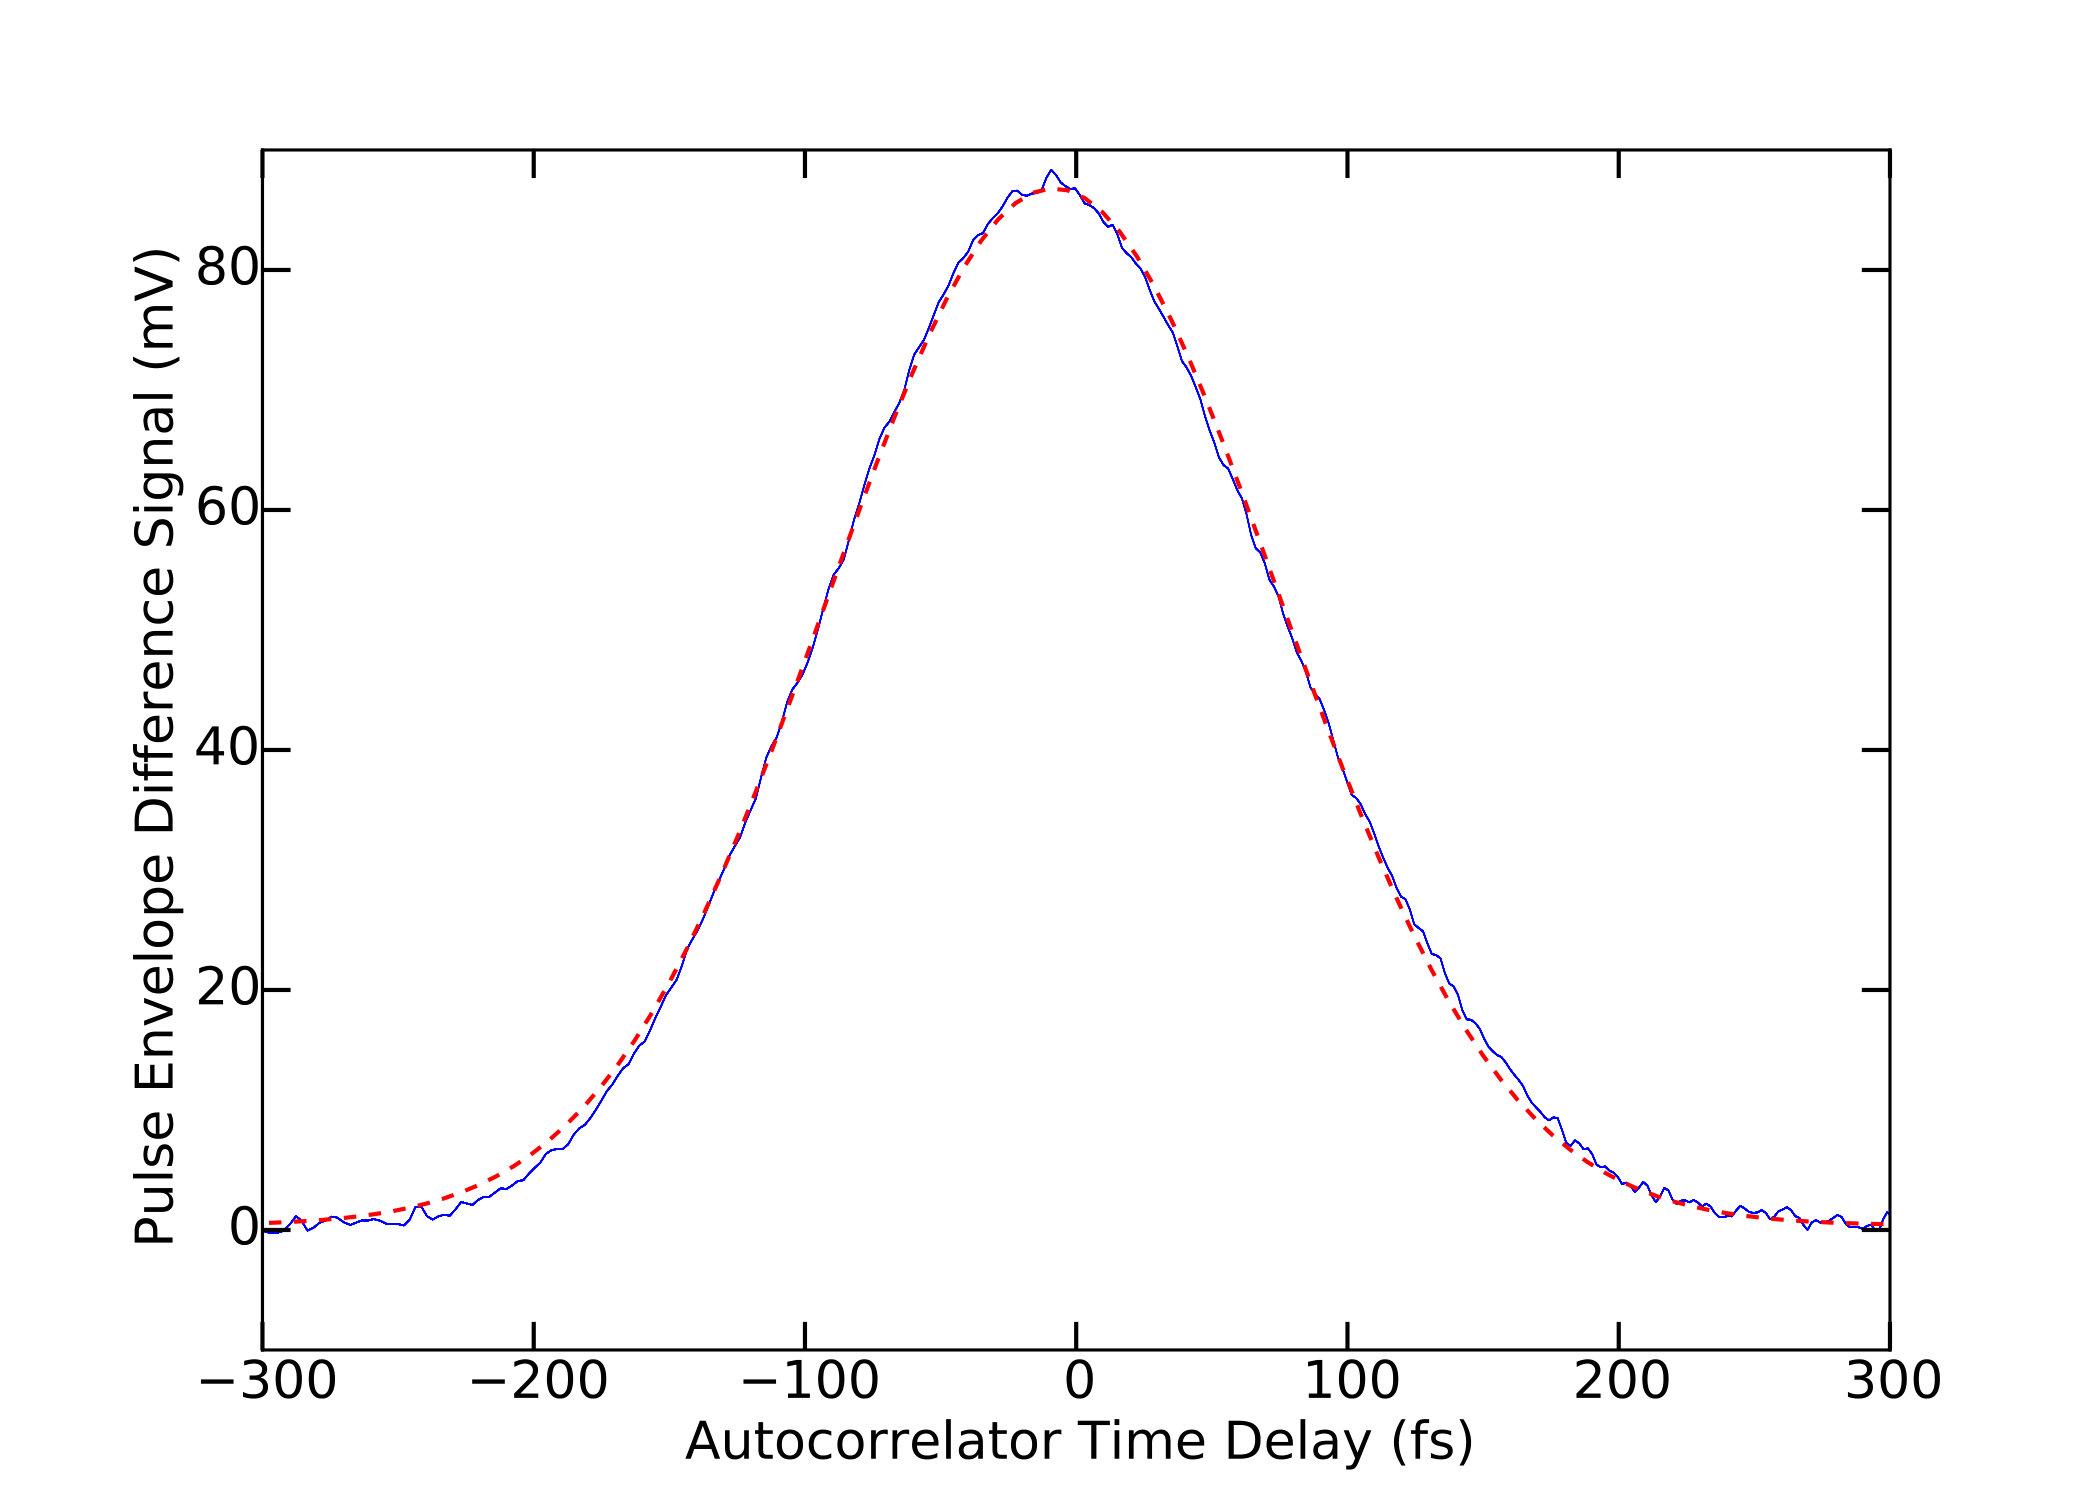 Figure 2
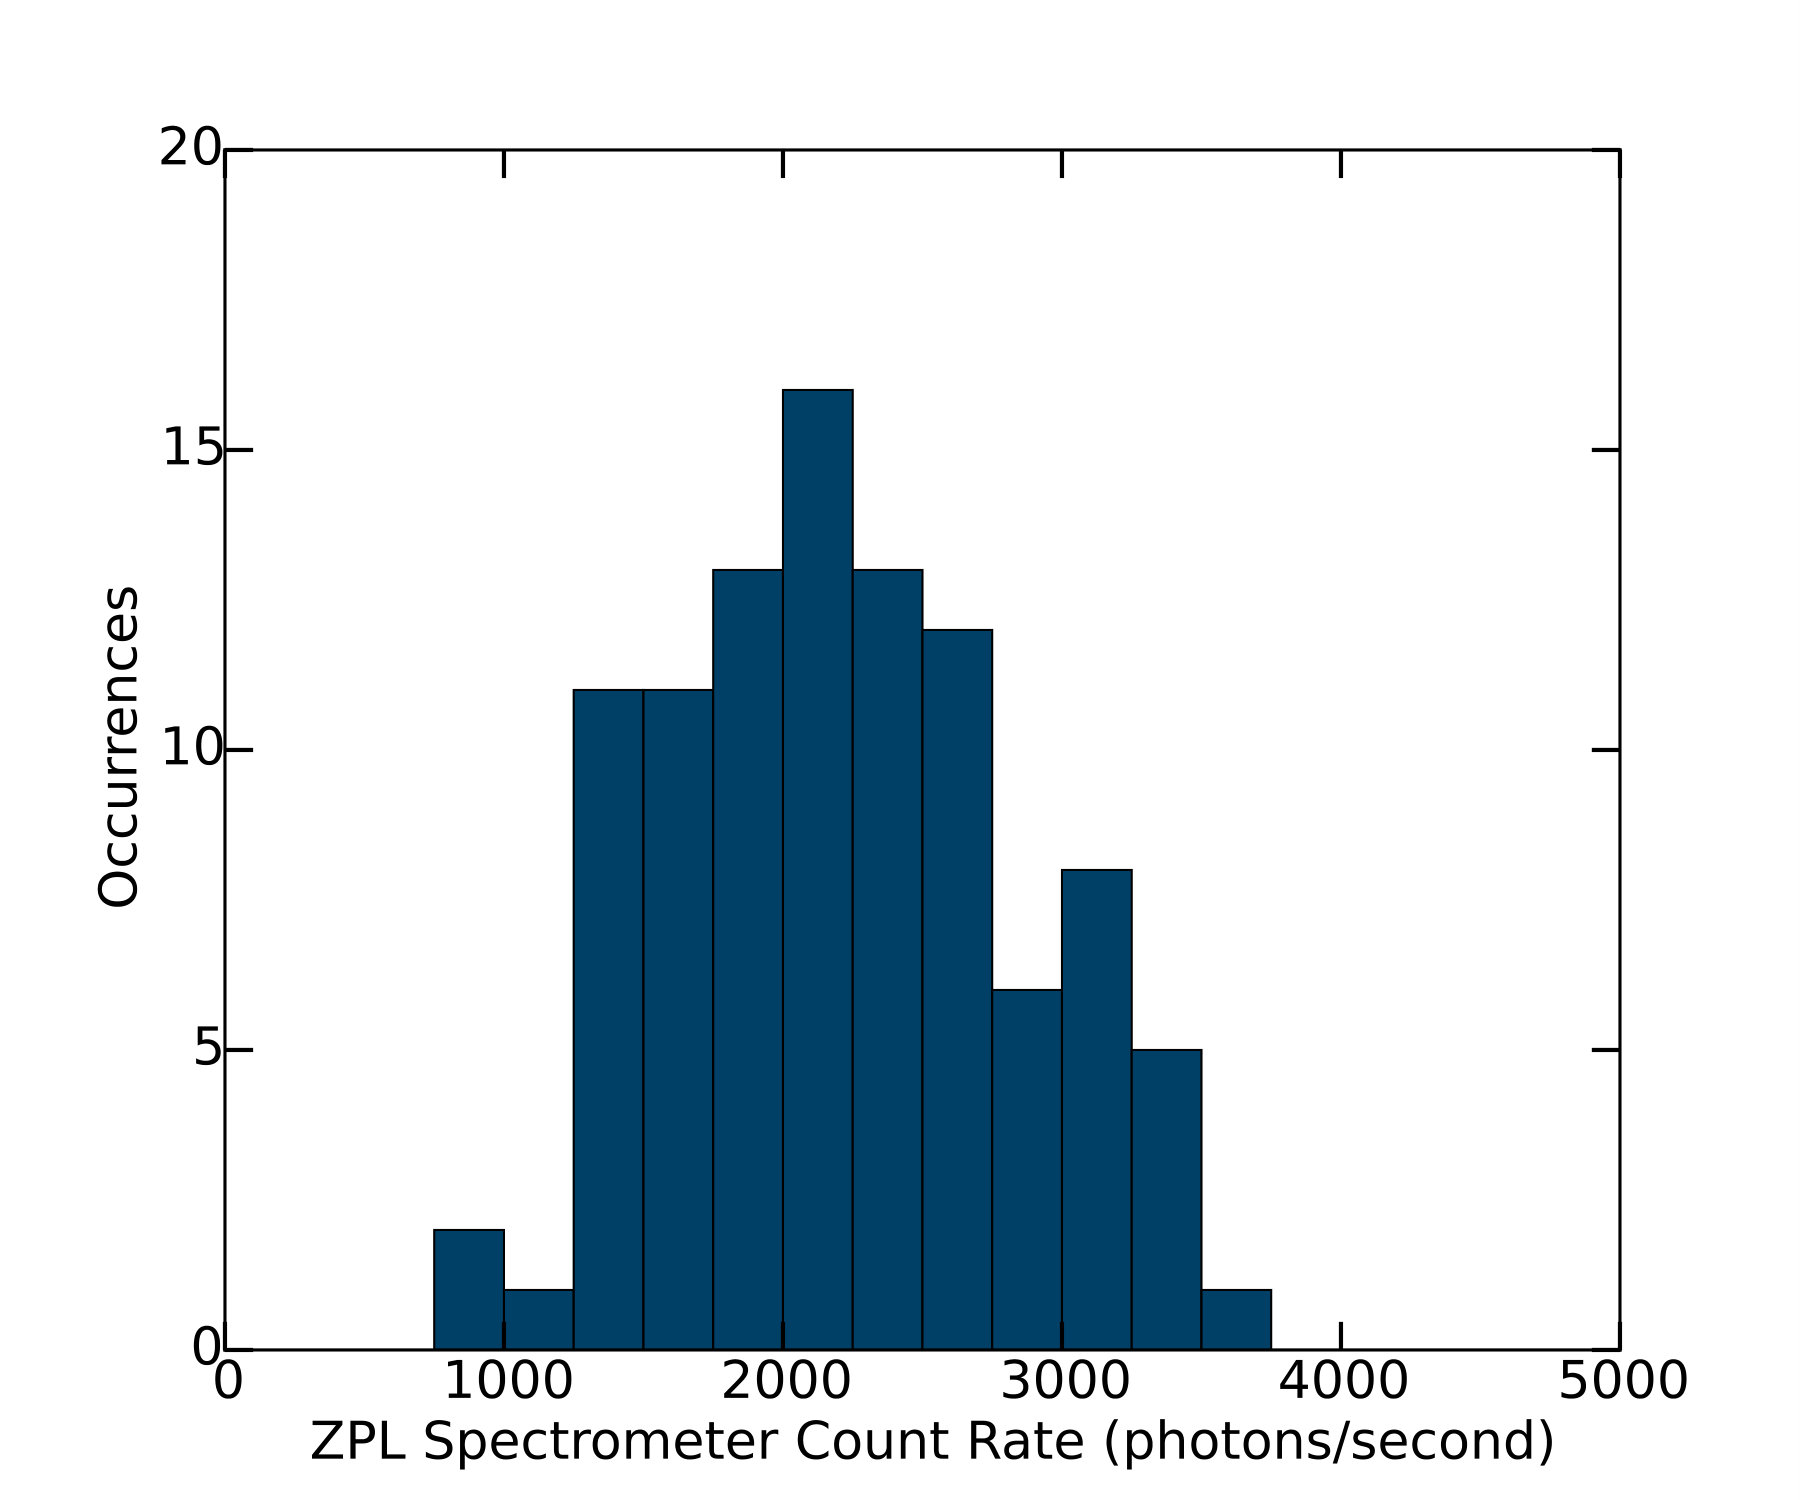 Figure 3
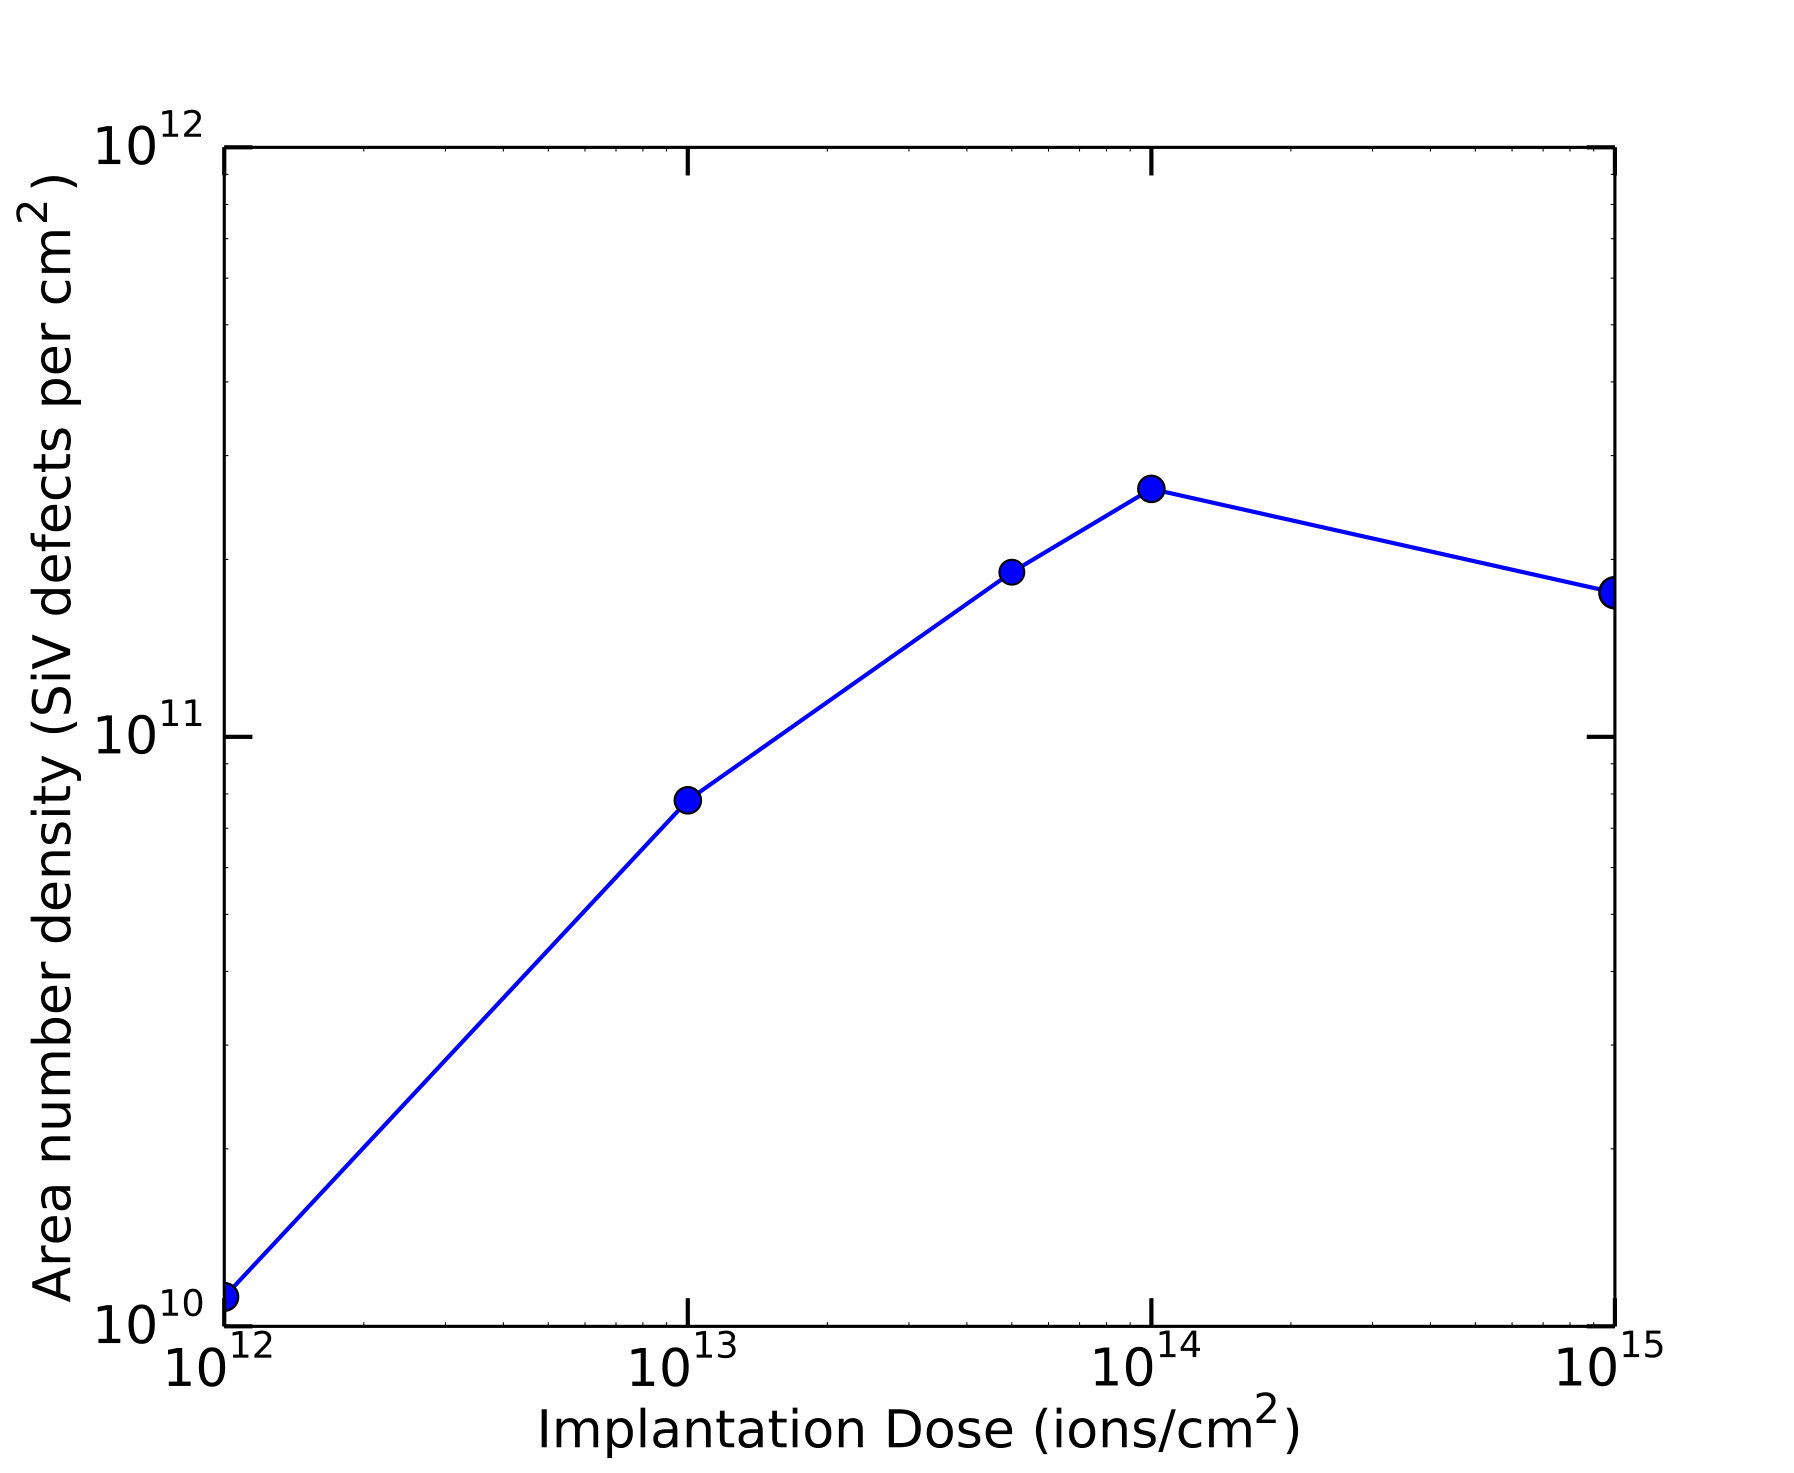 Figure 4
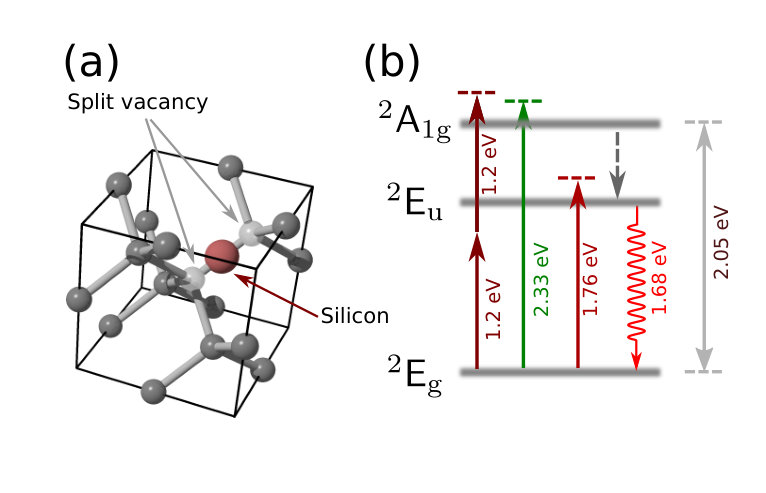 Figure 5
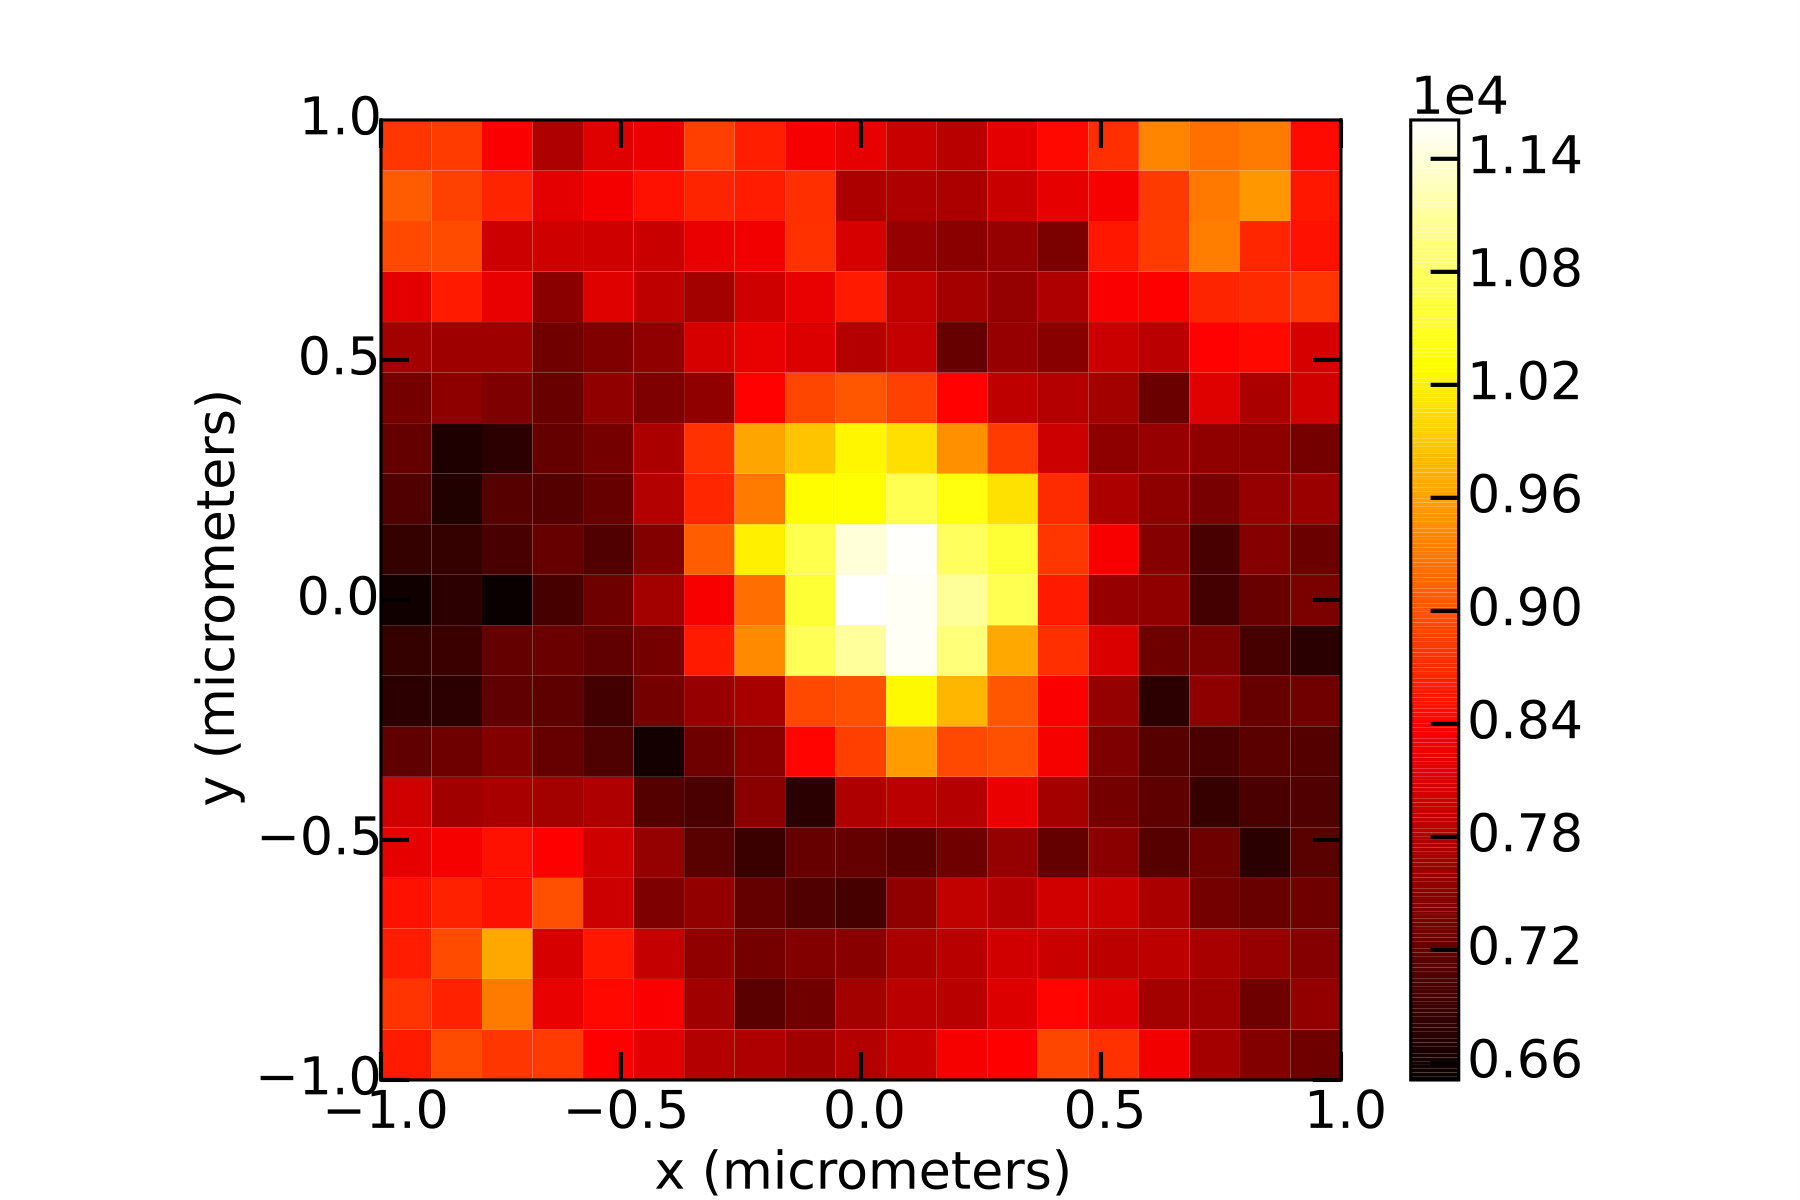 Figure 6
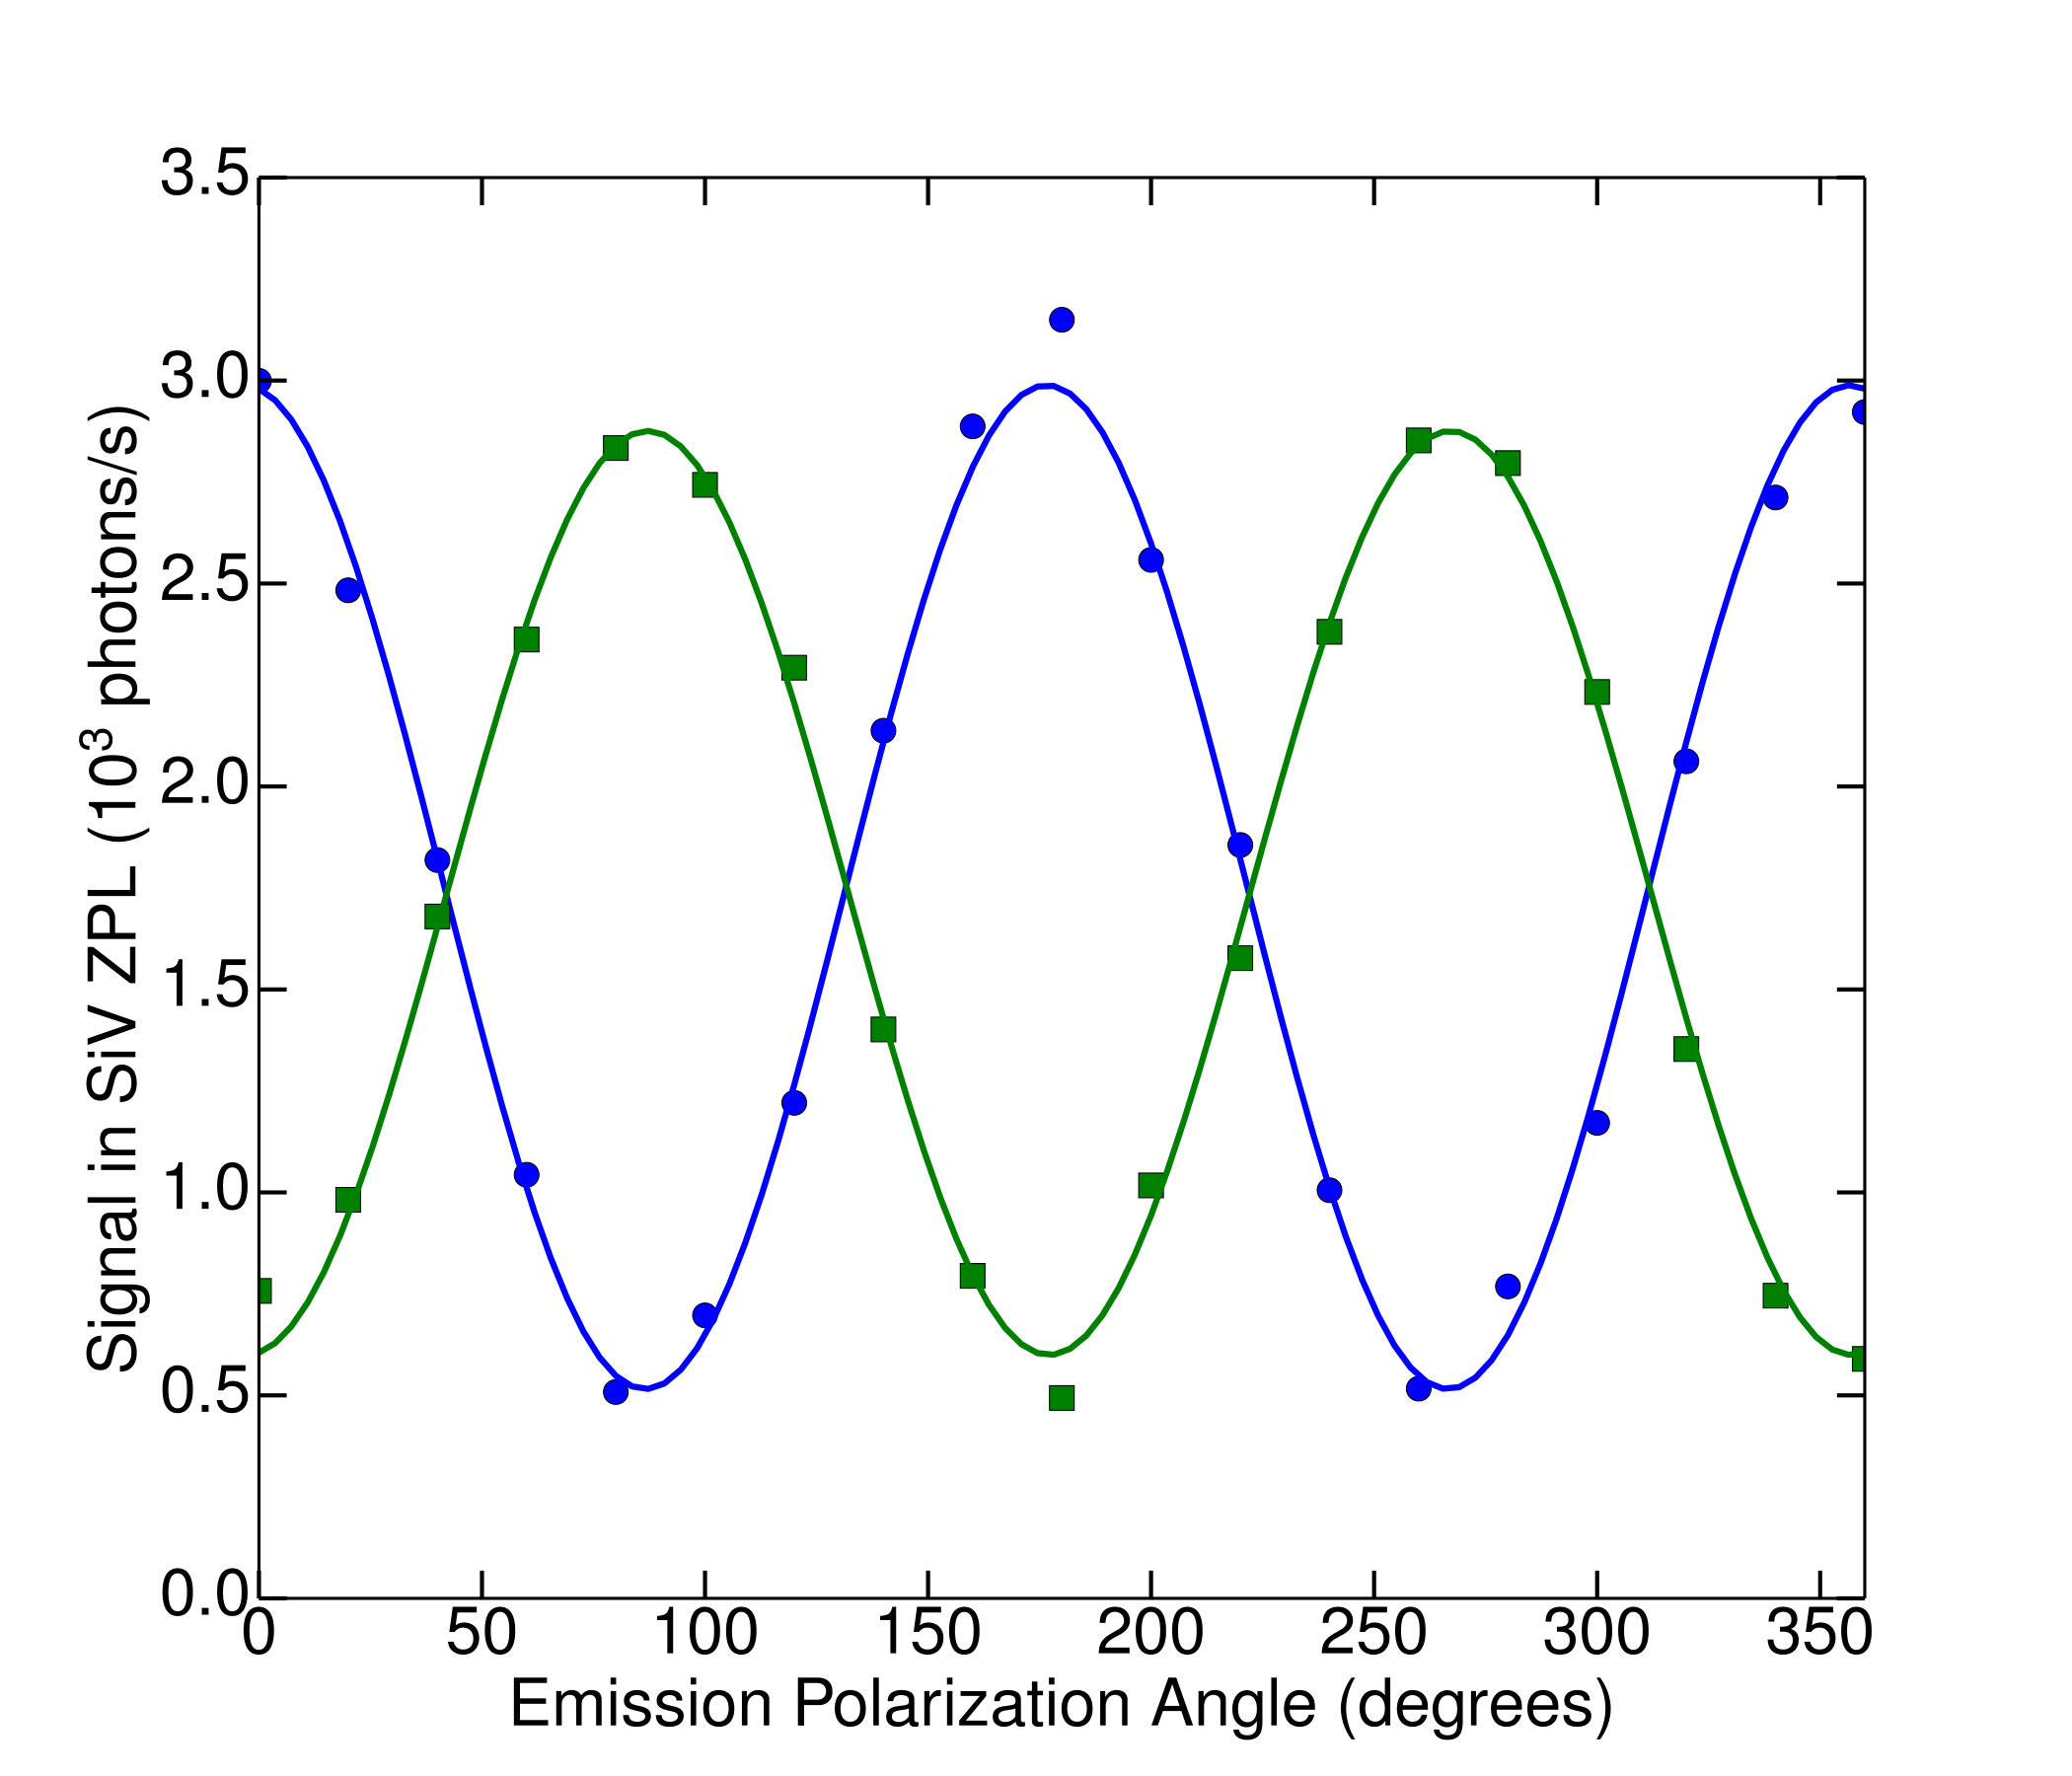 Figure 7
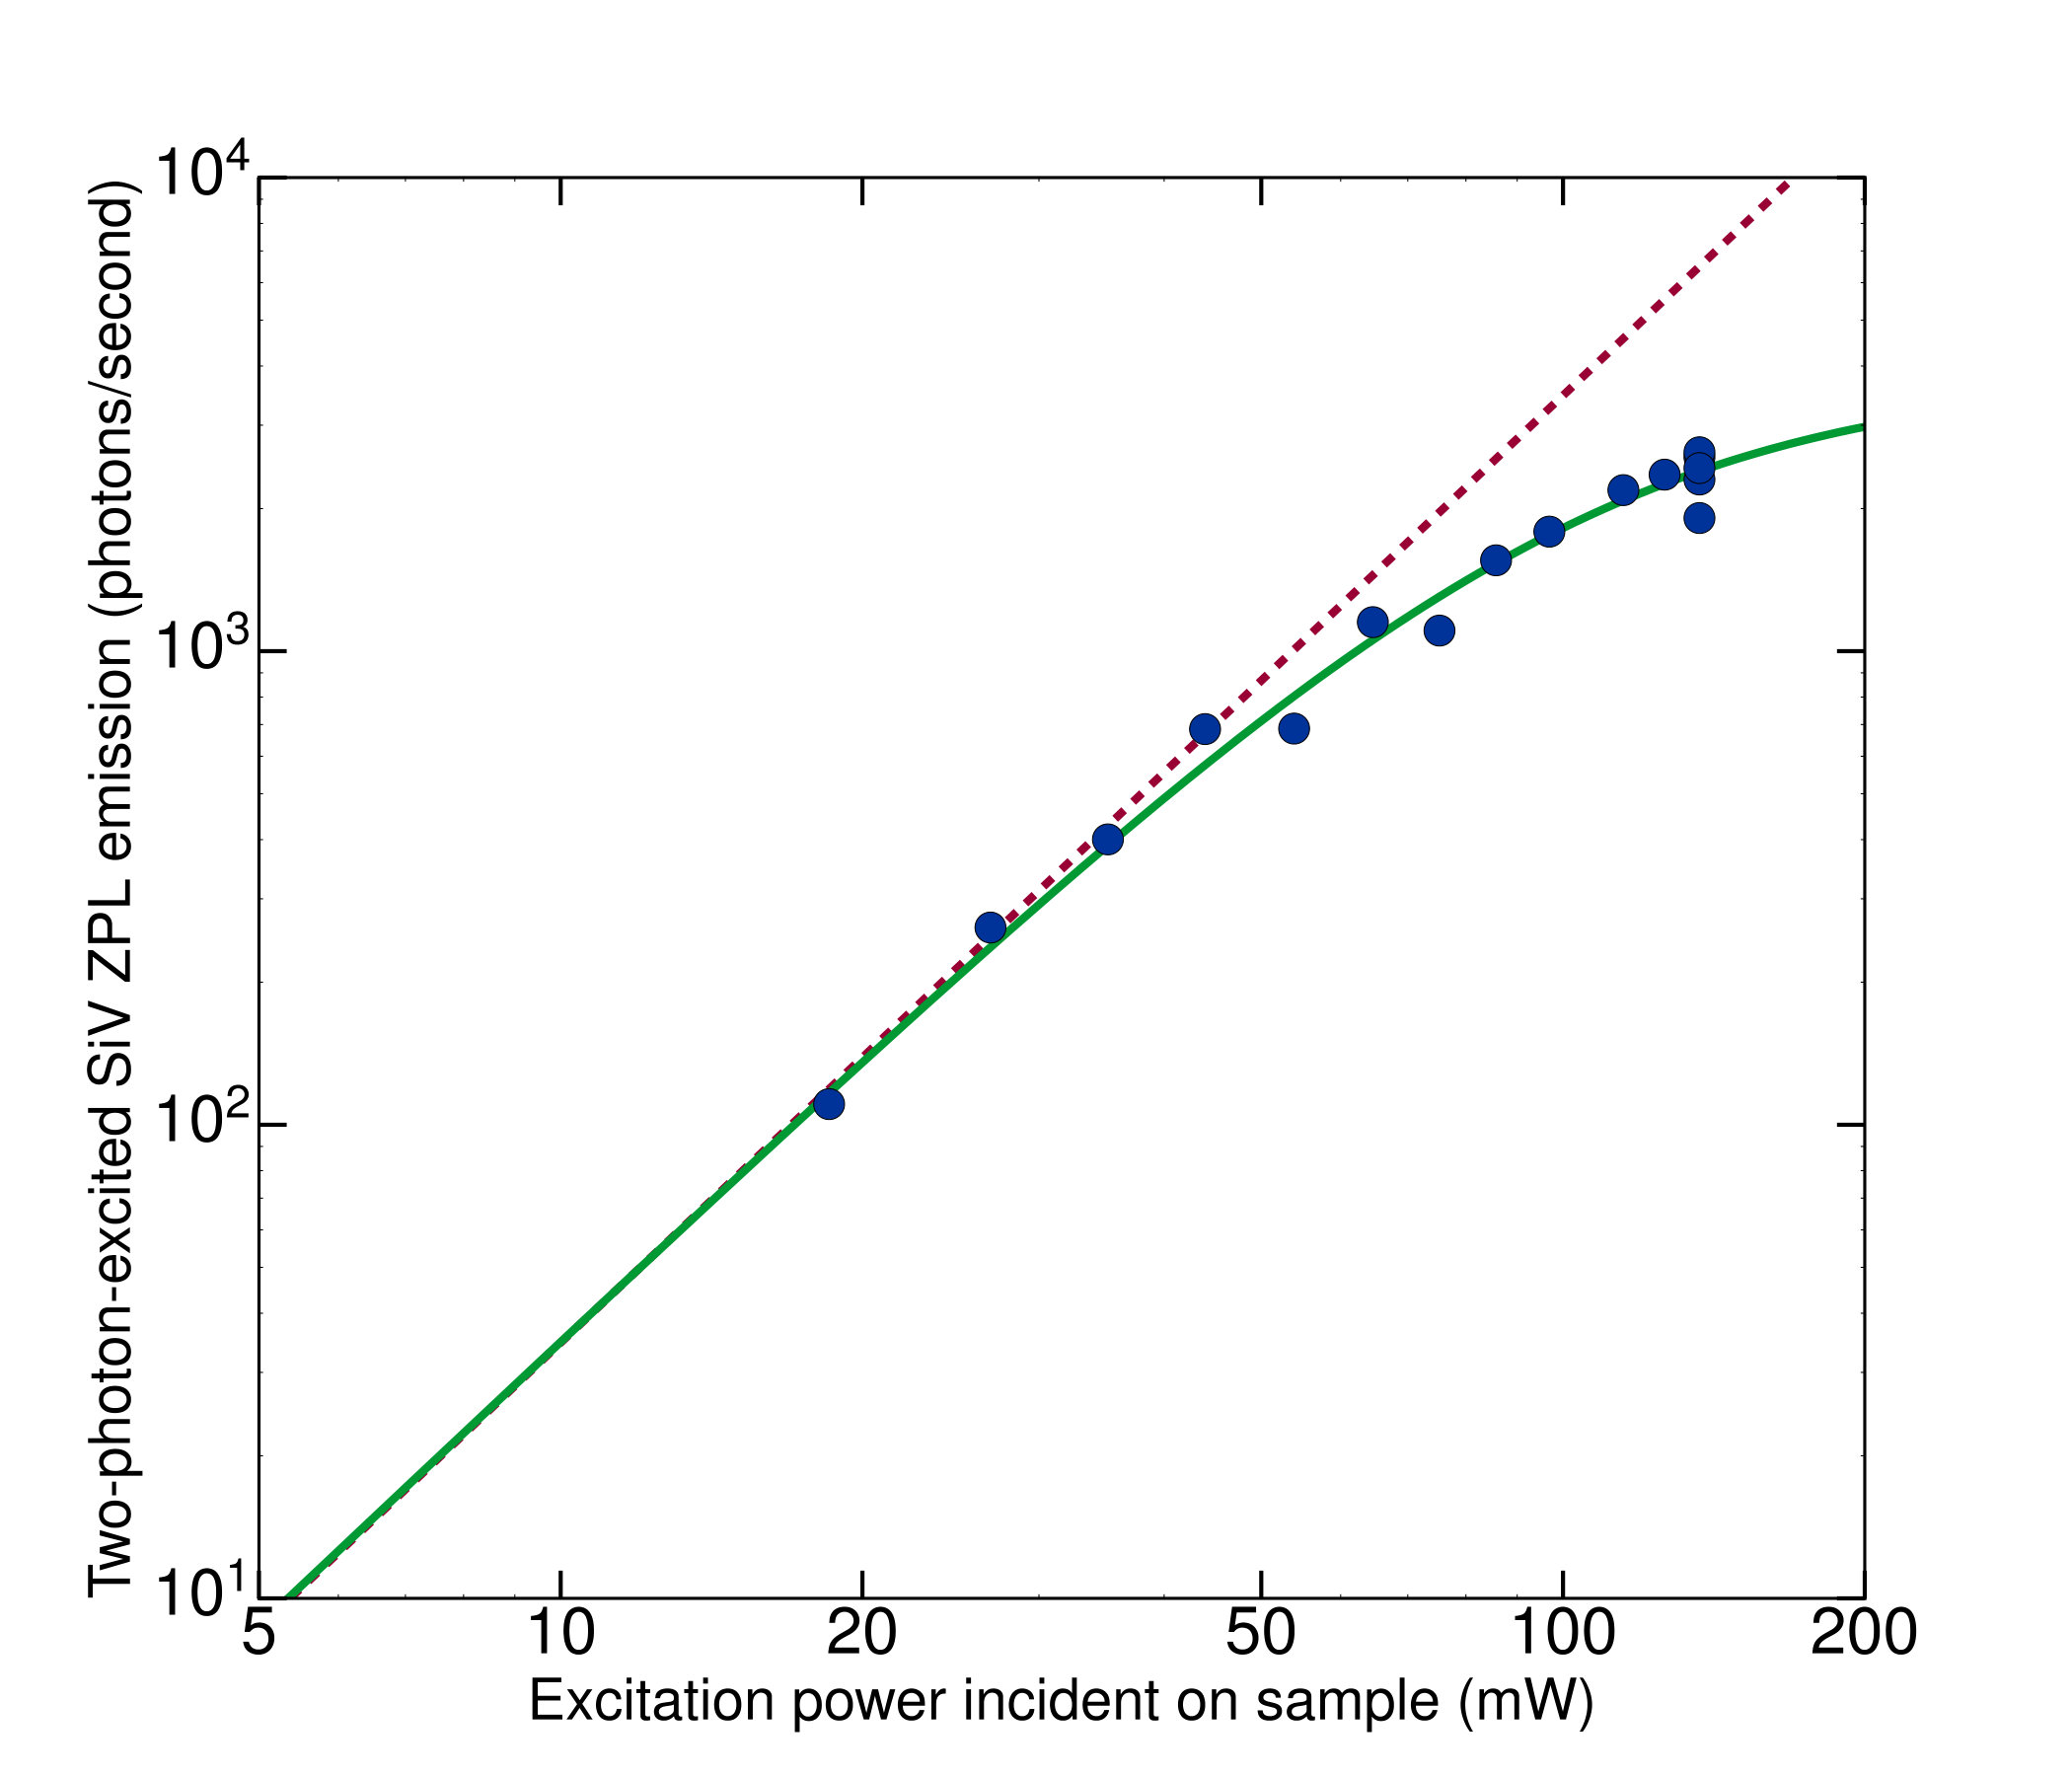 Figure 8
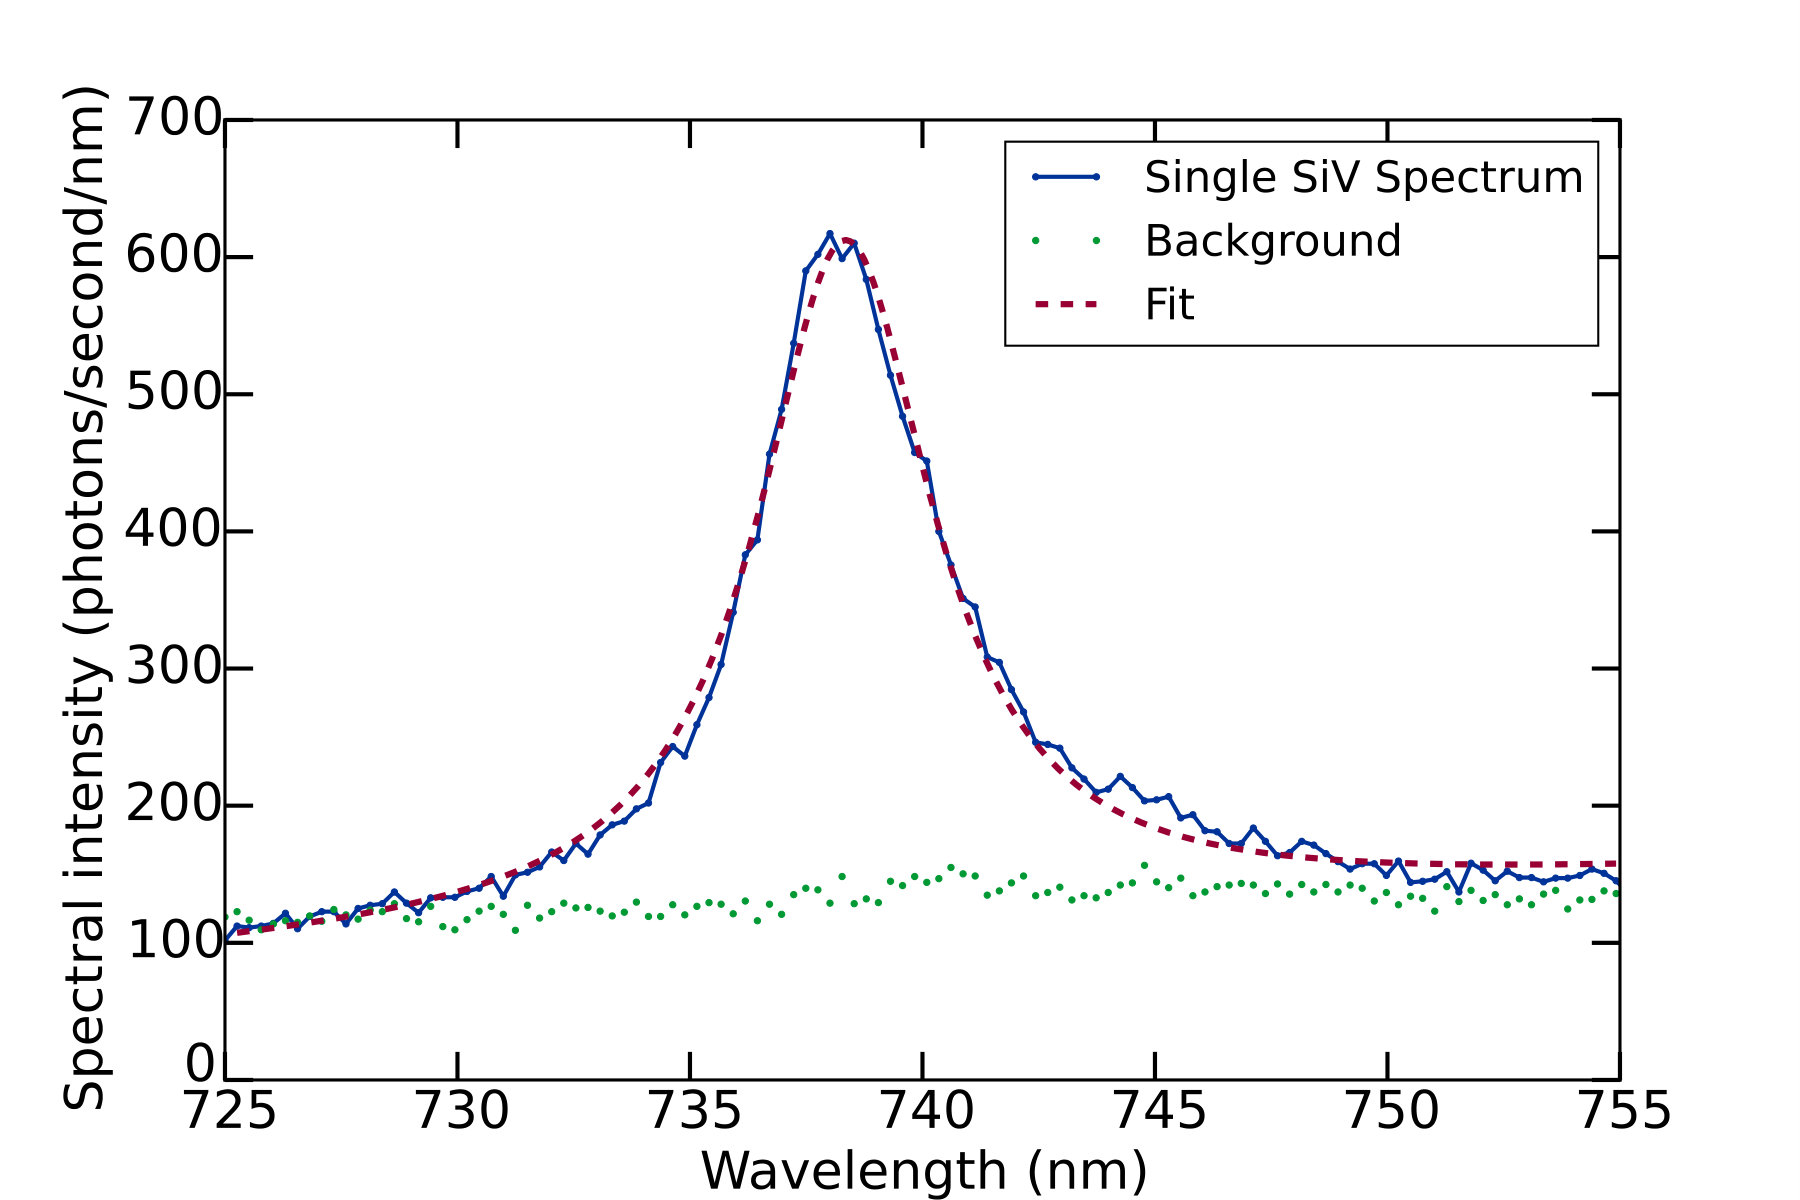 Figure 9
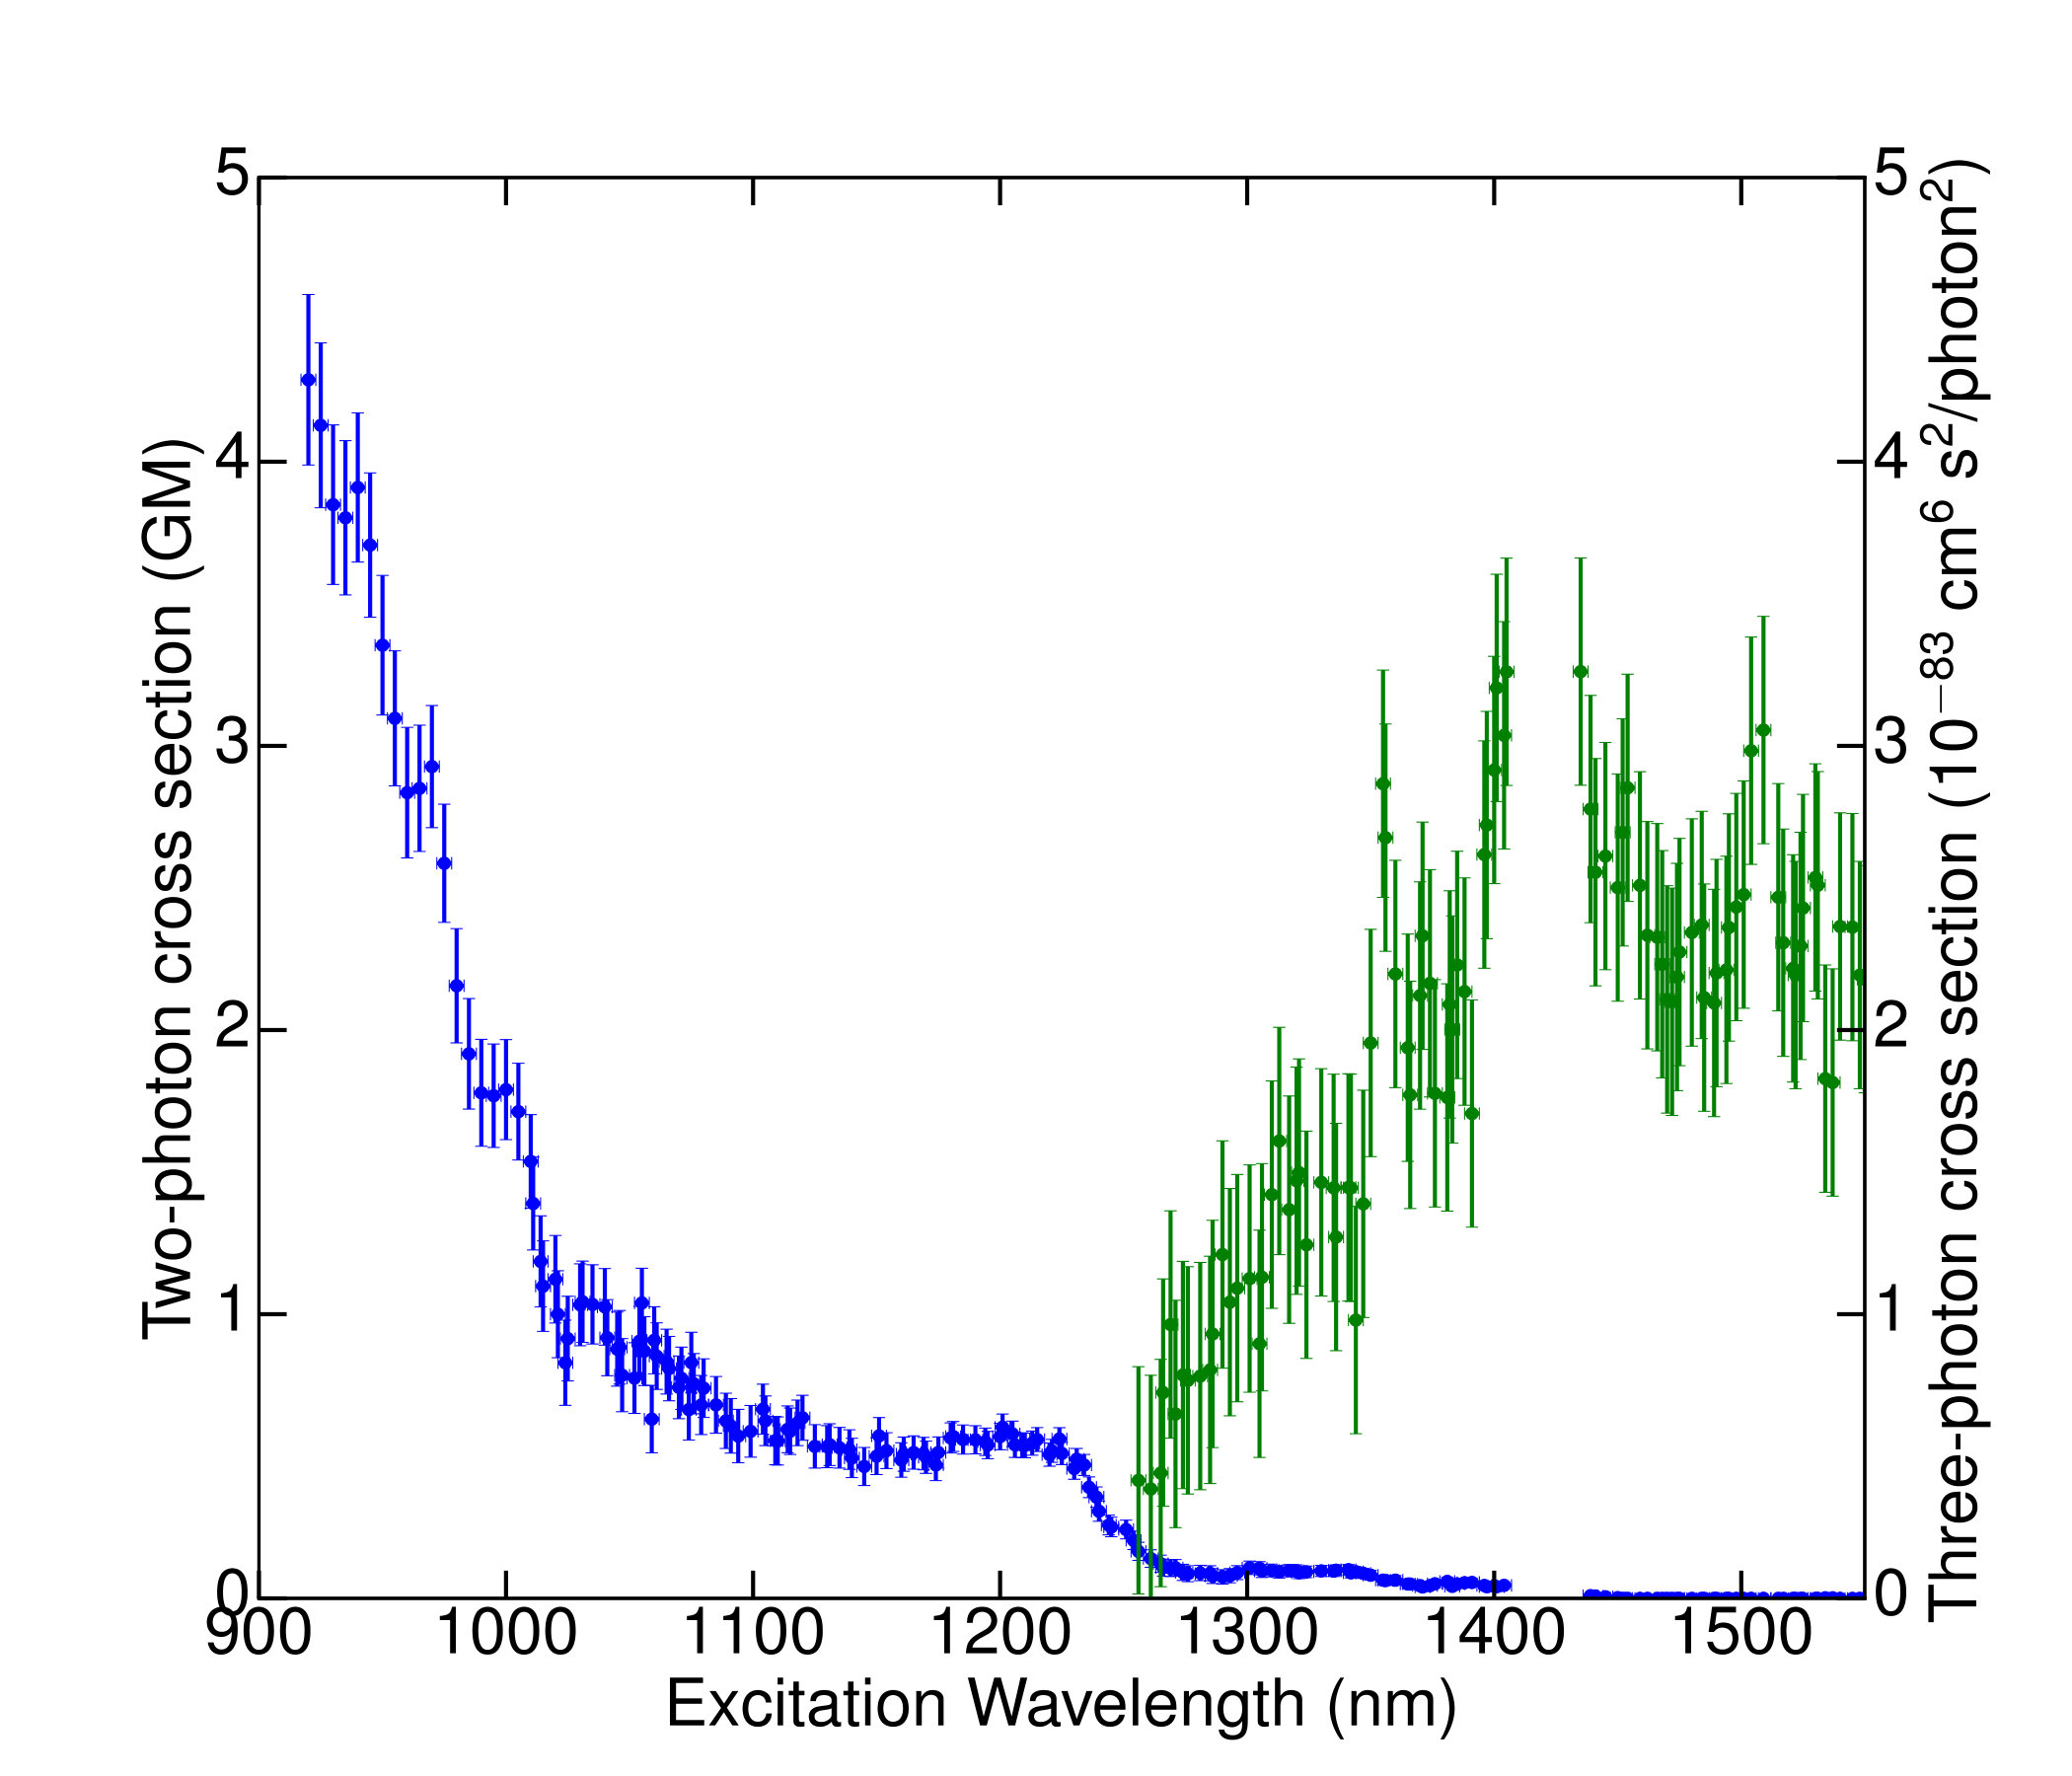 Figure 10
| Measured | Value | Partial |
| Quantity | Uncertainty (GM) | |
| XX | XX6.4 | |
| XX | XX8.9 | |
| XX | XX3.6 | |
| XX | XX12.9 | |
| XX | XX5.5 | |
| XX | XX4.2 | |
| Total: | XX19.0 |
Peer Reviews
No public reviews on file for this paper yet. If you reviewed it on a platform where reviews are public (OpenReview, ICLR, NeurIPS, ICML), you can paste yours below so the community can read it here.
Videos
No videos yet. Explain this paper in a talk, walkthrough, or lecture? Add one.
Multiphoton-Excited Fluorescence of Silicon-Vacancy Color Centers in Diamond
J. M. Higbie
J. D. Perreault
Verily Life Sciences, Mountain View, CA
V. M. Acosta
University of New Mexico, Albuquerque, NM
C. Belthangady
Verily Life Sciences, Mountain View, CA
P. Lebel
M. H. Kim
K. Nguyen
V. Demas
V. Bajaj
C. Santori
Verily Life Sciences, Mountain View, CA
Abstract
Silicon-vacancy color centers in nanodiamonds are promising as fluorescent labels for biological applications, with a narrow, non-bleaching emission line at 738 nm. Two-photon excitation of this fluorescence offers the possibility of low-background detection at significant tissue depth with high three-dimensional spatial resolution. We have measured the two-photon fluorescence cross section of a negatively-charged silicon vacancy (SiV-) in ion-implanted bulk diamond to be at an excitation wavelength of 1040 nm. In comparison to the diamond nitrogen vacancy (NV) center, the expected detection threshold of a two-photon excited SiV center is more than an order of magnitude lower, largely due to its much narrower linewidth. We also present measurements of two- and three-photon excitation spectra, finding an increase in the two-photon cross section with decreasing wavelength, and discuss the physical interpretation of the spectra in the context of existing models of the SiV energy-level structure.
I Introduction
Color centers in diamond have been the focus of intense interest in recent years. The nitrogen-vacancy (NV) color center in diamond has driven much of this interest, thanks to numerous promising applications including nano-scale magnetometry balasubramanian2008nanoscale ; maze2008nanoscale ; taylor2008high ; acosta2010broadband ; maletinsky2012robust , NMR spectroscopy mamin2013nanoscale ; staudacher2013nuclear , quantum information dutt2007quantum ; neumann2008multipartite ; santori2010nanophotonics ; fuchs2011quantum ; faraon2012coupling ; childress2013diamond , and use as fluorescent bio-labels vaijayanthimala2012long ; igarashi2012real . More recently, the silicon-vacancy (SiV) color center in diamond, which has been known for over two decades sternschulte19941 ; clark1995silicon ; goss1996twelve , has generated increasing excitement rogers2014electronic ; neu2013low ; neu2012photophysics ; hepp2014electronic because of properties that are in some respects even more favorable than those of the nitrogen-vacancy defect, such as a narrow zero-phonon line (ZPL) sternschulte19941 and weak phonon side-bands at room temperature collins1994annealing . This concentrated emission in a narrow ZPL allows detection of silicon-vacancy-containing diamonds at higher signal-to-noise ratios, and raises the possibility that silicon-vacancy-doped nanodiamonds bound to specific biomolecular targets could be detectable in the presence of high autofluorescence background, e.g. in deep and/or highly scattering biological tissue.
Specifically targeted nanoparticle probes that can be detected through millimeters of intervening tissue promise to be an enabling technology for minimally invasive in-vivo molecular imaging, with potential applications in biomarker discovery, studies of immune cell trafficking and circulating tumor cells, elucidation of molecular pathways in pre-clinical models, drug development, and possibly ultimately in clinical diagnosis. Towards these ends, various combinations of nanoparticle type and detection modality have been investigated, including superparamagnetic nanoparticles detected via MRI lee2007artificially , fluorescence imaging of dyes ntziachristos2003fluorescence , quantum dots gao2005vivo ; michalet2005quantum , and nanodiamonds chung2006spectroscopic ; mohan2010vivo , and surface-enhanced Raman (SERS) particles qian2008vivo ; zavaleta2009multiplexed .
Two-photon excited fluorescence imaging is particularly appealing for deep-tissue imaging because of its high spatial resolution, natural longitudinal sectioning, low background, and because the longer excitation wavelengths typically used allow enhanced penetration and lower phototoxicity in tissue helmchen2005deep . These advantages have led to significant application of two-photon imaging in neuroscience svoboda2006principles , and will likely be important in other areas involving high spatial-resolution imaging through scattering tissue. While two-photon labels such as organic dyes and fluorescent proteins achieve very high brightness xu1996measurement ; drobizhev2011two , SiVs are likely to offer distinct advantages thanks to their narrow emission bandwidth and lack of bleaching. A further unique feature of the silicon-vacancy color center is the circumstance that the excitation can be within the second near-IR transmission window of tissue (around 1040 nm) and the emission (around 738 nm) within the first transmission window (see, e.g., Ref. smith2009bioimaging ). Song et al.song2014plasmon have previously observed a quadratic dependence of 830 nm-excited silicon vacancies coupled to the plasmon resonances of gold nano-ellipsoids, attributable to two-photon excitation. A quantitative measure of the strength of two-photon-excited fluorescence, however, has not previously been obtained for the SiV defect. Here we present the first report of the two-photon fluorescence cross section of the negatively-charged silicon vacancy (SiV-) color center in diamond. Based on the results, we evaluate the prospects of SiV nanodiamond as a contrast agent for biological labeling applications, in particular for in-vivo and deep-tissue imaging, where strong background fluorescence and low photon collection efficiency must be overcome.
II Background
The structure of the SiV- color center has been elucidated in recent years through a number of contributions goss1996twelve ; batalov2009low ; neu2013low ; hepp2014electronic ; rogers2014electronic . The color center consists of a single silicon atom located midway between two adjacent vacant carbon lattice sites (vacancies), as shown in Fig. 1; this configuration possesses trigonal symmetry. A level diagram tentatively suggested by Rogers et al. rogers2014electronic is given in Fig. 1, showing ground and excited states relevant to the present work. Excitation of the defect from the ground state to the excited state can be achieved either directly or else indirectly via higher-lying levels such as the state, combined with subsequent (presumed non-radiative) relaxation. The defect then returns to the ground state by emission of a 1.68 eV (738 nm) photon. An unusually large portion of the emitted radiation is in the narrow zero-phonon line, improving the signal-to-noise ratio with which the color center can be detected.
The two-photon fluorescence cross section for a single point fluorophore is defined by the relation
[TABLE]
where is the fluorescence photon emission rate, is the excitation intensity at the fluorophore, conventionally measured in units of photon number per area per time, and angle brackets indicate time averaging over an interval significantly greater than the excited-state decay time. In practice, one measures not the total emission rate, but the quantity , where the detection efficiency includes the fraction of light collected by the microscope objective and the transmission of all optical components in the detection path.
Because a pulsed laser must typically be used to obtain appreciable two-photon-excited fluorescence, we must further relate the mean square intensity appearing in Eq. 1 to the more readily measurable mean intensity. Specifically, we consider excitation via a periodic pulse train with a temporal profile that is well approximated by a sum of gaussian-envelope pulses,
[TABLE]
where is the intensity at the the laser focus, is the temporal peak intensity, is the repetition period, and defines the pulse width. The time average of the intensity and the square intensity over a time long compared to the repetition period, neglecting overlap of distinct pulses, are readily calculated by integration, and obey the relation
[TABLE]
Moreover, the intensity at the laser focus is related to the total laser power by
[TABLE]
Here is the area defined by the excitation point-spread function , i.e.,
[TABLE]
with the unit-maximum point-spread function in turn defined by the relation, .
Thus for such a pulse train, the average detection rate of photons emitted by a single color center at the focus of the laser beam is given by
[TABLE]
where the time-average intensity at the focus is given in terms of the time-average excitation power by . For an isolated color center, then, the two-photon cross section is related to measurable quantities by the equation
[TABLE]
where is an empirically determined saturation factor (described more fully below) accounting for any deviation of the intensity dependence from the strictly quadratic dependence of Eq. 1.
III Experimental Apparatus
The experimental apparatus (illustrated in Fig. 2) consisted of a two-photon epifluorescence microscope to excite and detect silicon-vacancy color centers in a diamond sample. Excitation light was derived from a mode-locked 1040nm ytterbium fiber laser (Menlo Orange) producing fs (full-width at of maximum) pulses at a repetition rate of 100 MHz with an average power of around 300 mW. The excitation light was focused via a , NA=0.75 air-spaced objective into a diamond sample mounted on a three-axis closed-loop translation stage (Newport VP-25XL and XPS controller). Two-photon-excited fluorescence from the sample was collected and collimated by the objective, reflected from a dichroic beam splitter, filtered by long-pass and band-pass filters, and refocused onto an sCMOS camera (Hamamatsu Orca Flash4.0) or alternatively free-space coupled into a spectrograph (Princeton Instruments Acton SP2500) for spectral analysis of the emitted light.
We employed samples consisting of bulk diamond implanted with silicon ions and annealed to produce silicon vacancies and minimize undesired defects. High-purity CVD-grown single-crystal diamond chips (ppb nitrogen, Element Six), were Si-ion implanted (Materials Diagnostics; Albany, NY), with the implantation energies chosen to achieve the desired depth profile, as calculated by the stopping range of ions in matter (SRIM) software 2010SRIM . The implantation surface was a plane of the diamond crystal. Low-density samples for observation of single color centers were fabricated at an implantation density of and ion energy of 3 MeV, while high-density samples for improved signal-to-noise measurement ratio were fabricated at implantation densities from to with a selection of energies between 500 keV and 3 MeV designed to produce approximately uniform SiV density over the first micrometer of subsurface crystal depth. After implantation, the samples were annealed in vacuum by ramping over 2 hrs to 400 ∘C and holding for 4 hrs, then ramping over 2 hrs to 800 ∘C and holding for 4 hrs, before ramping back to room temperature.
Isolated single-SiV color centers were located in the low-density samples by raster scanning the sample in the plane transverse to the optical axis. Comparison between one-photon fluorescence microscopy of the SiVs with a large digital confocal “pinhole” and surface-reflection depth scans using the same 705 nm laser beam indicated that the color centers were within m of the diamond surface, as expected from simulations. A polarizer was placed in the imaging path following the dichroic mirror to allow analysis of the polarization direction of the emitted light, and a half-wave plate was mounted in a computer-controlled rotation stage immediately above the objective. As we observed no dependence of the emitted light intensity on the excitation polarization with the polarizer omitted, rotating the wave plate was considered equivalent to rotating the transmission axis of the polarizer, but with the advantage of holding the detected polarization axis constant throughout the downstream imaging system and spectrometer.
The power of the two-photon excitation beam was measured using a slide-format thermal power meter (Thorlabs S175C) placed in the position normally occupied by the sample. The excitation point spread functions for the one- and two-photon beams were measured by scanning a single color center through the laser focus and recording a photoluminescence (PL) map, as shown in Fig. 3. Detection point-spread functions were determined by centering a color center on the laser focus and recording a long exposure (s) on the camera using a long-pass filter and a narrow band-pass filter to reject any residual excitation light reflected by the dichroic beam splitter.
The pulse width of the two-photon excitation laser was measured by means of a home-built autocorrelator consisting of a scanning Michelson interferometer with a GaAsP photodiode at its output port; the GaAsP bandgap of 1.98 eV being larger than the single-photon energy at 1040 nm, the photodiode output was proportional to the square of the incident power. The quantity of glass traversed by the laser beam before impinging on the sample was sufficiently small to lead us to expect negligible dispersion and pulse broadening at the sample; this expectation was confirmed by the experimental introduction of a glass component of comparable thickness prior to the autocorrelator, which was not found to produce detectable broadening of the pulse. The repetition rate was separately measured on an oscilloscope using the laser’s synchronous radiofrequency output.
We further investigated the spectral dependence of the two-photon cross section using the signal output of a tunable optical parametric oscillator (Coherent Chameleon Compact OPO). The OPO signal wavelength was tuned under computer control over the range 1010 nm to 1550 nm, and fluorescence was detected at 738 nm. Making separate use of the remotely tunable titanium-sapphire pump laser allowed us to extend the excitation range down to 920nm, limited by our dichroic beam-splitter. For these measurements, we employed an NA=0.95, 100 objective corrected for use in the IR. The pulse width of the excitation laser beam was determined as a function of wavelength using the autocorrelator, substituting a silicon photodiode for the GaAsP detector for wavelengths beyond 1300nm. The excitation power was determined by measuring it in transmission using a large-area thermal power meter placed directly beneath the diamond sample and underlying microscope slide. The analog output of the power meter was recorded via a data-acquisition system for each measurement, and a dark power-meter reading was also recorded at regular intervals during the measurement sequence by shuttering the excitation beam and waiting for the power meter reading to stabilize. A half-wave-plate in a computer-controlled rotator followed by a polarizing beam splitter allowed us to vary the excitation power for each wavelength. To focus the imaging system, we introduced a weak laser beam at 736 nm into the excitation path via a pellicle beam splitter; the imaging system was periodically focused on the diamond surface by maximizing the peak intensity of the reflected 736 nm beam on the camera with the pulsed excitation light shuttered. At all other times, the 736 nm laser beam was itself shuttered. For our excitation-spectroscopy measurements, a 50:50 beam-splitter was employed in place of the flipper mirror, allowing simultaneous measurement of the emission spectrum and the two-dimensional excitation beam profile.
IV Results
We determined the silicon-vacancy two-photon cross section via Eq. 8, with all terms apart from determined from experimentally measured quantities. In order to obtain reliable statistics on single-color-center emitters, we performed automated coarse, large-area scans of the transverse (-) position. Candidate SiVs were identified by means of the narrow ZPL at nm (with a median width of nm FWHM for our samples), as shown in Fig. 4. When the spectral power in a window surrounding the ZPL exceeded the background in this window by an empirically-determined threshold of 10%, the position of the candidate color center in the focus of the excitation beam was then optimized by sequential linear scans in the , , and directions. When this optimization routine terminated successfully (i.e., with an above-threshold brightness and at a position not on the boundary of the linear scans), the polarization contrast of the emitted light was then measured by recording spectra as a function of the wave-plate angle. Polarization curves for 162 distinct color centers were extracted from the raw spectrometer data by fitting each SiV ZPL spectrum to a lorentzian with a first-order polynomial background to obtain the area under the ZPL spectrum. Representative polarization curves are shown in Fig. 5. Individual SiVs may be aligned along any of four allowed axes (the unoriented body diagonals of the cubic diamond unit cell); the projection of the SiV axis on the plane transverse to the imaging axis can therefore be aligned along two orthogonal directions, which for our sample are parallel to the edges of the rectangular diamond chip and to the principal axes of the detection polarizer. Consequently we expect individual SiVs to fall into two classes, with orthogonal emitted polarizations. Indeed, we observe that approximately half of the SiVs identified in a large scan have a maximum detection rate when the slow axis of the half wave plate is set to an angle close to , and approximately half have a maximum at an angle around , corresponding to emission polarizations at angles of and respectively. The polarization dependence and spectral width are consistent with those reported for the SiV defect in other studies neu2011fluorescence ; rogers2014electronic ; wang2006single ; vlasov2009nanodiamond .
The total ZPL photon count rate for each SiV was then taken to be the peak-to-peak amplitude of a cosine-squared fit to the polarization curve. This count rate displayed a somewhat wide distribution, as shown in Fig. 6. We have confirmed via Monte-Carlo simulations that a distribution of approximately this width is expected due to fluctuations in the number of color centers contributing to the signal. Indeed, while the number of color centers contributing to a single measurement is close to one, the polarization curves in some cases receive non-negligible contributions from nearby color centers. Color centers with parallel dipole emission axes tend to enhance the amplitude of the polarization curve, while those with orthogonal dipole emission axes tend to reduce the contrast. The extreme cases of two color centers very close together with parallel or perpendicular emission axes can be excluded by rejecting candidate color centers whose polarization curves have exceptionally low contrast or exceptionally large amplitudes (specifically, amplitudes close to twice the typical single-SiV amplitude). After excluding color centers with low contrast (40 of the 162 candidate centers) or anomalously high amplitudes (20 of the candidate centers), the median peak-to-peak amplitude was taken as the value of the ZPL detection count rate. The uncertainty in this value was dominated by the uncertainty of the spectrometer intensity calibration, so that in practice excluding these centers had a negligible effect on our result.
The saturation factor was determined by varying the excitation power incident on a single SiV color center centered on the laser focus in three dimensions and recording the detected ZPL fluorescence. Results of one such measurement are shown in Fig. 7. These data were empirically well fit by the functional form
[TABLE]
where is the detection rate at power and is a time-averaged saturation power. For the measured beam shape, the fitted saturation power corresponds to a saturation intensity of 8.3\times 10^{9}\,\text{mW/cm{}^{2}}, with a saturation count rate of photons/s incident on the spectrometer camera. We point out that this count rate is limited in our system by the fact that a silicon vacancy can only emit photons every laser repetition period of ns, rather than every excited-state lifetime of ns. Taking this difference into account, our saturation count rate is comparable to the one-photon SiV saturation rate of counts/s measured by Rogers et al. rogers2014multiple for an air-spaced objective. From analysis of our saturation measurements, we determined the saturation factor at the power used for the cross section measurements to be . For a diamond sample containing many SiVs per excitation volume, the saturation behavior given by Eq. 9 is modified because color centers in the center of the beam experience a higher laser intensity and therefore saturate before those on the periphery. Assuming a gaussian laser intensity profile, the expected saturation behavior for a dense sample can be calculated analytically by averaging over spatial locations, the result being
[TABLE]
The saturation behavior for a dense sample was also measured and fit using Eq. 10, and a consistent saturation intensity was obtained. Non-negligible saturation of the two-photon-excited fluorescence also changes the spatial profile of the PL map obtained by scanning the sample in the - plane. At low intensity, the photoluminescence (PL) map is expected to have a width approximately smaller than the actual excitation intensity distribution, assuming a near-gaussian beam profile, as a result of the quadratic dependence of scattering on intensity. For finite intensity, however, this factor is reduced; at the saturation factor noted above, the width of the PL map is found numerically to be a factor of approximately 1.29 smaller than the actual beam width, but still reasonably well approximated by a gaussian profile. Analysis of the transverse PSF including this saturation behavior indicated a transverse excitation beam width approximately 20% larger than the diffraction-limited value.
Calibration of the detection efficiency of our imaging system was performed using light from a diode laser at 736 nm, with which we measured the reflection or transmission coefficients of each element in the imaging beam path. Intensity calibration of the spectrometer camera at the operating temperature of C was performed using the light from the same laser beam with separately calibrated neutral-density filters, and agreed with the manufacturer’s value to within approximately 12%. The collection efficiency of the objective (including Fresnel reflection from the diamond-air interface) was calculated using its numerical aperture and the known refractive index of diamond (see Appendix A).
Analysis of our measured data yielded a value of GM for the two-photon fluorescence cross section of a single SiV at 1040nm, where the Goeppert-Mayer (GM) is the unit of two-photon cross section, equal to . The contributions of the various sources of uncertainty to our cross-section measurement are tabulated in Table 1. The uncertainty of each quantity has been estimated as the standard deviation of repeated measurements, where possible. The uncertainty in the intensity calibration of the spectrometer was limited by the uncertainty in the power of the calibrating laser beam; this in turn was estimated by comparing the measurements of two power meters after correcting for their wavelength dependence. The largest contribution to the uncertainty of the measurement is from imperfect knowledge of the excitation laser beam shape at the sample, whose measurement is in turn limited by residual drift between the objective and translation stage. This uncertainty is estimated from the distribution of beam radii across the ensemble of single color centers, extracted by scanning each color center through the laser focus and measuring the emitted fluorescence. Color centers whose photoluminescence profile was not well fit by a single peak were excluded in the determination of this area.
The results of our excitation-spectroscopy measurements on a high-density SiV sample are shown in Fig. 8. For each wavelength, we determined the photon detection rate as well as the two-dimensional spatial profile of the sample fluorescence as functions of excitation power. The photon count rate was extracted from the calibrated spectrometer signal by fitting the ZPL signal to a lorentzian with a first-degree polynomial background. For wavelengths below 1300 nm, the power dependence of the photon count was fit with good agreement to a function of the form of Eq. 10 to account for a small degree of saturation at shorter wavelengths. For wavelengths above 1300 nm, this fit function no longer gave satisfactory agreement, and instead a cubic fit polynomial was required to obtain good agreement with the power dependence. We interpret this as indicating that for wavelengths above nm, three-photon absorption begins to make a contribution comparable to that of two-photon absorption. At no wavelength in the range employed did we observe significant linear dependence on excitation intensity. The square of the unit-maximum-normalized excitation-beam spatial profile was determined directly from the background-subtracted camera image of the photoluminescence, allowing us to calculate the effective beam areas , , and . The effect of saturation on these effective beam areas was accounted for by fitting , , and as linear functions of the square of the excitation power; the saturation-independent area in each case was taken to be the zero-power intercept of this fit. From the quadratic and cubic terms in our power-dependence fit results, combined with the other excitation-wavelength-dependent factors (excitation power, effective beam areas, and pulse width), we extracted the two-photon and three-photon cross sections shown in Fig. 8. The product of the two-dimensional SiV density and the detection efficiency at 738 nm, which is common to the expressions for the two- and three-photon spectra, was chosen to normalize the two-photon cross section to our absolute measurement on single SiVs at 1040nm.
V Discussion
V.1 Physical Interpretation of the Multiphoton Spectrum
The excitation spectrum of Fig. 8 possesses a number of interesting features that hint at the underlying physics of the SiV defect. First, the spectrum displays no visible peak at twice the one-photon ZPL wavelength (1476 nm). This is consistent with symmetry of the SiV center, which does not permit a pure two-photon transition between the excited and ground states. Interaction with parity-odd phonons could still allow enhanced two-photon absorption near twice the ZPL wavelength, but our spectrum does not display any noticeable phonon sideband in the spectral region below 1476 nm. Our excitation spectrum also shows a considerable increase in two-photon-excited fluorescence at the short-wavelength end of the spectrum. A possible explanation is excitation to the continuum, but ab initio calculationsgoss1996twelve indicate that the depth of the SiV levels below the conduction band is too great to explain the observed increase. Alternative explanations of the increased two-photon-excited emission at shorter wavelengths are excitation via another, previously unknown bound level, most likely of even parity, or resonant enhancement of the two-photon absorption by the intermediate excited state. We also note a small bump in the two-photon excitation spectrum around 1200 nm, which may reflect direct two-photon excitation on the to the transition; a transition between these levels would be two-photon allowed even in the absence of phonons. A thorough elucidation of the origins of the observed spectral dependence and that of the observed three-photon absorption, including a more detailed treatment of the role of symmetry, will require further investigation.
V.2 Prospects for Deep-Tissue Imaging
When detecting a fluorophore in the presence of a large background signal, such as autofluorescence from biological tissue, the practical detection limit for a given integration time is defined by the condition that the detected signal from the label must exceed the noise from the background. Since background light outside the spectral bandwidth of the signal of interest can in principle be rejected via spectral filtering, the relevant shot-noise-limited background noise is proportional to the square root of the emission line width. Thus the shot-noise-limited figure of merit for an optical label in deep-tissue molecular imaging is approximately given by the fluorescence cross section divided by the square root of the line width,
[TABLE]
Using this figure of merit, we can predict the relative performance of similar types of labels for deep-tissue imaging. For instance, two-photon excitation of NV centers in diamond were measured by Wee et al. wee2007two to have a two-photon absorption cross section of 0.45 GM, (corresponding to a two-photon fluorescence cross section of around 0.32 GM), and the NV emission linewidth is approximately nm. Our measured SiV ZPL line width is 5.6 nm; Neu et al.neu2011single have observed room-temperature line widths as small as nm in SiV-containing nanodiamonds grown on iridium, though such narrow linewidths have not to our knowledge been observed in bulk diamond or in other nanodiamond samples. Consequently, our measurements suggest that the figure of merit of a SiV defect label, with a two-photon cross section of GM at 1040 nm and line widths of 0.7 nm to 5 nm, is between 10 and 30 times larger than that of an NV defect, pointing to a bright future for silicon-vacancy-doped diamond two-photon labels in applications where their photo- and chemical stability are of key importance. Our spectral measurements indicate that the figure of merit can be enhanced further by tuning the excitation laser toward 900 nm. Furthermore, the narrowness of the SiV ZPL offers greater potential for spectral multiplexing in combination with labels such as the recently-discovered narrow-line germanium vacancy defects iwasaki2015germanium or the large number of other known defects in diamond jelezko2006single ; aharonovich2011diamond .
Also important in an evaluation of the prospects of SiV defect-containing diamond labels is an assessment of the ease of producing nanoparticle labels containing a high density of color centers. We have studied the achievable density of SiV color centers by systematically varying the implantation dose and measuring the SiV one-photon fluorescence, as shown in Fig. 9. Our measurements show a maximum of around in the density of silicon vacancies produced as a function of the implantation ion dose, as shown in Fig. 9. Assuming based on our SRIM simulation results that these vacancies are quasi-uniformly distributed over a depth of m, the three-dimensional number density is then , or 17 ppb. This density is substantially ( times) lower than that achieved for NV centers acosta2009diamonds . However, work by d’Hanens-Johansson et al. HaenensJohansson2011optical has shown densities of neutrally-charged SiV centers with densities around , while Vlasov et al. vlasov2014molecular have shown that silicon vacancies can exist stably in nanodiamonds as small as nm in diameter, corresponding to a single-nanodiamond density of over . Based on these observations, we believe that much higher SiV densities are likely to be achievable following additional optimization of the growth or implantation and annealing steps, allowing realization of bright two-photon SiV nanodiamond labels.
VI Conclusion
We have measured the two-photon cross section of the negatively charged silicon-vacancy color center in diamond at an excitation wavelength of 1040 nm. Our results yield an absolute determination of the two-photon silicon-vacancy cross section at 1040 nm equal to approximately 0.74 GM. We have measured the wavelength dependence of the two-photon fluorescence cross section, finding a significant increase of the cross section for the shortest wavelengths measured. Finally, we have assessed two-photon-interrogated SiV-containing diamonds as a bright non-bleaching biological label for deep tissue imaging, and found its expected performance significantly exceeds that of NV centers in diamond, provided SiV nanodiamonds can be produced with defect densities comparable to NV nanodiamonds. Our result shows that two-photon-excited SiV-nanodiamond labels offer an outstanding combination of brightness, narrow-line emission, and photostability. These characteristics promise improved sensitivity, greater detection depth, and longer interrogation times in long-term cell tracking and in-vivo molecular-imaging experiments, with significant applications to many topics of fundamental biological and biomedical interest, including drug efficacy testing, studies of circulating tumor cells, and immune cell trafficking.
Appendix A Calculation of Collection Efficiency
In the experimental apparatus, the light emitted by the fluorophore must escape from the diamond substrate before being collected and transmitted by the objective. We compute the fraction of the total fluorescence emitted by the color center that enters the objective as follows.
[TABLE]
where is the fluorescence power emitted per solid angle, is the Fresnel transmission probability at the diamond-air interface for polarization , and the integration in the numerator is over the solid angle defined by the numerical aperture of the objective. As shown below, the calculated collection efficiency is the same, whether we assume isotropic emission or dipole emission from a dipole oriented along the direction of the diamond lattice.
A.1 Calculation for Isotropic Emission
If the color center emits isotropic, unpolarized radiation, the collection efficiency simplifies to
[TABLE]
where the maximum collection angle is defined by the numerical aperture of the collection objective, i.e., , is the index of refraction of diamond, and the transmission coefficients from diamond into air for S and P polarization are
[TABLE]
and
[TABLE]
Eq. 13 can be integrated numerically, using a diamond dielectric constant of and a numerical aperture NA of 0.75, implying an angle rad., resulting in a collection efficiency .
A.2 Calculation for Dipole Emission
The dipole emission amplitude along direction due to a dipole oscillating along axis is proportional to . Here we take , with the origin of spherical co-ordinates at the color center and the polar axis normal to the diamond-air interface. The two polarization axes are and , corresponding to S and P polarization at the interface. Thus the amplitudes for emission with these polarizations are, respectively,
[TABLE]
and
[TABLE]
where is a proportionality constant, and where we have used the fact that is orthogonal to both polarization unit vectors. The proportionality constant is determined to be by normalizing to unit probability. Thus the total collection efficiency is given by
[TABLE]
Simplifying the integral for , we obtain
[TABLE]
Noting that the transmission coefficients depend only on , we can perform the integral; terms in the integrand proportional to ,, and vanish by symmetry, and we obtain
[TABLE]
It is interesting to note that the collection efficiency is identical to the isotropic case, and that this equality obtains only for a dipole oriented at an angle of to the surface normal.
For color centers within approximately a half wavelength of the surface, the Purcell effect modifies the spontaneous emission rate, and thus the detected fluorescence santori2009vertical . For our samples, simulations of the implantation process indicate a defect depth peaked around m, and consequently a negligible Purcell enhancement of the fluorescence rate.
Appendix B Pulse Width Measurement
The pulse width is measured by means of an autocorrelator, as described in Ref. diels1985control . In a simple model (e.g., neglecting pulse chirp), the electric field for a single pulse incident on the autocorrelator is assumed to be of the form
[TABLE]
The electric field at the output port of the Michelson interferometer is then
[TABLE]
where incorporates the phase difference due to the mirror displacement as well as any static phase difference between the two paths. The intensity corresponding to this output field is then of the form
[TABLE]
The total signal detected at the photodiode is proportional by design to the square of the time-averaged intensity, i.e., to the time-integral of the . Performing this integration yields a photodiode signal , given by
[TABLE]
The upper envelope of the oscillatory curve given by this expression as a function of is
[TABLE]
while the lower envelope is
[TABLE]
Consequently the difference envelope is given by a pure Gaussian,
[TABLE]
The spatial period of the oscillatory waveform enclosed by these envelopes is , corresponding to a relative pulse time delay of .
When this signal is recorded on an oscilloscope as a function of time, the position is assumed to be a linear function of time, . Thus the temporal period of the oscilloscope trace is given by , or . The 1/e half-width of a gaussian fit to occurs when
[TABLE]
or
[TABLE]
The difference envelope obtained from an autocorrelator measurement on our 1040 nm laser and a gaussian fit to the difference envelope are shown in Fig. 10.
Appendix C Measurement in Dense Sample
If the color centers being whose fluorescence is to be collected are present on a surface with a certain area number density , and the excitation laser beam has a transverse spatial profile given by the function , with a spatial maximum at the center of the excitation beam, then the observed signal is given by
[TABLE]
where is the spatially-dependent detection efficiency, and is the detection point spread function (PSF) of the microscope, equal to the convolution of the confocal pinhole aperture function and the imaging point-spread function at the detection wavelength. To avoid ambiguity, we choose to be a unit-maximum function and to include the finite on-axis transmission of the pinhole as one of several factors contributing to . In other words,
[TABLE]
where is the PSF in the absence of any pinhole. Simplifying under the assumption that the fluorophore density is uniform, we obtain
[TABLE]
where is an effective area defined by the spatial overlap of the detection point spread function and the square of the excitation point spread function as
[TABLE]
The time average square intensity for a train of gaussian-envelope pulses is related to the average intensity by Eq. 3. Hence, for such a pulse train, the average detection rate is given by
[TABLE]
The total excitation power measured by a power meter is related to the intensity at the focus by Eq. 4. Thus the detected signal is given in terms of the average excitation laser power by
[TABLE]
For three-photon excitation, the calculation is very similar and results in the relation
[TABLE]
where
[TABLE]
The reference list from the paper itself. Each links out to its DOI / PubMed record.
- 1(1) G. Balasubramanian, I. Chan, R. Kolesov, M. Al-Hmoud, J. Tisler, C. Shin, C. Kim, A. Wojcik, P. R. Hemmer, A. Krueger, T. Hanke, A. Leitenstorfer, R. Bratschitsch, F. Jelezko, and J. Wrachtrup, “Nanoscale imaging magnetometry with diamond spins under ambient conditions,” Nature , vol. 455, no. 7213, pp. 648–651, 2008.
- 2(2) J. Maze, P. Stanwix, J. Hodges, S. Hong, J. Taylor, P. Cappellaro, L. Jiang, M. G. Dutt, E. Togan, A. Zibrov, A. A. Yacoby, R. L. Walsworth, and M. D. Lukin, “Nanoscale magnetic sensing with an individual electronic spin in diamond,” Nature , vol. 455, no. 7213, pp. 644–647, 2008.
- 3(3) J. Taylor, P. Cappellaro, L. Childress, L. Jiang, D. Budker, P. Hemmer, A. Yacoby, R. Walsworth, and M. Lukin, “High-sensitivity diamond magnetometer with nanoscale resolution,” Nature Physics , vol. 4, no. 10, pp. 810–816, 2008.
- 4(4) V. Acosta, E. Bauch, A. Jarmola, L. Zipp, M. Ledbetter, and D. Budker, “Broadband magnetometry by infrared-absorption detection of nitrogen-vacancy ensembles in diamond,” Applied Physics Letters , vol. 97, no. 17, p. 174104, 2010.
- 5(5) P. Maletinsky, S. Hong, M. S. Grinolds, B. Hausmann, M. D. Lukin, R. L. Walsworth, M. Loncar, and A. Yacoby, “A robust scanning diamond sensor for nanoscale imaging with single nitrogen-vacancy centres,” Nature nanotechnology , vol. 7, no. 5, pp. 320–324, 2012.
- 6(6) H. Mamin, M. Kim, M. Sherwood, C. Rettner, K. Ohno, D. Awschalom, and D. Rugar, “Nanoscale nuclear magnetic resonance with a nitrogen-vacancy spin sensor,” Science , vol. 339, no. 6119, pp. 557–560, 2013.
- 7(7) T. Staudacher, F. Shi, S. Pezzagna, J. Meijer, J. Du, C. Meriles, F. Reinhard, and J. Wrachtrup, “Nuclear magnetic resonance spectroscopy on a (5-nanometer) 3 sample volume,” Science , vol. 339, no. 6119, pp. 561–563, 2013.
- 8(8) M. G. Dutt, L. Childress, L. Jiang, E. Togan, J. Maze, F. Jelezko, A. Zibrov, P. Hemmer, and M. Lukin, “Quantum register based on individual electronic and nuclear spin qubits in diamond,” Science , vol. 316, no. 5829, pp. 1312–1316, 2007.