The "UV-route" to search for Blue Straggler Stars in Globular Clusters: first results from the HST UV Legacy Survey
S. Raso, F.R. Ferraro, E. Dalessandro, B. Lanzoni, D. Nardiello, A., Bellini, E. Vesperini

TL;DR
This study introduces a UV-guided method using HST data to efficiently identify Blue Straggler Stars in dense globular clusters, improving detection especially in crowded central regions.
Contribution
The paper presents a novel UV-based approach for detecting BSSs in globular clusters, demonstrating its effectiveness over optical surveys and linking BSS distribution to cluster dynamical states.
Findings
UV method outperforms optical surveys in BSS detection
BSS radial distribution correlates with cluster dynamical evolution
Method successfully identifies BSSs in high-density cluster cores
Abstract
We used data from the HST UV Legacy Survey of Galactic Globular Clusters to select the Blue Straggler Star (BSS) population in four intermediate/high density systems (namely NGC 2808, NGC 6388, NGC 6541 and NGC 7078) through a "UV-guided search". This procedure consists in using the F275W images in each cluster to construct the master list of detected sources, and then force it to the images acquired in the other filters. Such an approach optimizes the detection of relatively hot stars and allows the detection of complete sample of BSSs even in the central region of high-density clusters, because the light from the bright cool giants, which dominates the optical emission in old stellar systems, is sensibly reduced at UV wavelengths. Our UV-guided selections of BSSs have been compared to the samples obtained in previous, optical-driven surveys, clearly demonstrating the efficiency of the…
Click any figure to enlarge with its caption.
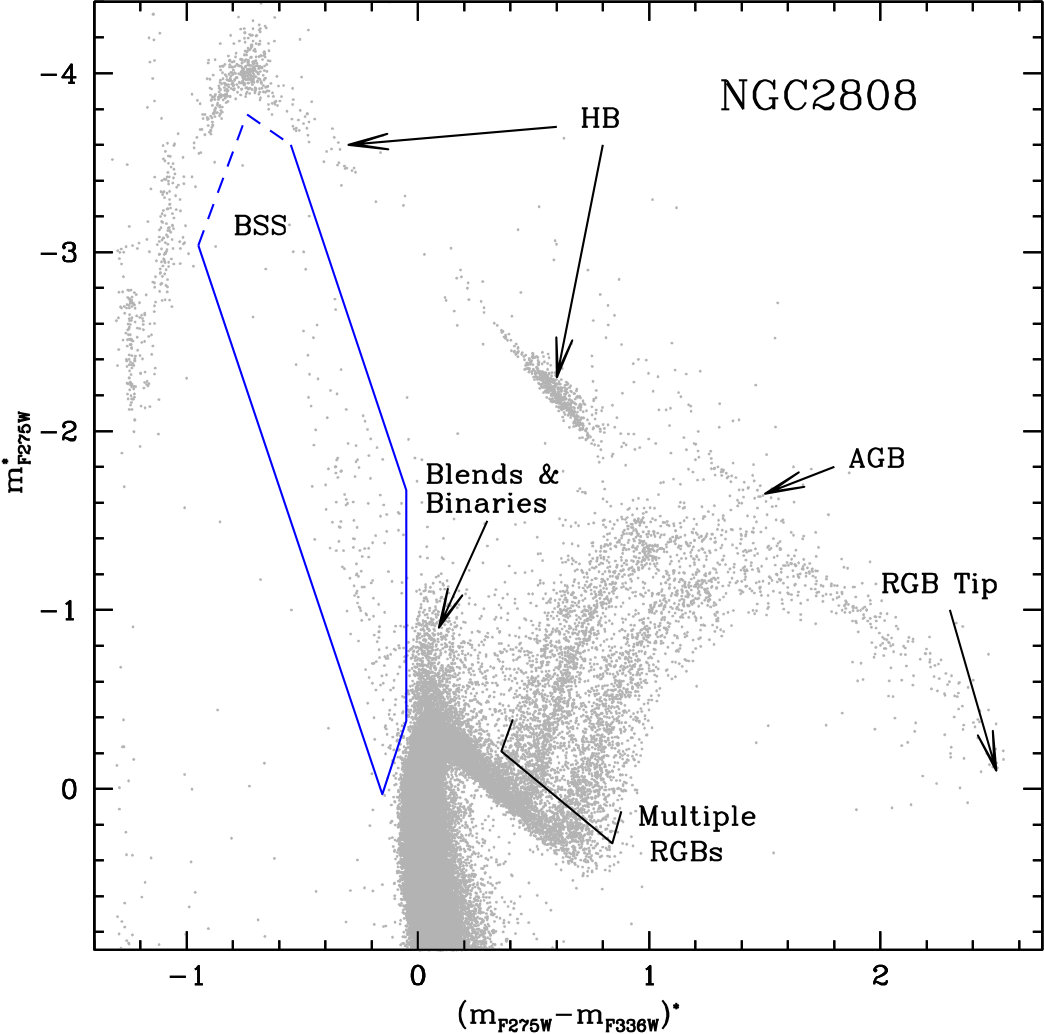 Figure 1
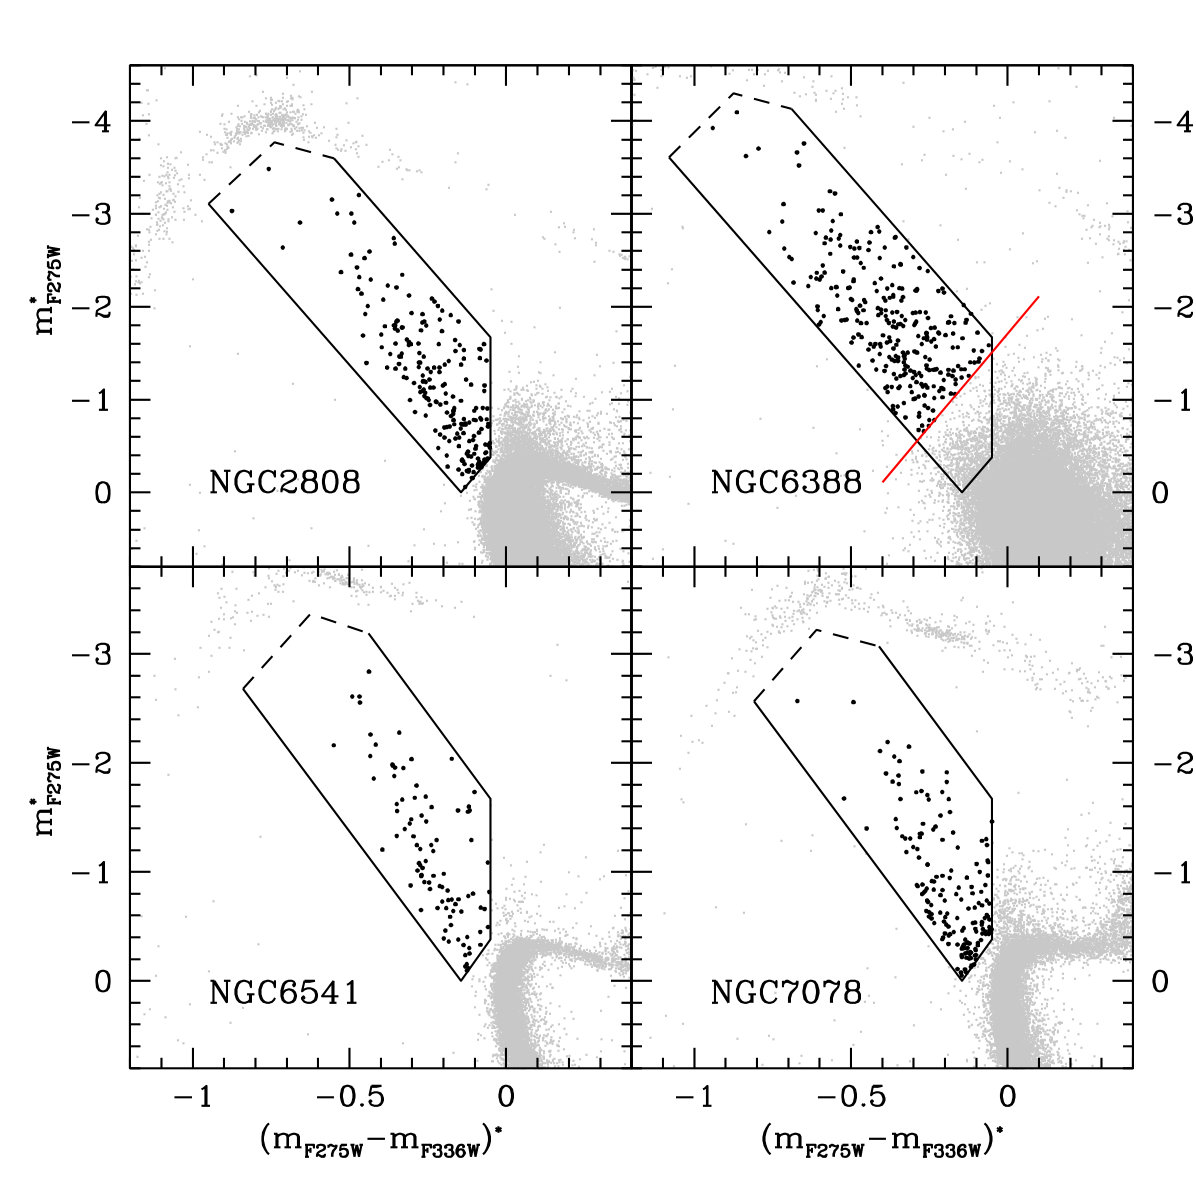 Figure 2
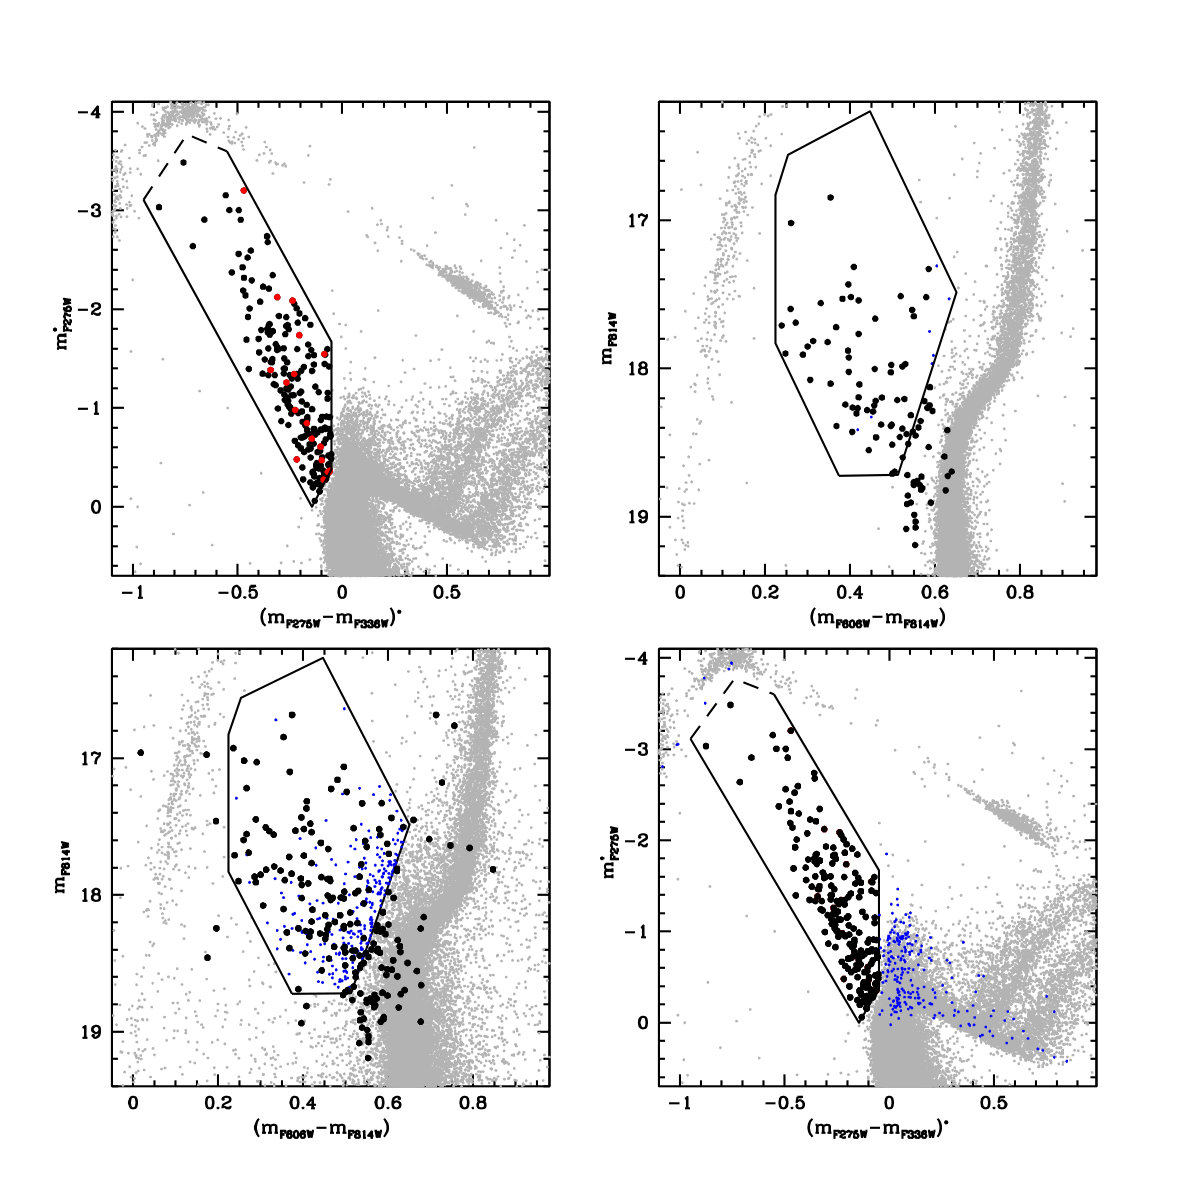 Figure 3
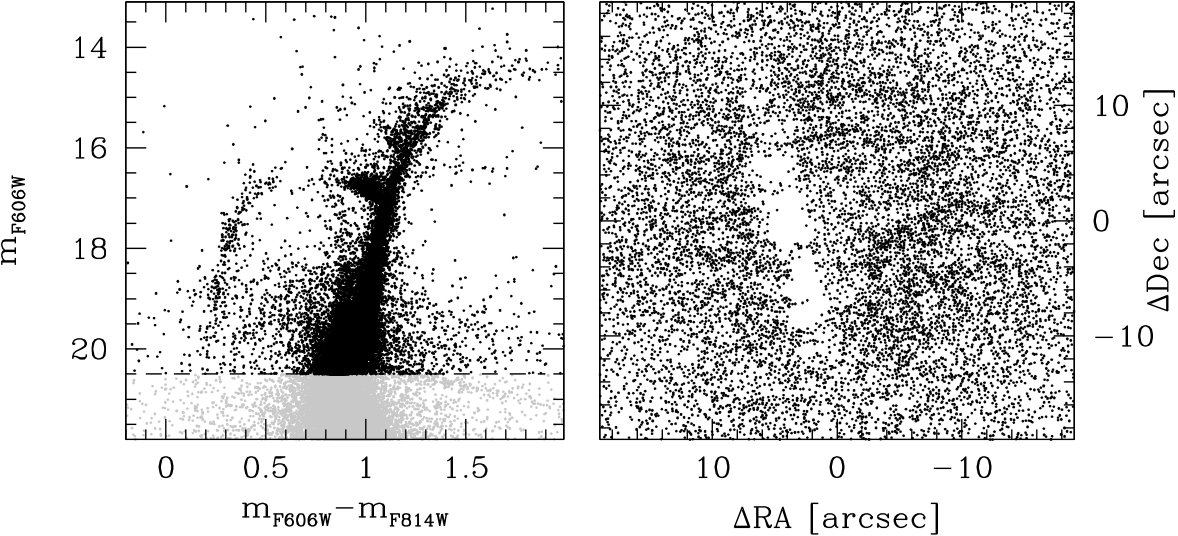 Figure 4
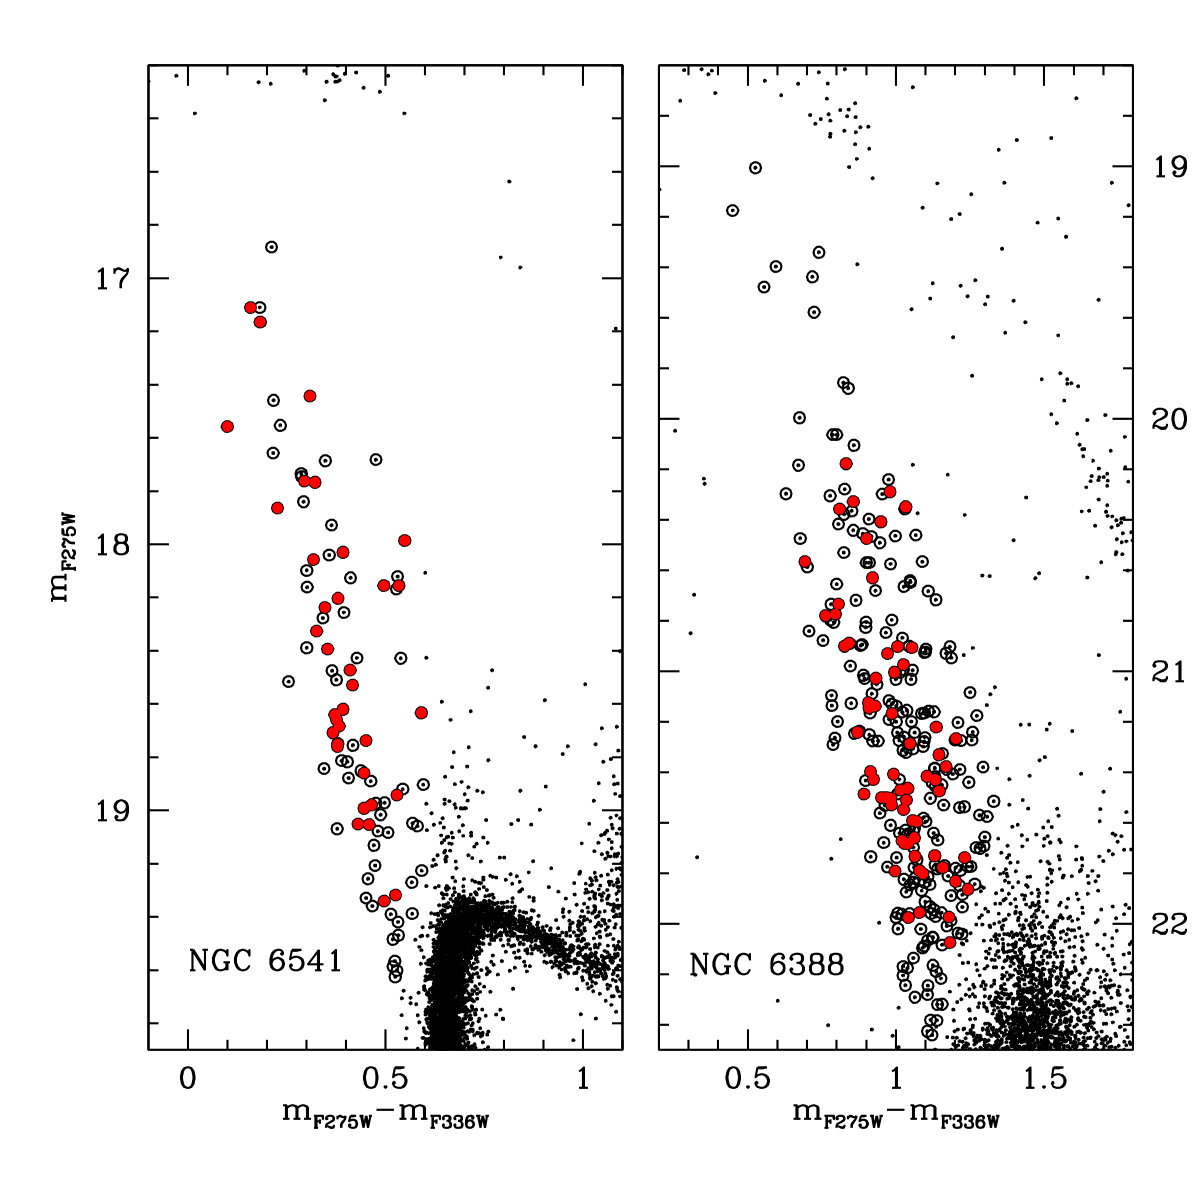 Figure 5
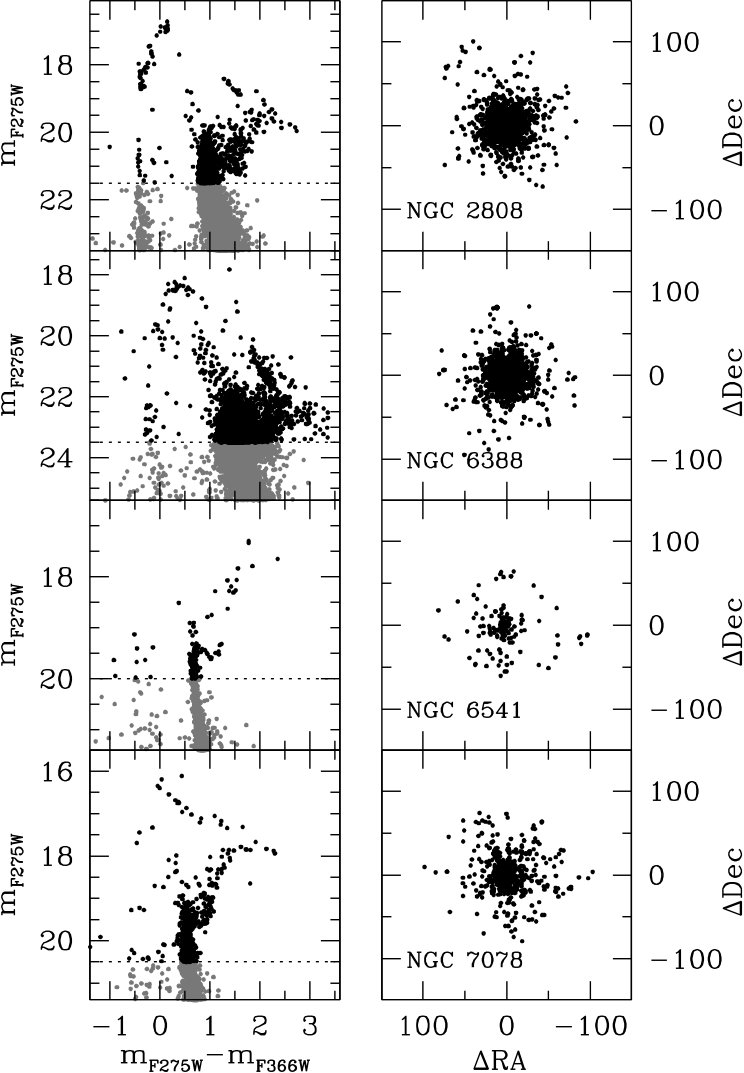 Figure 6
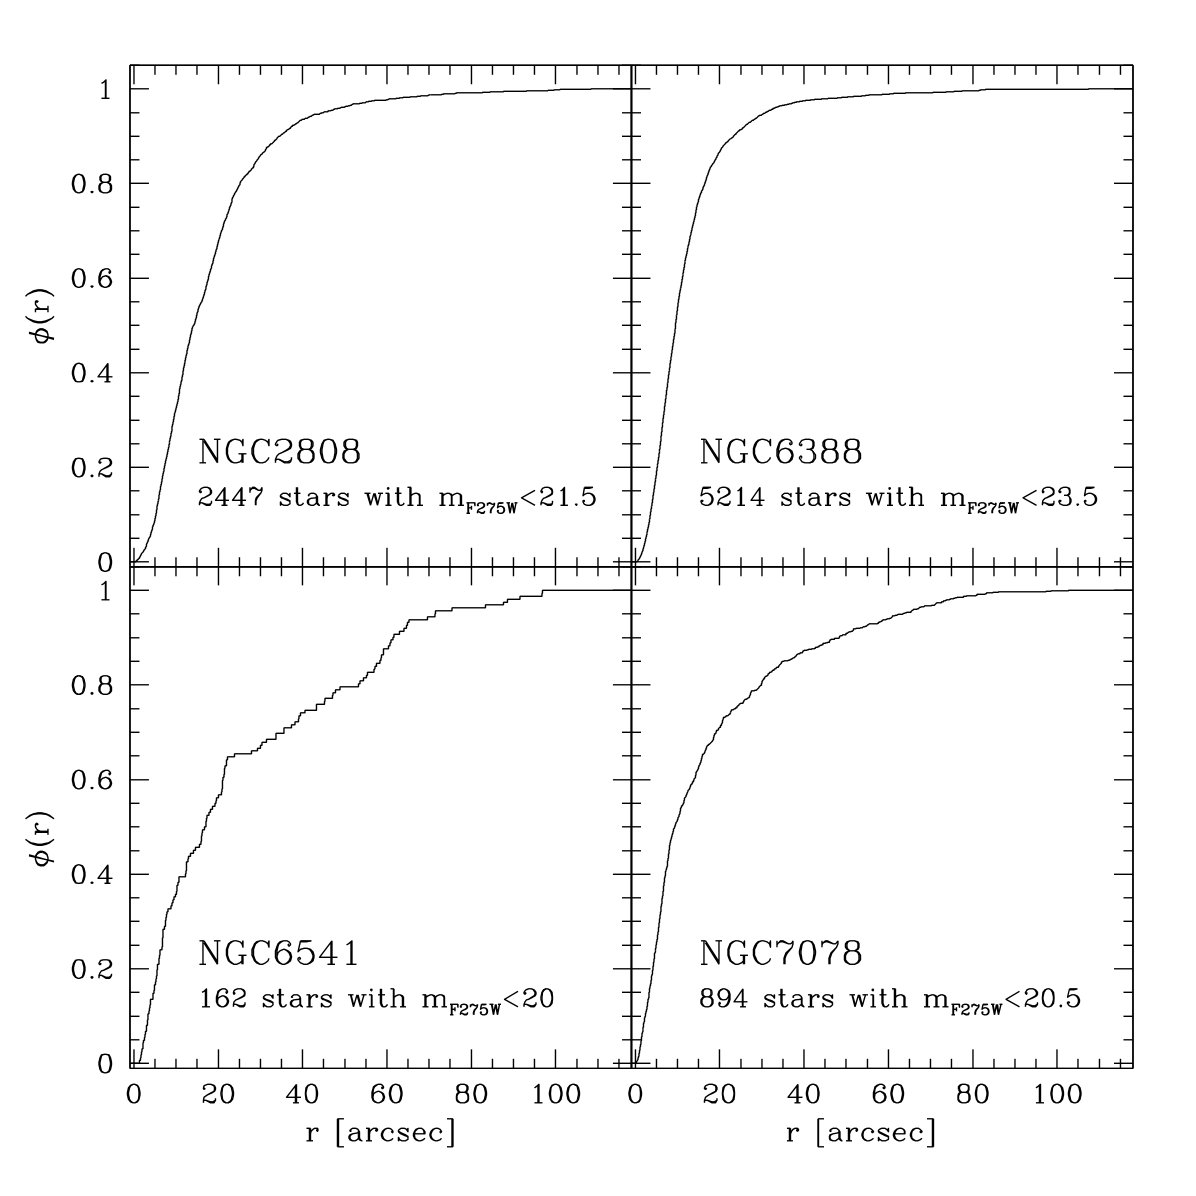 Figure 7
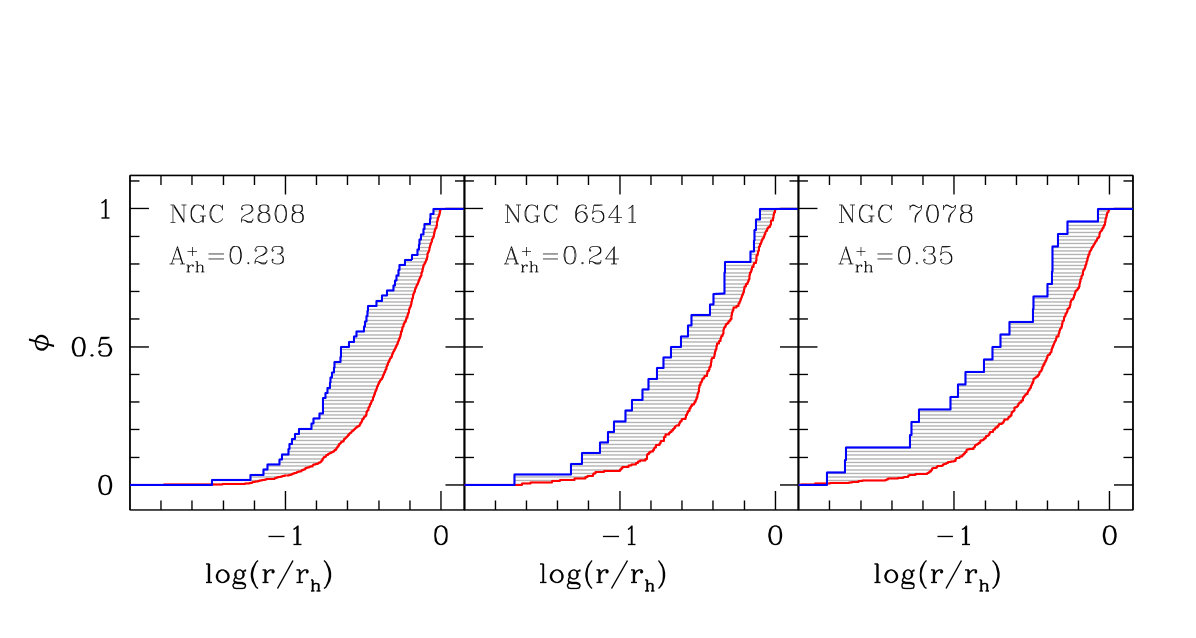 Figure 8
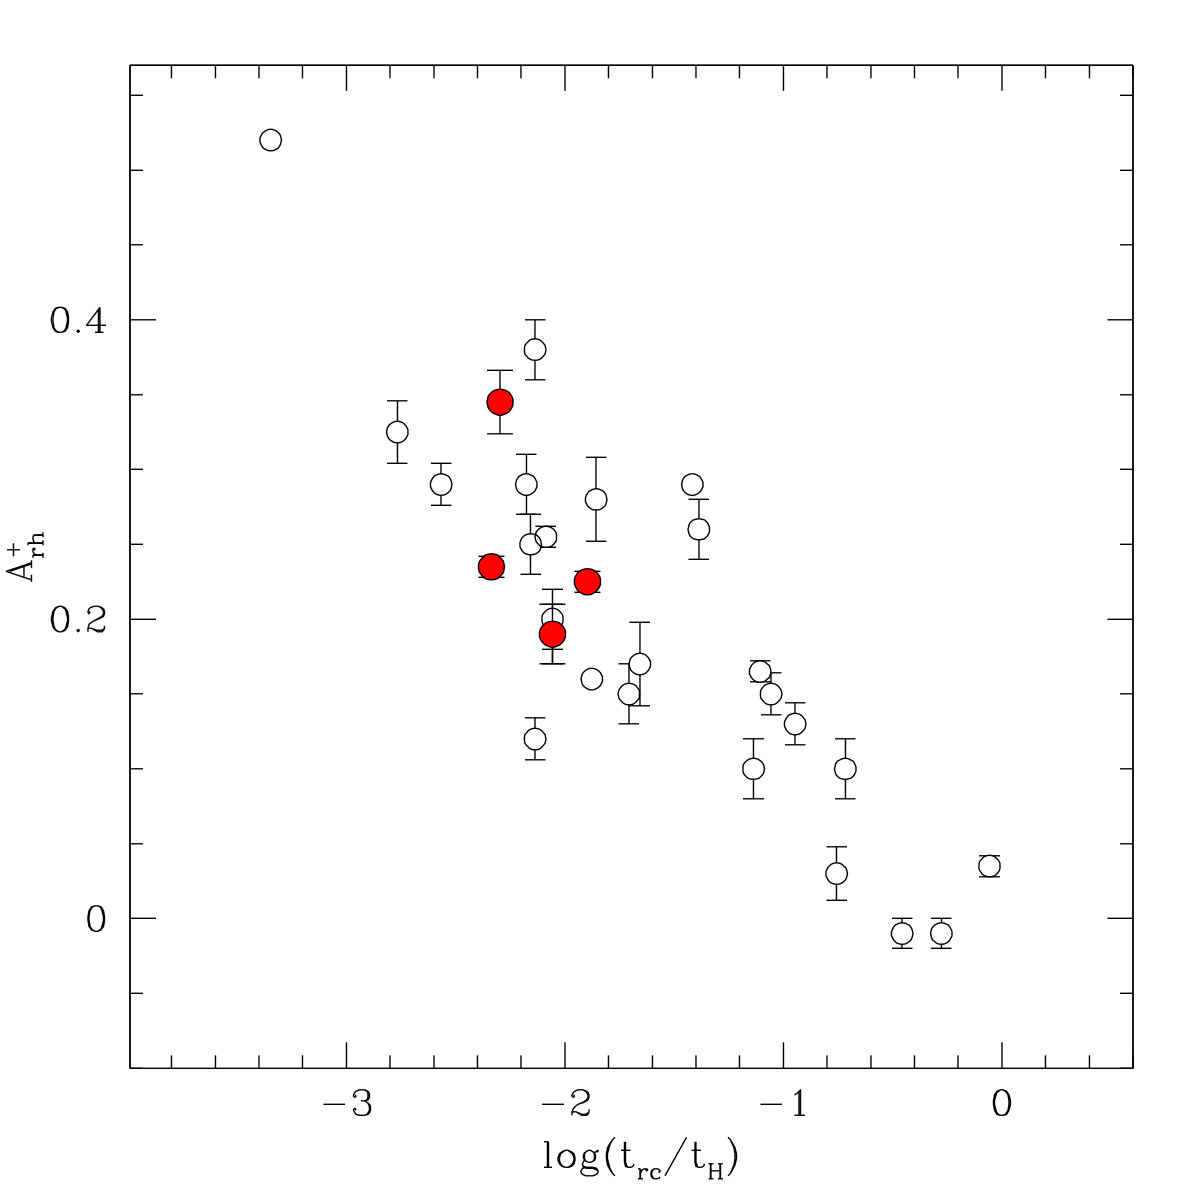 Figure 9
| Filter | F275W | F336W |
|---|---|---|
| Name | ||
| NGC 2808 | ||
| NGC 6388 | ||
| NGC 6541 | ||
| NGC 7078 | ||
| Name | |||||
|---|---|---|---|---|---|
| NGC 2808 | 215 | 48.0 | 8.24 | 0.01 | |
| NGC 6388 | 288 | 45.4 | 8.08 | 0.02 | |
| NGC 6541 | 94 | 63.6 | 7.80 | 0.01 | |
| NGC 7078 | 167 | 60.0 | 7.84 | 0.02 |
| Sample | Intruders | |||
|---|---|---|---|---|
| Good opt. photometry | 102 | 62 | 32 | 7 |
| Poor opt. photometry | 95 | 51 | 52 | 235 |
| No opt. counterpart | 18 | - | - | - |
| Total | 215 | 113 | 84 | 242 |
| Name | (Goldsbury) | (Goldsbury) | ||||
|---|---|---|---|---|---|---|
| (h:m:s) | (h:m:s) | (arcsec) | (arcsec) | |||
| NGC 2808 | 09:12:03.08 | :51:48.80 | 09:12:03.10 | :51:48.6 | ||
| NGC 6388 | 17:36:17.21 | :44:07.64 | 17:36:17.23 | :44:07.8 | ||
| NGC 6541 | 18:08:02.48 | :42:53.42 | 18:08:02.36 | :42:53.6 | 1.80 | 0.18 |
| NGC 7078 | 21:29:58.31 | 12:10:01.30 | 21:29:58.33 | 12:10:01.2 | 0.09 |
Peer Reviews
No public reviews on file for this paper yet. If you reviewed it on a platform where reviews are public (OpenReview, ICLR, NeurIPS, ICML), you can paste yours below so the community can read it here.
Videos
No videos yet. Explain this paper in a talk, walkthrough, or lecture? Add one.
The “UV-route” to search for Blue Straggler Stars in Globular
Clusters: first results from the HST UV Legacy Survey
S. Raso1,2, F.R. Ferraro1, E. Dalessandro2, B. Lanzoni1, D. Nardiello3, A. Bellini4, E. Vesperini5
1 Dept. of Physics and Astronomy, University of Bologna, Viale Berti Pichat, 6/2, Bologna, Italy
2 INAF Osservatorio Astronomico di Bologna, Via Ranzani 1, Bologna, Italy
3 Dept. of Physics and Astronomy Galileo Galilei, University of Padova, Vicolo dell’Osservatorio 3, I-35122 Padova, Italy)
4 Space Telescope Science Institute, 3700 San Martin Drive, Baltimore, MD 21218, USA.
5 Dept. of Astronomy, Indiana University, Bloomington, IN, 47401, USA.
(20 March 2017)
Abstract
We used data from the HST UV Legacy Survey of Galactic Globular Clusters to select the Blue Straggler Star (BSS) population in four intermediate/high density systems (namely NGC 2808, NGC 6388, NGC 6541 and NGC 7078) through a “UV-guided search”. This procedure consists in using the F275W images in each cluster to construct the master list of detected sources, and then force it to the images acquired in the other filters. Such an approach optimizes the detection of relatively hot stars and allows the detection of complete sample of BSSs even in the central region of high-density clusters, because the light from the bright cool giants, which dominates the optical emission in old stellar systems, is sensibly reduced at UV wavelengths. Our UV-guided selections of BSSs have been compared to the samples obtained in previous, optical-driven surveys, clearly demonstrating the efficiency of the UV approach. In each cluster we also measured the parameter , defined as the area enclosed between the cumulative radial distribution of BSSs and that of a reference population, which traces the level of BSS central segregation and the level of dynamical evolution suffered by the system. The values measured for the four clusters studied in this paper nicely fall along the dynamical sequence recently presented for a sample of 25 clusters.
blue stragglers — globular clusters: individual (NGC2808, NGC6388, NGC6541, NGC7078) — techniques: photometric
1 Introduction
In the color-magnitude diagram (CMD) of a stellar population, the so-called Blue Straggler Stars (BSSs) appear as a sparse group of stars with relatively low luminousity (a few ) and high effective temperature (K), lying along the extrapolation of the main sequence (MS), at brighter magnitudes and bluer colours with respect to the MS-turnoff (MS-TO) point (e.g., Sandage, 1953; Ferraro et al., 1992, 1993, 1995, 2004, Piotto et al., 2004; Leigh et al., 2007; Moretti et al., 2008, Dalessandro et al., 2008; Beccari et al., 2011, 2012; Simunovic & Puzia, 2016). Their anomalous position in the CMD indicates that they are more massive than the other visible stars in the cluster, as it is also confirmed by direct mass estimates (Shara et al., 1997; Gilliland et al., 1998; Ferraro et al., 2006b; Fiorentino et al., 2014; Baldwin et al., 2016). Hence, BSSs must have formed through “exotic” channels, as mass-transfer in binary systems (McCrea, 1964) and stellar mergers due to direct collisions (Hills & Day, 1976). The full characterization of the BSS formation mechanisms and successive evolution (e.g., Sills et al., 2009; Ferraro et al., 2016) and their relative importance in different enviroments have not been completely quantified yet (e.g., Davies et al., 2004; Sollima et al., 2008; Chen & Han, 2009; Knigge et al., 2009; Ferraro et al., 2003; Leigh et al., 2013; Chatterjee et al., 2013; Sills et al., 2013), but a few pieces of evidence suggest that both channels can be active within the same cluster (Ferraro et al., 2009; Dalessandro et al., 2013; Simunovic et al., 2014; Xin et al., 2015).
Because of their anomalous position in the CMD, BSSs are, at least in principle, clearly distinguishable from the other cluster stars. However, the construction of complete samples of BSSs can be critical in old star clusters, since the optical emission in these systems is primarily dominated by a large population of much brighter (several ) and cool ( K) giants. Clearly, this task is particularly difficult (even with the Hubble Space Telescope - HST) in very crowded enviroments, as those observed in the central regions of high-density (several stars per cubic parsec) globular clusters (GCs). However, because of their hot surface temperatures, BSSs appear among the brightest objects at UV wavelenghts, where red giants are, instead, particularly faint. Hence the combination of high angular resolution and UV imaging capabilities (as offered by the HST) is the only solution to significantly reduce the level of crowding and acquire complete samples of BSSs even in the core of highly concentrated GCs. Within this framework, approximately 20 years ago we promoted the so-called UV route to the study of BSSs in GCs (see Ferraro et al. 1997, 1999, 2001, 2003), an approach that allowed us to derive complete samples of BSSs in several Galactic GCs (GGCs), including systems of very high central density (see Lanzoni et al., 2007a, b, c; Dalessandro et al., 2008, 2009; Sanna et al., 2012, 2014; Contreras Ramos et al., 2012).
The dataset recently acquired within the HST UV Legacy Survey of GGCs (see Sect. 2; Piotto et al., 2015) allows the extension of this approach to a significantly larger number of clusters. While the complete study of the BSS population in all the surveyed GCs will be discussed in a forthcoming paper (Francesco R. Ferraro et al. 2017, in preparation), here we present the first results obtained for four intermediate/high density systems. The specific aim of this paper is to illustrate the advantages of the “UV-guided” search, with respect to the “optical-driven” selection (e.g. Soto et al. 2016), for the identification of complete samples of BSSs. A detailed comparison with the results obtained from currently available online catalogs is therefore presented and discussed. We finally discuss the radial distributions of BSSs and their level of segregation relative to HB or RGB stars; the BSS central segregation is measured by means of the parameter recently defined in Alessandrini et al. (2016) and Lanzoni et al. (2016), to explore the use of BSSs as tracers of the dynamical evolution of the parent cluster (Ferraro et al., 2012, 2015).
2 The photometric database and data reduction
The data used in this paper have been secured as part of the Hubble Space Telescope UV Legacy Survey of GGCs (GO-13297; PI: Piotto) and in two pilot companion projects (GO-12311 and GO-12605; see Piotto et al. 2015). In all the 57 clusters deep images in the F275W, F336W and F438W filters have been acquired with the WFC3/UVIS. While this filter combination provides the ideal set to generate pseudo-colors able to maximize the splitting of multiple stellar populations in the CMD (see e.g. Milone et al. 2013), it also offers the possibility to construct diagrams where an appropriate selection of hot populations (like BSSs) can be performed. In particular, to optimally study BSSs we adopted a “pure” UV diagram: the () CMD.
The four clusters selected for this paper (namely, NGC 2808, NGC 6388, NGC 6541 and NGC 7078) are massive (, ), with high central density ( in units of pc*-3*)111Two of them (namely NGC 7078 and NGC 6541) are catalogued as core collapsed clusters. and moderately extended core radius (), and they span a large range in metallicity ([Fe/H]; all parameters are from Harris, 1996, 2010 edition). Hence, the four selected clusters represent the ideal systems to test the advantages of BSS searches in the UV domain over those carried out using the optical band.
The WFC3/UVIS camera consists of two twin chips, each of pixels and with a pixel scale of , resulting in a total field of view of . For each cluster several images were obtained in the F275W and F336W bands (see Table 1 for details). To allow a better subtraction of CCD defects, artifacts and false detections, different pointings dithered by several pixels, and in some cases also rotated by (NGC 6541) or (NGC 6388), have been acquired in each band.
For the photometric analysis we used the set of images processed, flat-fielded, bias subtracted and corrected for charge transfer efficiency (CTE) by standard HST pipelines (flc images). Pixel-area effects have been accounted for by applying the most updated pixel-area-maps (PAM images) to each image by means of IRAF tasks.222IRAF is distributed by the National Optical Astronomy Observatory, which is operated by the Association of Universities for Research in Astronomy, Inc., under cooperative agreement with the National Science Foundation. The analysis has been performed independently on each chip by using DAOPHOT IV (Stetson, 1987). For each image we selected several () bright, unsaturated and relatively isolated stars to model the point-spread function (PSF), for which we used a spatially variable Moffat function. A first star list has been obtained for each frame by independently fitting all the star-like sources at above the local background. To take advantage of the reduced crowding conditions at UV wavelegths, we created a master list composed of stars detected in a sub-sample of at least half of the total number of F275W images available for any given cluster (see Table 1). Then, at the corresponding positions of the stars present in the master list, a fit was forced with DAOPHOT/ALLFRAME (Stetson, 1994) in each single frame obtained through each filter. For each star, multiple magnitude estimates obtained in each filter were homogenized by using DAOMASTER and DAOMATCH, and their weighted mean and standard deviation were finally adopted as the star magnitude and photometric error. The final catalog of each cluster has been finally cross-correlated with those published in the intermediate release (Piotto et al., 2015) and available upon request at the web page http://groups.dfa.unipd.it/ESPG/treasury.php. In all cases, we found thousand stars in common, that allowed us to:(i) report the final instrumental magnitudes in each filter to the VEGAMAG photometric system, and (ii) convert the instrumental coordinates into the absolute astrometric system. For NGC 2808, NGC 7078 and NGC 6388 we used the stellar proper motions (PMs) of Bellini et al. (2014), while for NGC 6541 the PM measures available in the on-line catalogs at the Survey web page were adopted.
3 The BSS selection
To define selection criteria for the BSS population that can be consistently adopted in all clusters (see, e.g., Leigh et al. 2007, 2011) we followed a fully empirical approach. We defined a sort of “normalized” CMD, with the magnitudes and the colors arbitrarily shifted to locate the MS-TO at approximately and . This allows us to locate the BSS sequence in the same portion of the diagram independently of the cluster distance and metallicity. Figure 1 shows the “normalized” UV CMD of NGC 2808 (adopted as template). For the sake of reference, the position of the main evolutionary sequences in the diagram is also labeled. As discussed above, the hot stars belonging to the blue tail of the horizontal branch (HB) dominate the UV emission, while red and asymptotic giant branch (RGB and AGB) stars are significantly fainter. As apparent, this diagram allows an efficient and reliable selection of BSS samples. Also the region where optical blends (and possibly binaries) are expected to be located is easily recognizable in the selected CMD (see the well visible plume just above the MS-TO), and their contamination to the BSS sample is therefore minimized.
The selection box has been defined in order to be virtually applicable to all the clusters observed in the HST UV Legacy Survey. In this diagram, BSSs define a clean sequence populating a mag-wide strip spanning approximately 3 magnitudes, diagonally crossing the diagram from the cluster MS-TO, toward the blue extension of the HB. Hence the selection box is defined along two parallel lines including the bulk of the BSS population. The equations of the two lines are:
[TABLE]
[TABLE]
We also define a red boundary to separate BSSs from the supra-MS plume. A vertical line at has been found to efficiently exclude the bulk of the supra-MS plume, which can be more or less populated, depending on the crowding conditions of each system. The faint edge, needed to separate BSSs from the MS-TO stars, has been conservatively set at more than from the mean color of the brightest portion of the MS-TO stars. The equation defining this edge is
[TABLE]
In principle a bright/blue edge of the box is needed to distinguish very bright BSSs from stars populating the blue portion of the HB (when present). However in order to study the frequency, distribution and luminosity extension of the BSS population at its bright end, we preferred not to set any formal boundary on this side of the box. In fact, a precise boundary set on the basis of the CMD of GCs with blue HB would cause an artificial cut-off of the brightest portion of the BSS sequence in clusters with red HB morphology. Moreover, we emphasize that only a few objects are expected in this (very bright) portion of the BSS sequence and different assumptions on the bright/blue boundary of the selection box therefore make very little difference. Hence, in clusters with extended HB morphology, the boundary (see the dashed lines in Figure 1) has been set by considering the mean colors and the distribution of the HB stars, while no formal boundary has been adopted for red HB systems. Once the entire sample of GCs is analyzed, this approach will allow us to estimate the fraction of very bright BSSs that can potentially contaminate the blue portion of the HB in clusters with an extended HB.
The BSS selection box defined according to the above relations is shown in Figure 1. We emphasize that slightly different assumptions about its boundaries do not alter the main results presented in this paper. Figure 2 highlights the BSS populations thus selected in the four program clusters, shown in the “normalized” UV CMDs. Note that in the case of NGC 6388, only BSSs more luminous than have been considered because of the large photometric errors affecting the MS-TO region, which prevented a safe BSS selection at fainter magnitudes. The total number of BSSs selected in each cluster is listed in Table 2. The final BSS catalogs will be published in a forthcoming paper (Ferraro et al. 2017) for all the clusters observed in the HST UV Legacy Survey.
Depending on the time coverage of the observations secured in each cluster, in the forthcoming paper we also plan to search for variable BSSs and, in the most favorable cases, also publish their light curve. This is indeed quite relevant for any BSS study, since some of these stars can be eclipsing binaries (in particular, W UMA-type stars; e.g., Mateo, 1993; Rucinski, 1997) or pulsating SX Phoenicis (e.g., Pych et al., 2001; Fiorentino et al., 2014).
4 Comparison to previous BSS selections and online catalogs
In the recent years, several works aimed at characterizing the properties of BSSs in GGCs have been published (see, e.g., Leigh et al., 2007; Knigge et al., 2009; Leigh et al., 2013). Most of them are based on online catalogs obtained from the ACS GC Survey (Sarajedini et al., 2007). Unfortunately, those catalogs turn out to be (sometimes severely) incomplete in the inner regions of high-density clusters. This is because the ACS GC Survey was designed to secure a series of dithered and deep images in the optical band (F606W and F814W filters), with the aim of properly sampling the entire extension of the MS. Hence, the bright giant stars are heavily saturated in those images and their combined blooming effect strongly prevent the proper measuring of fainter stars in relevant portions of the central regions of high-density GCs. In some cases the short exposure (only one per filter) concurrently acquired in each HST visit alleviates, but does not completely solve, the problem, since the gap between the ACS chips remains not sampled at all (and it crosses the central regions of most of the clusters). The combination of these effects produces large incompleteness in the samples of stars measurable above the MS-TO (including most of the BSSs), and this is well visible even without specific completeness estimates. In fact, while faint stars are detected in any cluster region thanks to the dithering pattern adopted during the observations, the ACS inter-chip gap clearly appears in the cluster map built by using only stars brighter than the MS-TO in the ACS GC Survey catalogs of any high-density cluster. Figure 4 dramatically demonstrates the problem for the case of NGC 6388. Of course any other catalog that has been constructed starting from the (optical-driven) ACS GC Survey samples suffers from the same bias. Here we discuss a few recent cases.
4.1 Comparing BSS selection boxes
Based on the ACS GC Survey catalogs, Leigh et al. (2011) presented a thoughtful definition of the BSS selection box in the optical CMD. Unfortunately no direct cluster-to-cluster comparison can be performed with that work, since no one of the four clusters discussed here is in common with the sample of Leigh et al. (2011). However the detailed description of how they defined the BSS selection box allows us to compare our (UV-selected) BSS samples with what would be obtained by using their criteria.
Figure 3 and Table 3 illustrate the case of NGC 2808. In the upper-left panel we show the BSS selection in the UV diagram, made by using the box discussed in Sect. 3. A total number of 215 BSSs is found. Of these, 18 are completely missed in the optical catalog (see the red dots in the upper-left panel of Figure 3), i.e. no optical counterpart to these sources can be found in the optical data set. The bottom-left panel of Figure 3 shows the optical CMD of NGC 2808 from the Sarajedini et al. (2007) catalog, with the UV-selected BSSs highlighted as black circles and the Leigh et al. (2011) selection box drawn. As apparent, this box includes the bulk of the UV-selected BSSs (113 out of 215), indicating that our selection criteria agree with those of Leigh et al. (2011). However the comparison also highlights that using the optical CMD (instead of the UV diagram) can have two opposite consequences: (1) a loss of genuine BSSs, and (2) the inclusion of several “intruders” (i.e., stars falling within the optical BSS selection box, that, however, are blends or MS/SGB/RGB stars in the UV CMD; they are plotted as small blue dots in the figure). In fact, several (84) UV-selected BSSs lie outside the optical selection box. Most of them are located close to the MS-TO, in the region where the BSS sequence merges into the MS. This shows that the UV diagram allows a safe exploration of a fainter portion of the BSS luminosity function, while a proper selection of BSSs in the optical CMD is limited to brighter objects. A few other stars lie outside the optical box probably because their optical photometry is perturbed by the presence of bright giants. In addition, a large number (242) of sources that are not UV-selected BSSs is found within the optical box (blue dots). The location of these “intruders” in the UV diagram is shown in the bottom-right panel of the figure: clearly these are MS/SGB/RGB stars and blends, which erroneously fall within the BSS selection box in the optical CMD because of their poor photometry. The optical CMD obtained by using only stars with good photometry (see Milone et al. 2012) is plotted in the upper-right panel of Figure 3 and it shows that, in fact, essentially all the “intruders” (but 7) have disappeared. This high quality optical CMD confirms that most of the UV-selected BSSs fall within the Leigh et al. (2011) box and the majority of those found beyond the box are located close to the MS-TO. However, only 62+7 stars would have been classified as BSSs based on this diagram, while a total of 215 BSSs is found in the UV. By considering the numbers listed in Table 3 we can conclude that, in the specific case of NGC 2808, an analysis carried out in the optical band would have safely sampled (by considering only stars with good optical photometry) about 35% of the UV-selected population (69 vs 215), while of them would have been lost because these are too faint to be properly separated from the MS-TO in the optical. On the other hand, the entire optical sample (including objects of poor photometry) would be completely dominated by “intruders” (235), thus making the BSS selection meaningless.
This study clearly highlights the benefits of using UV-driven (instead of optical-driven) catalogs for the proper selection of BSS samples, independently of the precise boundaries adopted for the selection box. It demonstrates that the effect of crowding in the central regions of high density clusters can (1) prevent the identification of BSSs that are too close to bright giants (red dots in the upper left panel), (2) make inaccurate the photometry of genuine BSSs, thus “moving them out” of a reasonably drawn selection box (bottom-left and upper-right panels of Figure 3) and (3) “move within” the BSS selection box a large number of MS/SGB/RGB stars and blends (bottom-right panel of Figure 3).
4.2 Comparison to online catalogs
Simunovic & Puzia (2016, hereafter SP16) present PM-cleaned catalogs of BSSs in 35 GGCs. PMs have been measured from the comparison between the stellar centroids listed in the ACS GC Survey catalogs and those measured in the F336W exposures of the UV Legacy Survey of GGCs. Hence, by construction, these catalogs include only stars that are present in the (optical-driven) ACS GC Survey sample, and therefore suffer from the bias described above. In addition, only stars with high-quality flags have been used, thus further reducing the number of stars listed in the online PM-cleaned BSS catalogs. In order to perform a quantitative comparison, we discuss the specific case of the two clusters in common with SP16, namely NGC 6541 and NGC 6388. SP16 list 41 BSSs in their catalog of NGC 6541, also including evolved BSSs (EBSSs), i.e., objects that already evolved off the MS phase. Our UV-driven selection identifies 94 BSSs in NGC 6541, and no objects have been excluded on the basis of the PM measurements. Our sample includes 35 BSSs in common with SP16, while their remaining 6 stars correspond, in the UV diagram, to a bright object too close to the HB to be safely classified as a BSS, and 5 EBSSs. Thus, a total of 59 BSSs (representing of the entire sample) are missed in the SP16 catalog (see Figure 5, left panel), possibly because these objects did not match the quality-flag criteria adopted by SP16. In NGC 6388, our UV-driven selection identifies 288 candidate BSSs. Instead, only 74 BSSs and EBSSs are listed in the SP16 online catalog. Out of these, 64 BSSs are in common with our sample (see Figure 5, right panel), while the remaining 10 are located, in the UV diagram, in the region of stellar blends or EBSSs. Hence, the optical-driven, PM-cleaned and quality fit-selected sample of BSSs discussed in SP16 includes only a small fraction () of the potential global population of NGC 6388. About 30 UV-selected BSSs are lacking in the optical sample just because they fall in the ACS gap (see Figure 4). On the other hand, the Galactic field contamination is known to be significant in this cluster and the PM measurements of Bellini et al. (2014) suggest that this is particularly relevant for the faintest portion of the BSS sequence (see also Figure 6 in SP16). Unfortunately, the high-precision PMs currently available for NGC 6388 (Bellini et al., 2014) do not include the very center of the cluster, since they are based on the ACS GC Survey master frame and therefore are also affected by the presence of the ACS gap (a more sophisticated approach able to include also the innermost regions of the cluster is planned as part of the HST UV Legacy Survey of GGCs). Hence, deeper analyses of the BSS population in NGC 6388 are unfeasible at the moment. These examples clearly demonstrate that, while the PM-cleaned BSS catalogs presented by SP16 allow a secure screening of cluster members useful for spectroscopic follow-ups, they include only a small fraction of the cluster BSS population, and thus cannot be used to derive global properties and perform quantitative studies aimed at exploring, for example, the BSS radial distribution, central segregation, and the number ratio of BSS with respect to the cluster “normal” stars.
Soto et al. (2016) present a preliminary public release of photometric catalogs for the 57 GGCs observed in the UV Legacy Survey of GGCs. These catalogs have been built by assigning the magnitudes measured in the F275W, F336W and F438W filters to all the stars listed in the (optical-driven) ACS GC Survey samples. Hence, by construction, also these catalogs suffer from the problems discussed above and are not suitable for quantitative studies of the evolved stellar populations (brighter than the MS-TO). The detailed comparison between the Soto online catalogs and the “UV-guided” samples discussed in this paper offers the opportunity to quantitatively study the distribution (both in space and in the CMD) of the stars missed in the optical-driven approach. For the four clusters under study, Figure 6 shows the UV CMD and the spatial distribution of all the stars detected in the UV-guided approach that are missed in the Soto online catalogs. As apparent, they are distributed along all the evolved sequences in the CMD (HB, RGB, BSS and white dwarf sequences) and a significant number of stars is also missed in the MS-TO and upper MS regions. The number of missed stars depends on the cluster structure: by considering only the brightest portion of the CMD (approximately brighter than the cluster MS-TO), it varies from near 200 in NGC 6541, up to more than five thousand in NGC 6388. The right panels show the spatial distribution of the missed stars, revealing that they are mainly concentrated in the innermost regions, as it is expected in the case of incompletness due to an effect of stellar crowding. To further illustrate the problem, in Figure 7 we plot the cumulative radial distribution of the stars lost in the optical-search for the four program clusters. As it can be seen, the vast majority ( 70%) of the missed stars is located within the innermost - from the cluster center, thus demonstrating the benefits of using UV-driven over optical-driven catalogs to study the radial distributions and population ratios of evolved stars. This analysis shows also that the online optical-driven catalogs should be used with caution when quantitative studies of any evolved stellar population is attempted.
5 Measuring the level of radial segregation of BSSs
As discussed above, BSSs are a population of heavy stars, with an average mass (Shara et al., 1997; Gilliland et al., 1998; Ferraro et al., 2006b; Fiorentino et al., 2014; Baldwin et al., 2016), orbiting a “sea” of lighter objects (the average stellar mass in old GCs is ). For this reason they are subject to the action of dynamical friction that make them segregate toward the cluster center, with an efficiency that decreases for increasing radial distance (e.g., Binney & Tremaine 1987; Mapelli et al. 2004, 2006). Ferraro et al. (2012) demonstrated that this process is responsible for the observed shapes of the BSS normalized radial distribution333The “normalized BSS distribution” (Ferraro et al., 1993) is defined as the ratio between the fraction of BSSs sampled in any adopted radial bin and the fraction of cluster light sampled in the same bin. (hereafter BSS-nRD), that in most of the analyzed clusters is bimodal, with a central peak, a minimum at a distance from the center, and an external rising branch. The position of the minimum, expressed in units of the cluster core radius, has been used by Ferraro et al. (2012) as a clock-hand to measure the dynamical ages of GCs. In fact, being all clusters coeval (same chronological age, Gyr), dynamical friction acted on their BSS population during the same period of time. However, different shapes of the BSS-nRD are currently observed, with spanning the entire radial range, from the very center out to the outskirts, depending on the system. Hence, dynamical friction has been more or less efficient in segregating BSSs toward the center in different GCs, and is an indicator of this action: small (large) values of are found in dynamically young (old) clusters, while intermediate values are measured in sub-families of intermediate dynamical-age systems.
Under these assumptions, the outward propagation of the BSS-nRD minimum is expected to be linked to a growing level of BSS segregation in the central regions of the cluster. In order to explore this aspect, Alessandrini et al. (2016) and Lanzoni et al. (2016) proposed to measure the level of BSS segregation by means of the parameter , defined as the area enclosed between the cumulative radial distribution of BSSs, , and that of a reference (lighter) population, :
[TABLE]
where is the logarithm of the distance from the cluster center normalized to the cluster half-mass radius . Note that the distances from the cluster center are expressed in logarithmic units in order to maximize the sensitivity of to the BSS segregation (which is prominent in the central regions of each cluster). Indeed, by means of direct body simulations, Alessandrini et al. (2016) demonstrated that the value of systematically increases with time, as expected for a sensitive indicator of the BSS sedimentation process. Lanzoni et al. (2016) discussed the operational procedure to measure in observational samples and emphasized that in order to perform a meaningful cluster-to-cluster comparison, the parameter must be measured over equivalent radial portions in every system. For this reason, the value of was measured within one half-mass radius () from the center (i.e., out to ) in a sample of 25 GGCs, and a tight link between the parameter (hereafter ) and the position of the BSS-nRD minimum was found (Lanzoni et al., 2016), providing an empirical link between the two indicators and confirming that both are describing the same physical process. In addition Lanzoni et al. (2016) found a nice correlation between and the central relaxation time of the cluster (), in the sense that the new indicator systematically decreases for increasing values of the relaxation time. Thus, the parameter turns out to be an efficient indicator of the level of dynamical evolution experienced by star clusters since their formation.
NGC 6388 is one of the clusters discussed in Lanzoni et al. (2016), who adopted the BSS sample obtained from HST-WFPC2 observations by Dalessandro et al. (2008), which was complete but limited only to the brightest portion of the sequence (corresponding to ).444Note that the sample of BSSs used in Lanzoni et al. (2016) to measure the parameter was the same adopted by Ferraro et al. (2012) to locate the position of the minimum of the BSS-nRD. This required to cover the entire cluster radial extension by complementing HST data with wide-field photometry obtained from the ground. In turn, the necessity of considering samples of BSSs homogeneous in magnitude over the whole cluster forced us to use only the brightest portion of the BSS sequence even in the regions observed with the HST, where much fainter magnitudes were reached. Indeed, the value of that we measure here by considering only such a sub-sample turns out to be , in perfect agreement with the value quoted in Lanzoni et al. (2016). On the other hand, the severe Galactic field contamination affecting the faintest portion of the BSS sequence (see also SP16) and the lack of accurate PMs especially in the innermost cluster regions (see Sect. 4.2), suggest that the investigation of the entire BSS sequence of NGC 6388 is unreliable at the moment. Hence for this cluster here we adopt the value .
For the other three clusters in our samples, we followed the prescriptions by Lanzoni et al. (2016) to measure the value of . As a first step, the cluster center needs to be determined. To this end, we adopted the iterative procedure proposed by Montegriffo et al. (1995, see also and ), and we determined the center of gravity () by averaging the right ascension () and declination () of all the stars detected within a circle of (first-guess) radius , brighter than a given magnitude limit. Depending on the cluster characteristics, in each GC we selected the optimal range of stellar magnitudes to guarantee high enough statistics and to avoid spurious effects due to photometric incompleteness. In the specific cases presented here, we used all the stars down to the MS-TO region (approximately with ). Table 4 lists the adopted values of and reports the differences with respect to those quoted in Goldsbury et al. (2010). These are always smaller than , both in and in , with the exception of NGC 6541, for which a difference of in is found.
Once is located, to determine one needs to compare the cumulative radial distribution of BSSs out to , with that of a reference population assumed to trace normal cluster stars. In all the selected GCs, the radial region extending from out to is entirely covered by the WFC3/UVIS data. For a proper comparison with the results of Lanzoni et al. (2016), where only the bright portion of the BSS sequence has been used (see footnote 4), here we computed by considering BSSs with (see Fig. 2). Moreover, we adopted both the HB and the RGB populations as reference, and we assumed the average of the two resulting values as the best estimate of , and the standard deviation as its error.
Figure 8 shows the cumulative radial distributions of BSSs and HB stars for the clusters in our sample. The adopted values of are labelled in the figure and listed in Table 2.555The values of obtained from the catalogs of Soto et al. (2016) and Simunovic & Puzia (2016) for the clusters in common are always smaller than those found here, with average and maximum differences of 0.04 and 0.09, respectively. In the case of NGC 6541, the value of changes from 0.24 to 0.22 if the center determined by Goldsbury et al. (2010) is adopted. More in general, to explore the effect of an unprecise location of the cluster center, we have re-determined by applying an arbitrary shift of in all directions to the nominal value of . We found variations of 0.01-0.04, the largest effect beeing observed (as expected) for the most concentrated system (NGC 7078). Figure 9 shows the behaviour of the parameter as a function of (expressed in units of Hubble time ) for the four clusters presented here (see red circles), compared to the 25 GGCs discussed in Lanzoni et al. (2016). As it can be seen, they nicely fit into the relation, thus providing new support to the fact that is a powerful indicator of the cluster dynamical evolution and, once properly calibrated, it promises to be usable as a direct measure of the central relaxation time of these systems.
6 Summary
The results discussed in this paper represent the first application of the so-called UV-route to the BSS search for the targets observed in the UV Legacy Survey of GGCs. As a preparatory work, here we discussed the UV-driven BSS catalogs of four massive and high-density clusters, addressing the following topics: (i) we quantitatively demonstrated that the UV-driven search is the most efficient route to construct complete samples of BSSs; (ii) we showed the benefits of using UV-driven over optical-driven catalogs for the quantitative analysis of evolved stellar populations; (iii) we provided additional support to the use of the parameter as a powerful indicator of cluster dynamical evolution. In a forthcoming paper (Ferraro et al. 2017) we will extend this analysis to the entire sample of clusters observed in the UV Legacy Survey, presenting and discussing the final catalogs of BSSs for all the observed systems and the calibration of the parameter in terms of the parent cluster dynamical age.
The reference list from the paper itself. Each links out to its DOI / PubMed record.
- 1Alessandrini et al. (2016) Alessandrini, E., Lanzoni, B., Miocchi, Ferraro, F. R., Vesperini, E. 2016, Ap J, 833, 252
- 2Baldwin et al. (2016) Baldwin, A. T., Watkins, L. L., van der Marel, R. P., et al. 2016, Ap J, 827, 12
- 3Beccari et al. (2011) Beccari, G., Sollima, A., Ferraro, F. R., et al. 2011, Ap J, 737, 3.
- 4Beccari et al. (2012) Beccari, G., Lützgendorf, N., Olczak, C., et al. 2012, Ap J, 754, 108
- 5Bellini et al. (2014) Bellini, A., Anderson, J., van der Marel, R. P., et al. 2014, Ap J, 797, 115
- 6Binney & Tremaine (1987) Binney, J., & Tremaine, S. 1987, Princeton, NJ, Princeton University Press, 1987, 747 p.,
- 7Chatterjee et al. (2013) Chatterjee, S., Rasio, F. A., Sills, A., & Glebbeek, E. 2013 a, Ap J, 777, 106
- 8Chen & Han (2009) Chen, X., & Han, Z. 2009, MNRAS, 395, 1822