Network Structure Explains the Impact of Attitudes on Voting Decisions
Jonas Dalege, Denny Borsboom, Frenk van Harreveld, Lourens J. Waldorp,, Han L. J. van der Maas

TL;DR
This paper shows that the structure of attitude networks, especially their connectivity and central elements, explains how attitudes influence voting decisions, enabling better prediction of voting behavior.
Contribution
It introduces a network model to predict voting behavior based on attitude connectivity and centrality, a novel approach in political psychology.
Findings
More connected attitude networks have a stronger impact on voting.
Central attitude elements exert the greatest influence on behavior.
Predictive power of attitudes depends on network connectivity.
Abstract
Attitudes can have a profound impact on socially relevant behaviours, such as voting. However, this effect is not uniform across situations or individuals, and it is at present difficult to predict whether attitudes will predict behaviour in any given circumstance. Using a network model, we demonstrate that (a) more strongly connected attitude networks have a stronger impact on behaviour, and (b) within any given attitude network, the most central attitude elements have the strongest impact. We test these hypotheses using data on voting and attitudes toward presidential candidates in the US presidential elections from 1980 to 2012. These analyses confirm that the predictive value of attitude networks depends almost entirely on their level of connectivity, with more central attitude elements having stronger impact. The impact of attitudes on voting behaviour can thus be reliably…
Click any figure to enlarge with its caption.
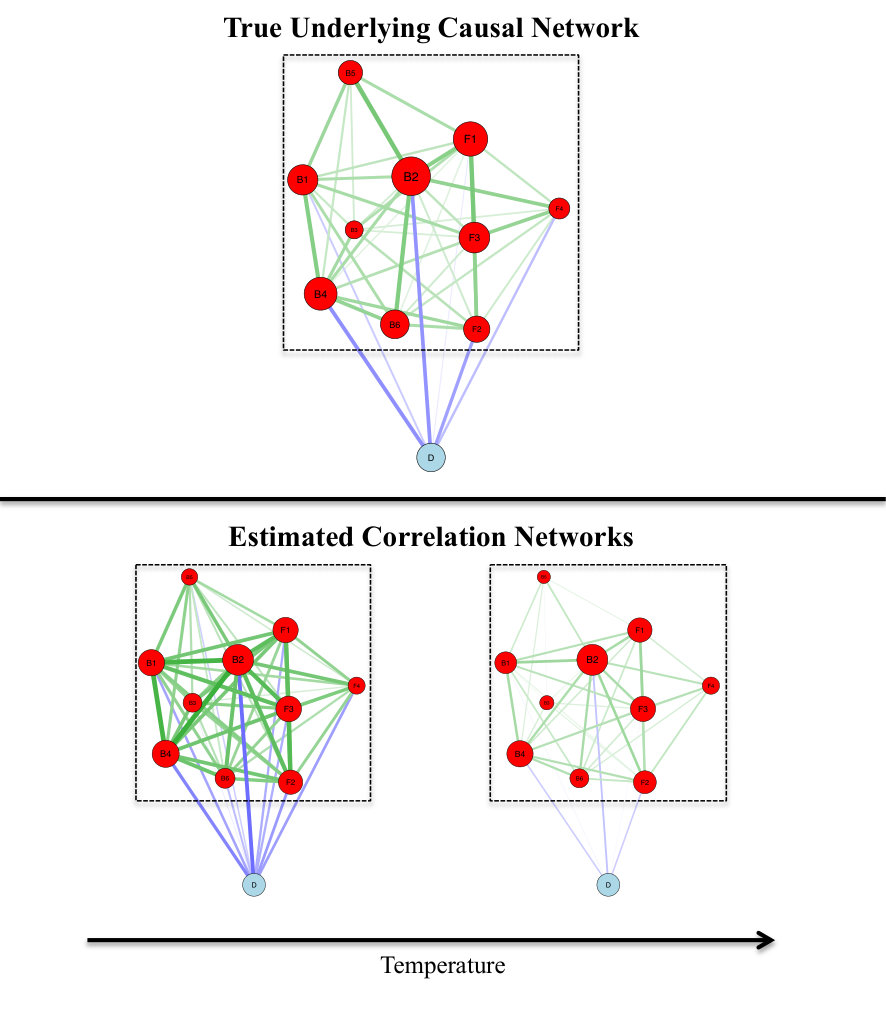 Figure 1
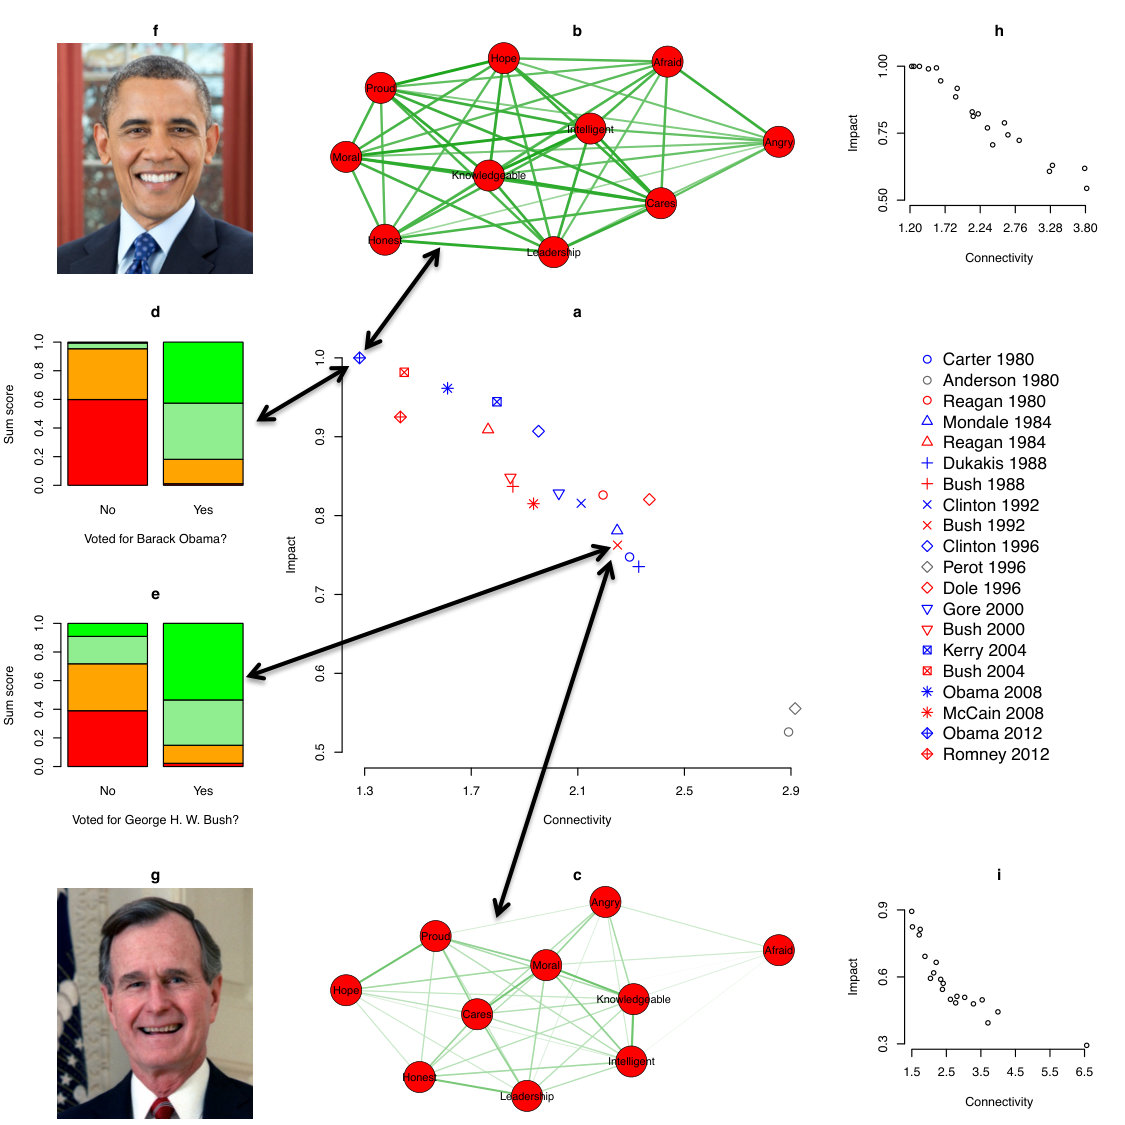 Figure 2
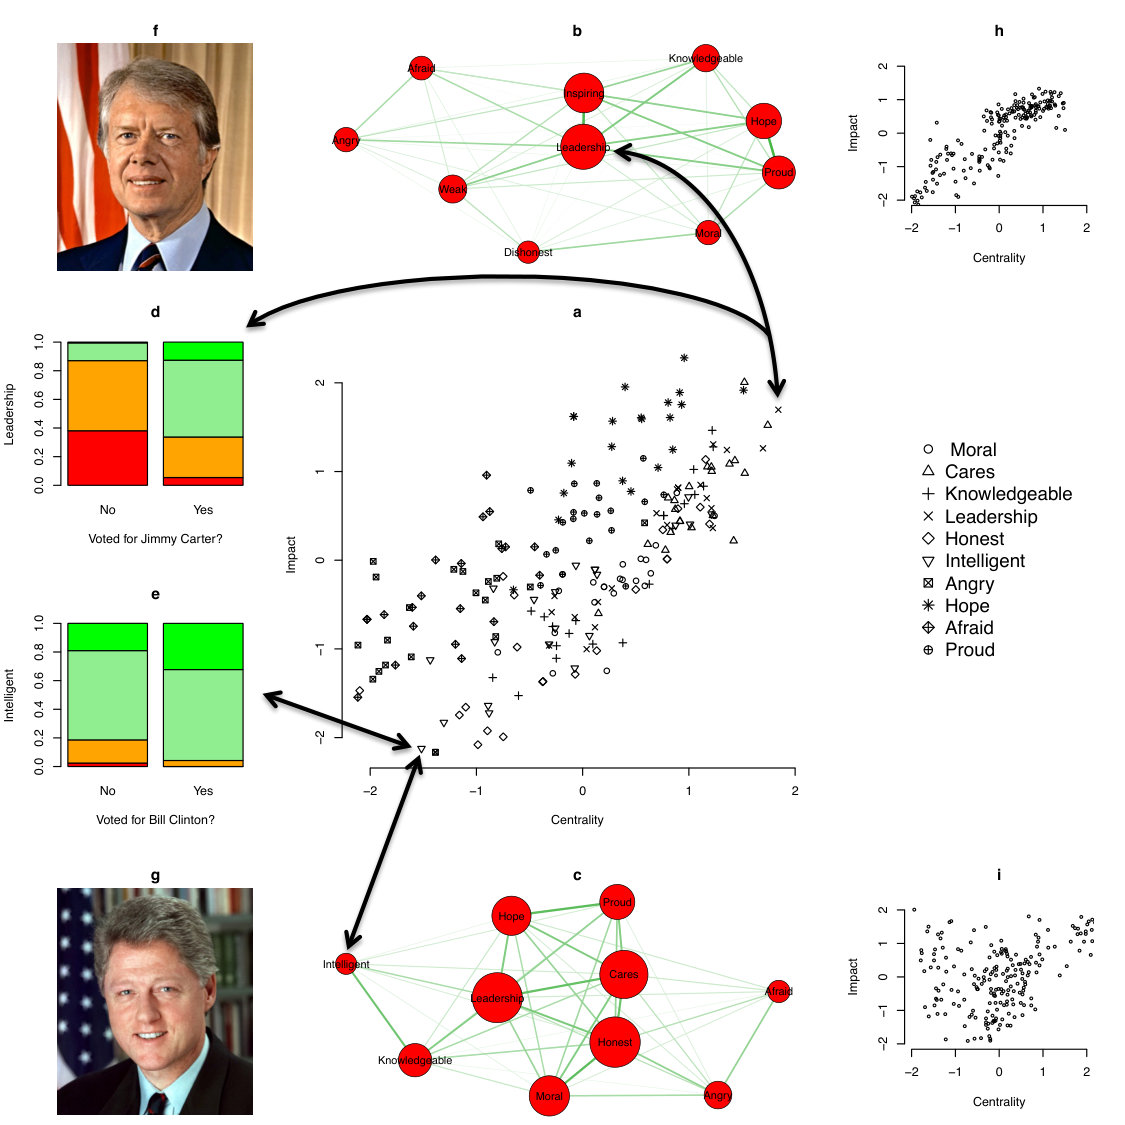 Figure 3
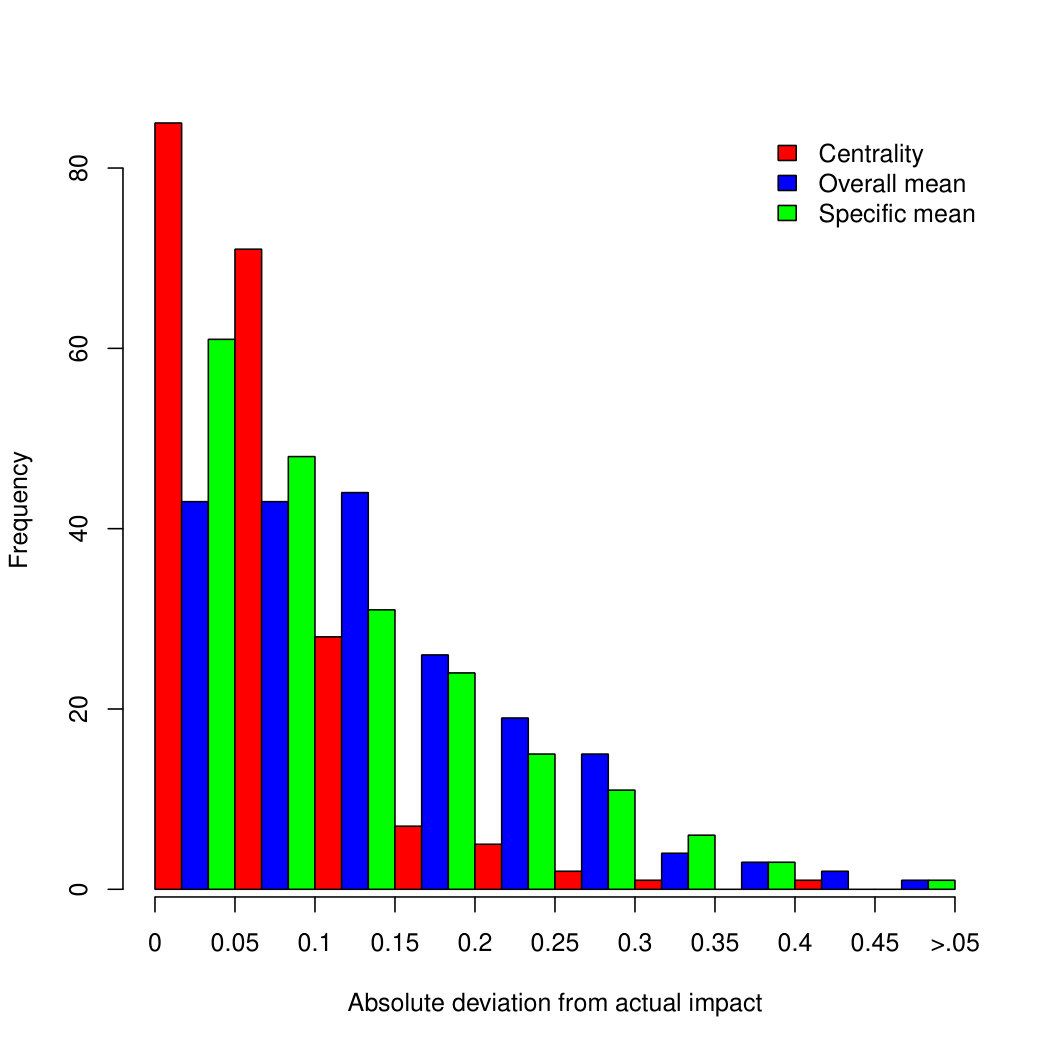 Figure 4
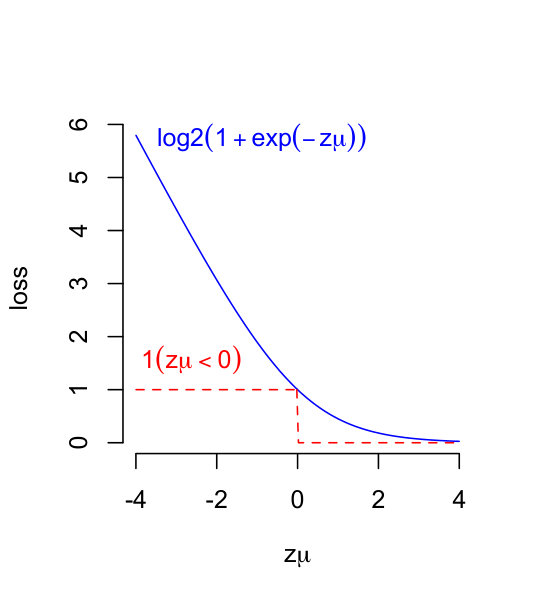 Figure 1
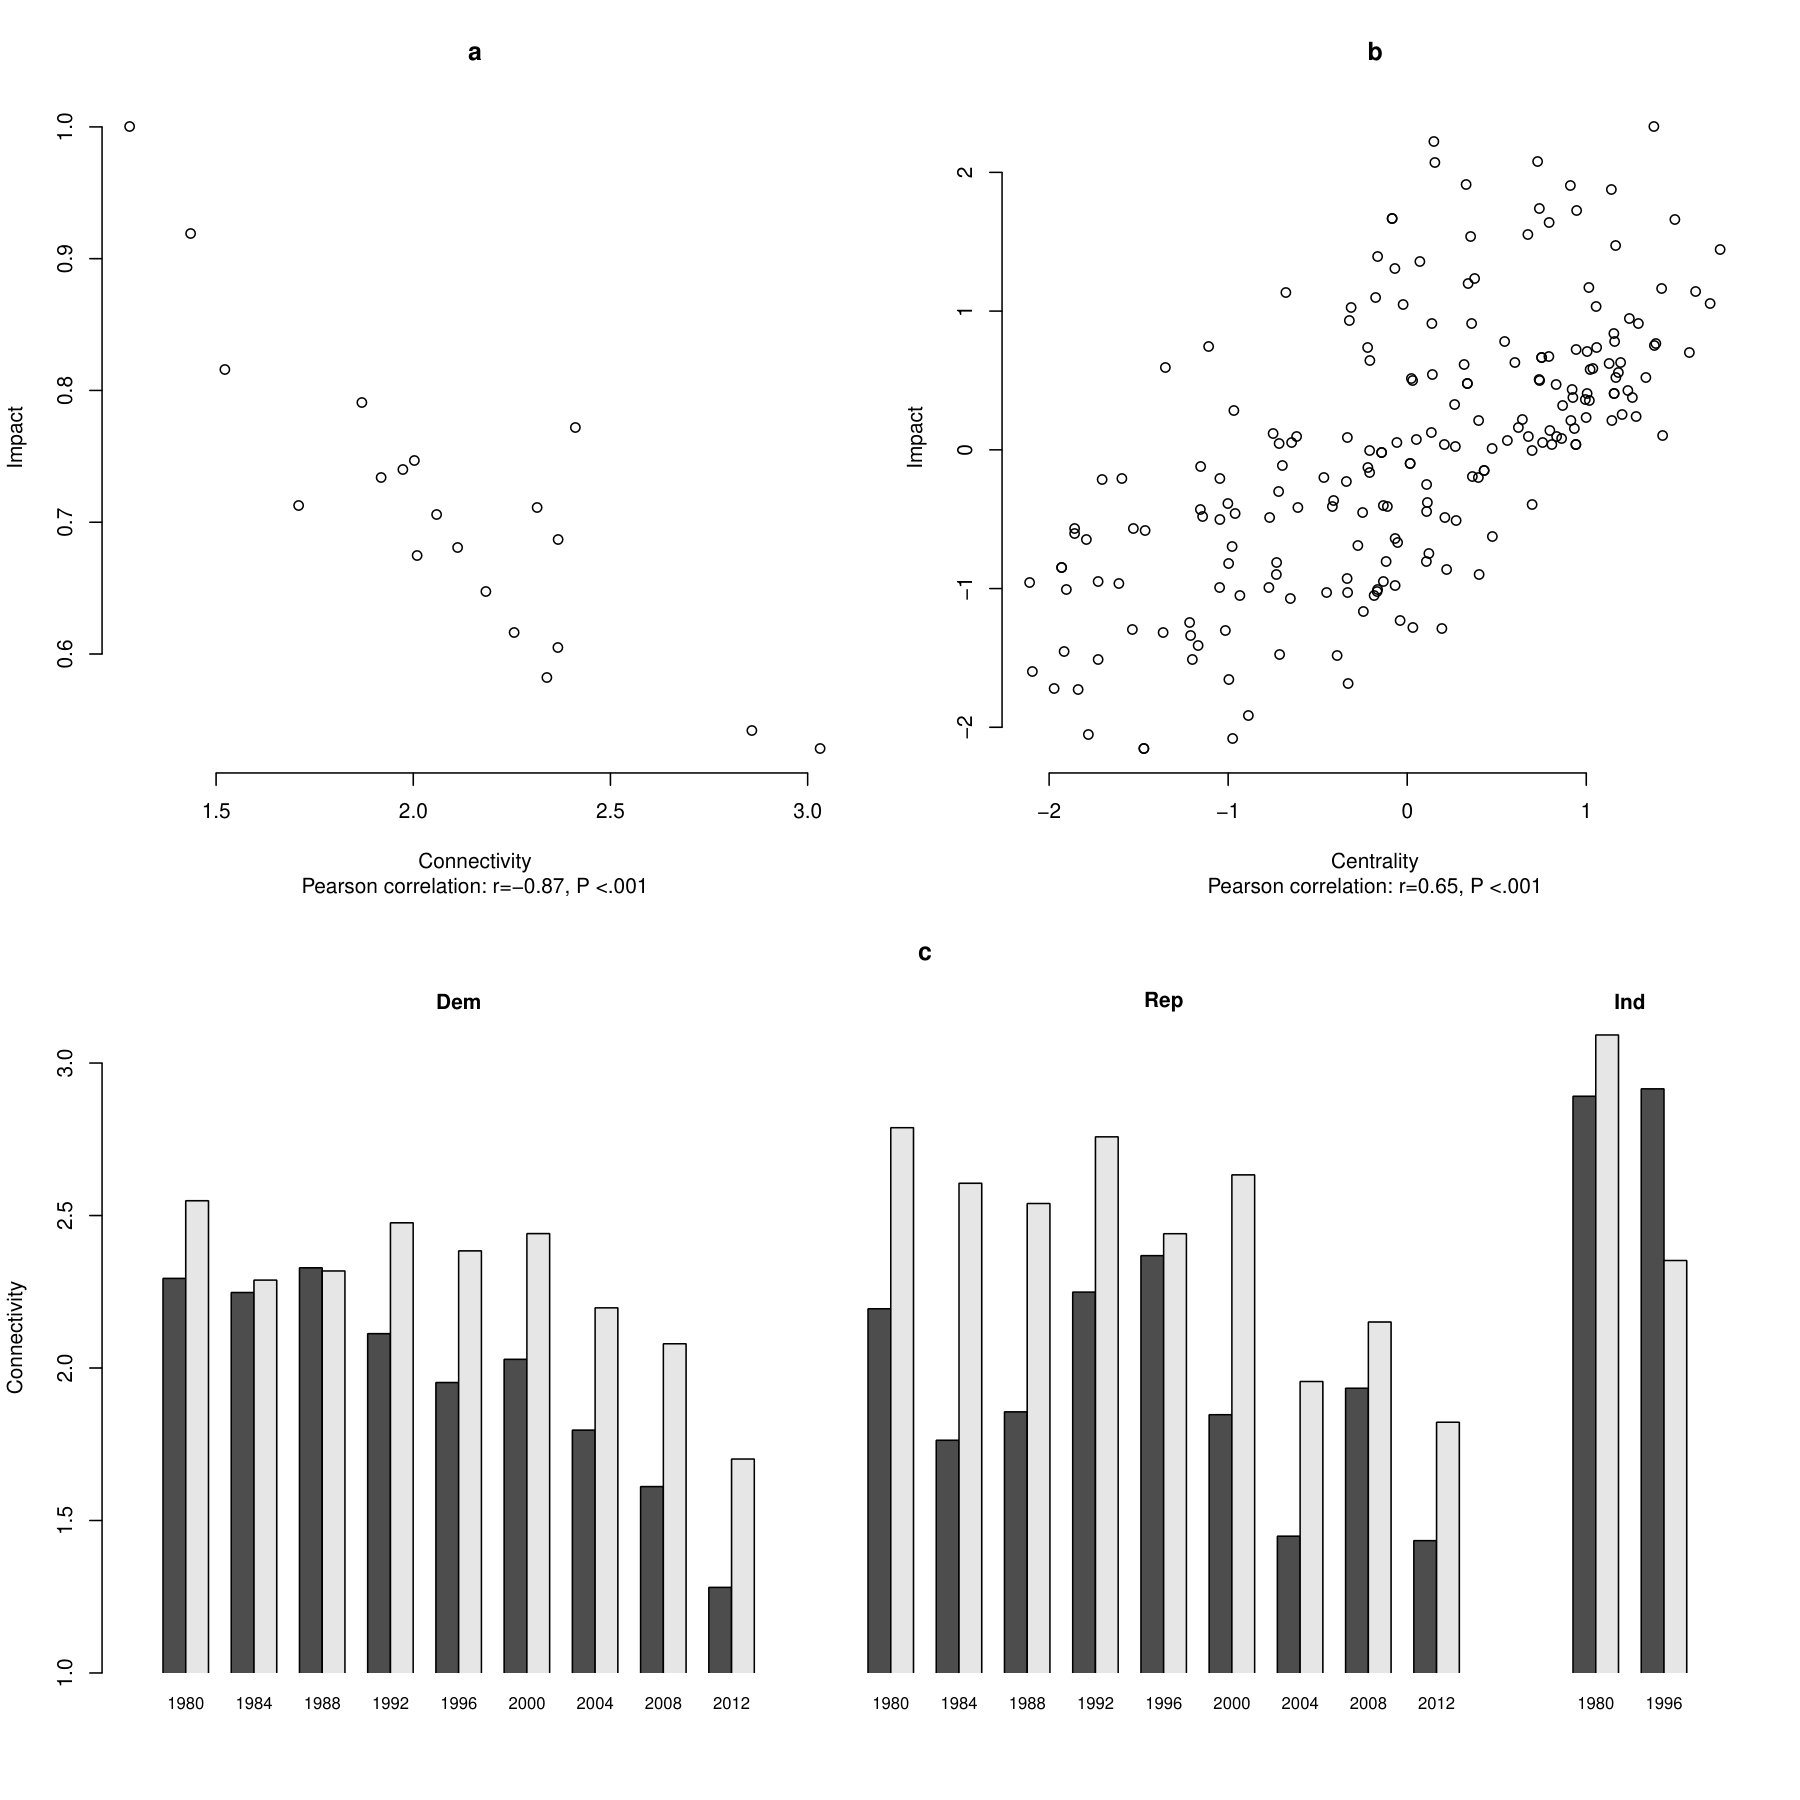 Figure 2
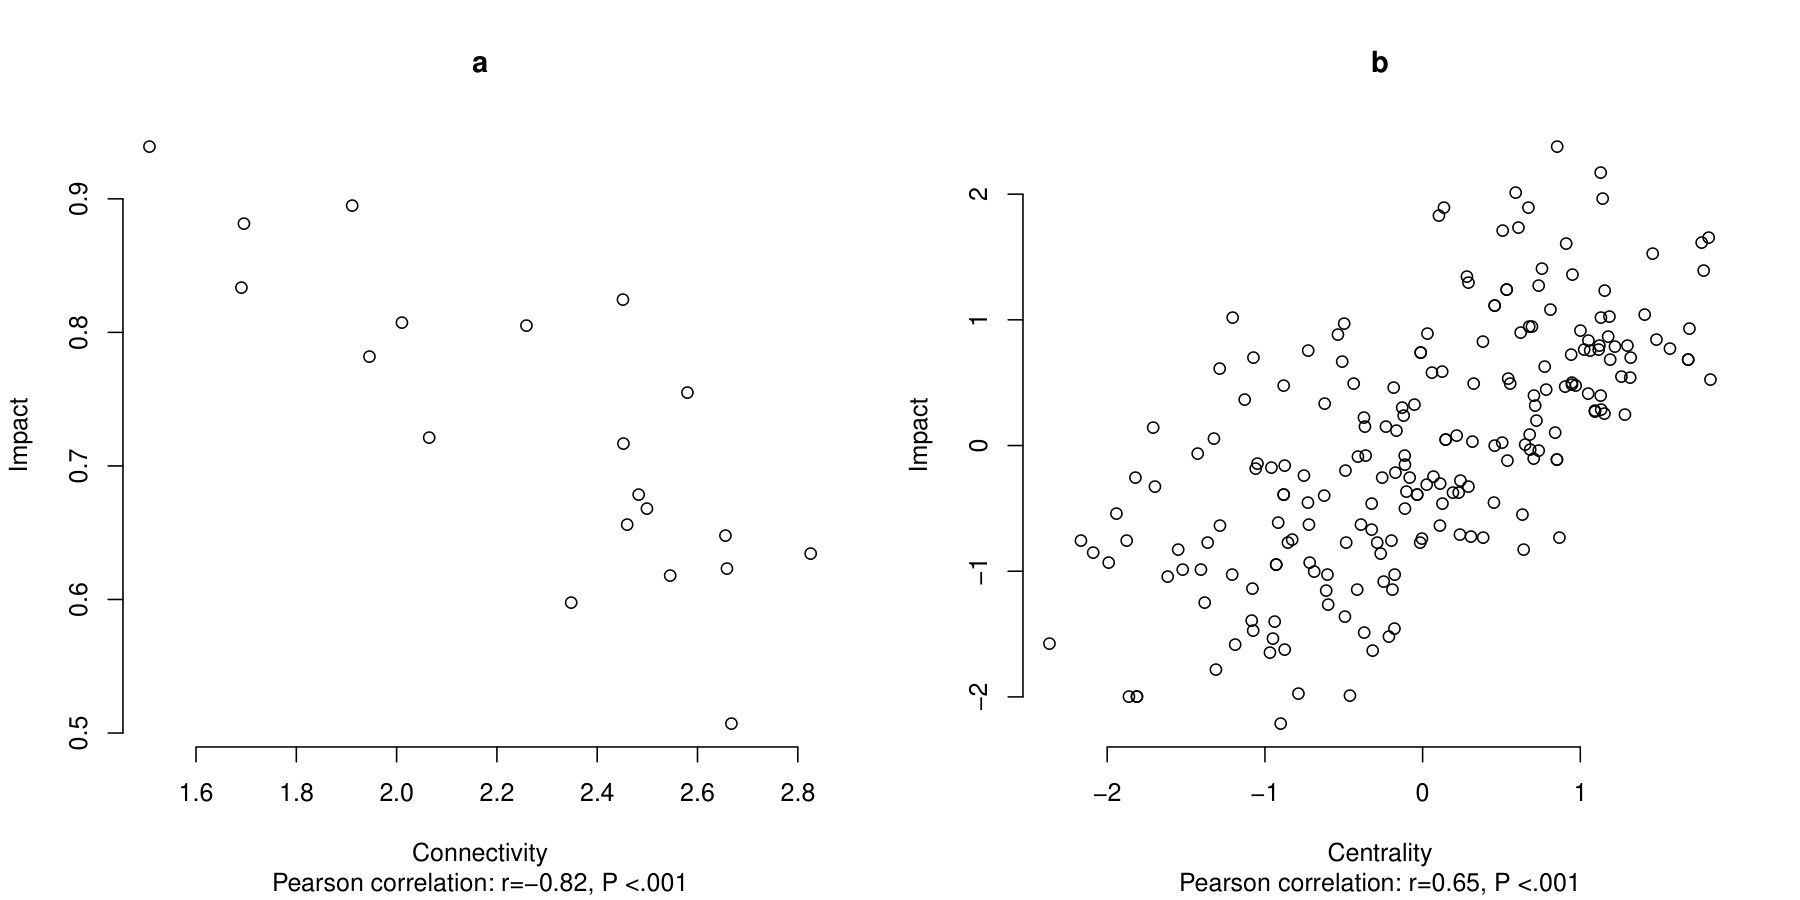 Figure 3
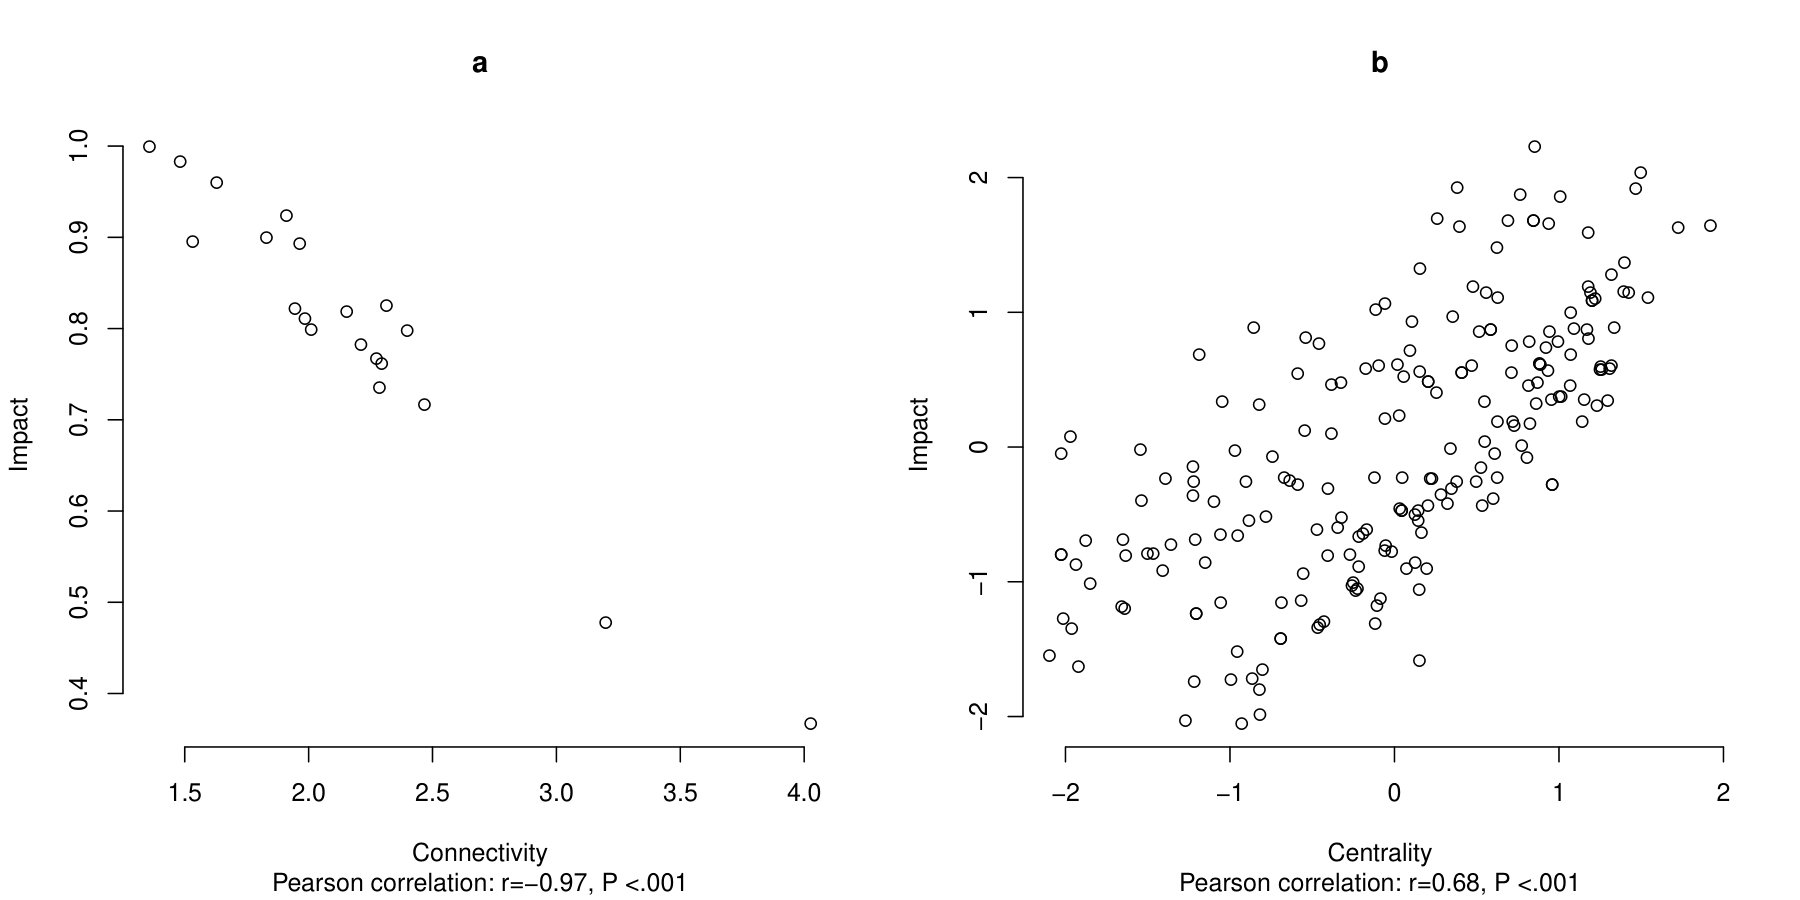 Figure 4
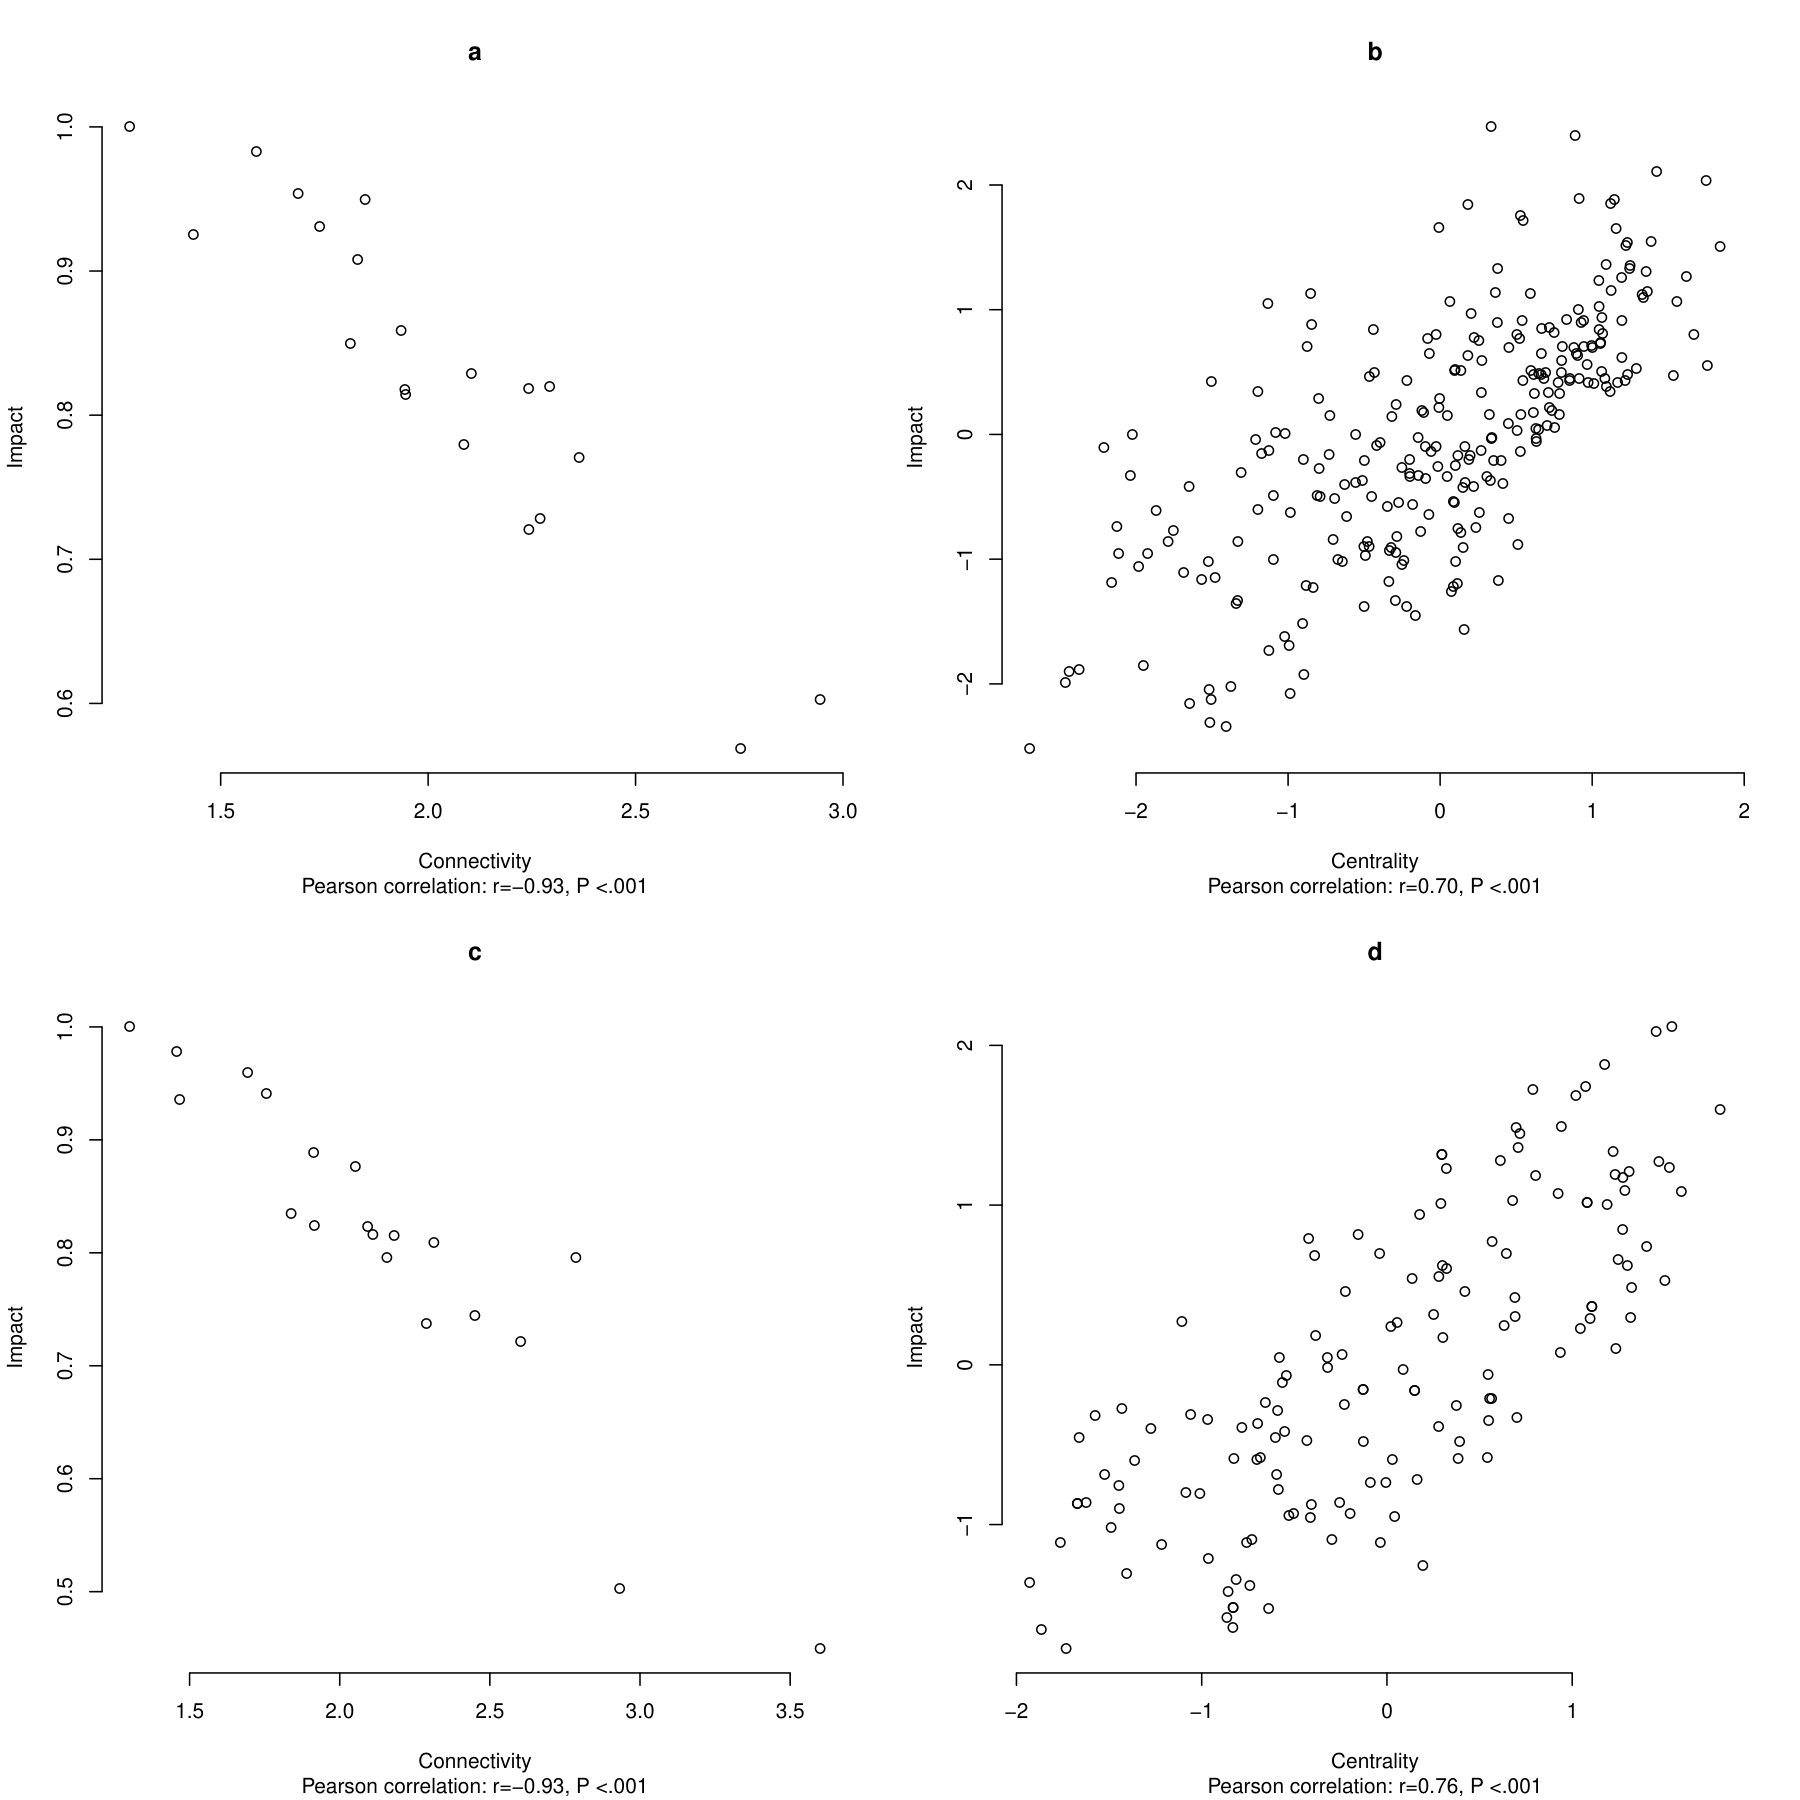 Figure 5
| Attitude element | Included in data set | Substituted by |
|---|---|---|
| ”is honest”* | 1988–1996, 2008–2012 | ”is dishonest”* (1980, 2000–2004), ”is decent”* (1984) |
| ”is intelligent”* | 1984–1992, 1996 (Clinton), 2000–2012 | ”is weak”* (1980), ”gets things done”* (1996 Dole) |
| ”is knowledgeable”* | 1980–2012 | NA |
| ”is moral”* | 1980–2012 | NA |
| ”really cares about people like you”* | 1984–2012 | ”is inspiring”* (1980) |
| ”would provide strong leadership”* | 1980–2012 | NA |
| ”angry”** | 1980–2012 | NA |
| ”afraid”** | 1980–2012 | NA |
| ”hopeful”** | 1980–2012 | NA |
| ”proud”** | 1980–2012 | NA |
| Preferential attachment | Small-world | Random graph | |
| Connectivity/impact correlations | |||
| Normal distribution | mean r=-0.91 | mean r=-0.91 | mean r=-0.90 |
| s.d. r=0.07 | s.d. r=0.05 | s.d. r=0.08 | |
| Power-law distribution | mean r=-0.92 | mean r=-0.91 | mean r=-0.91 |
| s.d. r=0.05 | s.d. r=0.05 | s.d. r=0.04 | |
| Uniform distribution | mean r=-0.92 | mean r=-0.89 | mean r=-0.90 |
| s.d. r=0.05 | s.d. r=0.08 | s.d. r=0.08 | |
| Centrality/impact correlations | |||
| Normal distribution | mean r=0.72 | mean r=0.51 | mean r=0.57 |
| s.d. r=0.18 | s.d. r=0.33 | s.d. r=0.27 | |
| Power-law distribution | mean r=0.70 | mean r=0.46 | mean r=0.60 |
| s.d. r=0.19 | s.d. r=0.34 | s.d. r=0.23 | |
| Uniform distribution | mean r=0.68 | mean r=0.49 | mean r=0.60 |
| s.d. r=0.24 | s.d. r=0.29 | s.d. r=0.25 | |
| Election | N complete sample | N non-voters | N missing values Democratic candidates) | N missing values (Republican candidates) |
|---|---|---|---|---|
| 1980 | 1,614 | 411 | 338 | 396 |
| 1984 | 2,257 | 539 | 583 | 435 |
| 1988 | 2,040 | 545 | 470 | 477 |
| 1992 | 2,485 | 562 | 567 | 358 |
| 1996 | 1,714* | 374 | 239 | 318 |
| 2000 | 1,807 | 376 | 440 | 493 |
| 2004 | 1,212 | 231 | 282 | 195 |
| 2008 | 2,322 | 509 | 368 | 390 |
| 2012 | 5,914 | 1,141 | 557 | 644 |
| Candidate | One-factor model | Hierarchical model |
|---|---|---|
| Carter 1980 | , , | , , |
| Reagan 1980 | , , | , , |
| * | ||
| Anderson 1980 | , , | , , |
| * | ||
| Mondale 1984 | , , | , , |
| Reagan 1984 | , , | , , |
| * | ||
| Dukakis 1988 | , , | , , |
| Bush 1988 | , , | , , |
| * | ||
| Clinton 1992 | , , | , , |
| * | ||
| Bush 1992 | , , | , , |
| * | ||
| Clinton 1996 | , , | , , |
| * | ||
| Dole 1996 | , , | , , |
| Perot 1996 | , , | Fit measures could not be computed* |
| Gore 2000 | , , | , , |
| Bush 2000 | , , | , , |
| Kerry 2004 | , , | , , |
| * | ||
| Bush 2004 | , , | , , |
| * | ||
| Obama 2008 | , , | , , |
| * | ||
| McCain 2008 | , , | , , |
| Obama 2012 | , , | , , |
| Romney 2012 | , , | , , |
Peer Reviews
No public reviews on file for this paper yet. If you reviewed it on a platform where reviews are public (OpenReview, ICLR, NeurIPS, ICML), you can paste yours below so the community can read it here.
Videos
No videos yet. Explain this paper in a talk, walkthrough, or lecture? Add one.
Network Structure Explains the Impact of Attitudes on Voting Decisions
Jonas Dalege
Department of Psychology, University of Amsterdam, 1018 WT Amsterdam, The Netherlands
Denny Borsboom
Department of Psychology, University of Amsterdam, 1018 WT Amsterdam, The Netherlands
Frenk van Harreveld
Department of Psychology, University of Amsterdam, 1018 WT Amsterdam, The Netherlands
Lourens J. Waldorp & Han L. J. van der Maas
Department of Psychology, University of Amsterdam, 1018 WT Amsterdam, The Netherlands
Attitudes can have a profound impact on socially relevant behaviours, such as voting. However, this effect is not uniform across situations or individuals, and it is at present difficult to predict whether attitudes will predict behaviour in any given circumstance. Using a network model, we demonstrate that (a) more strongly connected attitude networks have a stronger impact on behaviour, and (b) within any given attitude network, the most central attitude elements have the strongest impact. We test these hypotheses using data on voting and attitudes toward presidential candidates in the US presidential elections from 1980 to 2012. These analyses confirm that the predictive value of attitude networks depends almost entirely on their level of connectivity, with more central attitude elements having stronger impact. The impact of attitudes on voting behaviour can thus be reliably determined before elections take place by using network analyses.
S uppose you are one of the more than 130 million Americans who voted in the presidential election in 2016. Let us further assume that you were supportive of Hillary Clinton: You mostly held positive beliefs (e.g., you thought she was a good leader and a knowledgeable person) and you had positive feelings toward her (e.g., she made you feel hopeful and proud), representing a positive attitude toward Hillary Clinton Dalege \BOthers. (\APACyear2016); Eagly \BBA Chaiken (\APACyear1993); Fishbein \BBA Ajzen (\APACyear1975); Rosenberg \BOthers. (\APACyear1960). However, you also held a few negative beliefs toward her (e.g., you thought that Hillary Clinton was not very honest). Did your overall positive attitude cause you to vote for Hillary Clinton? Here we show that the answer to this question depends on the network structure of your attitude: First, we show that the impact of attitudes (i.e., average of the attitude elements) on behavioural decisions depends on the connectivity of the attitude network (e.g., your the network of your positive attitude toward Hillary Clinton was highly connected, so you probably voted for Hillary Clinton). Second, we show that central attitude elements have a stronger impact on behavioural decisions than peripheral attitude elements (e.g., your positive beliefs about Hillary Clinton were more central in your attitude network than your negative beliefs, so the chance that you voted for Hillary Clinton further increased). We thus provide insight into how structural properties of attitudes determine the extent to which attitudes have impact on behaviour.
In network theory, dynamical systems are modelled as a set of nodes, representing autonomous entities, and edges, representing interactions between the nodes Newman (\APACyear2010). The set of nodes and edges jointly defines a network structure. Modelling complex systems in this way has probably become the most promising data-analytic tool to tackle complexity in many fields Barabási (\APACyear2011), such as physics Barabási \BBA Albert (\APACyear1999); Watts \BBA Strogatz (\APACyear1998), biology Barabási \BBA Zoltán (\APACyear2004), and psychology Cramer \BOthers. (\APACyear2010, \APACyear2012); van de Leemput \BOthers. (\APACyear2014); van Borkulo \BOthers. (\APACyear2015). Recently, network analysis has also been introduced to the research on attitudes in the form of the Causal Attitude Network (CAN) model Dalege \BOthers. (\APACyear2016). In this model, attitudes are conceptualized as networks, in which nodes represent attitude elements that are connected by direct causal interactions (see Figure 1). The CAN model further assumes that the Ising model Ising (\APACyear1925), which originated from statistical physics, represents an idealized model of attitude dynamics.
In the Ising model, the probability of configurations (i.e., the states of all nodes in the network), which represents the overall state of the attitude network, depends on the amount of energy of a given configuration. The energy of a given configuration can be calculated using the Hamiltonian function:
[TABLE]
Here, k distinct attitude elements 1,….,i,j,….k are represented as nodes that engage in pairwise interactions; the variables and represent the states of nodes i and j respectively. The model is designed to represent the probability of these states as a function of a number of parameters that encode the network structure. The parameter is the threshold of node i, which determines the disposition of that node to be in a positive state (1; endorsing an attitude element) or negative state (-1, not endorsing an attitude element) regardless of the state of the other nodes in the network (statistically, this parameter functions as an intercept). The parameter represents the edge weight (i.e., the strength of interaction) between nodes i and j. As can be seen in this equation, the Hamiltonian energy decreases if nodes are in a state that is congruent with their threshold and when two nodes having positive (negative) edge weights assume the same (different) state. Assuming that attitude elements of the same (different) valence are generally positively (negatively) connected, attitude networks thus strive for a consistent representation of the attitude. The probability of a given configuration can be calculated using the Gibbs distribution Murphy (\APACyear2012):
[TABLE]
in which represents the inverse temperature of the system, which can be seen as consistency pressures on attitude networks: reducing (increasing) the temperature of the system results in stronger (weaker) influence of the thresholds and weights, thereby scaling the entropy of the Ising network model Epskamp \BOthers. (\APACyear2016); Wainwright \BBA Jordan (\APACyear2008). An Ising model with low (high) temperature results in a highly (weakly) connected correlation network (see Figure 1). The denominator represents the sum of the energies of all possible configurations, which acts as a normalising factor to ensure that the sum of the probabilities adds up to 1.
Conceptualising attitudes as Ising models allows for the derivation of several hypotheses and a crucial test of this conceptualisation is whether it can advance the understanding of the relation between attitudes and behavioural decisions. In the present paper we apply the CAN model and are the first to (a) formalize and (b) test hypotheses based on the CAN model regarding the impact of attitudes on behaviour.
The impact of attitudes on behaviour has been one of the central research themes in Social Psychology in recent decades Ajzen (\APACyear1991); Glasman \BBA Albarracín (\APACyear2006); Kruglanski \BOthers. (\APACyear2015). The bulk of the research on the relation between attitudes and behaviour has been done under the umbrella definition of attitude strength, which holds that one central feature of strong attitudes is that they have a strong impact on behaviour Krosnick \BBA Petty (\APACyear1995). Several lines of research have identified factors related to attitude strength. Among the most widely researched of these are attitude accessibility, attitude importance, and attitudinal ambivalence. Studies have shown that accessible attitudes (i.e., attitudes that can be easily retrieved from memory) have more impact on behaviour Fazio \BBA Williams (\APACyear1986); Glasman \BBA Albarracín (\APACyear2006). Similarly, higher levels of (subjective) attitude importance (i.e., attitudes, to which a person attaches subjective importance), are related to increased accessibility of attitudes Krosnick (\APACyear1989) and to higher levels of consistency between attitudes and behaviour Krosnick (\APACyear1988); Visser \BOthers. (\APACyear2003). Ambivalent attitudes (i.e., attitudes that are based on both negative and positive associations) are less predictive of behaviour than univalent attitudes Armitage \BBA Conner (\APACyear2000); van Harreveld \BOthers. (\APACyear2015). While these and other attitude strength attributes, such as certainty and extremity, are generally interrelated Krosnick \BOthers. (\APACyear1993); Visser \BOthers. (\APACyear2006), a framework that unifies these different attributes has long been absent in the literature. Recently, however, based on the development of the CAN model, attitude strength was formally conceptualized as network connectivity Dalege \BOthers. (\APACyear2016). The CAN model might thus provide the basis for a comprehensive and formalized framework of the relationship between attitudes and behaviour. Our current aim is to develop and test such a framework. To do so, we first formally derive hypotheses regarding the impact of attitudes on behaviour from the CAN model. Second, we test these hypotheses in the context of voting decisions in the US American presidential elections.
From the CAN model the hypothesis follows that highly connected attitude networks (i.e., attitude networks that are based on Ising models with low temperature) have a strong impact on behaviour. As can be seen in Figure 1, low temperature results in strong connections both between non-behavioural attitude elements (i.e., beliefs and feelings) and between non-behavioural attitude elements and behaviours (e.g., behavioural decisions) Dalege \BOthers. (\APACyear2016). Attitude elements in highly connected networks are thus expected to have a strong impact on behavioural decisions. This leads to the hypothesis that the overall impact of attitudes depends on the connectivity of the attitude network. While the connectivity of attitude networks provides a novel formalisation of attitude strength, earlier approaches to understanding the structure of attitudes fit very well within this framework. For example, studies have shown that important attitudes are more coherent than unimportant attitudes Judd \BOthers. (\APACyear1981); Judd \BBA Krosnick (\APACyear1989) and that strong attitudes have a more consistent structure between feelings and beliefs than weak attitudes Chaiken \BOthers. (\APACyear1995). Also, Phillip E. Converse’s \APACyear1970 distinction between attitudes and nonattitudes based on stability of responses relates to our connectivity framework Dalege \BOthers. (\APACyear2016)
In addition to predicting the overall impact of an attitude from the connectivity of the attitude network, the CAN model predicts that the specific impact of attitude elements depends on their centrality (as defined by their closeness). Closeness refers to how strongly a given node is connected both directly and indirectly to all other nodes in the network Freeman (\APACyear1978); Opsahl \BOthers. (\APACyear2010). In contrast to connectivity, which represents a measure of the whole network, centrality is a measure that applies to individual nodes within the network. Attitude elements high in closeness are good proxies of the overall state of the attitude network, as they hold more information about the rest of the network than peripheral attitude elements, rendering closeness the optimal measure of centrality for our current purposes. We therefore expect central attitude elements to have a stronger impact (directly or indirectly) on a behavioural decision no matter which attitude elements are direct causes of this decision. This can also be seen in Figure 1, as there is a strong relation between a given node’s centrality and it’s correlation with the behavioural decision. It is important to note here that centrality of attitude elements does not refer to the classical definition of attitude centrality, but to the network analytical meaning of centrality. Specific impact of attitude elements has received somewhat less attention in the attitude literature than the global impact of attitudes, with studies either focusing on the primacy of feelings or beliefs in determining behaviour Galdi \BOthers. (\APACyear2008); Lavine \BOthers. (\APACyear1998); Millar \BBA Millar (\APACyear1996) or on the subjective importance of attitude elements van Harreveld \BOthers. (\APACyear2000); van der Pligt \BOthers. (\APACyear2000) and these different lines of research have been carried out much in isolation from each other and from the attitude strength research paradigm <for an exception see¿vanHarreveld2000. It is our view that an advantage of the approach we take in this article is that our framework holds promise in unifying these different approaches to understanding the relation between attitudes and behaviour.
In this paper, we first show that the hypotheses put forward here above directly follow from conceptualising attitudes as networks with a simulation study. We then test these hypotheses using data on attitudes toward candidates and voting in the American presidential elections from 1980-2012. In doing so, we test whether the CAN model provides a comprehensive framework on whether attitudes and which attitude elements drive behavioural decisions. Voting decisions are a perfect test of this postulate, because political attitudes often but not always drive voting decisions Fazio \BBA Williams (\APACyear1986); Galdi \BOthers. (\APACyear2008); Lavine \BOthers. (\APACyear1998); Kraus (\APACyear1986); Markus (\APACyear1982).
Results
Simulation Study
To show that the hypotheses presented above directly follow from conceptualising attitudes as networks, we simulated networks using three popular algorithms to generate networks: preferential attachment Barabási \BBA Albert (\APACyear1999); Albert \BBA Barabási (\APACyear2002), small-world network model Watts \BBA Strogatz (\APACyear1998), and random Erdos-Rényi networks Erdos \BBA Rényi (\APACyear1959) (see also Supplementary Note 1 for analytical solutions). The networks consisted of 11 nodes (which corresponds to the number of nodes in the empirically estimated networks described below), with ten randomly chosen nodes representing attitude elements and one randomly chosen node representing the behavioural decision. Note that in such small networks, network properties other than density and magnitude of edge weights do not play a fundamental role in determining outcomes of the network.
The simulation of networks followed four steps: First, we created a ’base’ network using one of the three algorithms. Second, we added edge weights to the base network, either drawn from a normal distribution, a Pareto power law distribution, or a uniform distribution. Third, to simulate responses of individuals holding attitudes with the network structure of the base network, we used the Ising network model Ising (\APACyear1925). We created 20 different variations of the weighted base network in which the temperature of the Ising model was varied. Fourth, we simulated 1000 individuals based on the variations of the base network. As can be seen in Figure 1, increasing (decreasing) the temperature results in decreasing (increasing) edge weights in the correlation networks.
We repeated this procedure 100 times for each combination of network generating algorithms and edge weights distributions. To investigate whether simulated attitude elements in highly connected networks (i.e., networks, for which the temperature parameter was low) collectively have a strong impact on the simulated decision, we estimated the global connectivity, defined by the Average Shortest Path Length <ASPL,¿West1996 of the simulated attitude elements. We correlated the global connectivity with the average impact (which we operationalize as the biserial correlation between the sum score of the simulated attitude elements and the simulated decision) for each set of 20 networks. This resulted in strong negative correlations collapsed over all combinations of network-generating algorithms and edge weights distributions (Pearson correlations: mean r=-0.91, s.d. r=0.06) and we found strong negative correlations for all of these combinations (see Supplementary Table 1). To investigate whether central nodes (based on closeness) have a strong impact on a decision, we estimated the centrality of the simulated attitude elements and correlated the centrality estimates with the impact of the simulated attitude elements (which we operationalize as the tetrachoric correlation between a given simulated attitude element and the simulated decision). To exclude the possibility that results are driven by differences in average centrality and impact, we standardized both centrality and impact for each network. This resulted in strong positive correlations in the different sets of attitude networks collapsed over all combinations of network-generating algorithms and edge weights distributions (Pearson correlations: mean r=0.59, s.d. r=0.29) and we found strong positive correlations for all of these combinations (see Supplementary Table 1).
Test of Connectivity Hypothesis
These simulations show clearly that the CAN model predicts a strong relation between network connectivity (node centrality) and the predictive utility of attitudes (attitude elements) in forecasting behaviour. This confirms that these intuitively derived hypotheses are indeed formal predictions that must follow if the CAN model is a valid model of attitudes. To provide an empirical test of the hypotheses put forward here, we analysed data from the American National Election Studies (ANES) on the US presidential elections from 1980–2012 (total n=16,988). In each ANES between ten and 24 attitude elements were assessed and we selected ten attitude elements for each election that were most similar to each other, see Table 1. On these ten attitude elements, we estimated attitude networks for each of the two (three) main candidates for the elections in 1984–1992 and in 2000–2012 (in 1980 and 1996). This gave us 20 attitude networks in total. Nodes in these networks represent attitude elements toward the given presidential candidate that were rated by the participants. Edges between the nodes represent zero-order polychoric correlations between the attitude elements. Note that because our networks are based on zero-order correlations, these networks only vary in magnitudes of edge weights and not in density, because correlation networks are always fully connected.
First, we tested whether highly connected attitude networks have strong average impact. As in the simulation study, connectivity was based on the ASPL and average impact was operationalized as the biserial correlation between the sum score of attitude elements and the voting decision. As can be seen in Figure 2, we found a high negative correlation between connectivity and average impact (Pearson correlation: r=-0.95, *P*0.001), supporting our hypothesis.
Test of Centrality Hypothesis
Second, we tested whether central attitude elements have a strong impact. This impact was operationalized as the polychoric correlation between a given attitude element and the voting decision. We again standardized the centrality and impact estimates to exclude the possibility that results are driven by differences in mean centrality and mean impact. As can be seen in Figure 3, we found a high positive correlation between standardized centrality and standardized impact (Pearson correlation: r=0.70, *P*0.001), supporting our hypothesis.
Forecast Analysis
To illustrate the practical relevance of our findings, we investigated whether centrality of attitude elements can be used to forecast the impact on voting decisions before knowing the outcome of the election (e.g., whether our analyses can be used to forecast the impact of attitude elements on the next presidential election). For each election (e.g., election of 2012), we estimated the regression parameters between impact and centrality from all elections except the forecasted election (e.g., 1980-2008). We calculated the predicted impact in the forecasted election using the centrality indices of the forecasted election and the regression parameters. As can be seen in Figure 4, the predicted impact was very close to the actual impact (deviation median=0.06, deviation interquartile range=0.03-0.09) and outperformed both using the mean of all attitude elements (Deviation median=0.12, deviation interquartile range=0.06-0.18, Wilcoxon-matched pairs test: V=3346, *P*0.001, CLES=69.5%) and using the means of the specific attitude elements (Deviation median=0.09, deviation interquartile range=0.04-0.17, Wilcoxon-matched pairs test: V=5057, *P*0.001, CLES=65.2%). Using centrality thus creates the possibility to forecast the (almost) exact impact of an attitude element on the voting decision.
Discussion
Starting in the 1930s with Richard T. LaPiere’s \APACyear1934 work, attitude-behaviour consistency has been one of the central research themes in Social Psychology Ajzen (\APACyear1991); Fazio \BBA Williams (\APACyear1986); Fishbein \BBA Ajzen (\APACyear1975); Glasman \BBA Albarracín (\APACyear2006); Kraus (\APACyear1986); Wicker (\APACyear1969). While early work focused on the question whether attitudes drive or do not drive behaviour Wicker (\APACyear1969), more recent work has focused on when attitudes drive behaviour Glasman \BBA Albarracín (\APACyear2006); Bagozzi \BBA Baumgartner (\APACyear1986); Ajzen \BBA Fishbein (\APACyear1977); Fazio \BBA Williams (\APACyear1986); Fazio \BBA Zanna (\APACyear1981). This article provides a formalized and parsimonious answer to the question when attitudes drive behaviour: The impact of attitudes on behaviour depends on the connectivity of the attitude network, with central attitude elements having the highest impact on behaviour within a given attitude network.
The present research has shown that network structure of attitudes can inform election campaign strategies (and behavioural change programs in general) by predicting both the extent to which individuals base their decision on their attitude and the extent to which an attitude element influences voting decision (and other behaviour relevant to an attitude). Connectivity can help inform how effective candidate-centred campaigns would be. High connectivity indicates that voting decisions highly depend on candidate attitudes, while low connectivity indicates that other factors may play a more substantial role than candidate attitudes, such as party identification Bartels (\APACyear2000); Miller (\APACyear1991), ideology Jacoby (\APACyear2010); Palfrey \BBA Poole (\APACyear1987), and public policy issues Abramowitz (\APACyear1995); Aldrich \BOthers. (\APACyear1989); Carmines \BBA Stimson (\APACyear1980); Palfrey \BBA Poole (\APACyear1978); Nadeau \BBA Lewis-Beck (\APACyear2001); Rabinowitz \BBA MacDonald (\APACyear1989). Centrality can furthermore inform on the effectiveness of targeting specific attitude elements, as changing a central attitude element is probably more likely to affect the voting decision than changing a peripheral attitude element.
Future research might focus on how connectivity and centrality of attitude networks relate to other factors that influence voting decision. Among the most important factors influencing voting decisions are party identification Bartels (\APACyear2000); Miller (\APACyear1991) and specific policy issues Abramowitz (\APACyear1995); Aldrich \BOthers. (\APACyear1989); Carmines \BBA Stimson (\APACyear1980); Palfrey \BBA Poole (\APACyear1978); Nadeau \BBA Lewis-Beck (\APACyear2001); Rabinowitz \BBA MacDonald (\APACyear1989). First, party identification might influence the connectivity of attitude networks, because it is likely that individuals, who identify with a political party, have a stronger drive for consistency in their attitudes toward presidential candidates. Party identification makes it also more likely that a given individual adopts a positive attitude toward the candidate of their party and it might also directly influence the voting decision. This makes party identification a possible confound of our results and we therefore also ran our analyses including only individuals, who do not identify with a political party. The results of this analysis mirrored the results of the results reported in this paper (see Supplementary Note 3 & Supplementary Figure 3). Second, policy issues might influence the centrality of attitude elements. If, for example, the current political climate is highly focused on foreign policies (e.g., the conflict in Syria), judging a candidate to be competent in respect to foreign policy making might take a central place in the attitude network. Generally, it is an important question for future research why some attitude elements are more central than others. Our analyses indicate that there are some attitude elements that are chronically central (see Figure 3), with some variation that might be due to the specifics of the political climate during the different elections.
Another promising venture for future research would be to investigate how attitude networks develop during an election campaign. To do so, one could apply several intermediate assessments during the election campaign Erikson \BBA Wlezien (\APACyear1999); Taleb (\APACyear2017); Wlezien (\APACyear2003); Dalege \BOthers. (\APACyear2017).The use of such intermediate assessment was shown to improve the prediction of election outcomes Taleb (\APACyear2017). How might attitude networks change during an election? Based on the CAN model, we expect that (a) the connectivity of attitude networks heighten during an election campaign and (b) attitude networks probably grow due to the addition of newly formed attitude elements Dalege \BOthers. (\APACyear2016). Also, predictions regarding the success of an election campaign to change a given person’s attitude can be derived from the CAN model. Individuals holding attitudes that are based on highly connected networks already at the beginning of an election campaign are likely to not change their attitudes. Election campaigns might thus benefit from focusing on individuals holding attitudes that are based on weakly connected networks Dalege \BOthers. (\APACyear2017).
In a broader sense, the CAN model advances our understanding of the relation between attitudes and behavioural decisions. Because the CAN model is a general model of attitudes, the results reported here likely generalize to other attitudes and behavioural decisions than those studied here as well. Using connectivity of attitude networks and centrality of attitude elements may for example provide more insight into issues such as which factors drive individuals to continue or stop smoking, buy a certain product, or behave aggressively toward a minority group. Furthermore, connectivity of attitude networks might unify the different approaches to explain variations in attitude-behaviour consistency, as it is likely that network connectivity is the glue that holds these factors together Dalege \BOthers. (\APACyear2016) and because our results indicate that network connectivity comprehensively explains variations in attitude-behaviour consistency. Several predictions above and beyond the findings reported here can also be derived from the network structure of attitudes. For example, network structure predicts when and which persuasion attempts will be successful Dalege \BOthers. (\APACyear2016). Network theory thus holds great promise for advancing our understanding of the dynamical and structural properties of attitudes and their relation to a plethora of consequential human behaviours.
Methods
Simulation of Networks
The simulation of networks followed four steps. First, an unweighted ’base’ network consisting of 11 variables was created based on preferential attachment Barabási \BBA Albert (\APACyear1999); Albert \BBA Barabási (\APACyear2002), the Small-World network model Watts \BBA Strogatz (\APACyear1998), or the Erdos-Rényi random graph model Erdos \BBA Rényi (\APACyear1959) using the R package iGraph Csárdi \BBA Nepusz (\APACyear2006). The preferential attachment algorithm starts with one node and then adds one node in each time step. The probability to which nodes the new node connects depends on the degree of the old node:
[TABLE]
where is the degree of a given node. was set to vary uniformly between 0.30 and 0.70. At each time step m edges were added to the network. m was set to vary uniformly between 4 and 6 <resulting in relatively dense networks, as was shown to be the case for attitude networks,¿ Dalege2016. The Small-World network model starts with a ring lattice with nodes being connected to n neighbours and then randomly rewires edges with a p probability. n was set to uniformly vary between 3 and 4 and p was set to uniformly vary between 0.05 and 0.10. In the Erdos-Rényi graph, nodes are randomly connected by a given number of edges. Number of edges was set to uniformly vary between 30 and 45.
Second, edge weights were added to the base network. To have psychometrically realistic edge weights, we drew edge weights from either a normal distribution with M=0.15 and SD=.0075, a Pareto power law distribution with =3 and =0.10, or a uniform distribution with range of 0.01–0.30.
Third, we created 20 variations of the weighted base network, in which the temperature of the Ising model was varied. The inverse temperature parameter was drawn from a normal distribution with M=1 and SD=0.2 (with higher numbers representing low entropy). To ensure that all nodes have roughly the same variance, we drew thresholds of nodes from a normal distribution with M=0 and SD=0.25.
Fourth, using the R-package IsingSampler Epskamp \BOthers. (\APACyear2016), 1000 individuals for each of the variations of the base network were simulated based on the probability distribution implied by the Ising model. This procedure was repeated 900 times and each set of 20 variations of the different 900 base networks was analysed separately.
Participants
The open-access data of the ANES involves large national random probability samples. Data were each collected in two interviews - one before and one after each presidential election from 1980 to 2012 - by the Center for Political Studies of the University of Michigan. In total, 21,365 participants participated in these nine studies (for Ns per study see Supplementary Table 2), of which 16,667 participants stated that they voted for president. Non-voters were excluded from the analyses, because we assume that the decision whom to vote for is more likely to be part of the attitude network than the decision whether to vote or not. In Supplementary Note 2, however, we show that similar findings are obtained when non-voters are included in the analysis.
Measures
In each of the studies between six and 16 items tapping beliefs and between four and eight items tapping feelings toward the presidential candidates were assessed in the pre-election interviews. Feelings were assessed on two-point scales and beliefs were assessed on four-point scales (in a subsample of the ANES of 2008 and in the ANES of 2012, beliefs were assessed on a five-point scale). To have comparable attitude networks between the different elections, we always used six items tapping beliefs and four items tapping feelings (see Table 1 for a list of included attitude elements). In the post-election interview, participants were asked which candidate they voted for. Depending on which presidential candidate the analysis focused, we scored the response as 1 when the participant stated that they voted for the given candidate and we scored the response as 0 when the participant did not vote for the given candidate.
Statistical Analyses
We performed the same statistical analyses on the simulated and empirical data.
Network Estimation
Attitude networks were estimated using zero-order polychoric (tetrachoric) correlations between the (simulated) attitude elements as edge weights. We chose to use zero-order correlations as edge weights instead of estimating direct causal paths between the attitude elements because our simulations have shown that attitude networks based on zero-order correlations perform better than techniques that provide an estimate of the underlying causal network van Borkulo \BOthers. (\APACyear2014).
Network Descriptives
Both the ASPL and closeness are based on shortest path between lengths () between nodes. To calculate shortest path lengths, we used Dijkstra’s algorithm Dijkstra (\APACyear1959), implemented in the R package qgraph Epskamp \BOthers. (\APACyear2012):
[TABLE]
ASPL is then the average of the shortest path lengths between each pair of nodes in the network. Closeness () was calculated using the algorithm for weighted networks developed by \citeAOpsahl2010, using the R package qgraph:
[TABLE]
Impact Estimates
To estimate average impact of (simulated) attitude elements on (simulated) voting decisions, we calculated the biserial correlation between the sum score of (simulated) attitude elements and the (simulated) voting decision. We then calculated the Pearson correlation between connectivity and average impact for the 20 networks in the empirical study and for each set of 20 variations of the base networks in the simulation study. The clearly linear relation between connectivity and impact justified the use of Pearson correlation and significance testing. For the simulation study, we calculated the mean and standard deviation of the correlations obtained for each set of variations of the base network.
To estimate the impact of a given (simulated) attitude element on the (simulated) voting decision, we calculated the zero-order polychoric correlation between a given (simulated) attitude element and the (simulated) voting decision. We then calculated the Pearson correlation between standardized centrality and standardized impact of the attitude elements in the empirical study and for each set of 20 variations of the base networks in the simulation study. The clearly linear relation between centrality and impact justified the use of Pearson correlation and significance testing. For the simulation study, we calculated the mean and standard deviation of the correlations obtained for each set of variations of the base network.
Forecast Analysis
For the forecast analysis, we first conducted nine regression analyses, in which impact was regressed on centrality. In each regression analysis, the forecasted election was omitted. From each of the regression equations, we first extracted the beta and intercept coefficients. Second, we multiplied the centrality indices of the forecasted election with the beta coefficient and added the intercept coefficient. Note that not in every election the same attitude elements were assessed. Of the ten used attitude elements, seven were assessed at each election. For the remaining three, we grouped the attitude elements together that were most similar to each other (see Table 1). Third, we compared the resulting estimates with the actual impact of the attitude elements and calculated the absolute deviance scores. We then compared the performance of the centrality prediction to the overall mean prediction and the specific mean prediction. For both these predictions, we again calculated predictions nine times, omitting one of the elections each time. For the overall mean prediction, we calculated the mean of all attitude elements and for the specific mean prediction, we calculated the mean of each specific attitude element. We tested whether the centrality prediction performed better than the overall mean prediction and the specific mean prediction using Wilcoxon signed-rank tests.
Missing Values
Missing values were deleted casewise (Supplementary Table 2 shows the number of excluded participants per attitude network). Most missing values stemmed either from participants responding to an item that they did not know the answer or from non-participation during the post-election interview. Few missing values stemmed from interview errors.
Alternative Analyses
We also ran several alternative analyses that confirmed the robustness of our results: We ran alternative analyses on non-voters (see Supplementary Note 2 & Supplementary Figure 2), on independents (see Supplementary Note 3 & Supplementary Figure 3), on missing values (see Supplementary Note 4 & Supplementary Figure 4), on networks with different number of nodes (see Supplementary Note 5 & Supplementary Figure 5), and on latent variable models (see Supplementary Note 6 & Supplementary Table 3).
Acknowledgements
We thank S. Epskamp and G. Costantini for help with the simulation studies; M. Deserno for help with the data analyses. D. B. was supported by a Consolidator Grant No. 647209 from the European Research Council.
Author Contributions
J.D. developed the study concept; J.D., D.B., F.v.H., and H.L.J.v.d.M contributed to the study design; J. D. performed the data analysis and interpretation under the supervision of D.B., F.v.H., and H.L.J.v.d.M.; J.D. drafted the manuscript, and D.B., F.v.H., and H.L.J.v.d.M. provided critical revisions. L.J.W. provided the analytical solutions of the hypotheses.
Author Information
Data used in this paper is available at www.electionstudies.org. Correspondence and request for materials should be addressed to J.D. ([email protected]).
Competing Financial Interest
The authors declare no competing financial interests.
Supplementary Materials for: Network Structure Explains the Impact of Attitudes on Voting Decisions
Supplementary Figures
Supplementary Tables
Supplementary Notes
Supplementary Note 1: Analytical Solutions of the Hypotheses
In the Ising model the intuition is that higher connection strength will allow for better prediction. Here we show this intuition is correct.
Logistic regression and the Ising model. The Ising model is part of the exponential family of distributions Brown (\APACyear1986); Young \BBA Smith (\APACyear2005); Wainwright \BBA Jordan (\APACyear2008). Let be a graph consisting of nodes in and edges in . To each node a random variable is associated with values in . The probability of each configuration depends on a main effect (external field) and pairwise interactions. It is sometimes referred to as the auto logistic-function Besag (\APACyear1974), or a pairwise Markov random field, to emphasise that the parameter and sufficient statistic space are limited to pairwise interactions Wainwright \BBA Jordan (\APACyear2008). Each has conditional on all remaining variables (nodes) probability of success . The distribution for configuration of the Ising model is then
[TABLE]
which is clearly of the form of exponential family. In general, the normalisation is intractable, because the sum consists of possible configurations for ; for example, for we obtain over 1 million configurations to evaluate in the sum in (see \citeNPWainwright2008 for lattice [Bethe] approximations).
The conditional distribution is again an Ising model Besag (\APACyear1974); Kolaczyk (\APACyear2009)
[TABLE]
It immediately follows that the log-odds Besag (\APACyear1974) is
[TABLE]
Note that the log-odds is a linear function, and so if then .
Recall that is the linear function of the conditional Ising model obtained from the log-odds (3). Define . We use the notation that the node of interest is denoted by and we let the remaining variables and a 1 for the intercept be indicated by , basically leaving out the subscript to index the node, and only use it whenever circumstances demand it. Let the loss function be the negative log of the conditional probability in (2), known as a pseudo log-likelihood Besag (\APACyear1974)
[TABLE]
Monotonicity of prediction loss as a function of connectivity. In logistic regression there is a natural classifier that predicts whether is 1 or 0. We simply check whether the probability of a 1 is greater than 1/2, that is, whether . Because if and only if we obtain the natural classifier
[TABLE]
where is the indicator function. This is 0-1 loss Hastie \BOthers. (\APACyear2015). Sometimes the margin interpretation is used where the log of the conditional probability is used with variables in (see \citeNPHastie2001) . Let such that for we obtain . The loss (pseudo log-likelihood) in (4) can then be rewritten as
[TABLE]
Often the logarithm with base 2 is chosen since then . The classification translates to
[TABLE]
Logistic loss in (6) is an upper bound to in (7), and is 1 at the value of the margin , as shown in Supplementary Figure 1. Here we use logistic loss as defined in (4) because it is more common. This function is strictly monotone decreasing.
It follows immediately from monotonicity that if . Of course, we have the same for the 0-1 loss: if .
If the average degree of each node were subtracted from the Hamiltonian , then we obtain the Ising model without an external field. If we have
[TABLE]
then we see that
[TABLE]
to the labeling , we obtain that the average is 0 (implying ), and so the Hamiltonian consists only of the interactions . And so if for all then iff , i.e., the Hamiltonian is larger if and only of the connectivity is larger. As seen above, this leads immediately to the monotonicity above.
Closeness and correlations Let be the shortest distance in terms of Dijkstra’s algorithm Wallis (\APACyear2007), where is the weight, in our case a (polychromic) correlation that are all positive. Then closeness is defined as
[TABLE]
The intuition is here that a node with high closeness will have connections or paths to other nodes with high correlations (weights). To see the intuition, consider node being connected only to node with correlation . Then ; if this correlation is high, then so is the closeness of this node. If there is more than one connection, we see that the shortest path is low if all correlations are high (close to ), implying that closeness is high.
Suppose we have two sets weights and , inducing two graphs and with the same nodes and edge sets but with different weights. We pick a path between nodes and , denoted by of length . Suppose that for this path we have
[TABLE]
Then it follows that
[TABLE]
In other words, the higher the correlations the higher the closeness. This does not imply that any randomly drawn node connected to a node with high closeness will have a high correlation, only that on average the correlations will be higher if they are connected to a node with high closeness than if they are connected to a node with low closeness.
Supplementary Note 2: Alternative Analysis on Non-Voters
To investigate whether our results are robust to the inclusion of non-voters, we performed the same analyses but now including non-voters and labelling them as voters against the focal candidates. The results of this analysis mirrored the results reported in the Results section: The correlation between connectivity and average impact remained high and significant (see Supplementary Figure 2a). The same holds for the correlation between centrality and impact (see Supplementary Figure 2b). The predicted impact remained very close to the actual impact (deviation median=0.06, deviation interquartile range=0.02-0.09) and outperformed both using the mean of all attitude elements (deviation median=0.10, deviation interquartile range=0.05-0.18, Wilcoxon-matched pairs test: V=4006, *P*0.001, CLES=69.5%) and using the means of the specific attitude elements (deviation median=0.08, deviation interquartile range=0.04-0.15, Wilcoxon-matched pairs test: V=5670, *P*0.001, CLES=64.7%).
We also tested another prediction from our model regarding differences between voters and non-voters: That voters are expected to have a more densely connected network than non-voters. As can be seen in Supplementary Figure 2c, attitude networks of voters were much more highly connected (mean=2.03, s.d.=0.43) than attitude networks of non-voters (mean=2.38, s.d.=0.34, Student’s t-test: T=2.86, *P*0.001, Cohen’s D=0.91).
Supplementary Note 3: Alternative Analysis on Independents
As our analysis are correlational, it is important to exclude the possibility that third variables affected the relations tested in this paper. The most likely variable to be such a confound is party identification. It is, for example, easy to imagine that party identification might affect the connectivity of attitude networks, the valence of the attitude, and for whom a person votes. We therefore reran our analyses including only participants, who do not identify with any political party. The results of this analysis mirrored the results reported in the Results section: The correlation between connectivity and average impact remained high and significant (see Supplementary Figure 3a). The same holds for the correlation between centrality and impact (see Supplementary Figure 3b). The predicted impact remained very close to the actual impact (deviation median=0.06, deviation interquartile range=0.03-0.11) and outperformed both using the mean of all attitude elements (deviation median=0.11, deviation interquartile range=0.05-0.17, Wilcoxon-matched pairs test: V=4152, *P*0.001, CLES=66.2%) and using the means of the specific attitude elements (deviation median=0.09, deviation interquartile range=0.04-0.16), Wilcoxon-matched pairs test: V=5703, *P*0.001, CLES=62.7%).
Supplementary Note 4: Alternative Analysis on Missing Values
To investigate whether our results are robust to imputation of missing values, we reran our analyses with imputing missing values using Predictive Mean Matching Little (\APACyear1988); van Buuren \BBA Groothuis-Oudshoorn (\APACyear2011). The results of this analysis mirrored the results reported in the Results section: The correlation between connectivity and average impact remained high and significant (see Supplementary Figure 4a). The same holds for the correlation between centrality and impact (see Supplementary Figure 4b). The predicted impact remained very close to the actual impact (deviation median=0.06, deviation interquartile range=0.03-0.10) and outperformed both using the mean of all attitude elements (deviation median=0.12, deviation interquartile range=0.05-0.19, Wilcoxon-matched pairs test: V=3724, *P*0.001, CLES=69.3%) and using the means of the specific attitude elements (deviation median=0.10, deviation interquartile range=0.04-0.18, Wilcoxon-matched pairs test: V=5337, *P*0.001, CLES=65.5%).
Supplementary Note 5: Alternative Analysis on Networks Based on Different Numbers of Attitude Elements
To investigate whether our results are robust to our choice of attitude elements, we reran our analyses based on all available attitude elements (note that in this case the forecast analyses are not possible because for these analyses the same number of attitude elements for each election is necessary) and on the seven attitude elements that were assessed at each election. The results of these analyses mirrored the results reported in the Results section: For the analysis including all attitude elements, the correlation between connectivity and average impact remained high and significant (see Supplementary Figure 5a). The same holds for the correlation between centrality and impact (see Supplementary Figure 5b).
For the analysis including the seven attitude elements that were assessed at each election, the correlation between connectivity and average impact remained high and significant (see Supplementary Figure 5c). The same holds for the correlation between centrality and impact (see Supplementary Figure 5d). The predicted impact remained very close to the actual impact (deviation median=0.06, deviation interquartile range=0.03-0.09) and outperformed both using the mean of all attitude elements (deviation median=0.11, deviation interquartile range=0.06-0.18, Wilcoxon-matched pairs test: V=1505, *P*0.001, CLES=68.7%) and using the means of the specific attitude elements (deviation median=0.09, deviation interquartile range=0.05-0.16), Wilcoxon-matched pairs test: V=2341, *P*0.001, CLES=65.2%).
Supplementary Note 6: Alternative Analysis on Latent Variable Models
One might argue that the results reported in this article can also be expected when attitudes are conceptualized as latent variables and the responses on attitude elements are treated as indicators of the latent attitude. From this perspective, high (low) centrality of attitude elements would indicate high (low) factor loadings on the latent variable attitude and high (low) connectivity would indicate high (low) average factor loadings. In a purely statistical sense, this objection would be correct as factor loadings also reflect how much information a given attitude element holds on all other attitude elements. However, in our view the latent variable framework does not provide a sensible alternative for a data-generating model of the hypotheses put forward here. For such a model, one would have to assume that the latent variable attitude acts as common cause of the attitude elements. This assumption, however, is at odds with several key concepts in the attitude literature Dalege \BOthers. (\APACyear2016), such as cognitive consistency Monroe \BBA Read (\APACyear2008), ambivalence Thompson \BOthers. (\APACyear1995), and the idea that attitudes are formed by attitude elements Fazio (\APACyear1995); Zanna \BBA Rempel (\APACyear1988).
To further rule out that the latent variable framework provides an alternative explanation of our results, we investigated the fit of latent variable models on the data reported in this article. For each attitude toward each candidate at each election, we fitted two latent variable models. First, we fitted a one-factor model with all attitude elements loading on this single factor representing a latent attitude. Second, we fitted a hierarchical factor model with three or four first-order factors and one second-order factor representing a latent attitude. We fitted the hierarchical factor model because earlier research indicated that beliefs and feelings form different factors Breckler (\APACyear1984) and that negative and positive attitude elements form different factors van den Berg \BOthers. (\APACyear2005). In most of the data sets used here, no negative beliefs were assessed. For these data sets, we fitted a hierarchical factor model with beliefs, negative feelings, and positive feelings loading on different first-order factors, respectively. For the data sets in which negative beliefs were assessed, we fitted a hierarchical factor model with negative beliefs, positive beliefs, negative feelings, and positive feelings loading on different first-order factors, respectively. As can be seen in Supplementary Table 3, both the one-factor models and the hierarchical models fitted poorly. The latent variable framework thus appears to be an unlikely alternative explanation of our results.
This discussion on whether our results can also be explained by the latent variable framework is somewhat reminiscent of the discussion regarding the idea that instability of attitudinal responses is indicative of individuals holding nonattitudes Converse (\APACyear1970). Several critiques of this idea pointed out that when measurement error is accounted for, individuals, who seemingly hold nonattitudes, show stable attitudes Achen (\APACyear1975); Ansolabehere \BOthers. (\APACyear2008); Judd \BOthers. (\APACyear1980). A similar critique might apply to our findings. It is our view, however, that two findings speak against this critique. First, if we assume that the intercorrelations of attitude elements are determined only (or foremost) by measurement error, then the factor models we fitted should show good fit. This was clearly not the case. Second, systematic variation of intercorrelations would not be expected from the measurement error perspective. Thus, our finding that connectivity of attitudes correlates almost perfectly with the attitude’s impact on behaviour would not be expected from the measurement error perspective.
The reference list from the paper itself. Each links out to its DOI / PubMed record.
- 1Abramowitz ( \APA Cyear 1995) \APA Cinsertmetastar Abramowitz 1995 {APA Crefauthors} Abramowitz, A \BPBI I. \APA Cref Year Month Day 1995. \BBOQ \APA Crefatitle It’s abortion, stupid: Policy voting in the 1992 presidential election It’s abortion, stupid: Policy voting in the 1992 presidential election. \BBCQ \APA Cjournal Vol Num Pages Journal of Politics 57176–186. \Print Back Refs \Current Bib
- 2Achen ( \APA Cyear 1975) \APA Cinsertmetastar Achen 1975 {APA Crefauthors} Achen, C. \APA Cref Year Month Day 1975. \BBOQ \APA Crefatitle Mass political attitudes and the survey response Mass political attitudes and the survey response. \BBCQ \APA Cjournal Vol Num Pages American Political Science Review 691218–1231. \Print Back Refs \Current Bib
- 3Ajzen ( \APA Cyear 1991) \APA Cinsertmetastar Ajzen 1991 {APA Crefauthors} Ajzen, I. \APA Cref Year Month Day 1991. \BBOQ \APA Crefatitle The theory of planned behavior The theory of planned behavior. \BBCQ \APA Cjournal Vol Num Pages Organizational Behavior and Human Decision Processes 50179–211. \Print Back Refs \Current Bib
- 4Ajzen \BBA Fishbein ( \APA Cyear 1977) \APA Cinsertmetastar Ajzen 1977 {APA Crefauthors} Ajzen, I. \BCBT \BBA Fishbein, M. \APA Cref Year Month Day 1977. \BBOQ \APA Crefatitle Attitude-behavior relations: A theoretical analysis and review of empirical research Attitude-behavior relations: A theoretical analysis and review of empirical research. \BBCQ \APA Cjournal Vol Num Pages Psychological Bulletin 84888–918. \Print Back Refs \Current Bib
- 5Albert \BBA Barabási ( \APA Cyear 2002) \APA Cinsertmetastar Albert 2002 {APA Crefauthors} Albert, R. \BCBT \BBA Barabási, A \BHBI L. \APA Cref Year Month Day 2002. \BBOQ \APA Crefatitle Statistical mechanics of complex networks Statistical mechanics of complex networks. \BBCQ \APA Cjournal Vol Num Pages Review of Modern Physics 7447–97. \Print Back Refs \Current Bib
- 6Aldrich \B Others . ( \APA Cyear 1989) \APA Cinsertmetastar Aldrich 1989 {APA Crefauthors} Aldrich, J \BPBI H., Sullivan, J \BPBI L. \BCBL \BBA Borgida, E. \APA Cref Year Month Day 1989. \BBOQ \APA Crefatitle Foreign affairs and issue voting: Do presidential candidates ”waltz before a blind audience?” Foreign affairs and issue voting: Do presidential candidates ”waltz before a blind audience?”. \BBCQ \APA Cjournal Vol Num Pages American Political Science Review 83123–141. \Print Back Refs \
- 7Ansolabehere \B Others . ( \APA Cyear 2008) \APA Cinsertmetastar Ansolabehere 2008 {APA Crefauthors} Ansolabehere, S., Rodden, J. \BCBL \BBA Snyder, J \BPBI M. \APA Cref Year Month Day 2008. \BBOQ \APA Crefatitle The strength of issues: Using multiple measures to gauge preference stability, ideological constraint, and issue voting The strength of issues: Using multiple measures to gauge preference stability, ideological constraint, and issue voting. \BBCQ \APA Cjournal Vol Num Pages Ameri
- 8Armitage \BBA Conner ( \APA Cyear 2000) \APA Cinsertmetastar Armitage 2000 {APA Crefauthors} Armitage, C \BPBI J. \BCBT \BBA Conner, M. \APA Cref Year Month Day 2000. \BBOQ \APA Crefatitle Attitudinal ambivalence: A test of three key hypotheses Attitudinal ambivalence: A test of three key hypotheses. \BBCQ \APA Cjournal Vol Num Pages Personality and Social Psychology Bulletin 261421–1432. \Print Back Refs \Current Bib