Friction controls submerged granular flows
Juha Koivisto, Marko Korhonen, Mikko J. Alava, Carlos P. Ortiz,, Douglas J. Durian, Antti Puisto

TL;DR
This study explores how the presence of a fluid affects granular flow in a hopper, revealing that fluid coupling causes flow surging and that particle size and fluid viscosity influence the flow behavior.
Contribution
It provides a combined experimental and numerical analysis of submerged versus dry granular hopper flows, highlighting the impact of fluid on particle contact friction and flow dynamics.
Findings
Submerging reduces particle contact friction from 0.15 to 0.13.
Flow rate depends on particle size, influenced by terminal velocity and drag.
Interstitial fluid effects diminish at large particle sizes, depending on fluid viscosity.
Abstract
We investigate the coupling between interstitial medium and granular particles by studying the hopper flow of dry and submerged system experimentally and numerically. In accordance with earlier studies, we find, that the dry hopper empties at a constant rate. However, in the submerged system we observe the surging of the flow rate. We model both systems using the discrete element method, which we couple with computational fluid dynamics in the case of a submerged hopper. We are able to match the simulations and the experiments with good accuracy. To do that, we fit the particle-particle contact friction for each system separately, finding that submerging the hopper changes the particle-particle contact friction from to , while all the other simulation parameters remain the same. Furthermore, our experiments find a particle size dependence to the flow…
Click any figure to enlarge with its caption.
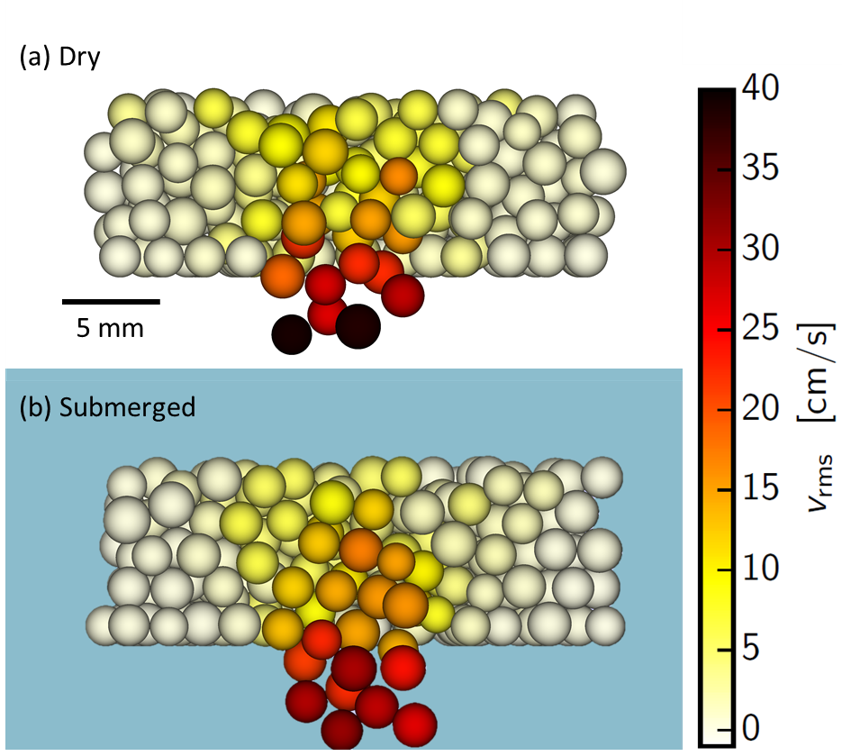 Figure 1
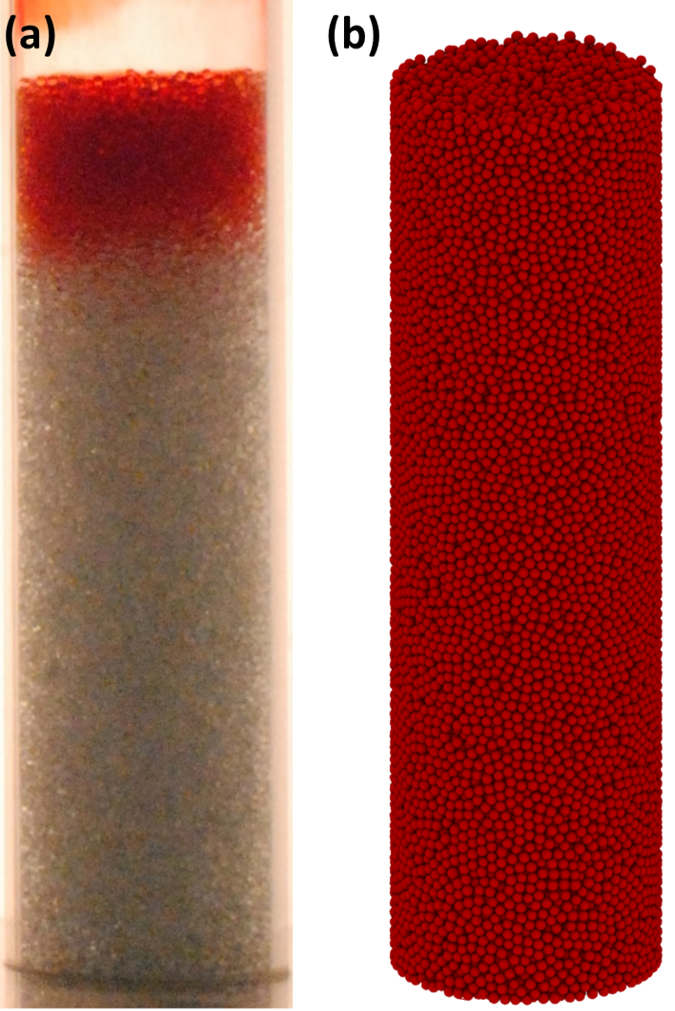 Figure 2
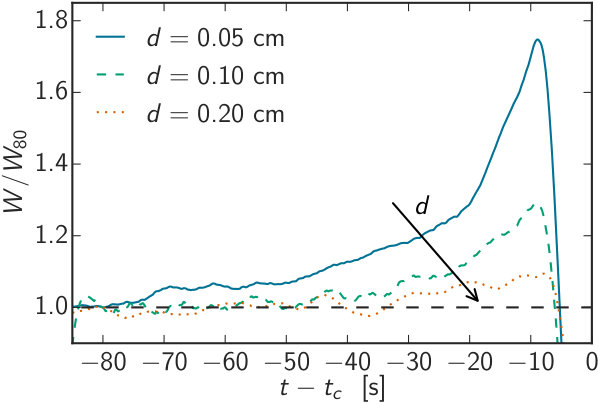 Figure 3
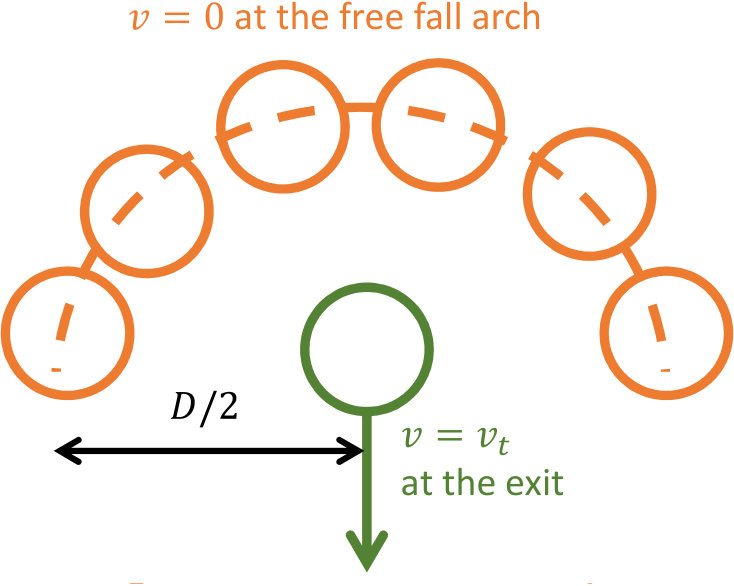 Figure 4
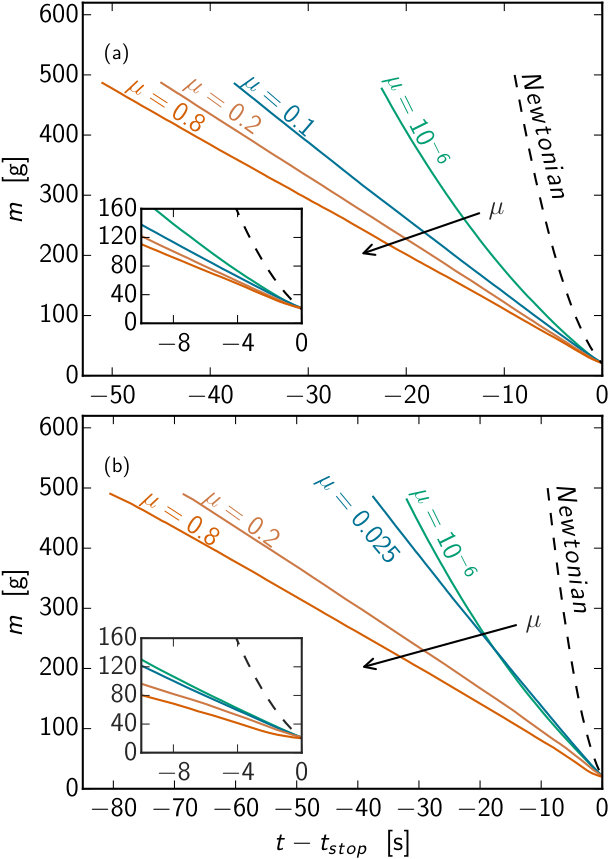 Figure 5
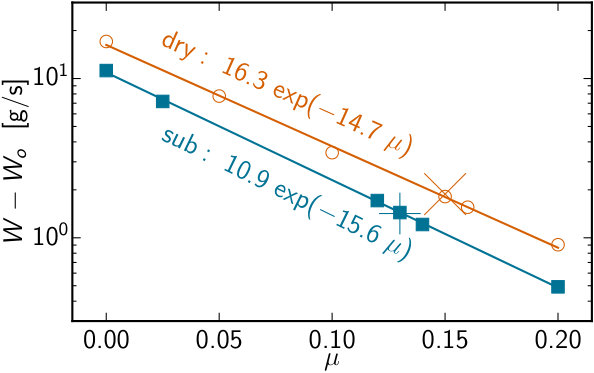 Figure 6
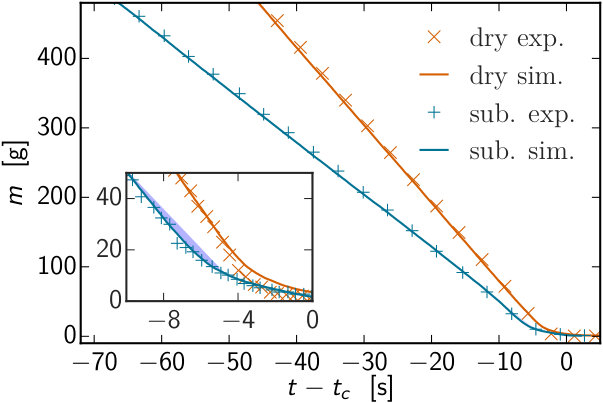 Figure 7
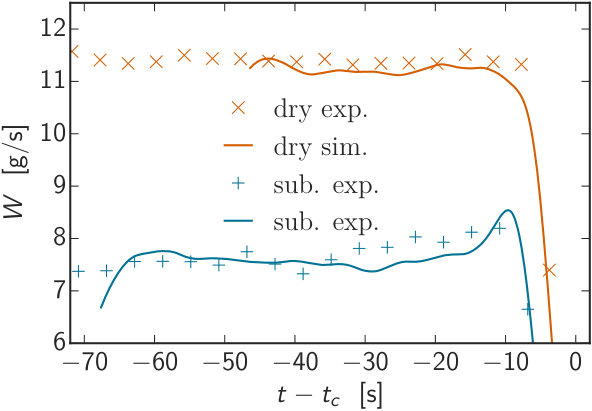 Figure 8
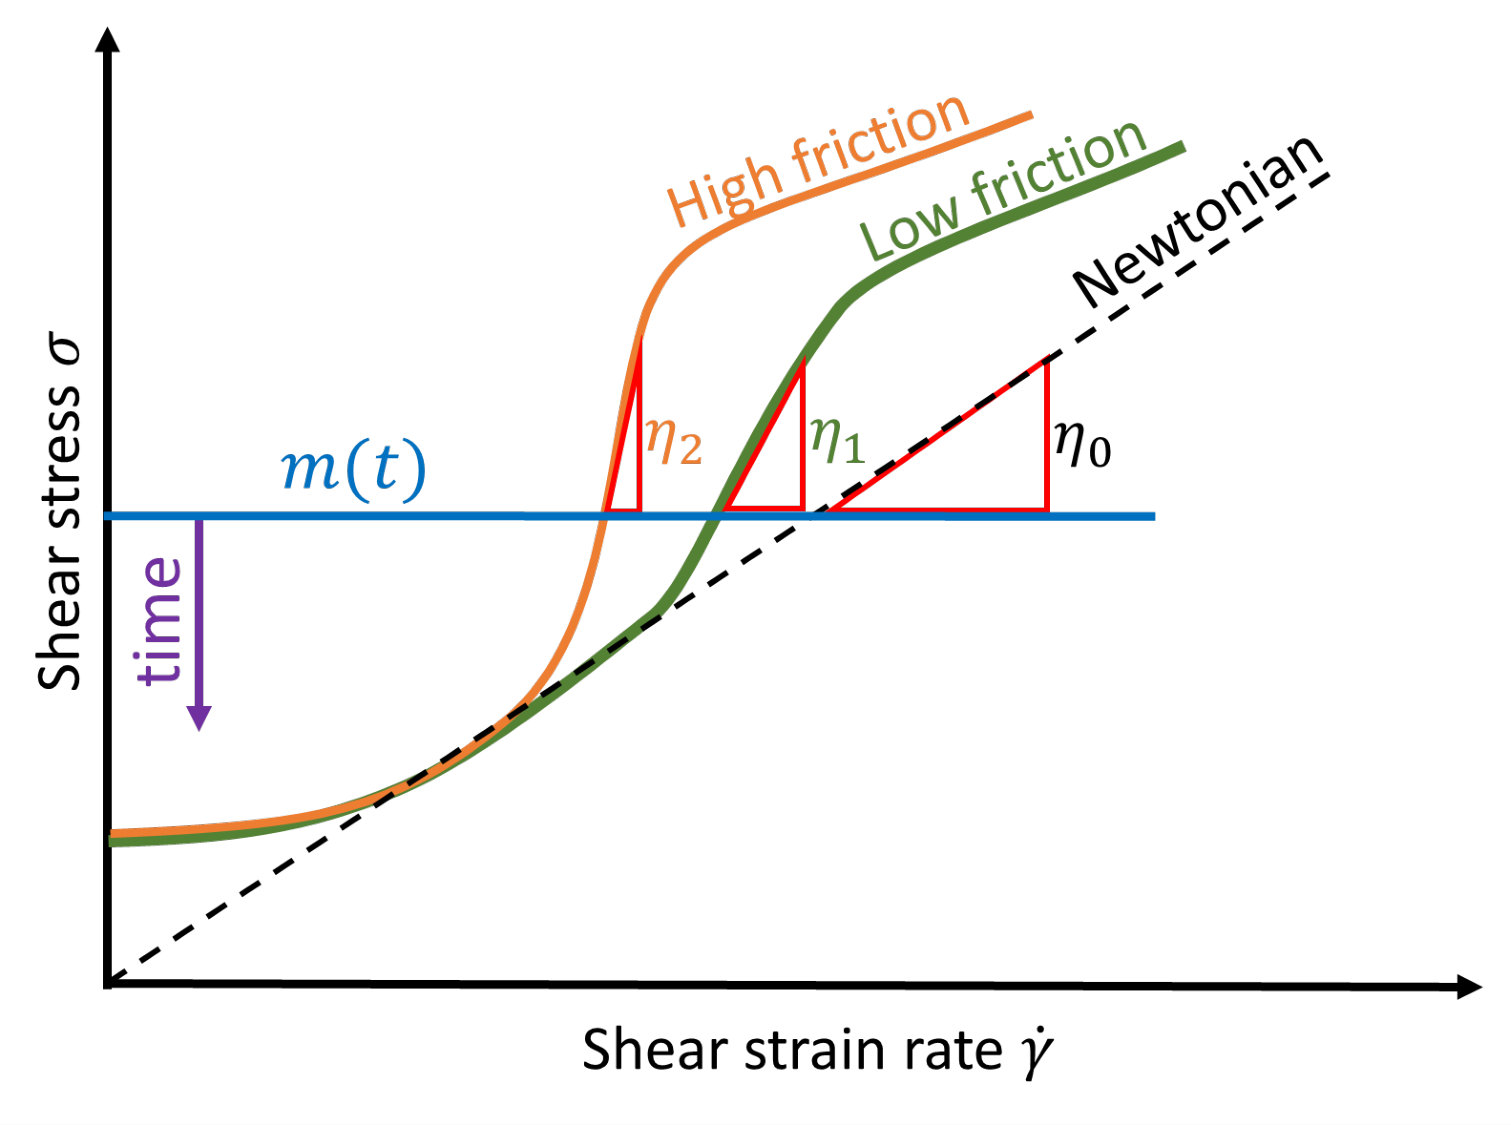 Figure 9
| 0.05 | 37 | 1.76 | |
| 0.10 | 151 | 0.86 | |
| 0.20 | 530 | 0.56 |
Peer Reviews
No public reviews on file for this paper yet. If you reviewed it on a platform where reviews are public (OpenReview, ICLR, NeurIPS, ICML), you can paste yours below so the community can read it here.
Videos
No videos yet. Explain this paper in a talk, walkthrough, or lecture? Add one.
Taxonomy
TopicsGranular flow and fluidized beds · Particle Dynamics in Fluid Flows · Fluid Dynamics Simulations and Interactions
Friction controls submerged granular flows
Juha Koivisto1,2
Marko Korhonen1
Mikko Alava1
Carlos P. Ortiz2
Douglas J. Durian2
Antti Puisto1
1Department of Applied Physics, Aalto University, Aalto 00067, Finland
2Department of Physics and Astronomy, University of Pennsylvania, Philadelphia,
Pennsylvania 19104-6396, USA
Abstract
We investigate the coupling between interstitial medium and granular particles by studying the hopper flow of dry and submerged system experimentally and numerically. In accordance with earlier studies, we find, that the dry hopper empties at a constant rate. However, in the submerged system we observe the surging of the flow rate. We model both systems using the discrete element method, which we couple with computational fluid dynamics in the case of a submerged hopper. We are able to match the simulations and the experiments with good accuracy. To do that, we fit the particle-particle contact friction for each system separately, finding that submerging the hopper changes the particle-particle contact friction from to , while all the other simulation parameters remain the same. Furthermore, our experiments find a particle size dependence to the flow rate, which is comprehended based on arguments on the terminal velocity and drag. These results jointly allow us to conclude that at the large particle limit, the interstitial medium does not matter, in contrast to small particles. The particle size limit, where this occurs depends on the viscosity of the interstitial fluid.
granular, hopper, fluid flow, experimental, numerical
pacs:
47.57.Gc, 47.56.+r, 47.55.Kf
I Introduction
Understanding the coupling between solid particles and liquid is a challenging task due the complexity of grain-grain and grain-liquid interactions Zhou et al. (2010); Zhu et al. (2007). Even in vacuum the assemblies of granular particles exhibit highly complex dynamics due to the different possible phases of existence. Depending on the loading and the particle geometry, it can appear in gaseous, fluid-like or solid-like phases Eshuis et al. (2007). Related to this, the rheological characteristics of granular matter falls into the category of yield stress fluids Divoux et al. (2015); Johnson et al. (2017). However, their behavior is even more complex, as many of them show discontinuous shear thickening at intermediate shear Seto et al. (2013). Such an effect is attributed to the interparticle friction and/or the interlocking of the grains, depending on their shape Losert et al. (2000); Athanassiadis et al. (2014); Jaeger (2014).
The 3D hopper flow, shown in Fig. 1, is a well studied model case of grain flow Thomas and Durian (2016); Wilson et al. (2014); Thomas and Durian (2015), partly due to its seeming simplicity, but also due to its importance in practical applications, from simple silos in farms to complex pharmaceutical factories. Even in a simple hopper scenario, all three granular phases exist, and there is the gas phase outside the hopper; near the hopper boundaries the grains are in the bulk or solid phase, while above the orifice, there must be a yielded (fluid) phase enabling the flow.
Numerous studies have shown that in a dry hopper, the outflow of the granular particles follows the Beverloo equation Beverloo et al. (1961); Madrid et al. (2016). That is, the outward flux of grains remains constant in time, until the hopper runs out of grains. The grain liquid interaction culminates to three components: terminal velocity as well as Darcy and modified Beverloo equations. The Beverloo equation for dry case
[TABLE]
describes the mass flow rate as a function of density , gravity as well as particle and orifice diameters. The term illustrates the empty annulus where the particles partially reduce the size of the orifice through constant . The exponent 5/2 can be derived through the so called free fall theorem that essentially says that the flow rate is proportional to the particle velocity as if it would fall of a dome covering the orifice Tian et al. (2015); Janda et al. (2012); Mankoc et al. (2007). The geometry then dictates the exponent 5/2.
Recently the Beverloo equation is adapted and simplified to the liquid case Wilson et al. (2014)
[TABLE]
where the acceleration due gravity in fixed distance is replaced by terminal velocity in a liquid. It is important to note that the flow decreases to zero when the ratio approaches . The and are the empirical fit parameters in a submerged case Wilson et al. (2014); Koivisto and Durian (2017a).
The Beverloo equation only considers the dimensions of the grains and the orifice but not the properties of the interstitial medium, such as viscosity or drag. Some studies have considered the role of air as an interstitial medium Yuu and Umekage (2011). There are simulations and experiments that show non-trivial flow patterns of air when particles move, starting from oscillations Wu et al. (1993); Bertho et al. (2002) and steady state turbulent like flows Hilton and Cleary (2011). This movement of gas like medium affects the flow of grains by creating pressure gradients and drag. These effects are in this case minor, since the drag caused by air is rather modest.
When the grains are embedded in a liquid, whose viscosity is orders of magnitude larger compared to that of air, the effect of interstitial medium is expectedly more pronounced Koivisto and Durian (2017a). There, the flow rate of grains actually increases in time, i.e. surges Wilson et al. (2014). Compared to a Newtonian fluid running out of a bucket this behaves exactly the opposite; there the flow rate decreases as the water runs out. In this submerged granular flow, the complexity of the problem rises from the fluid-particle interactions. As in the dry hopper scenario, the driving force of the system is the particle flow created by gravity. However, here the motion of the particles additionally creates fluid flow that disturbs the particle trajectories. This feedback loop between fluid and particles presumably increases the driving pressure of grains as they run out. A simple analytical model taking this into account is already shown in Ref. Koivisto and Durian (2017a).
In this paper we show that one can successfully capture both qualitatively and quantitatively this counter intuitive behavior arising in a submerged granular hopper flow using coupled discrete element model (DEM) for the particle dynamics and computational fluid dynamics (CFD). While the particle trajectories and interactions are computed explicitly in the DEM-implementation, the fluid flow is modeled on a continuum level by the CFD approach. This is fundamentally different from the inertial -model where the granular media and the interstitial fluid is treated as a single continuum Boyer et al. (2011).
The article is organized as follows: It starts by introducing the reader to our Methods, giving the details of both the experiments and the simulations. Then in the section Results we describe the main findings, showing that the features observed in experiments are captured by the simulations. Once the validity of the simulation is confirmed, the values of grain-grain friction is swept using simulations. The article finishes with Conclusions, where we discuss the results, and give the readers a short overlook to future research.
II Methods
Here, we study both the dry and submerged granular hopper flows. In the simulations, we assume that we can model the dry case without the interstitial fluid (no CFD), since air viscosity and density are negligible. In contrast, the submerged granular flow comprises two distinct phases (granular particles and liquid) that interact by various forces and have to be modeled concurrently. The approach adopted here is to model the liquid phase on a continuum level and the granular phase as discrete particles. Specifically, the fluid phase is modeled by the Computational Fluid Dynamics (CFD) method Ferziger and Peric (2012), which utilizes the Finite Volume Method (FVM) for discretizing the Navier-Stokes in the problem domain. The Discrete Element Method (DEM) Cundall and Strack (1979) is applied for the granular (particle) phase and each particle trajectory is integrated individually based on the interaction forces.
In the CFD framework, the modified Navier-Stokes equations (NSEs) Anderson and Jackson (1967), physically implying the conservation of mass and momentum, are discretized and solved to yield the relevant quantities, such as the local fluid velocity and pressure fields. The modified NSEs (here, Eqs. (23) and (40) in Ref. Anderson and Jackson (1967)) include the particle-fluid interaction term, that contains the sum of the appropriate interaction forces, such as the drag force Di Felice (1994), buoyancy, pressure gradient forces and the imposed shear stress Zhu et al. (2007). This term is also present in the DEM scheme, where it is included in the Newton’s 2nd law which is formulated and solved for each particle. This coupling scheme has the inherent advantage of providing an accurate description of both the fluid and the particle phase at a reasonable computational expense Zhu et al. (2007).
The CFD-DEM coupling is realized in a readily implemented software called CFDEM project which combines the OpenFOAM CFD-library with a DEM solver (LIGGGHTS Kloss et al. (2012)), providing the user extensive control over the simulation particulars and more importantly, the NSEs and fluid-particle interaction models Zhou et al. (2010). The implementation also grants efficient CPU parallel execution via the Message Passing Interface (MPI).
The material parameters used in the numerical method are obtained, where possible, from the experiments or utilizing textbook values. In the experiments, there are three types of grains, while in the simulations only the largest one is used. The grains are technical quality soda lime silica glass beads with cm (A-205), (A-100) and (P-230) in diameter from Potters Industries. Their density is measured using the Archimedes method by sinking the beads in liquid and measuring the weight of the grains and fluid volume displacement. The simulations additionally require knowledge of the elastic (Young’s and shear) moduli, and the friction and restitution coefficients. The typical values for Young’s and shear moduli of glass beads tabulated in textbooks are GPa and GPa, respectively. These give the Poisson’s ratio of . These values of the grain properties were set in the simulations to match the experimental values.
The friction and restitution coefficients, describing the dissipation of the grain-grain contacts and collisions, are the remaining parameters required to perform DEM simulations. Measurement of either of these for glass beads is impractical as it requires to estimate the dissipated energy in a dense granular flow. A textbook value for sliding of wet glass surfaces is around , which can be taken as a starting point for the simulations. A sensible value for the restitution coefficient of hard-sphere-like glass beads is . For instance, in similar dry simulations involving softer grains, the restitution coefficient of has been used Schwartz et al. (2012).
In the setup, the liquid phase consists of filtered tap water at temperature with the well known textbook values for viscosity mPas and density . Accordingly, these values were used in the simulations, with the further assumption of laminar flow conditions. Laminar flow can be safely assumed owing to the fact that the flow rates remain rather modest being purely driven by the release of the grains’ potential energy. In practice the hopper is submerged in a large fish tank. There are no water – air interfaces. The experiment is totally under water. The scale is above the water level, measuring the weight of the remaining beads in the hopper. The hopper is a flat bottomed cylindrical tube made of transparent polycarbonate with cm diameter. The orifice is a circular hole ( cm) with 1 mm vertical walls that expand in 45-degree bevel cut at the center of the aluminum bottom. The experimental setup is described in detail in Refs. Koivisto and Durian (2017a, b) and their supplemental material.
Fig. 2 displays both the experimental 3D hopper (a) as well as its simulation counterpart (b). The initial state of the hopper contains 50 % more beads than shown in Fig. 2(a). The red dye at the top was injected on top of the granular pile before the experiment and it propagates through the hopper faster than the grains can exit the system. (See the supplementary videos 1 and 2 which illustrate this process.)
The geometry is the same in the simulations and experiments, with very few exceptions. The initial filling height is smaller in the simulations, the hopper walls possess no thickness and have the same friction coefficient as the grains. The CFD simulation domain is divided into 1.5 million cells. The grid size gradually decreases near the hopper boundaries to ensure the quality of the solution in those areas. The meshing is realized applying the snappyHexMesh-tool embedded in the OpenFOAM software ope (2014).
In the simulations, the hopper flow is generated by first filling the hopper with the granular medium by pouring randomly the particles above the hopper top while the orifice remains closed. Then, once a sufficient filling height is obtained, the granular packing is allowed to relax without the fluid for 0.5 seconds. At this point, the selection between the vacuum and submerged cases is made. In the vacuum case the orifice is opened, and the simulation is continued. In the submerged case, the coupled CFD-DEM simulation is initiated and the orifice is opened.
III Results
Motivated by the large computational cost of the prescribed numerical simulations, we revisit our earlier experimental findings with a new perspective. The goal is to find a good compromise between having a long enough experiment with good surge per noise ratio (improves by reducing the particle size) and the computational burden (decreases with increasing particle size). The total particle number that can be handled with reasonable computational cost can be reached using the average grain diameter of cm. Our main concern is the impact of the particle size on the surge. Hence, we start by comparing the earlier studied systems having cm and cm to the new system with cm. For this purpose, we observe the flow rate and compute selected dimensionless numbers characterizing the systems
Fig. 3 shows the relative flow rate against time , where the is the time when the flow stops. The flow rate is obtained by differentiating the mass time series of the scale by fitting a degree polynomial in a 2 second Gaussian window similarly to Ref. Koivisto and Durian (2017a). As we are interested on the surge and dynamic effects we scale the data by the flow rate at s. This operation allows us to compare the surge between the systems having different particle sizes.
The surge, the increase of flow rate with respect to the asymptotic value decreases with increasing particle size as highlighted by the black arrow in Fig. 3. The largest increase is with cm particles and the smallest is with cm particles. This agrees with earlier findings as the surge term containing the fluid-grain coupling has dependence as (after expanding from the supplementary material in Ref. Koivisto and Durian (2017a)). The surge thus decreases when approaching the clogging region from below by increasing the particle size. There is no flow, nor surge above the clogging region. We conclude that the large particles in our case approach to a limit where the granular aspect of the system starts to dominate. The inertia of the grains is too high for the fluid that there would be a large surge.
Here, we would like to point out, that the superficial fluid velocity is faster than the grain velocity Koivisto and Durian (2017a). The fluid is faster and the inertia of the particles decreases the flow rate while the viscous component increases the flow. This counterintuitive result is consistent with the earlier results Koivisto and Durian (2017a) and illustrated in supplementary video 1 with a layer of dye that propagates faster than the grains can exit. With small particles the fluid flow dominates the process and particles reflect to this. The large particles have more momenta and inertia. The fluid flow cannot affect the particle motion. The granular characteristics of the large particles dominate.
To obtain more rigorous treatment we calculate dimensionless numbers that describe the flow. Table 1 describes the dimensionless numbers of the system. The Reynolds number describes the ratio of inertial forces respect to viscous forces. It increases dramatically as the particle diameter increases () indicating the increase of granular behavior at the expense of fluid flow, provided the grain properties (grain-grain friction, and grain size distribution) remain the same. At the same time, the drag coefficient decreases Mor , again, indicating the diminishing effect of fluid. Note that here we discuss only the laminar flow case. Finally we calculate the inertial number that is the ratio of confining pressure and shear rate Houssais et al. (2015). The inertial number can be approximated by defining the shear rate as velocity difference at the orifice and an approximation of driving pressure as
[TABLE]
where the effective density is the buoyancy corrected density. The particle geometry at the orifice is illustrated in Fig. 4. For small particles the inertial number is large, at the region where the dynamic effects already play a role. For large particles the inertial number decreases and the dynamic friction coefficient saturates (close) to static value Singh et al. (2015). This is seen as a lack of terminal surge as a constant dynamic friction coefficient indicates constant flow rate. Also, recently Trulsson et al. (2016) it has been numerically found that the ratio of frictional and viscous dissipation changes in submerged particle systems. Here, we are approaching the frictional regime from viscous regime by increasing the particle size leading to vanishing surge.
The experimental study extends the research to larger particles in order to reduce the particle number to a sufficient level to enable numerical simulations. The effect of grain size to the hopper flow is depicted in Fig. 3, which shows the remaining mass of grains in the hopper and the mass flow rate, both as a function of time for two different particle diameters. Not only the flow rate, but also the surge at the end of the experiment, depends on the particle diameter. As we have a grasp of the experimental aspects of the particle size dependence of the surge, it is possible to pick the largest particle size cm as a representative case.
In the simulations the low friction granular (cyan) and the Newtonian fluid (dashed black) cases in Fig. 5(a) are non-linear and therefore not described by the Beverloo equation (2). The inset in Fig. 5(a) shows the magnification of the data near the end of the experiment. This is to point out that there seems to be no acceleration in the flow rate.
Next, we repeat the simulation with parameters identical to the dry case with the exception that the grain-liquid coupling is enabled. Fig. 5(b) shows the mass in the hopper over as displayed earlier for the dry case in Fig. 5(a). The initial conditions, material parameters (except the friction coefficients), geometry, number of particles and even the initial particle locations are the same in each case. The largest difference is that the flow rates are significantly lower in the submerged cases. For instance, the simulation with the friction coefficient takes 52 seconds to empty 500 grams of grains in the dry case, while in the submerged case it takes 90 seconds.
Additionally, there is an acceleration of the flow rate at the end of the simulation (Fig. 5 insets). This is seen as separation of datasets and a slight downwards tilt in the data for the larger friction coefficients. Again, following the dry case, the low friction cases behave like Newtonian fluids without the acceleration. The contact friction of bulk granular materials is typically above . For these values, we find a surge like feature in the submerged simulation, lacking from the dry case. As the only difference between the dry and submerged simulation is the inclusion of fluid, we conclude that the surge is due to the coupling between the liquid and grains.
In Fig. 6, we plot the simulated reduced flow rate with multiple values of the friction coefficient , creating an empirical relation between the initial flow rate and the friction coefficient . Here, is one of the fitting parameters. Based on this empirical relation we deduce the friction coefficient by matching the flow rates in the experiments at g. The red open circles correspond to the dry simulations and the filled blue squares to the submerged simulations. The friction coefficients that reproduce the experiment are almost equal as and in the dry and submerged cases, respectively. The similarity in dry and submerged friction coefficient is also reported by Dijksman et al. with acrylic beads in a rheometer Dijksman et al. (2010). Note that here we refer to grain-grain friction whereas Dijksman et al. refers to the minimum friction coefficient at the quasi-static limit when inertial effects vanish . The relation is a non-trivial monotonic function that (to our knowledge) is only explored numerically Lemaître et al. (2009); Da Cruz et al. (2005); Trulsson et al. (2016)
Fig. 7 displays the mass remaining in the hopper from both the experiments and the simulations with the friction coefficient set to the obtained values of in the dry case and in the submerged case. The submerged experiment is depicted in blue and the dry case in red color. The datasets are the result of a single run. The simulated and the experimental data are overlapping within the measurement accuracy. This lends credence to the computational approach applied in the work and specifically suggests that the coupled CFD-DEM model captures the quintessential features of the two-phase (submerged) hopper flow.
Fig. 8 displays the Gaussian weighted derivative over two second time window of the data depicted in Fig. 7. In both dry cases, the experiment and the simulation, the hopper empties at a constant flow rate. At the end when the grains run out and the flow rate decreases without a terminal surge. In contrast, the presence of the interstitial fluid reduces the overall granular flow rate and imposes an acceleration towards the end. Recently, such terminal surge has been confirmed in the dry case for smaller particles in experiments Koivisto and Durian (2017a) and appears to be visible also in simulations Dunatunga and Kamrin (2015); Schwartz et al. (2012).
Based on our theoretical discussion on the terminal velocity, and on the dependence of the surge on particle size, we propose that the 2 mm particles are too heavy to be affected by interstitial air. Therefore, the surge does not appear in the dry experiments resulting in good agreement to our vacuum simulations. Since the viscosity and density of water are several orders of magnitude larger, the submerged flow exhibits a surge. We conclude that the viscosity of the interstitial medium has to be large enough compared to the particle inertia for the surge to appear.
IV Conclusions
We performed experiments and simulations on dry and submerged hopper flows of granular particles of approximately millimeter radius using the combination of DEM and CFD. In the frictionless case, we confirm the previously known numerical result Langston et al. (1994), that the flow rate of the dry granular particles decreases as a function of time. Here, we have extended the result of decreasing flow rate to submerged conditions. This scenario, which occurs in both dry and submerged system could be understood in the context of a Newtonian fluid running out of a hopper.
The grain-grain friction changes the scenario from a Newtonian behavior into a more complex one: In the dry case the grain flow rate remains constant until the height of the granular column is less than the width of the hopper Nedderman et al. (1982). This is a well understood behavior, and is readily described by the Beverloo equation.
In the submerged hopper case, the grain-grain friction has an even more profound effect. The flow accelerates, surging through the whole hopper emptying process. Furthermore, right before the hopper runs out of grains there is a clear terminal surge in the flow rate. The accelerating flow can be understood in the framework of a feedback loop mediated by the incompressible, viscous water. The grains exit the hopper as the gravity pulls them. The grains replace a certain volume of water outside the hopper. Due to the water incompressibility the same amount of water needs to enter the hopper. This mainly occurs through the open top, where the flow resistance is the smallest. That creates a flow of water through the granular packing, which in turn mediated by the viscosity, increases the outflow of the grains. This granular pumping effect is described in Koivisto and Durian (2017a) and is captured by the simulation here.
As we observe, both the dry and submerged cases are sensitive to the grain-grain friction. This allows us to use the parameter to fit the simulated flow rates against the corresponding experiments. Subsequently, we observe that the optimal friction parameter is almost the same in both the cases. This was a surprising result, since one would expect the grain-grain friction to be significantly lower on a wet surface. However, as we do not explicitly account for the grain-grain hydrodynamic interactions, we expect the friction coefficient to partly compensate for that. This sensitivity to friction coefficient gives the possibility to interpret the hopper flow in the context of non-linear effective rheology.
Fig. 9 shows a schematic illustration of three systems with (discontinuous) shear thickening Peters et al. (2016), a characteristic of frictional granular systems. For the same load, caused by the high particle column, the frictionless case, a Newtonian fluid, has the smallest slope and thus lowest effective viscosity. Friction increases the slope and introduces a sudden increase of viscosity, that can be many orders of magnitude. This is observed here as rapid decrease of flow rate as a function of particle-particle friction. When the mass of the particle column decreases in time, the effective viscosity of the system decreases as well, causing an increase in the flow rate. This is seen as the terminal surge. For a system of high interparticle friction this has a greater impact.
Here we have presented the first step to compare simulations to the experiments with a good agreement. The one-to-one match with experiments and simulation is currently pushing the limits of both methods. Using smaller than cm particles increases the experimental accuracy via lowering the flow rate. However using smaller particles renders the simulation impractical by making the problem too large for the present computational resources. Both of these problems, the experimental and numerical are solvable in the near future by advanced computational methods and measurement techniques. Future studies should involve the effect of wall and bottom friction, dilation of grains at the orifice, clogging, self-generated pumping of fluid, terminal and exit velocities of particles. Also, we would like to point out that the behavior of the flow rate at infinitely tall packings, the constant component as the function of particle size is also interesting. There is a transition from colloidal no-flow behavior to surging flow and back to no-flow at clogging, but this is outside the scope of this paper.
V Acknowledgement
This work was supported by the Academy of Finland through the COMP center of excellence and the project number 278367. The simulations were performed using the computer resources within the Aalto University School of Science, Science-IT project. JK acknowledges the support from Finnish cultural foundation and Wihuri foundation through Foundations’ post doc pool project. DJD acknowledges the support from NFS through grant DMR-1305199.
The reference list from the paper itself. Each links out to its DOI / PubMed record.
- 1Zhou et al. (2010) Z. Zhou, S. Kuang, K. Chu, and A. Yu, J. Fluid Mech. 661 , 482 (2010) . · doi ↗
- 2Zhu et al. (2007) H. Zhu, Z. Zhou, R. Yang, and A. Yu, Chem. Eng. Sci. 62 , 3378 (2007) . · doi ↗
- 3Eshuis et al. (2007) P. Eshuis, K. van der Weele, D. van der Meer, R. Bos, and D. Lohse, Phys. Fluids 19 , 123301 (2007) . · doi ↗
- 4Divoux et al. (2015) T. Divoux, M. A. Fardin, S. Manneville, and S. Lerouge, Annu. Rev. Fluid Mech. 48 , 81 (2015) . · doi ↗
- 5Johnson et al. (2017) D. H. Johnson, F. Vahedifard, B. Jelinek, and J. F. Peters, J. Rheol. 61 , 265 (2017) . · doi ↗
- 6Seto et al. (2013) R. Seto, R. Mari, J. F. Morris, and M. M. Denn, Phys. Rev. Lett. 111 , 218301 (2013).
- 7Losert et al. (2000) W. Losert, J.-C. Géminard, S. Nasuno, and J. P. Gollub, Phys. Rev. E 61 , 4060 (2000) . · doi ↗
- 8Athanassiadis et al. (2014) A. G. Athanassiadis, M. Z. Miskin, P. Kaplan, N. Rodenberg, S. H. Lee, J. Merritt, E. Brown, J. Amend, H. Lipson, and H. M. Jaeger, Soft Matter 10 , 48 (2014) . · doi ↗