An optimized interatomic potential for silicon and its application to thermal stability of silicene
G. P. Purja Pun, Y. Mishin

TL;DR
This paper develops a new optimized interatomic potential for silicon that accurately models various properties and predicts that bilayer silicene is thermally stable at room temperature, unlike single-layer silicene.
Contribution
A novel optimized interatomic potential for silicon is introduced, improving accuracy over existing models and enabling better predictions of silicene's thermal stability.
Findings
The new potential accurately reproduces silicon properties.
Single-layer silicene is unstable at room temperature.
Bilayer silicene remains stable at ambient conditions.
Abstract
An optimized interatomic potential has been constructed for silicon using a modified Tersoff model. The potential reproduces a wide range of properties of Si and improves over existing potentials with respect to point defect structures and energies, surface energies and reconstructions, thermal expansion, melting temperature and other properties. The proposed potential is compared with three other potentials from the literature. The potentials demonstrate reasonable agreement with first-principles binding energies of small Si clusters as well as single-layer and bilayer silicenes. The four potentials are used to evaluate the thermal stability of free-standing silicenes in the form of nano-ribbons, nano-flakes and nano-tubes. While single-layer silicene is mechanically stable at zero Kelvin, it is predicted to become unstable and collapse at room temperature. By contrast, the bilayer…
Click any figure to enlarge with its caption.
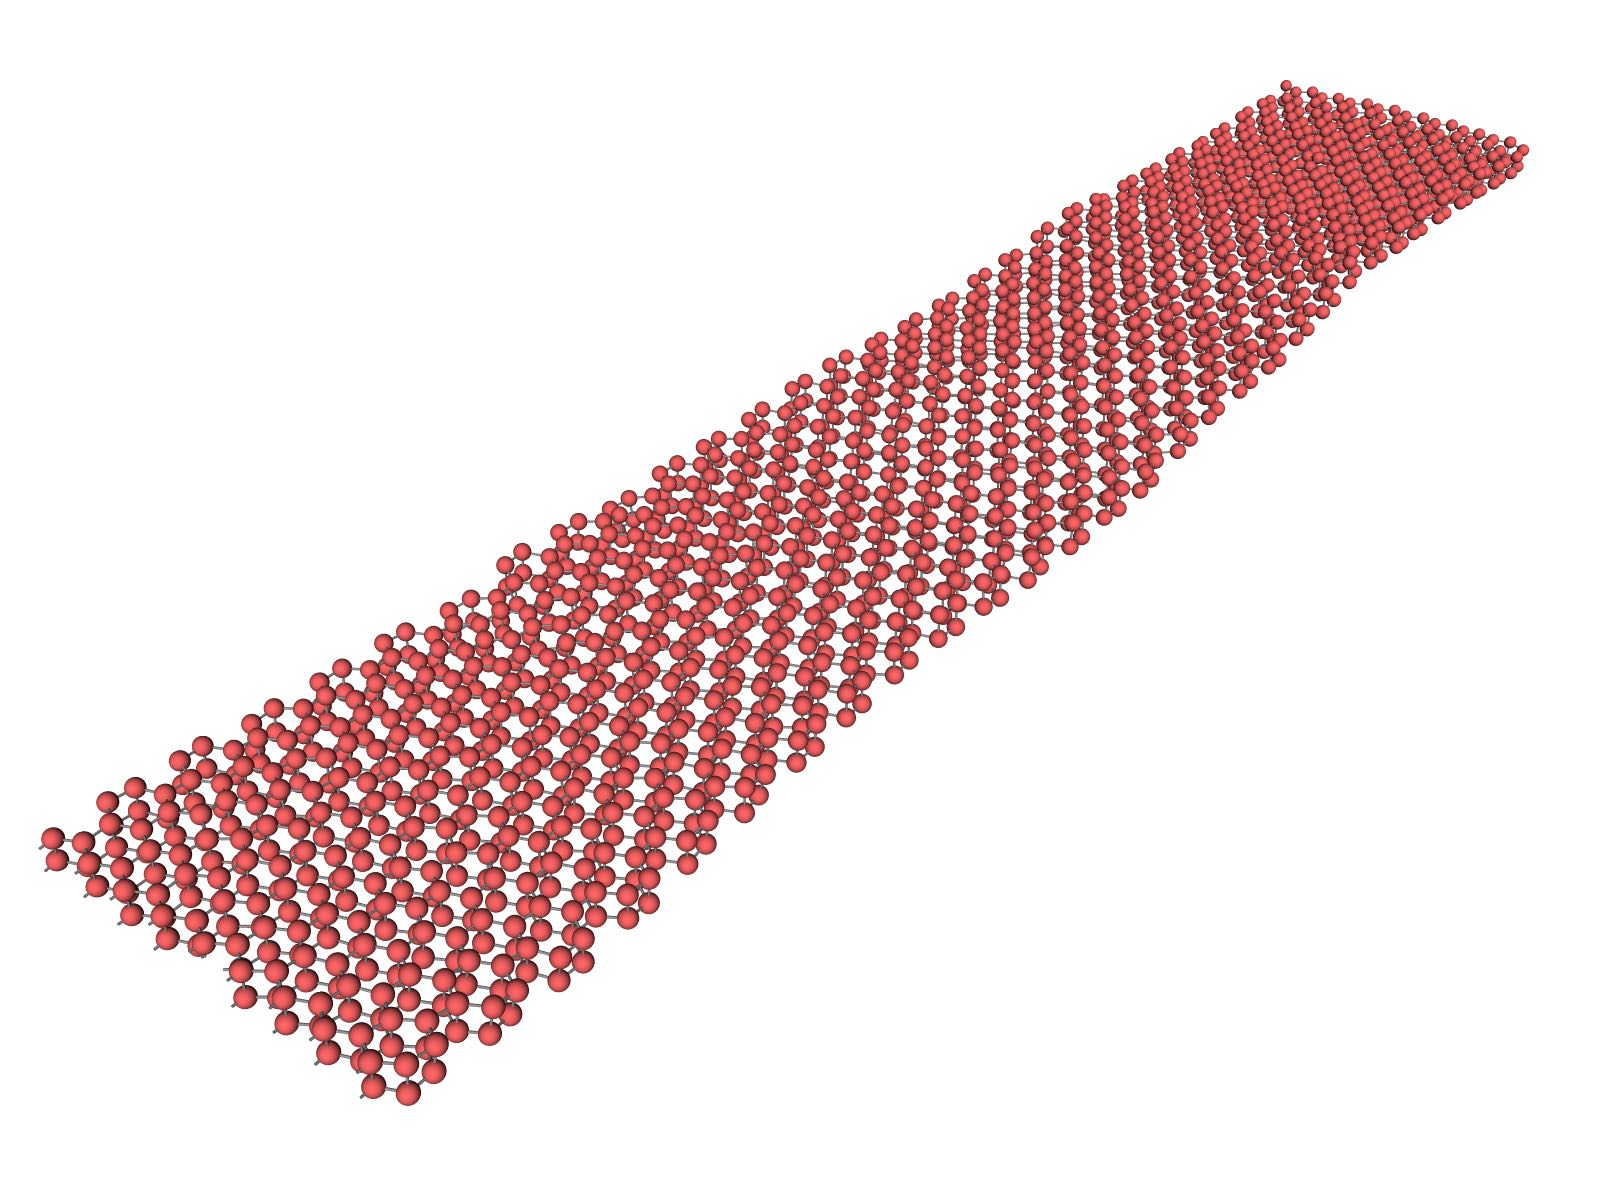 Figure 1
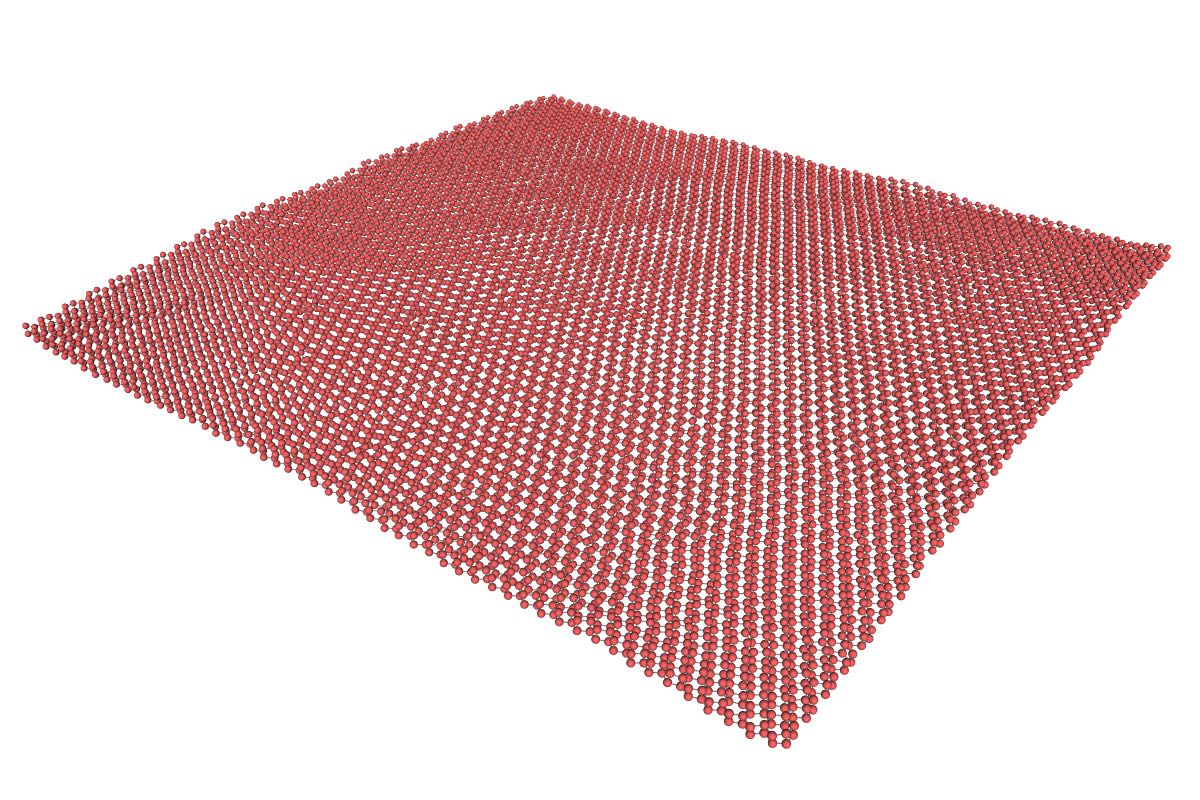 Figure 2
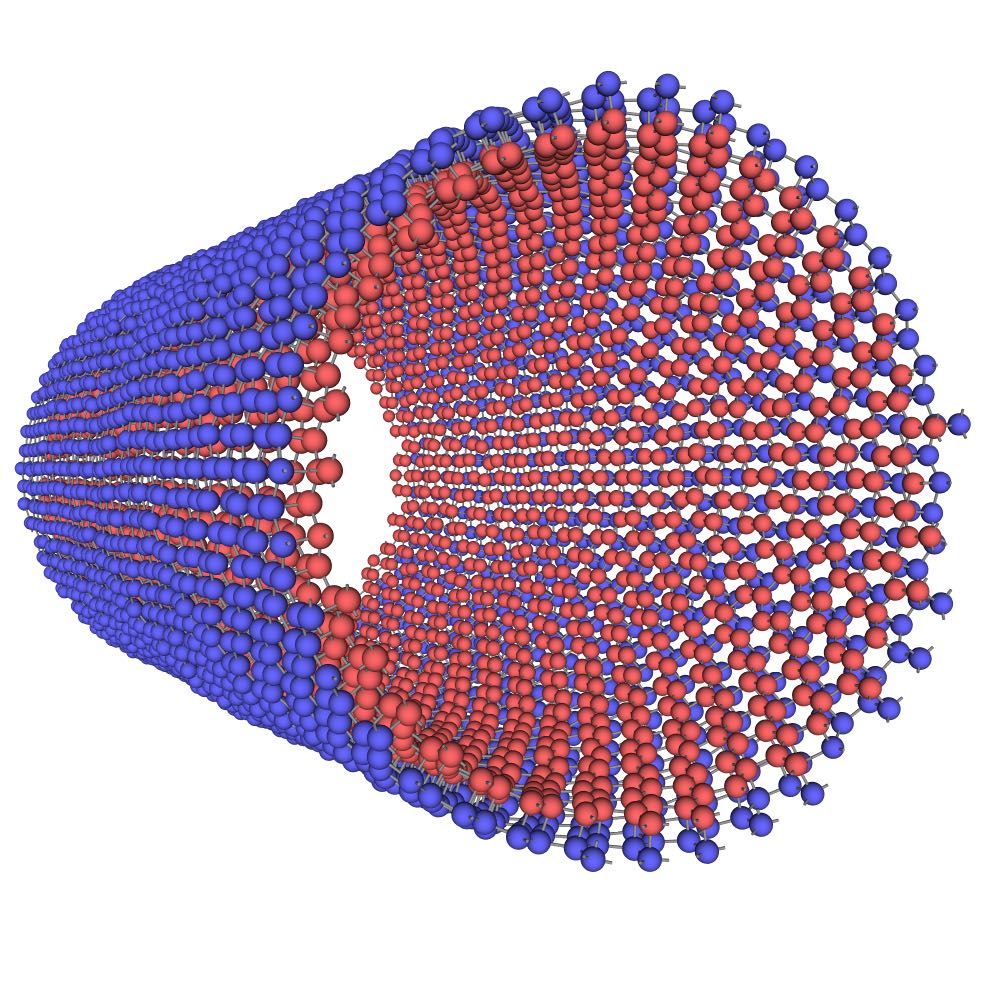 Figure 3
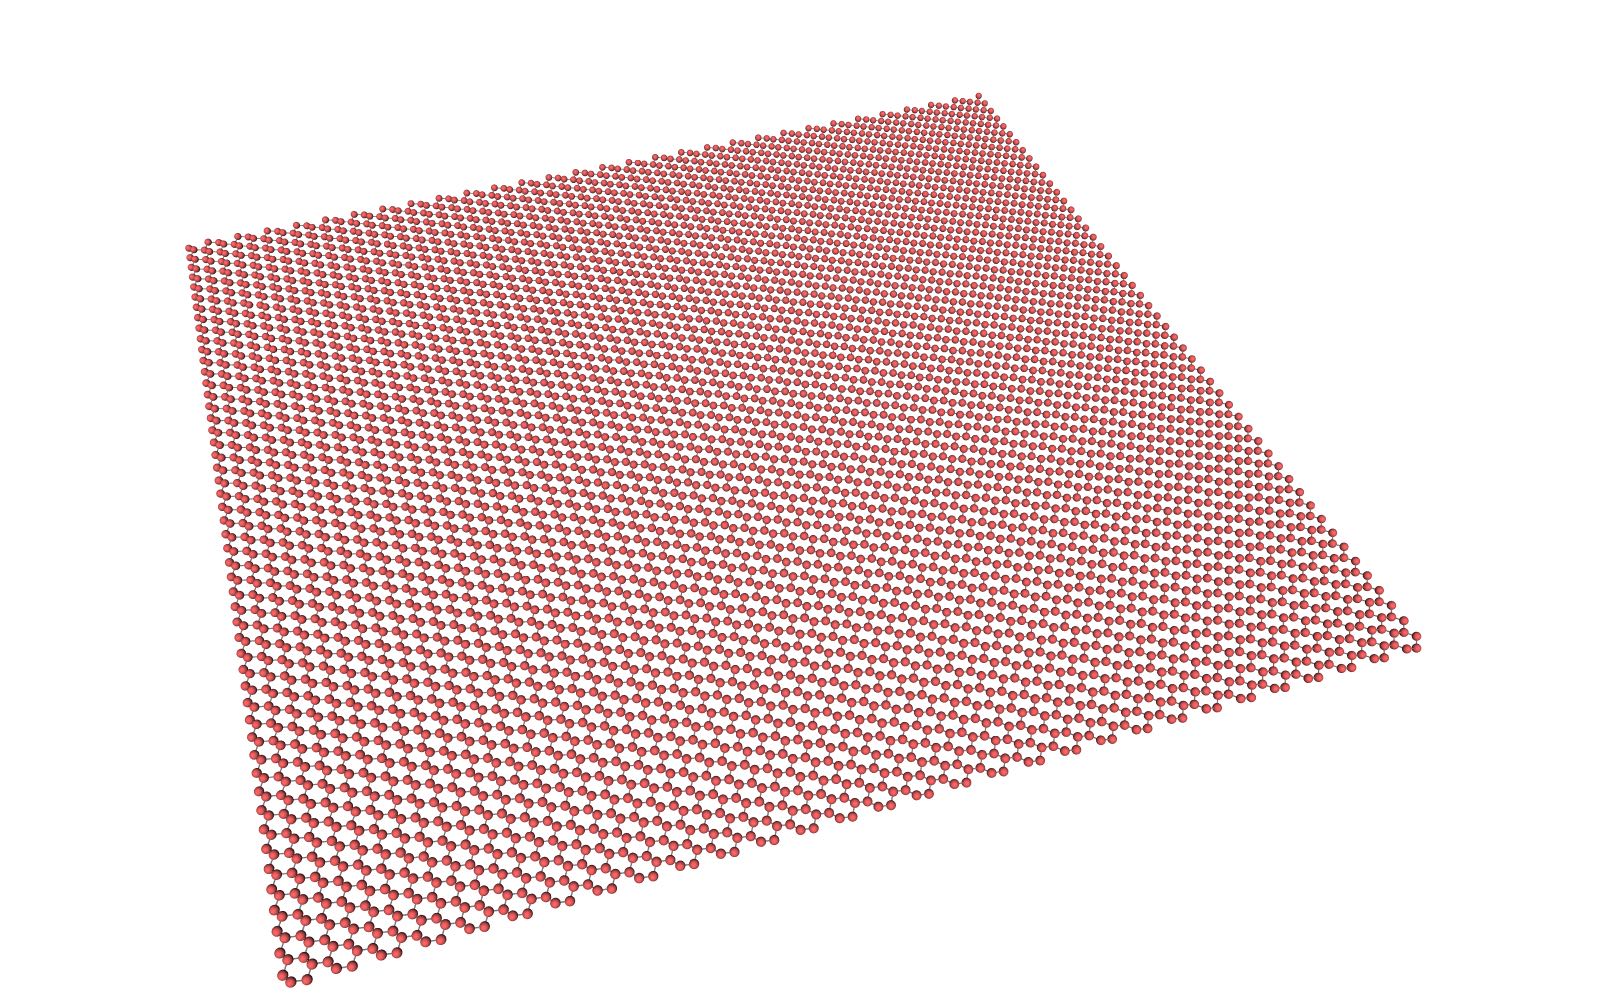 Figure 4
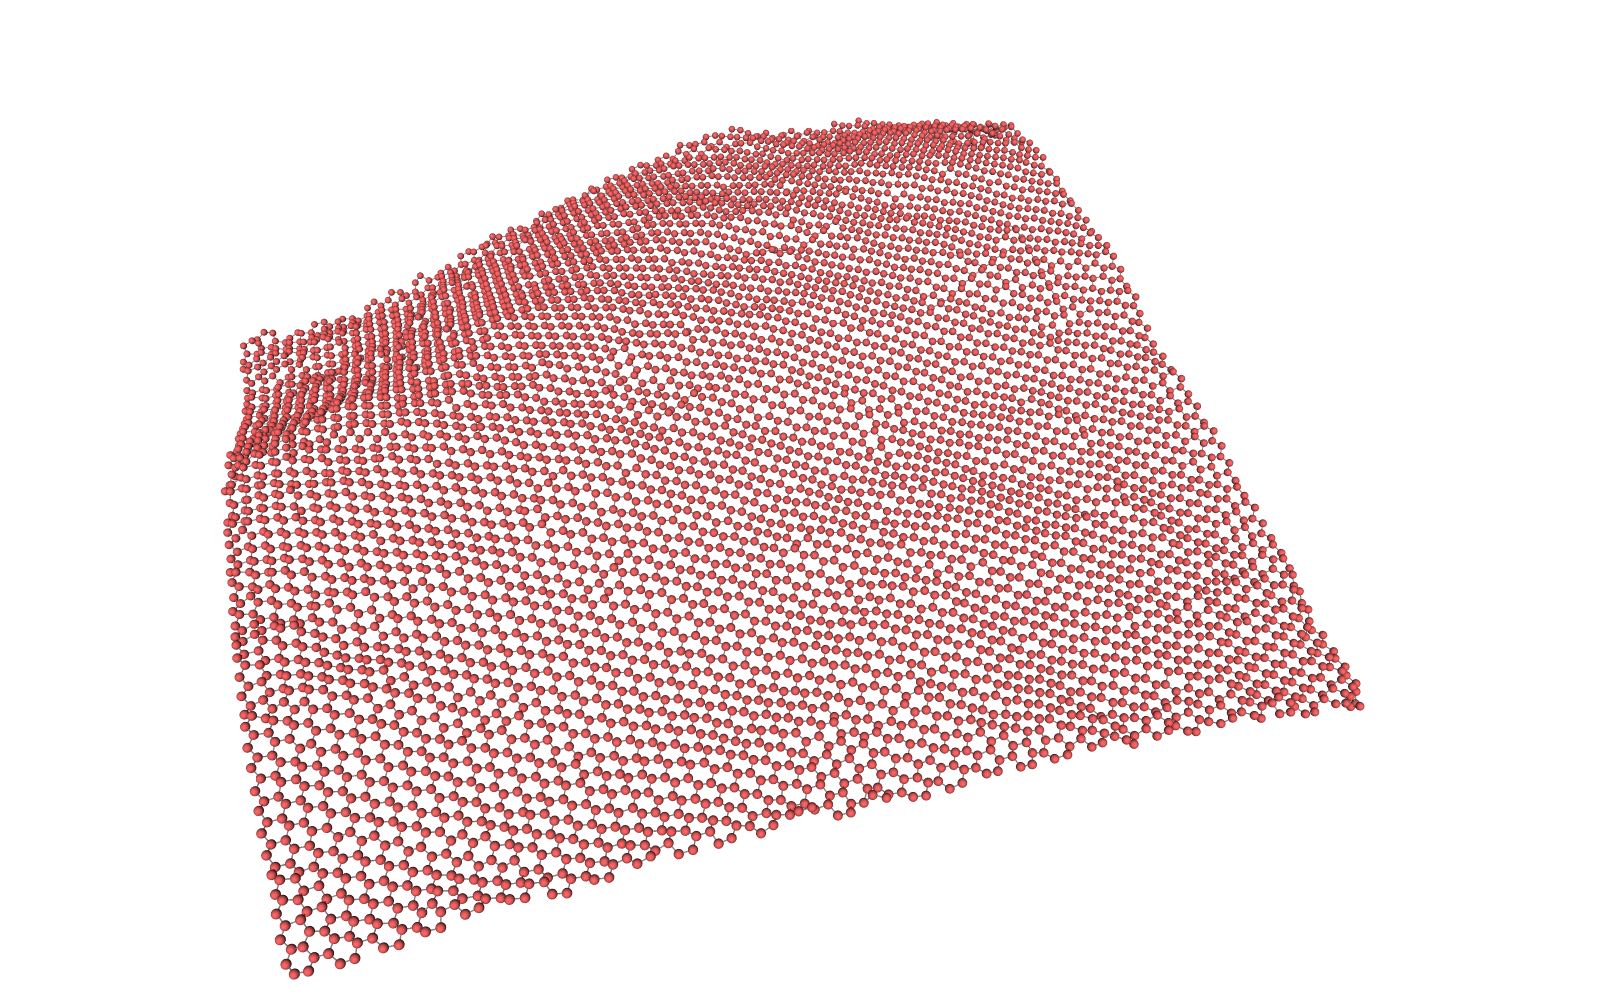 Figure 5
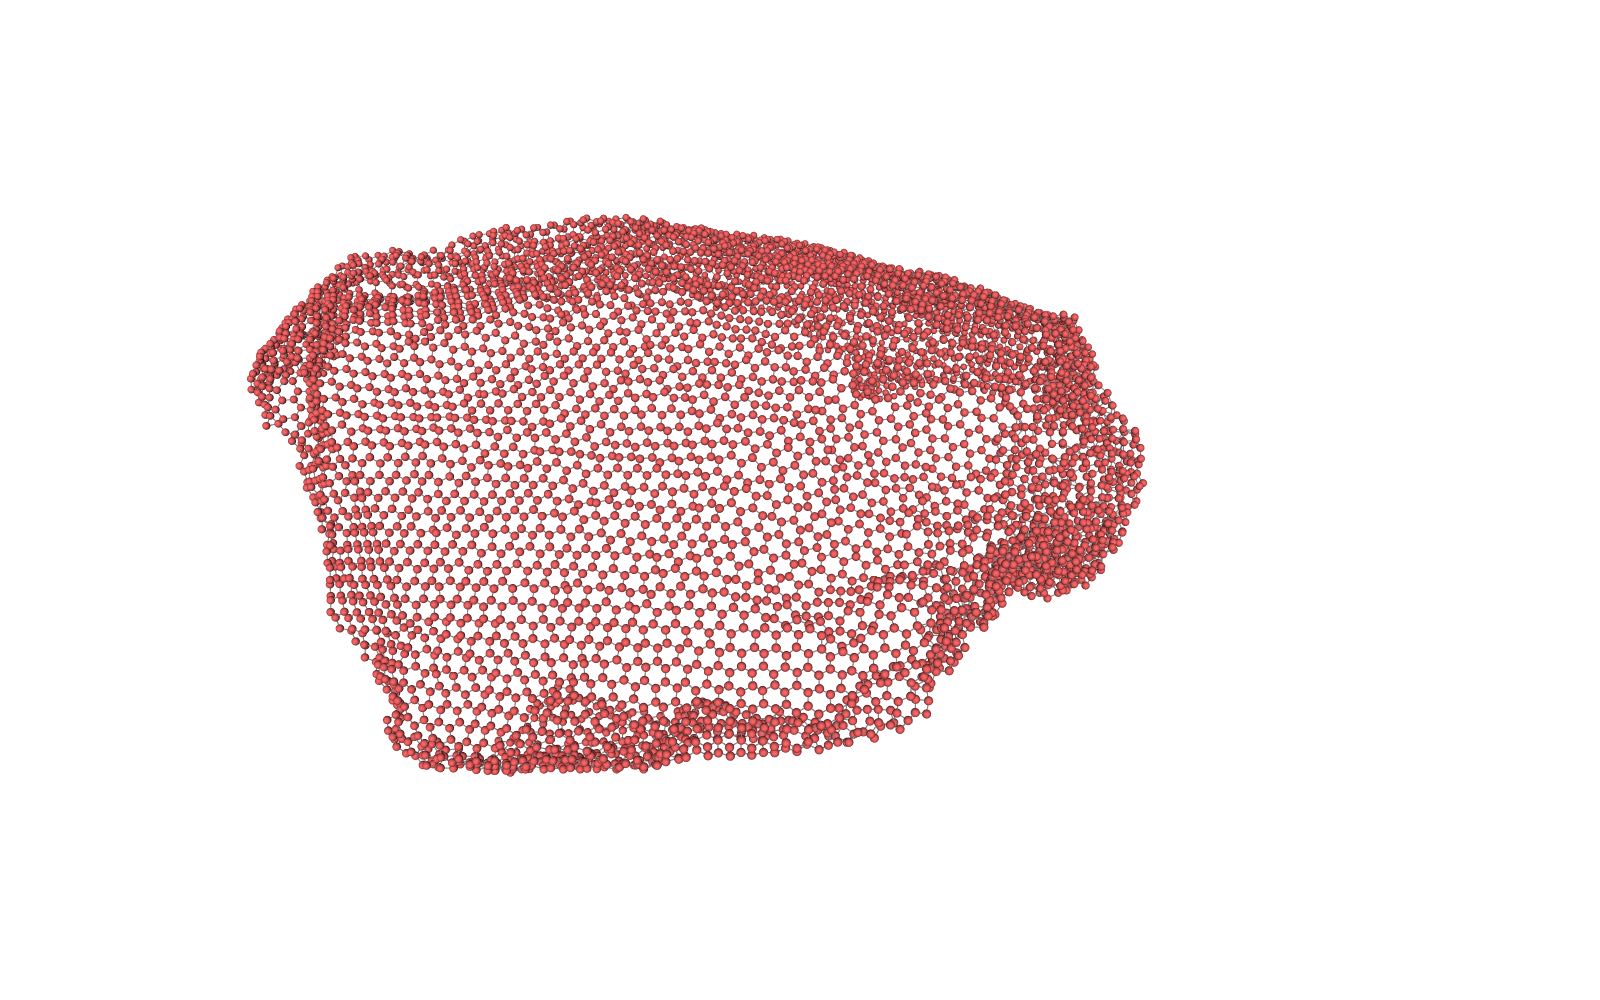 Figure 6
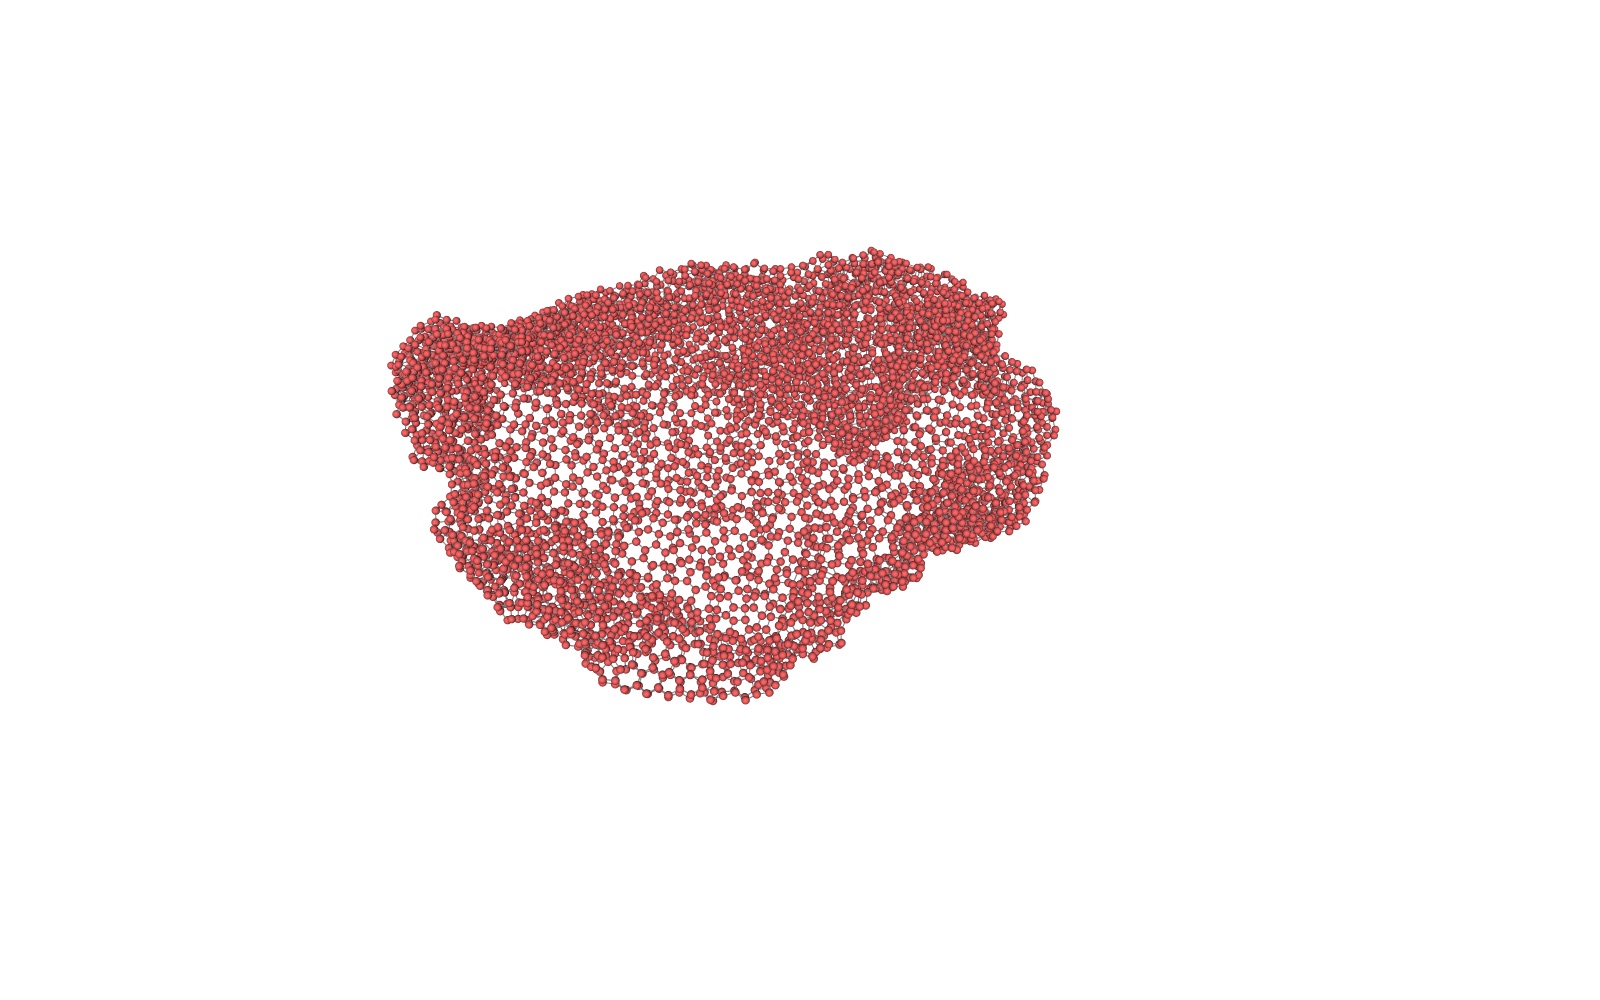 Figure 7
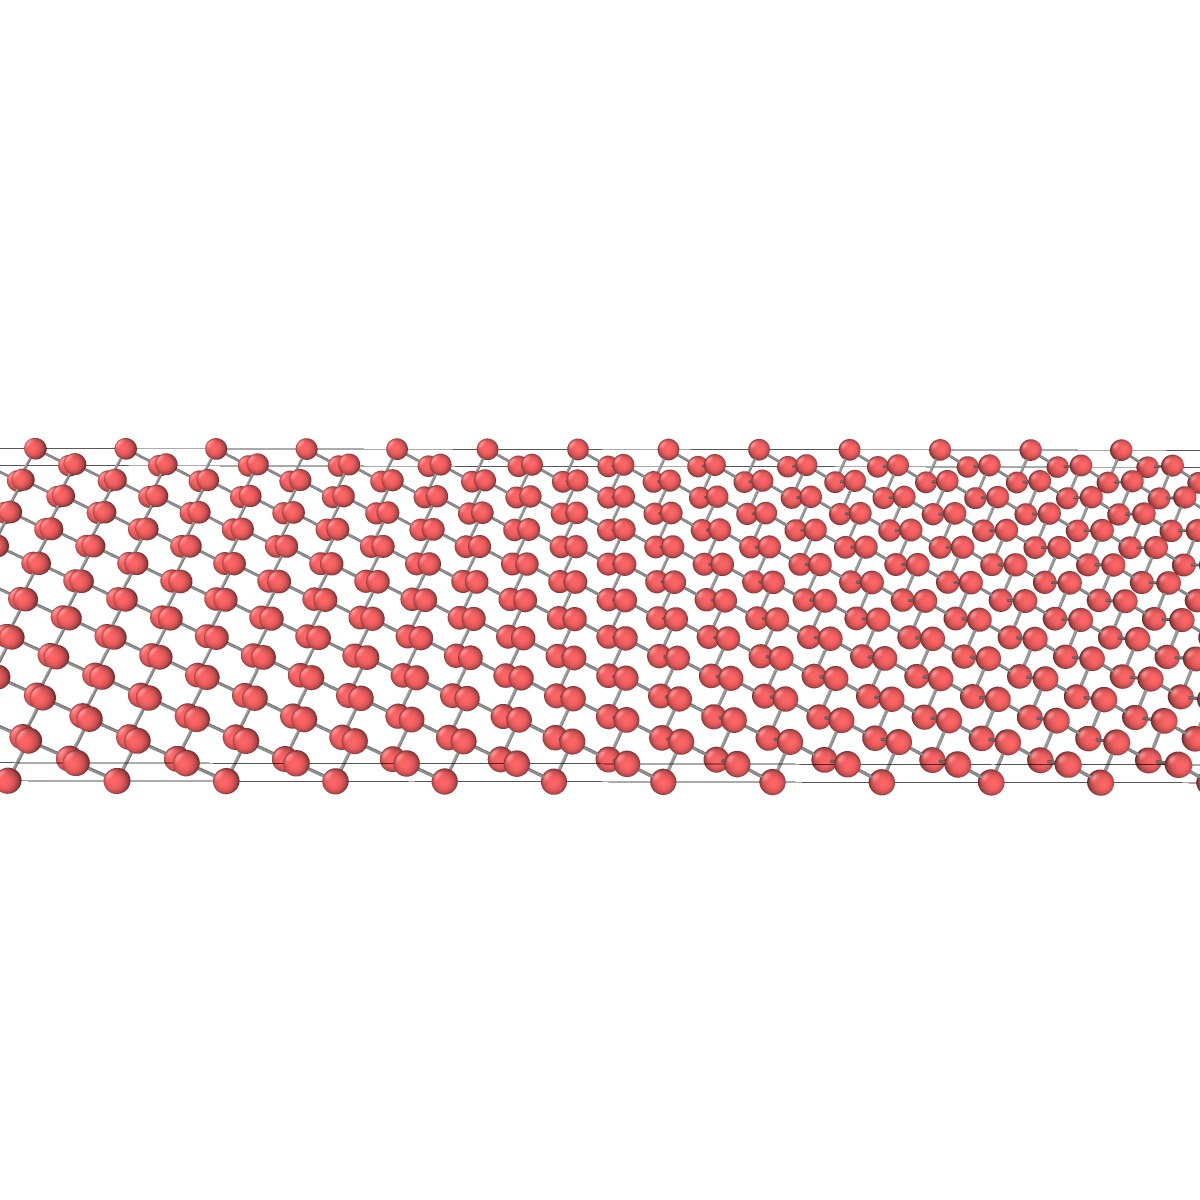 Figure 8
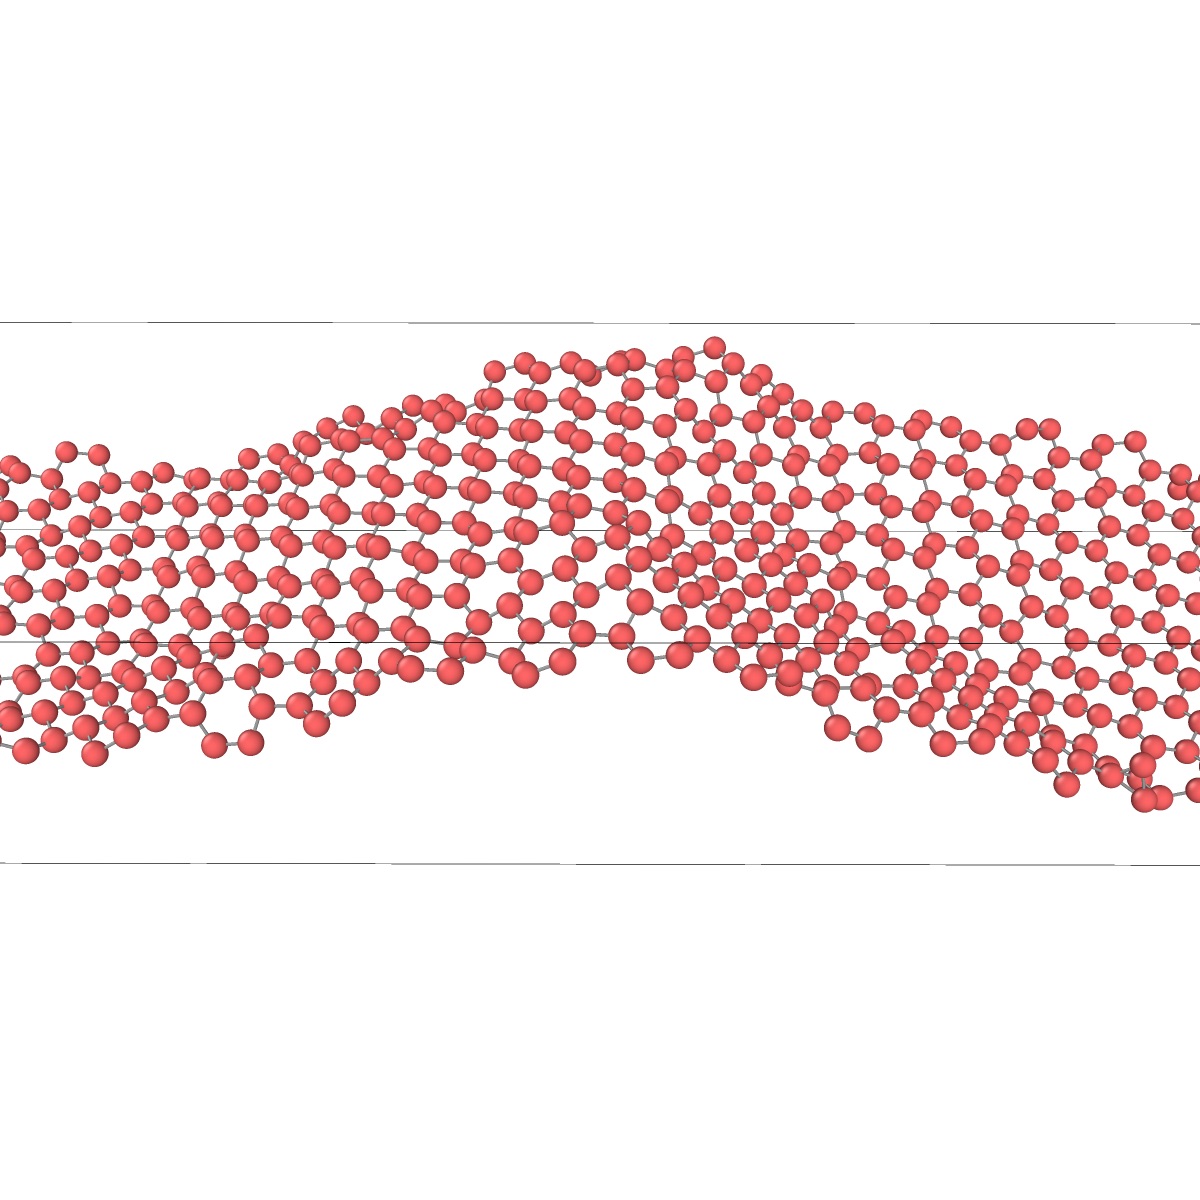 Figure 9
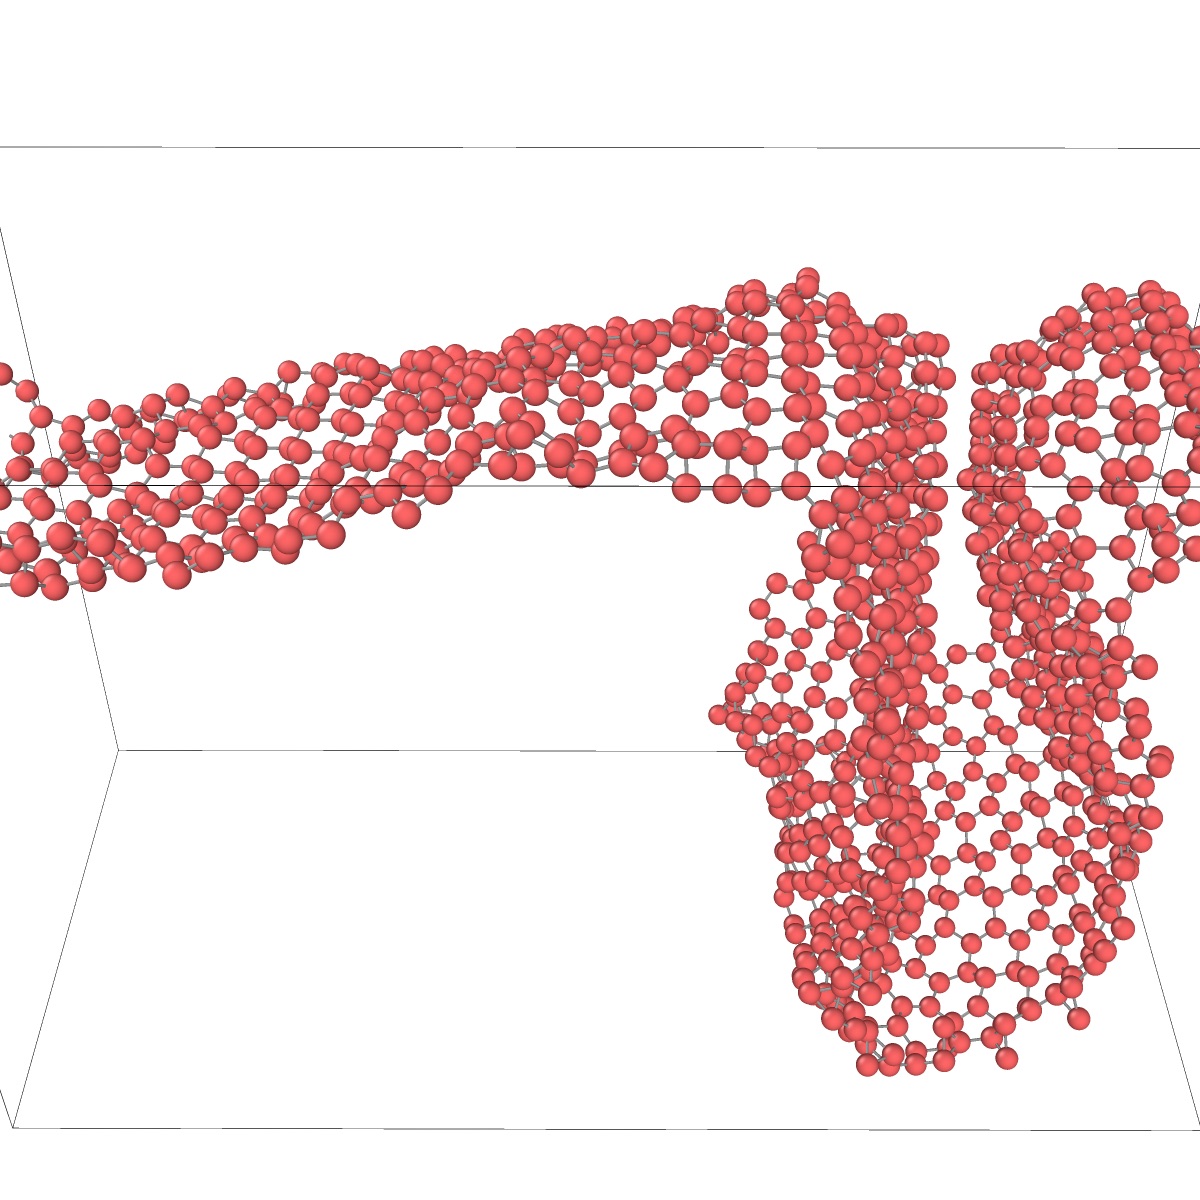 Figure 10
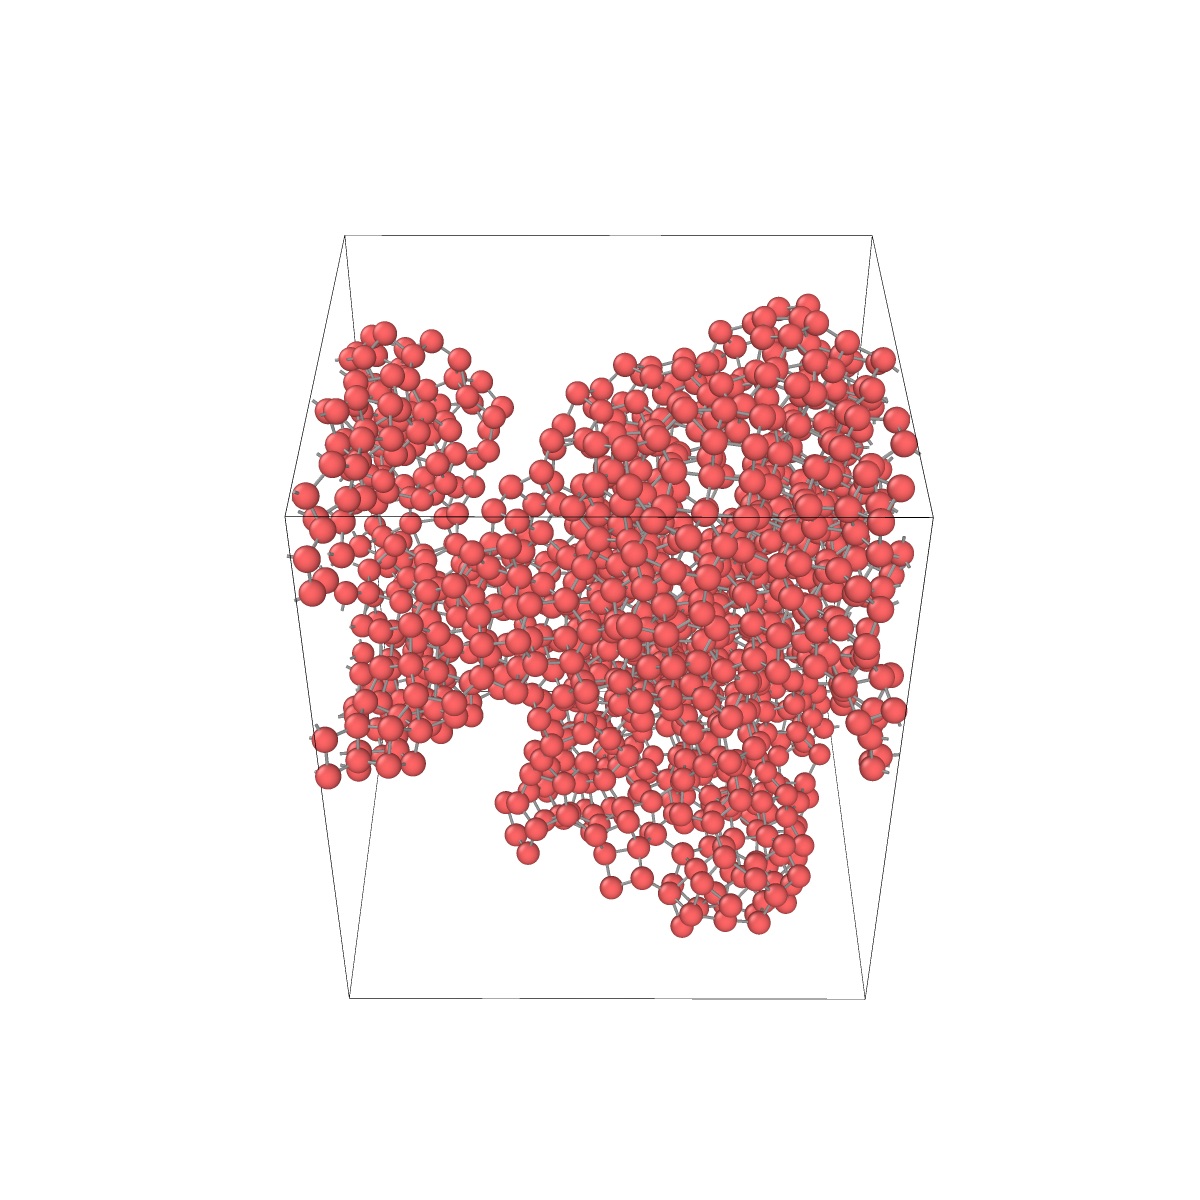 Figure 11
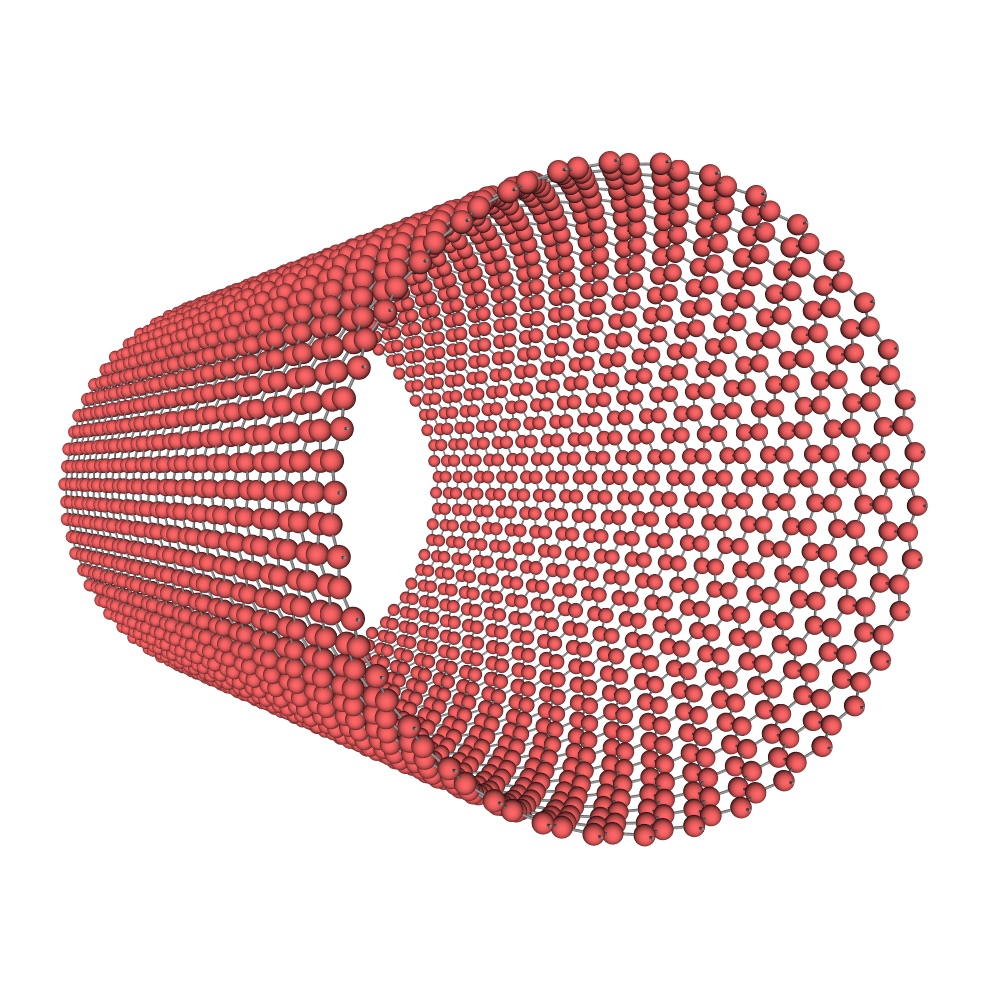 Figure 12
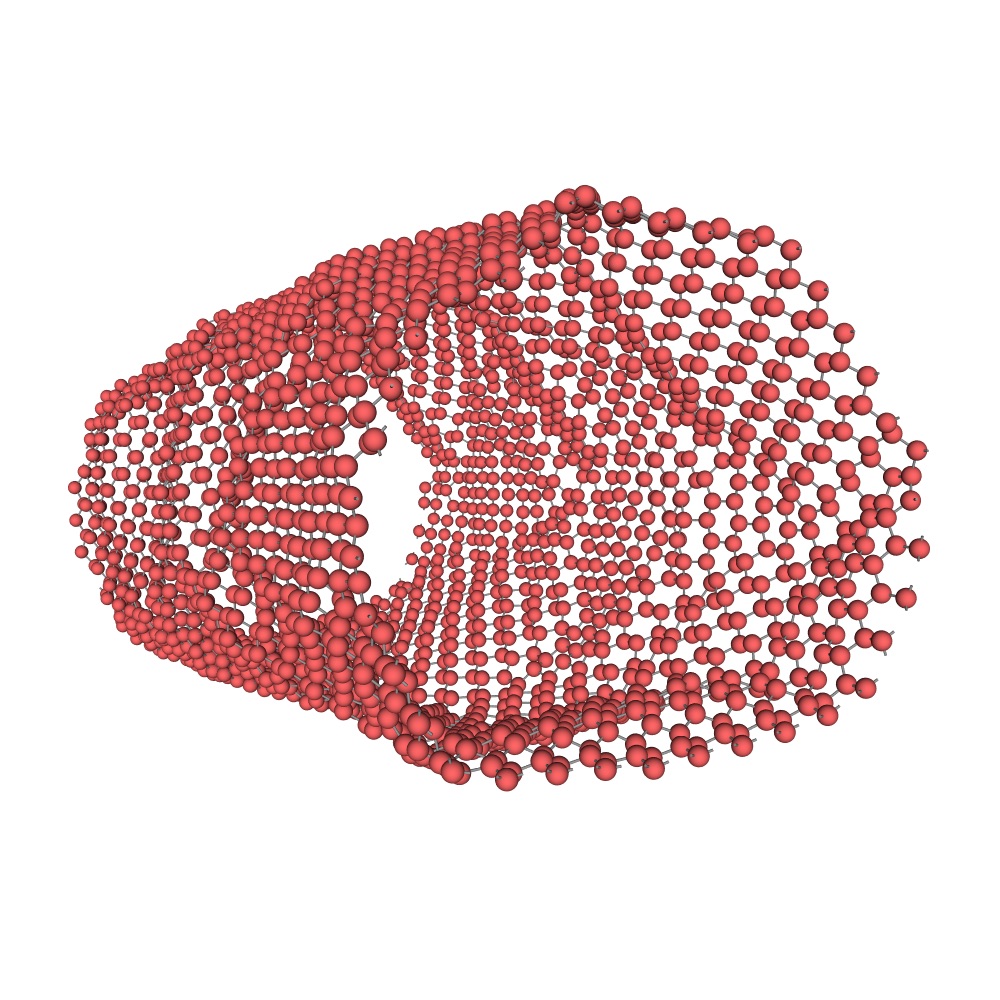 Figure 13
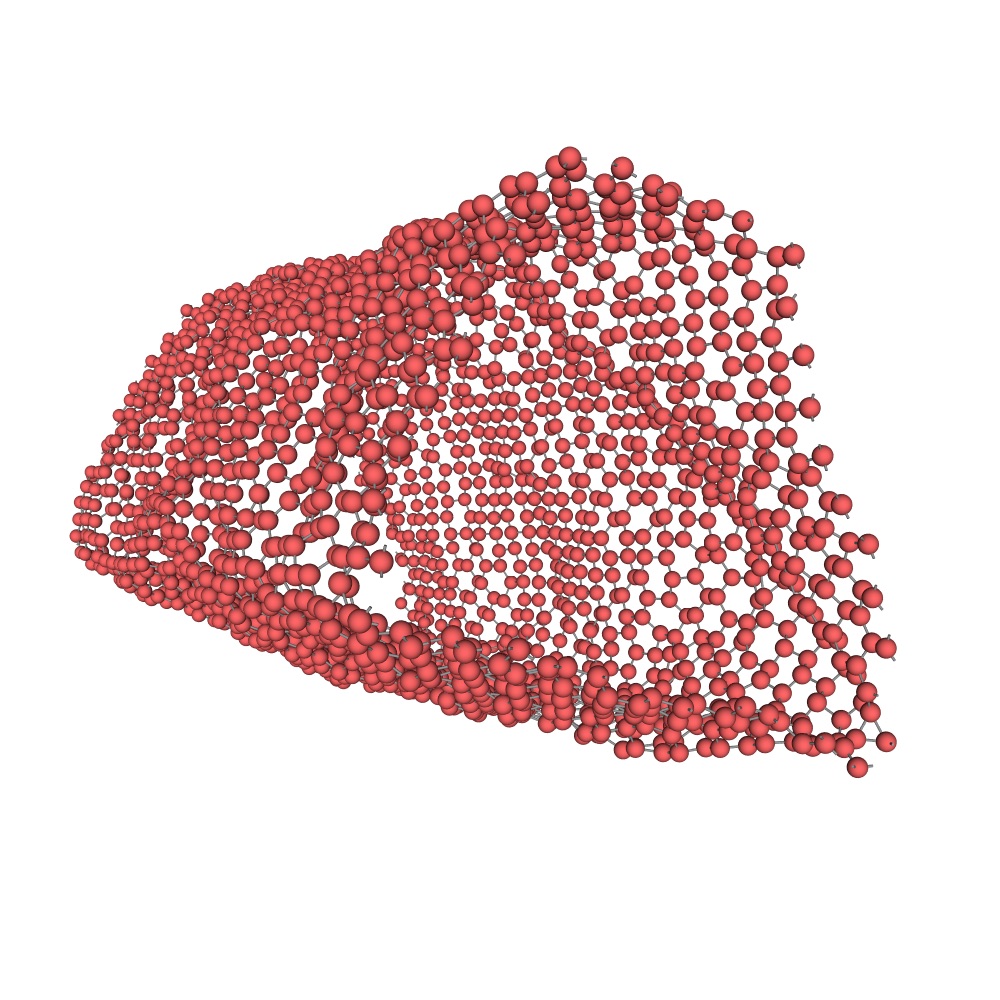 Figure 14
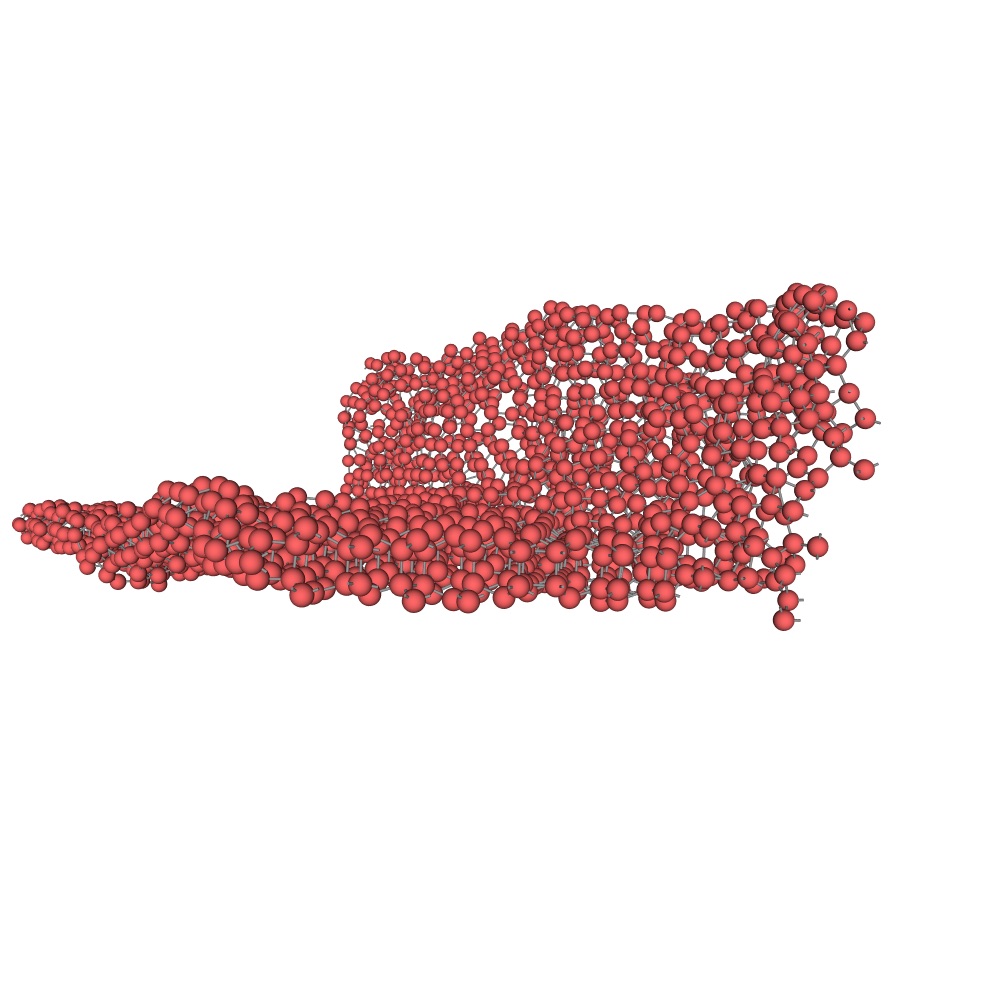 Figure 15
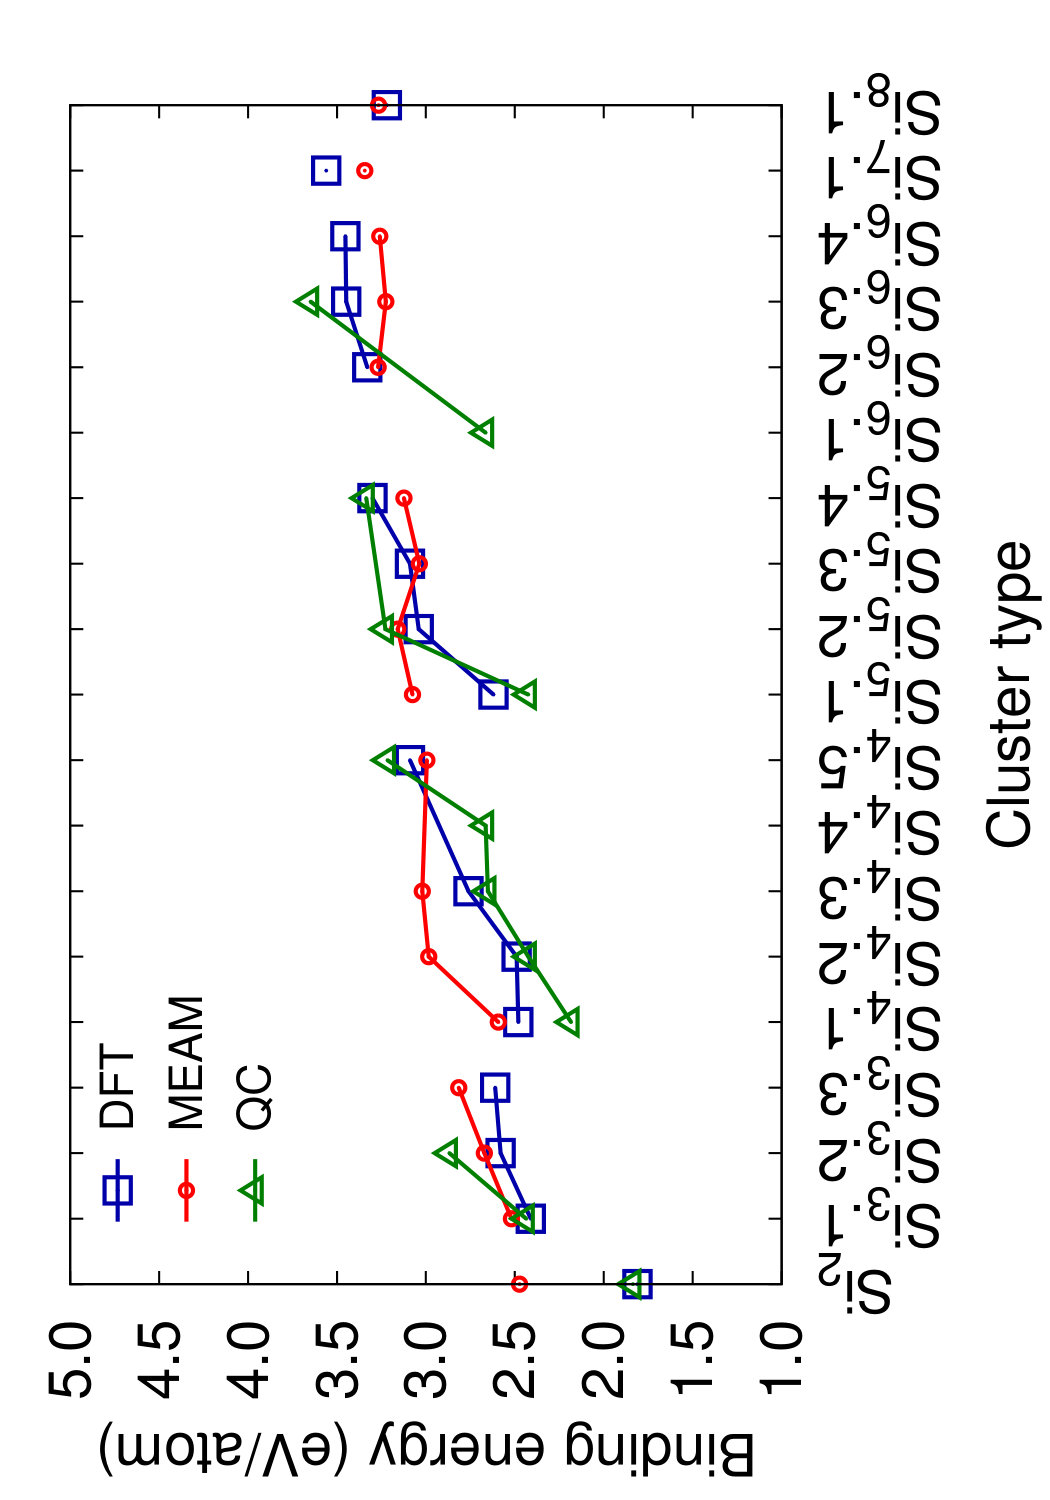 Figure 16
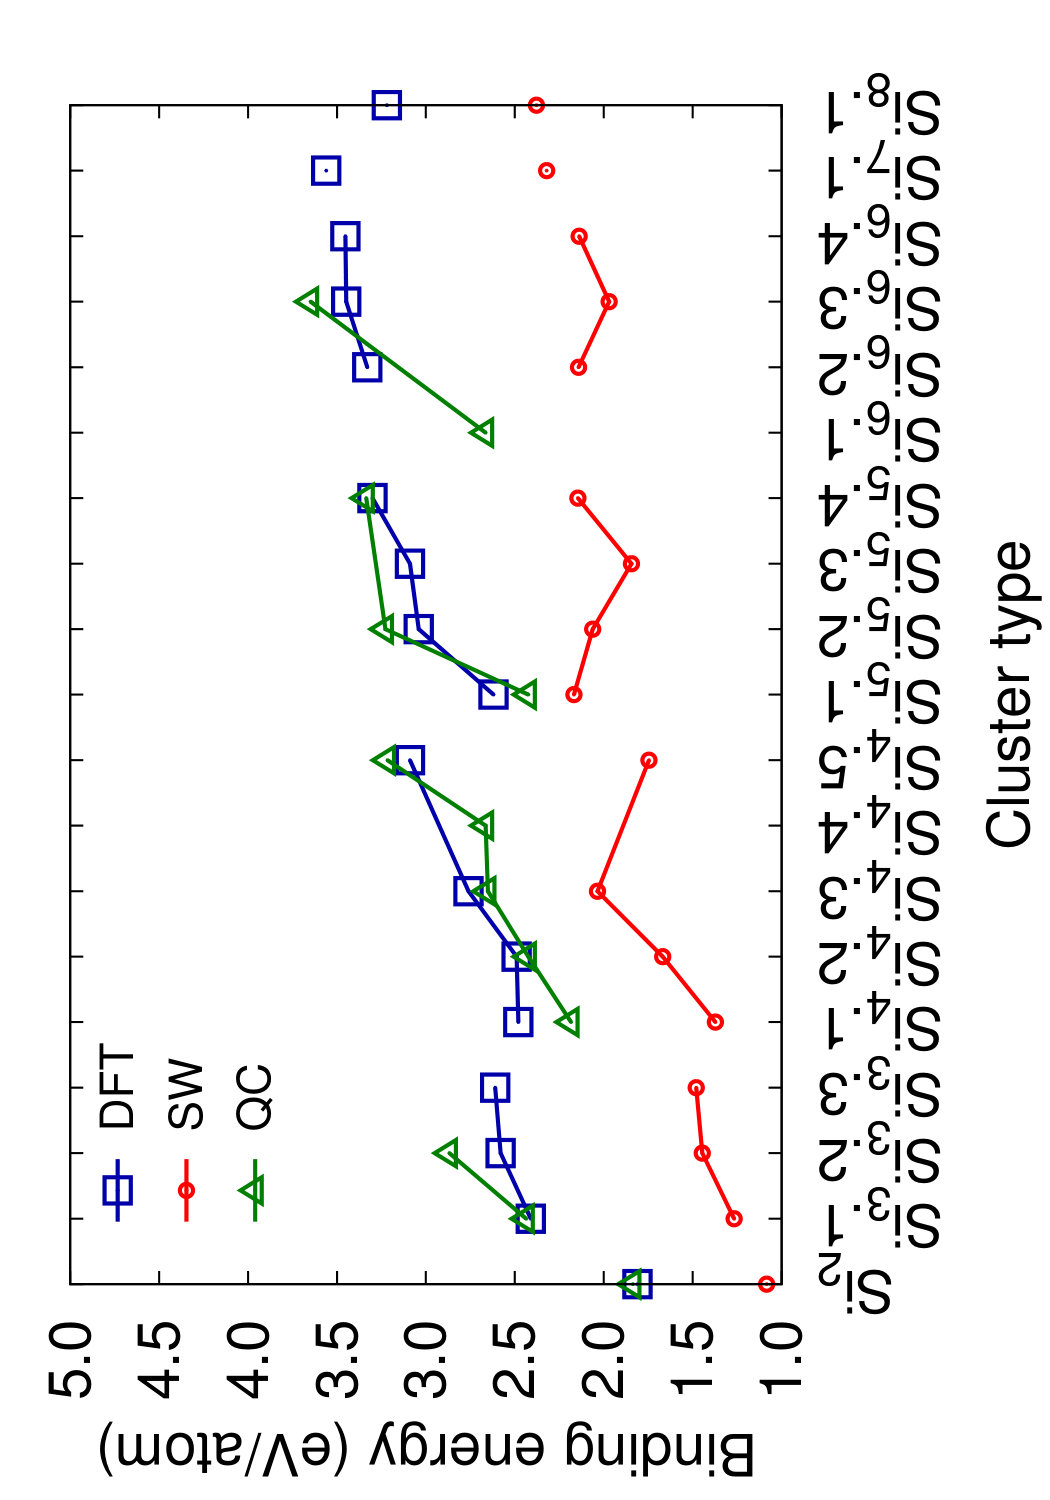 Figure 17
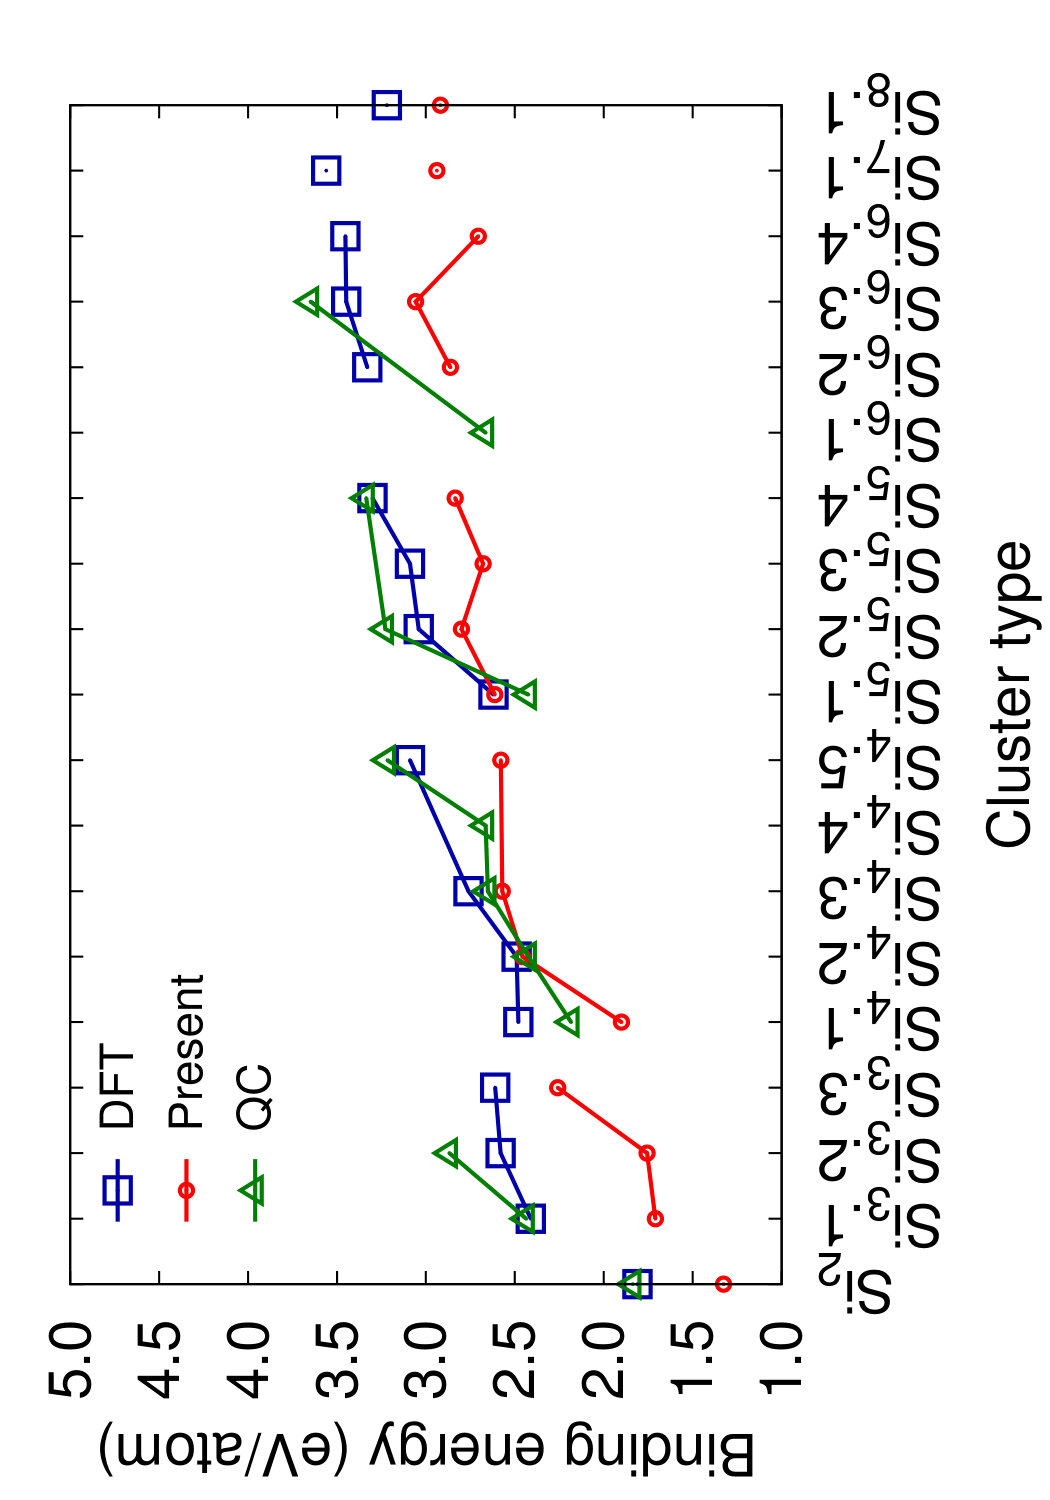 Figure 18
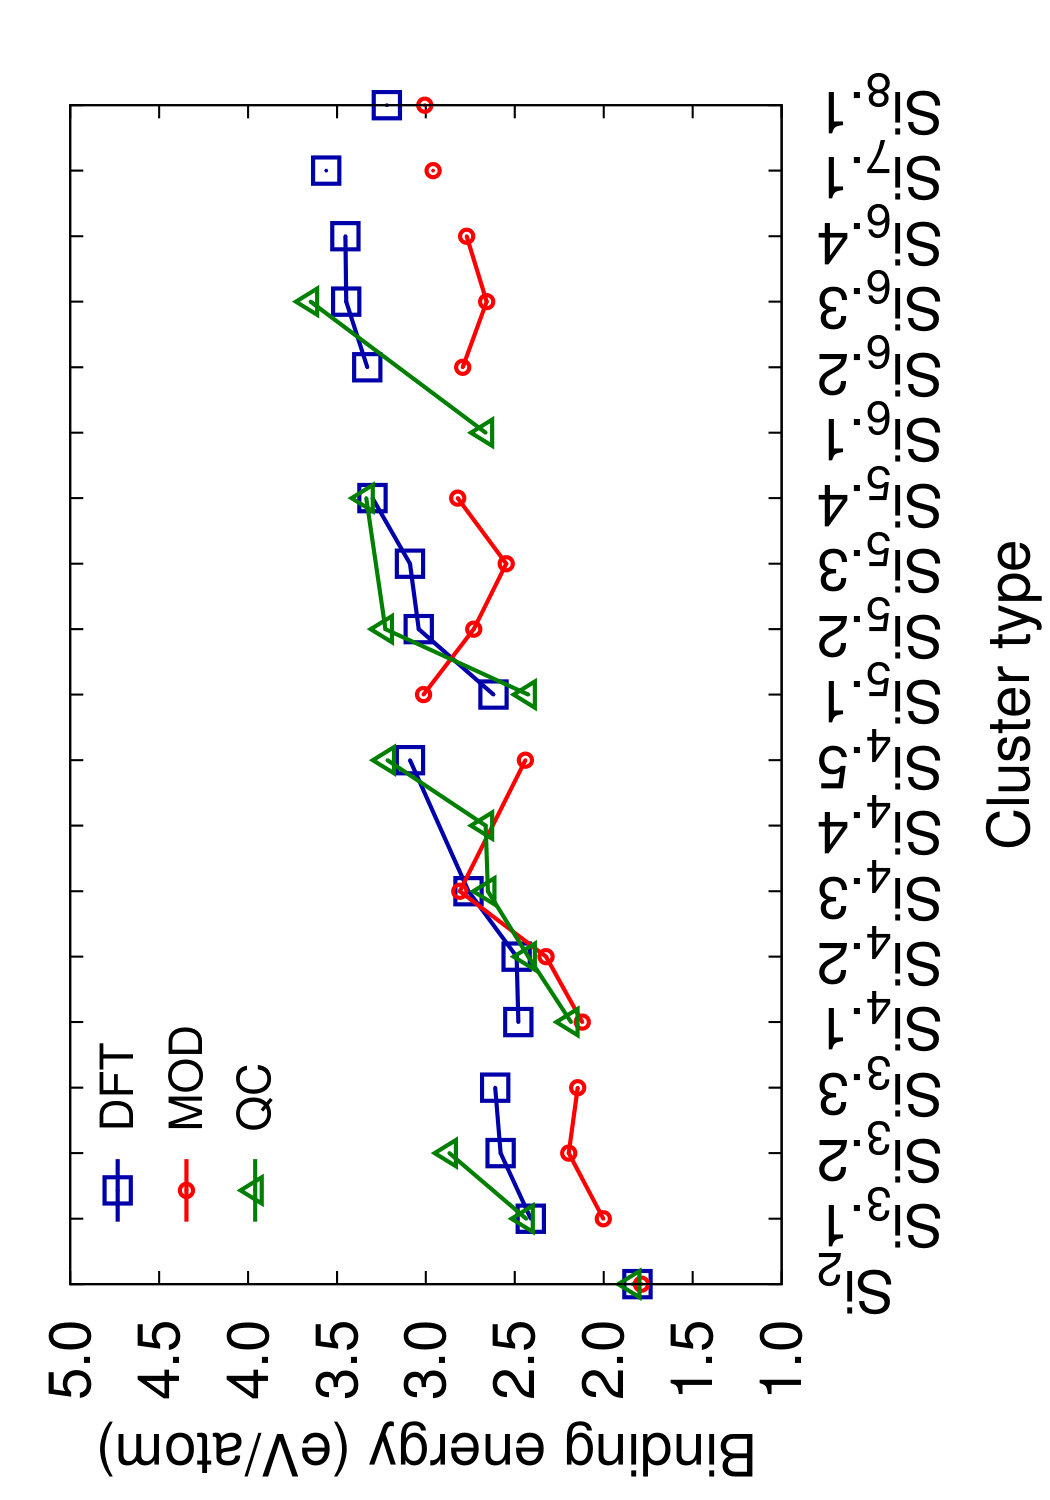 Figure 19
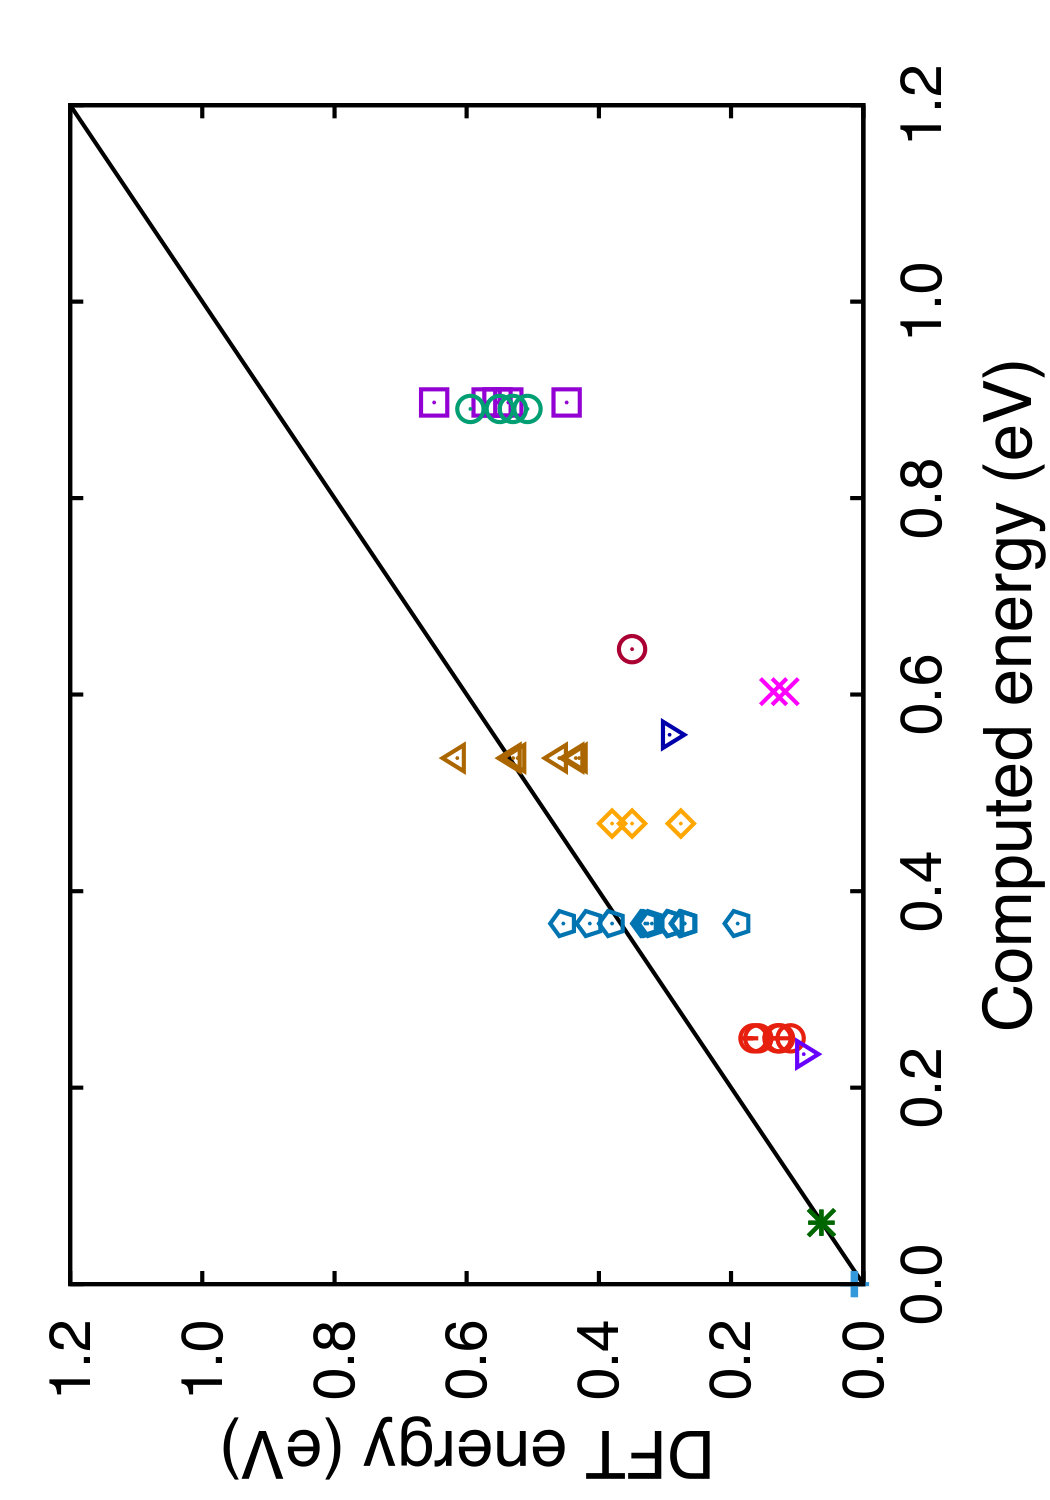 Figure 20
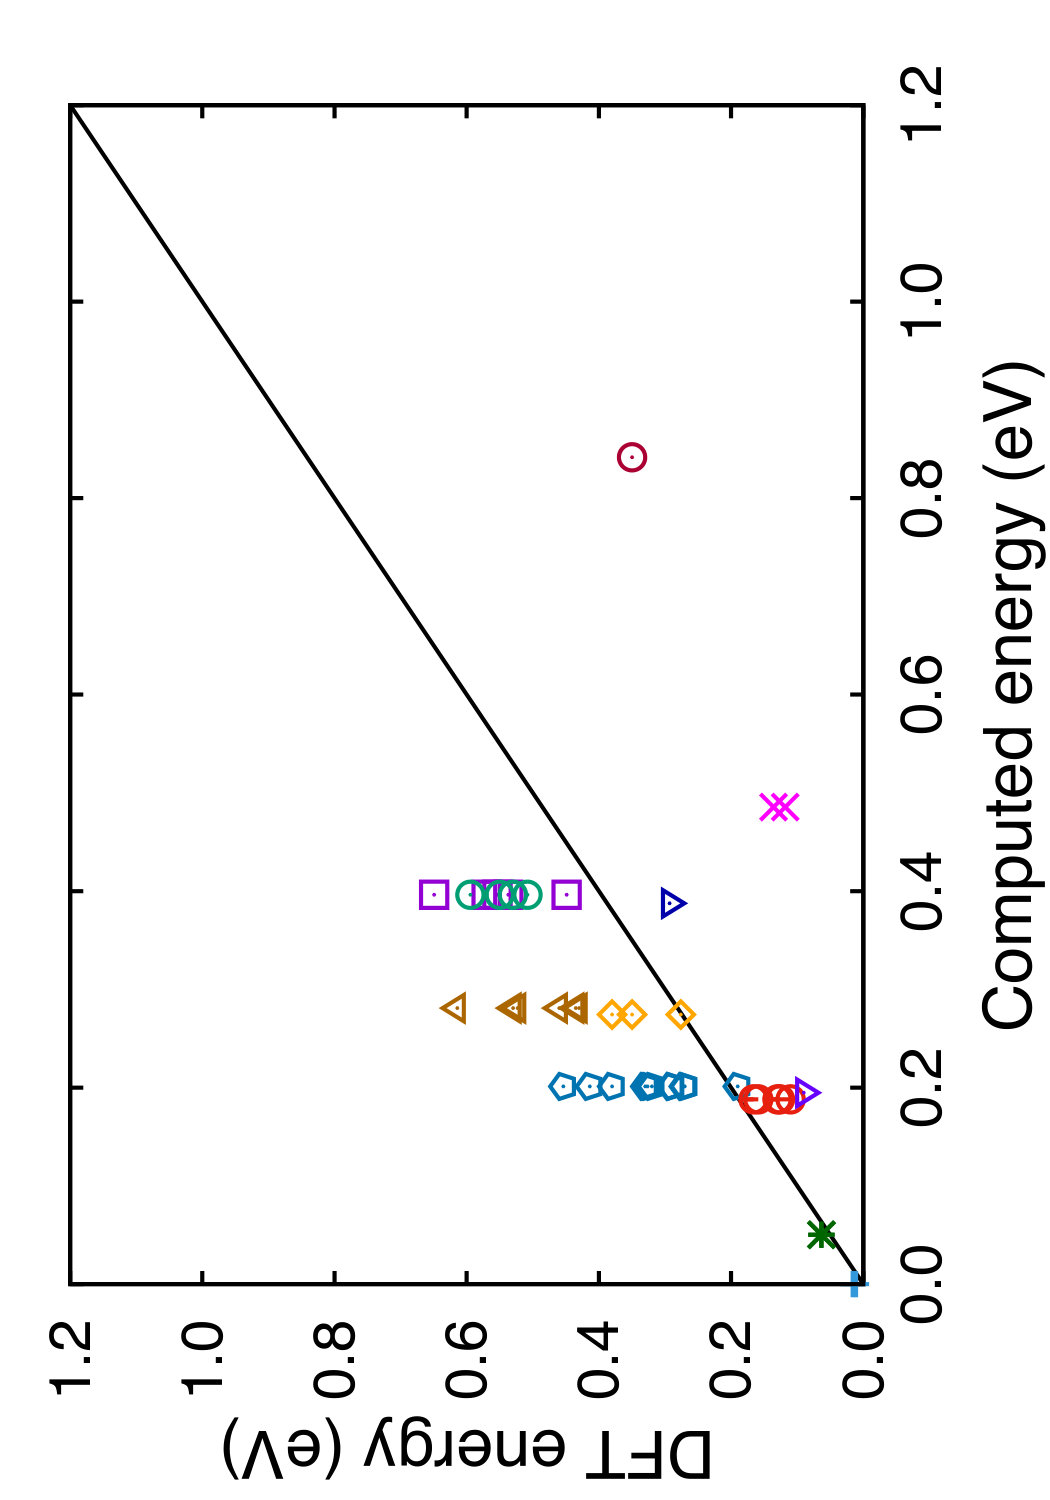 Figure 21
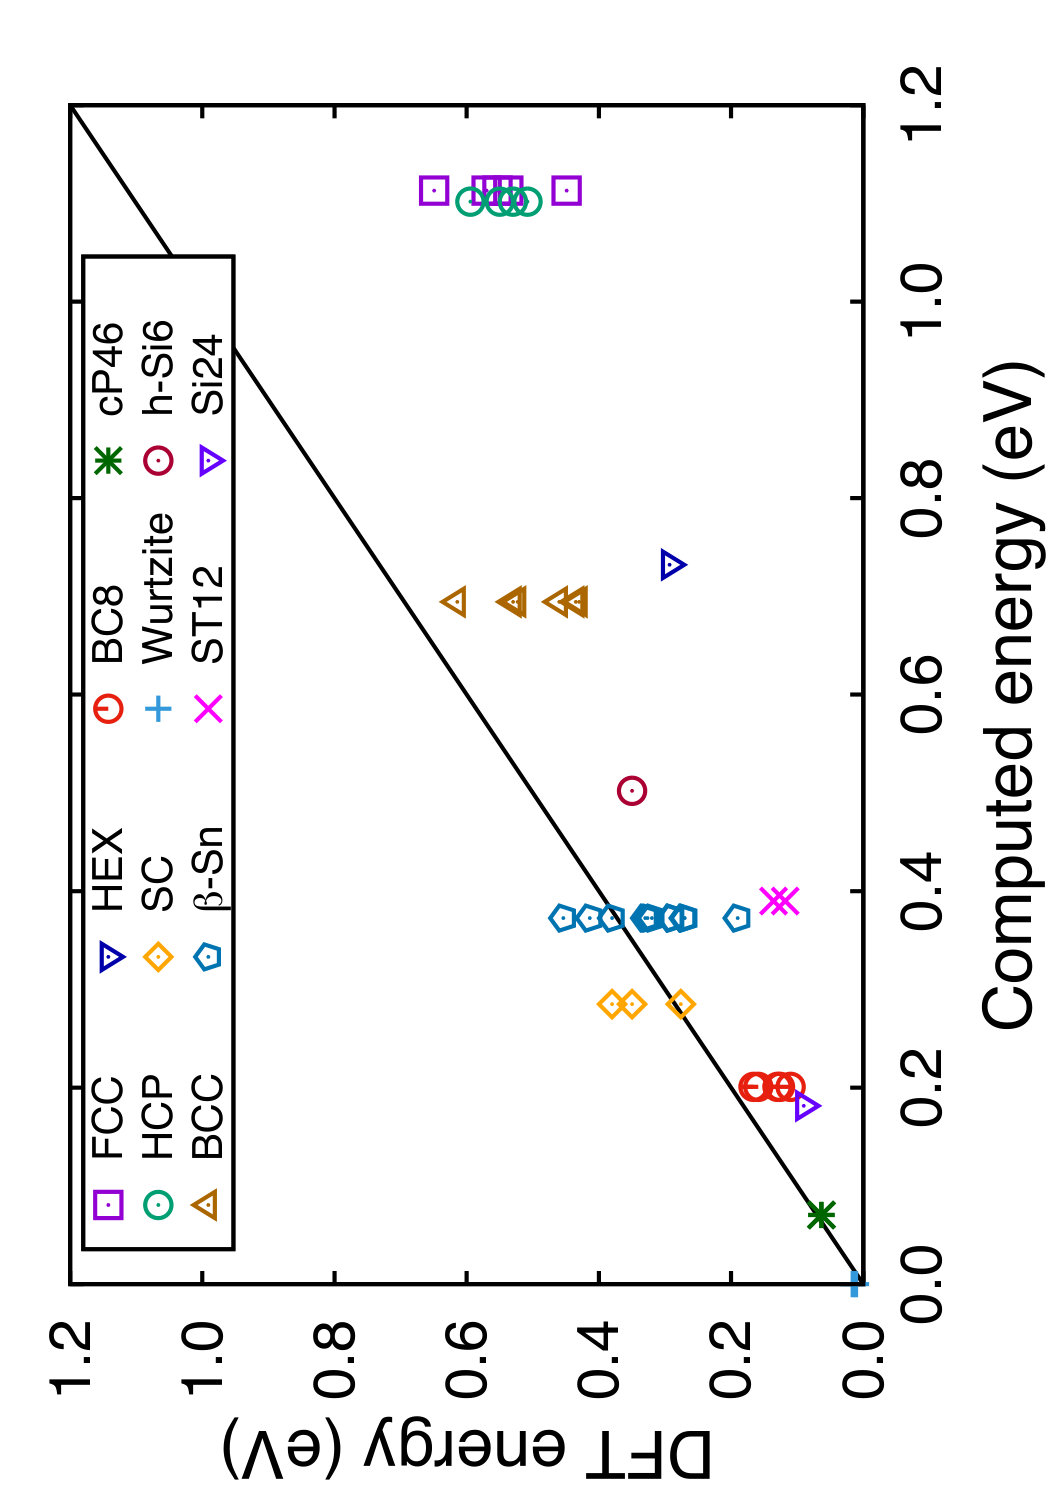 Figure 22
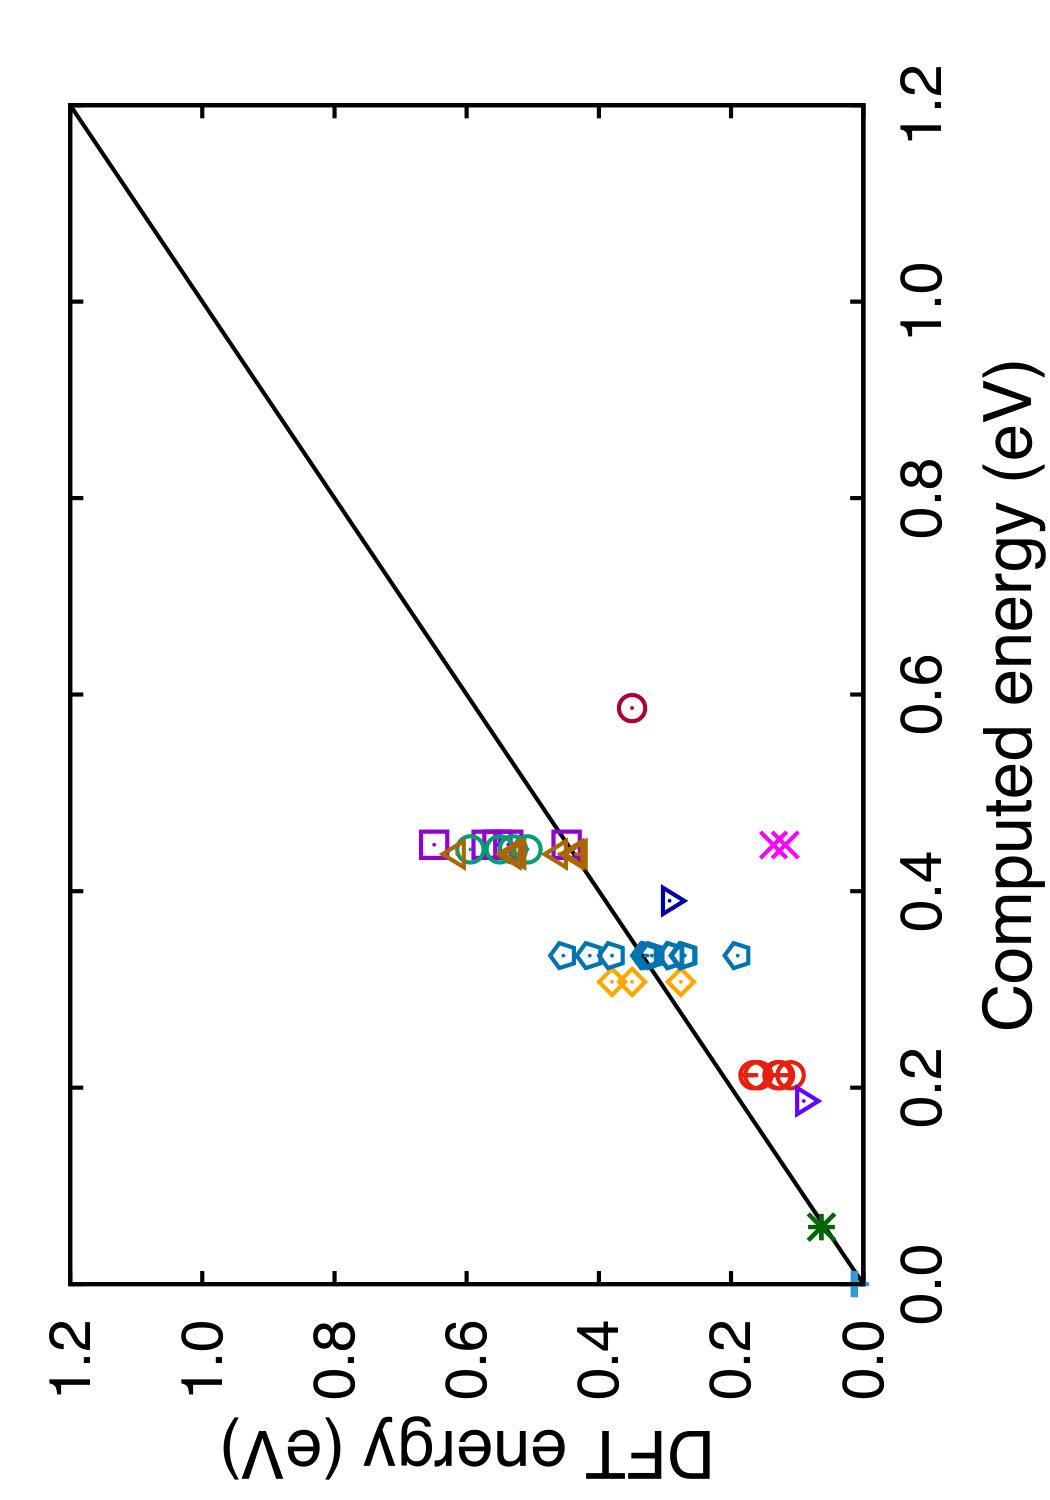 Figure 23
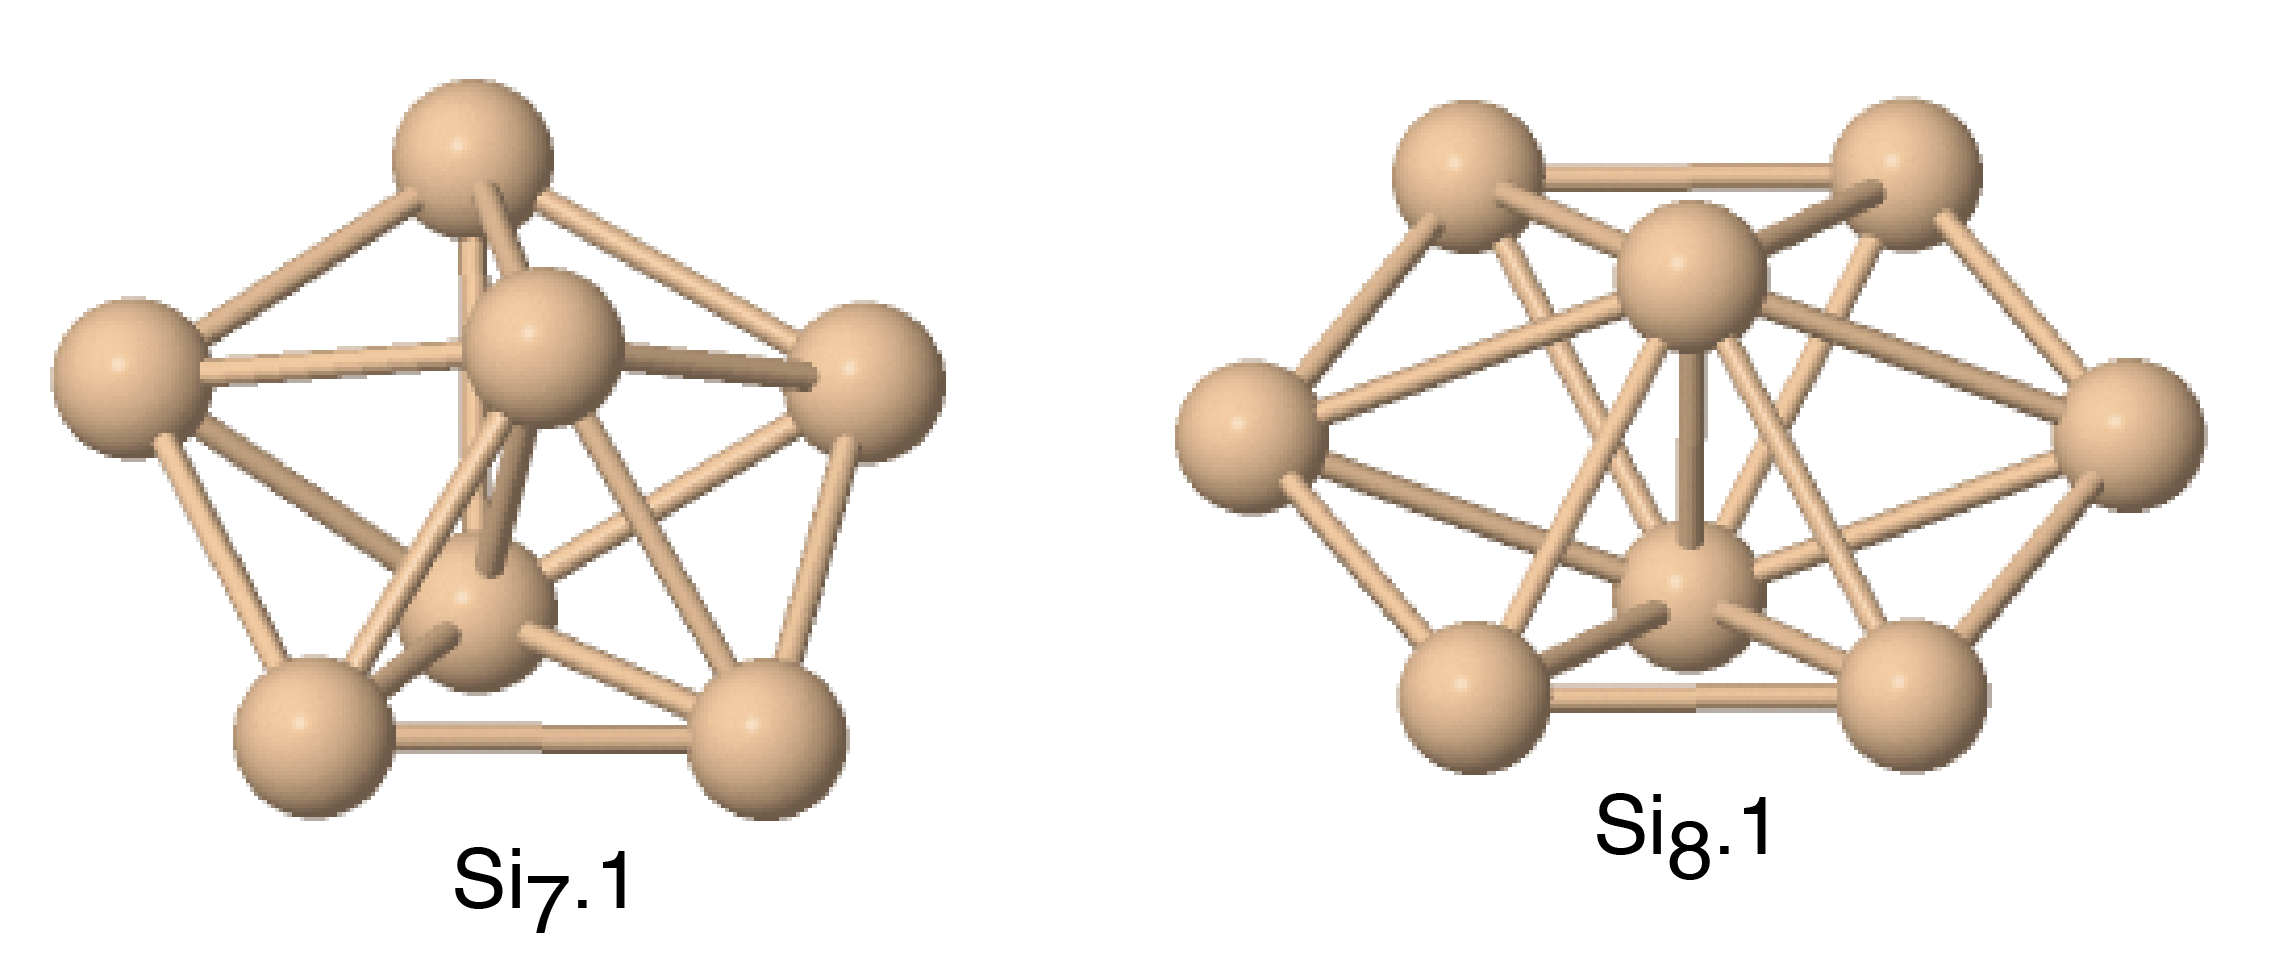 Figure 24
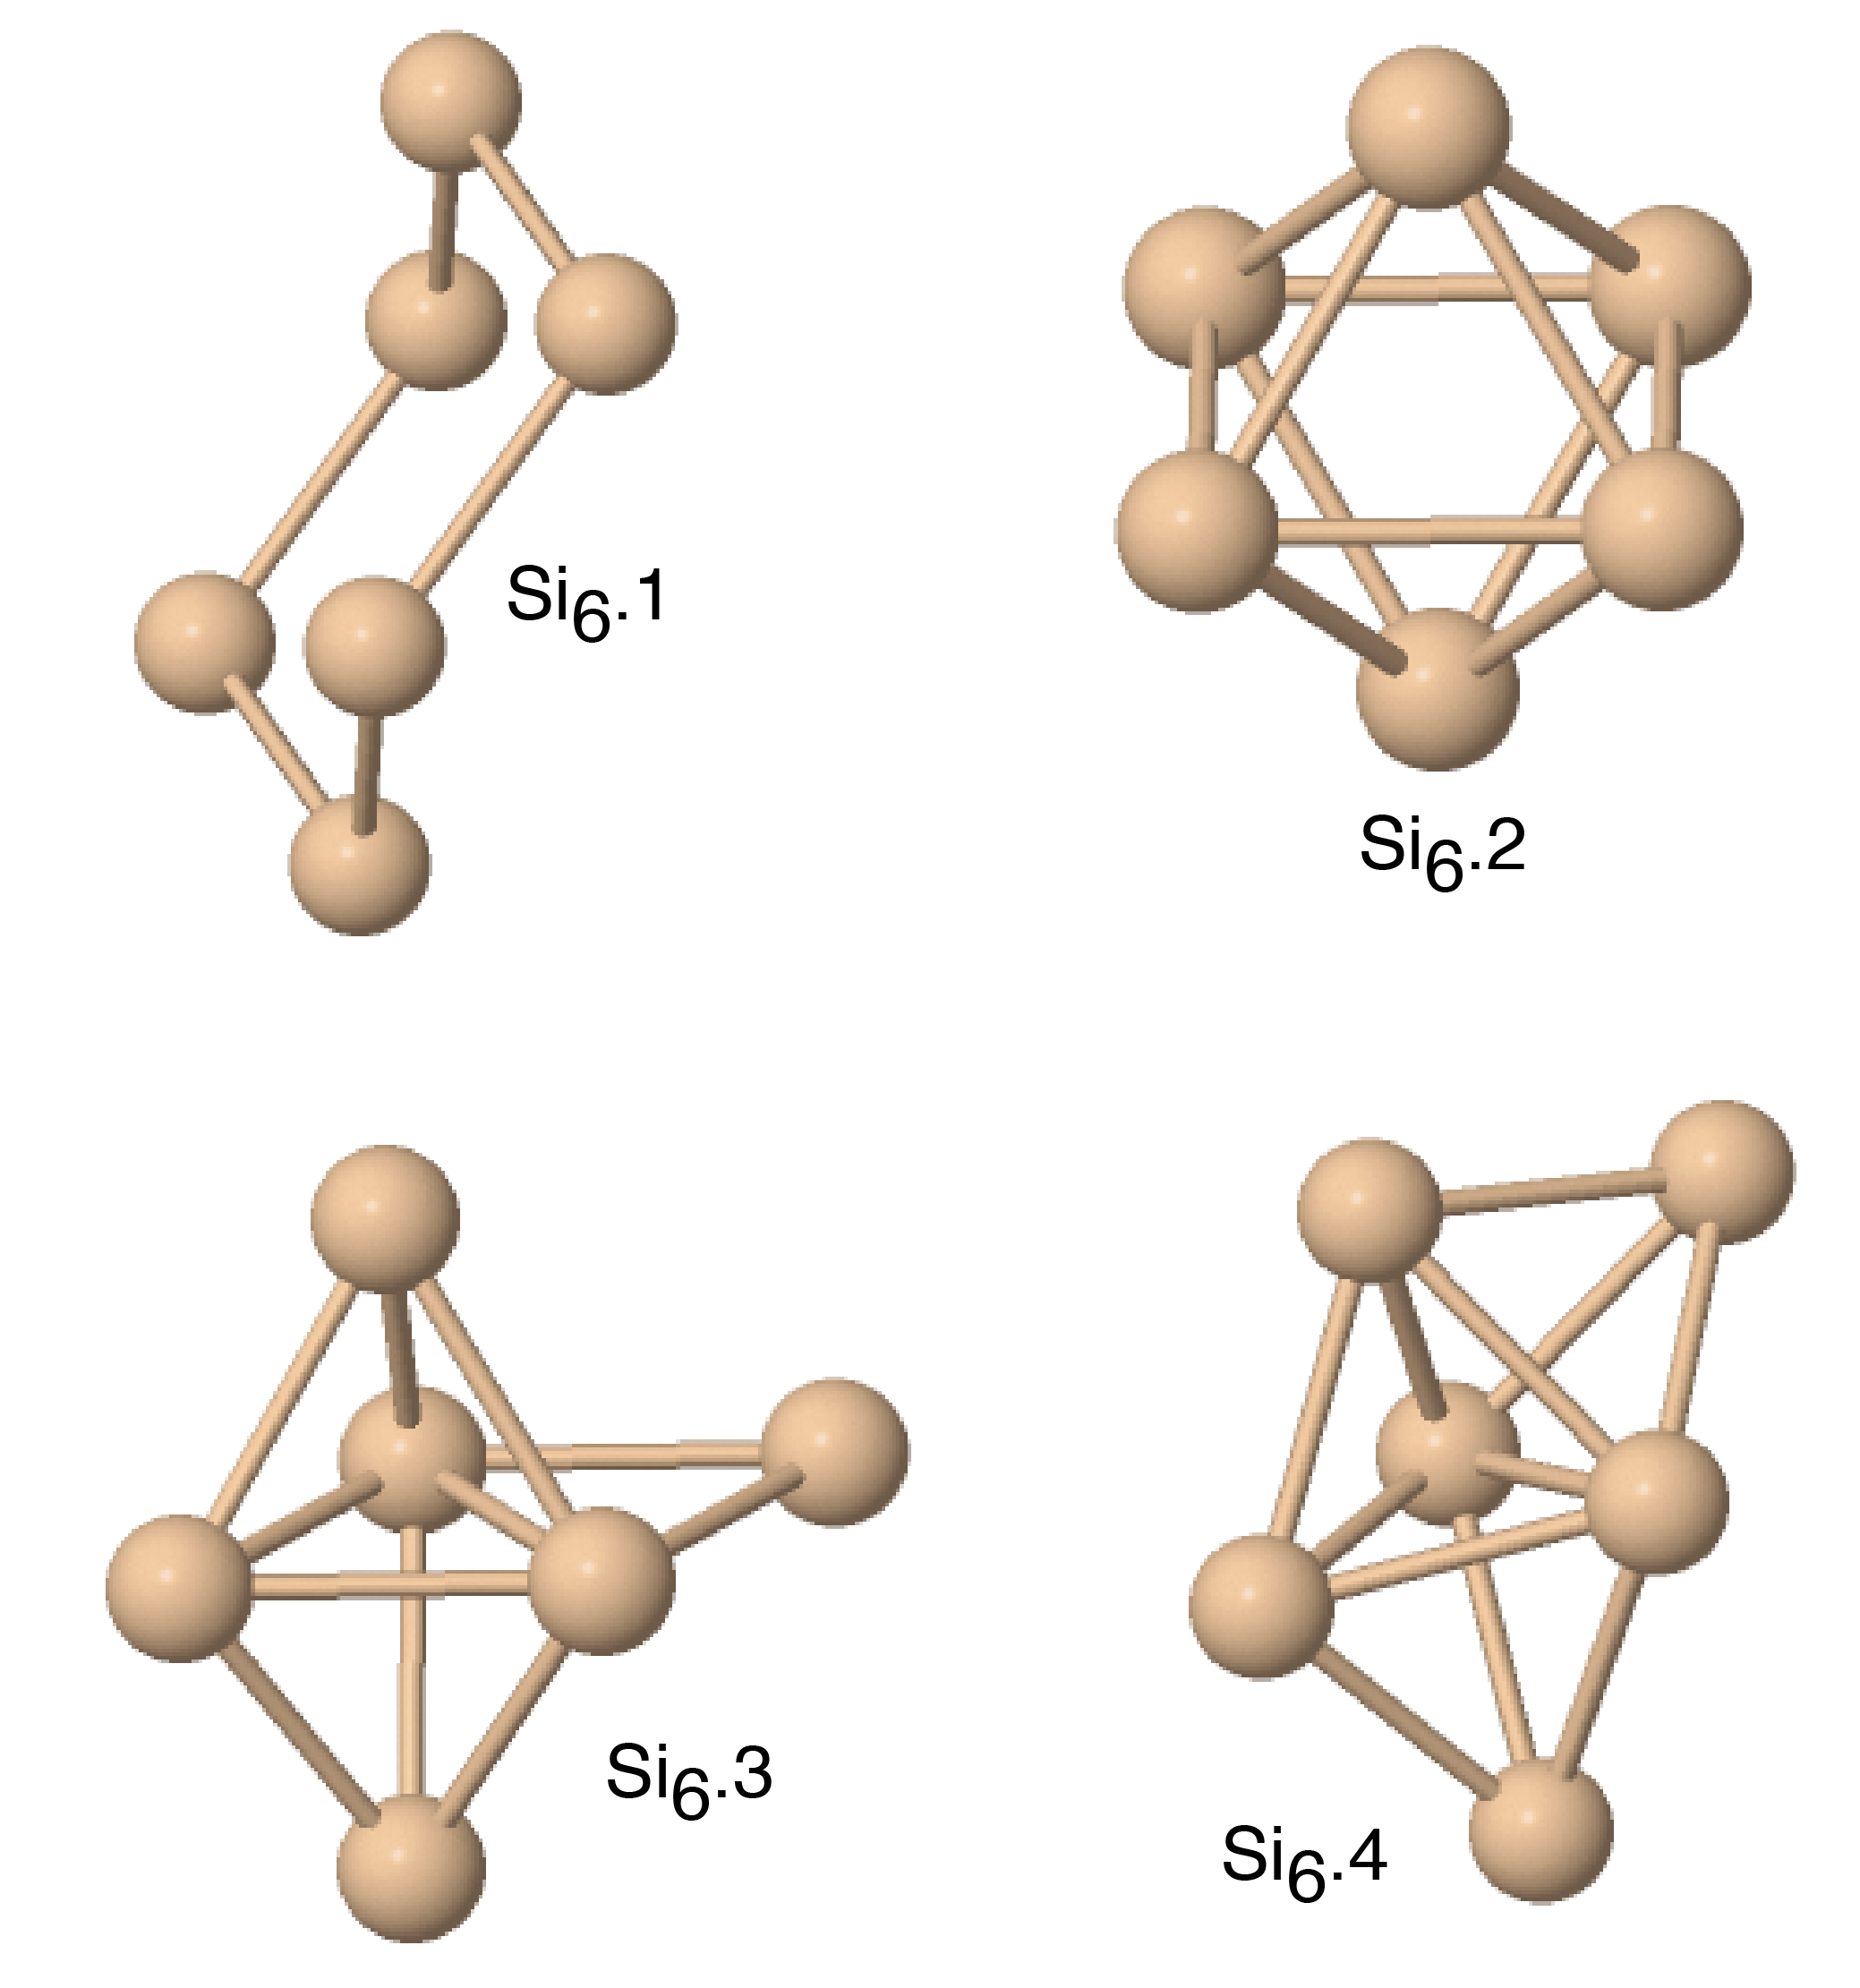 Figure 25
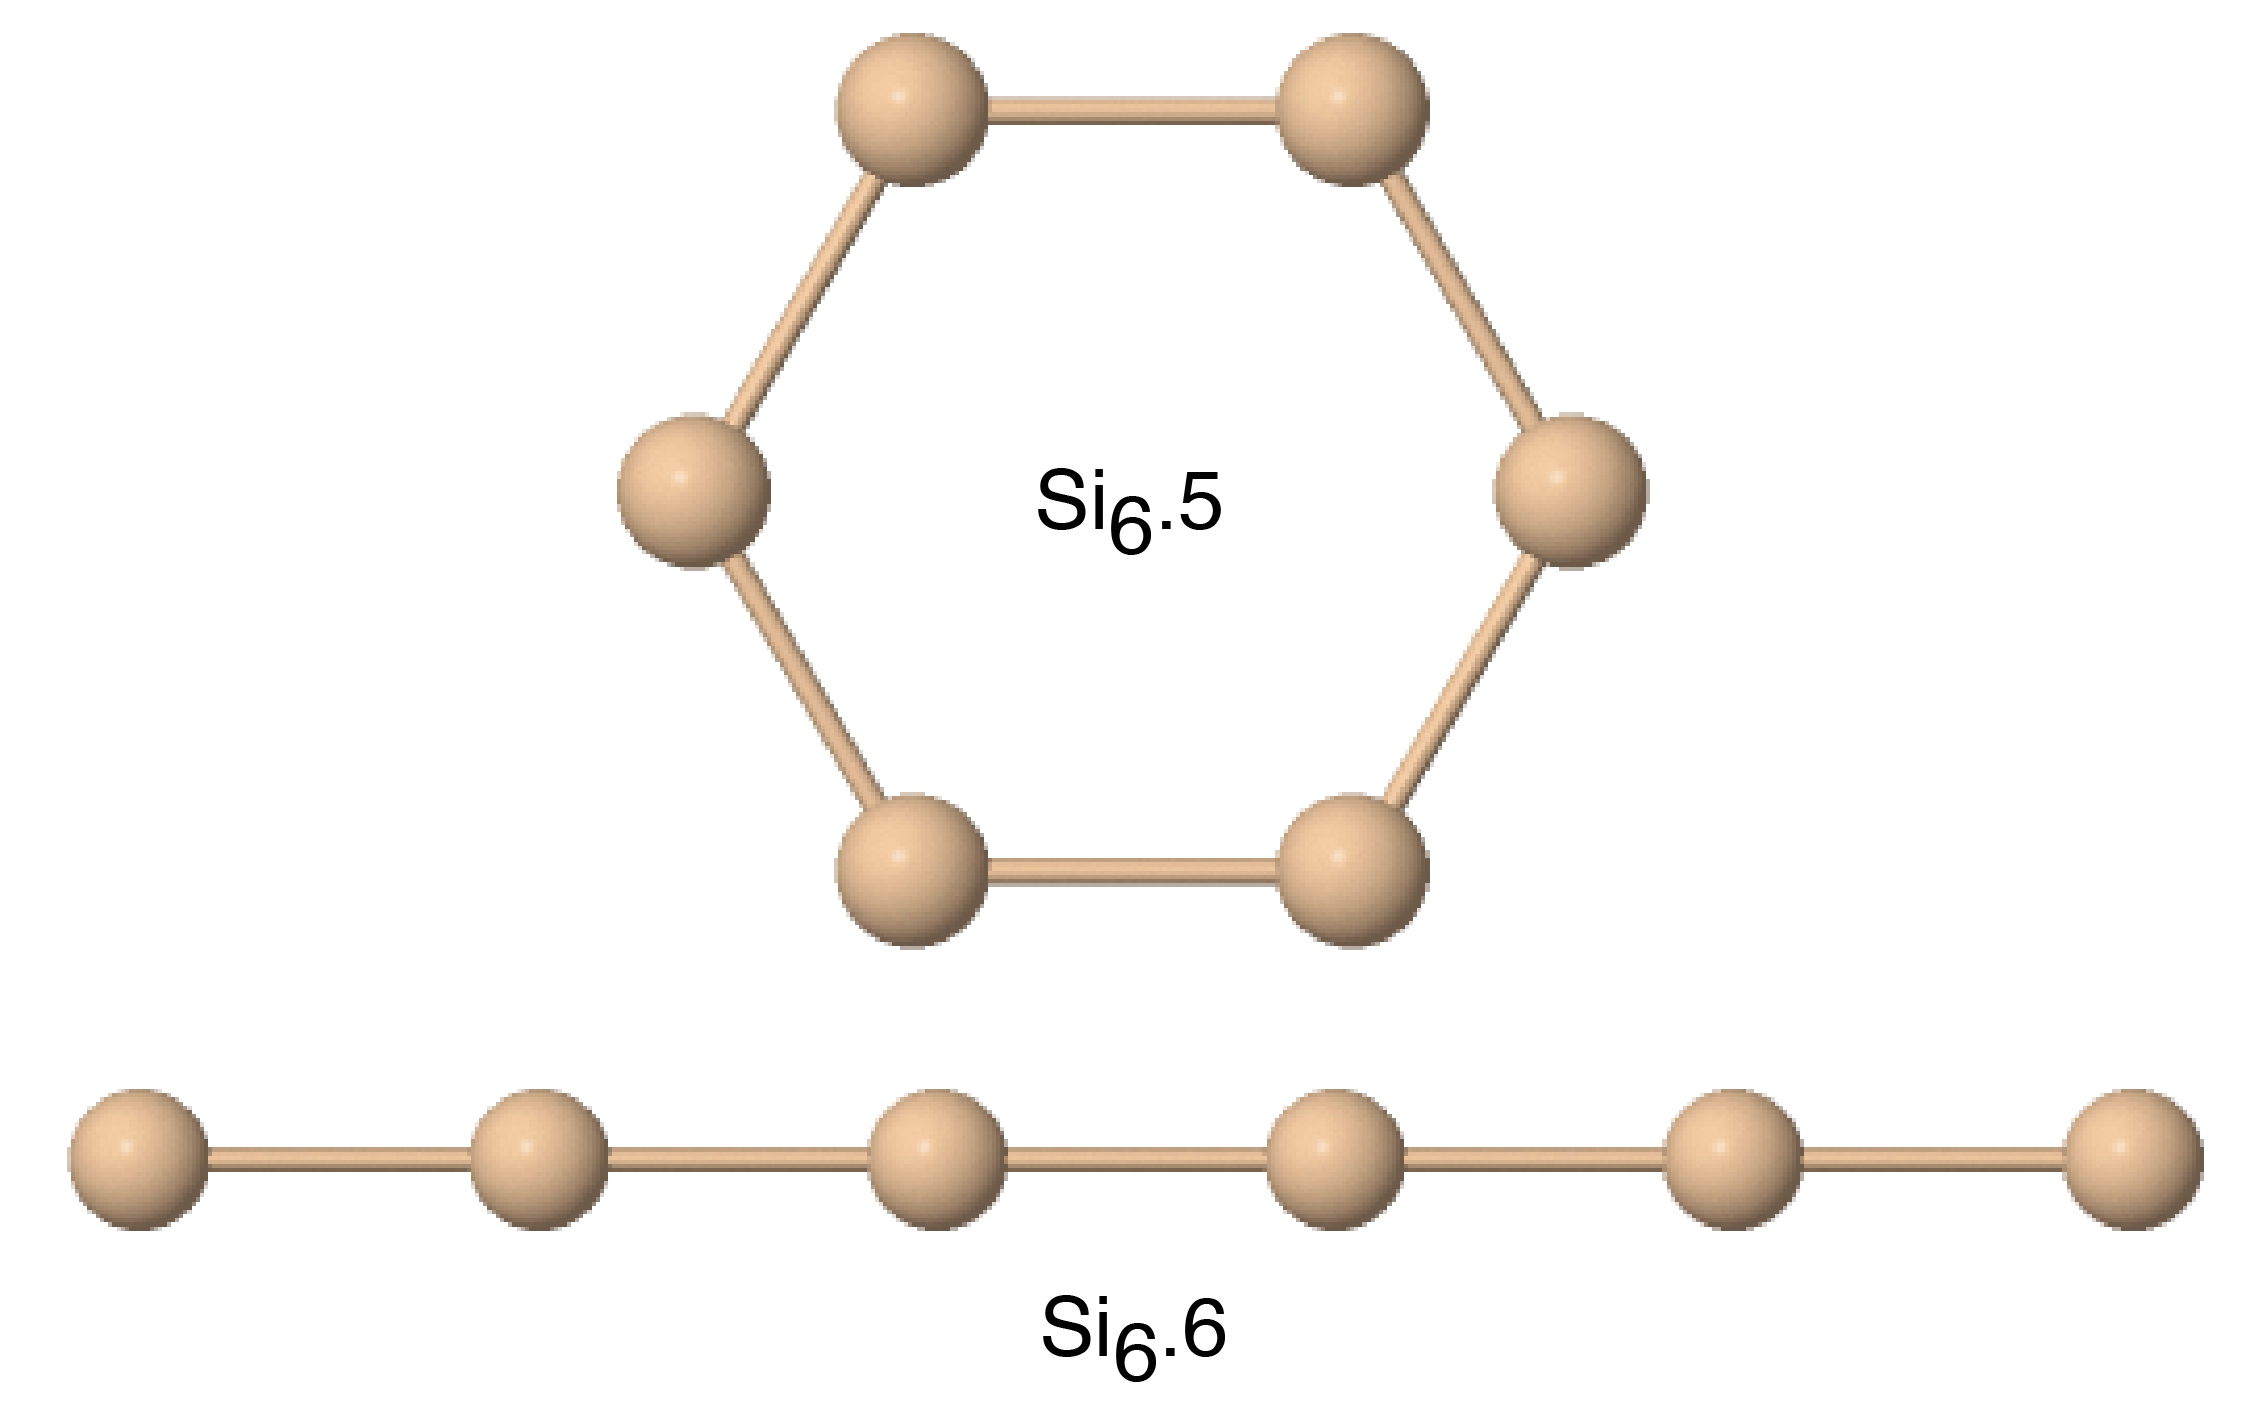 Figure 26
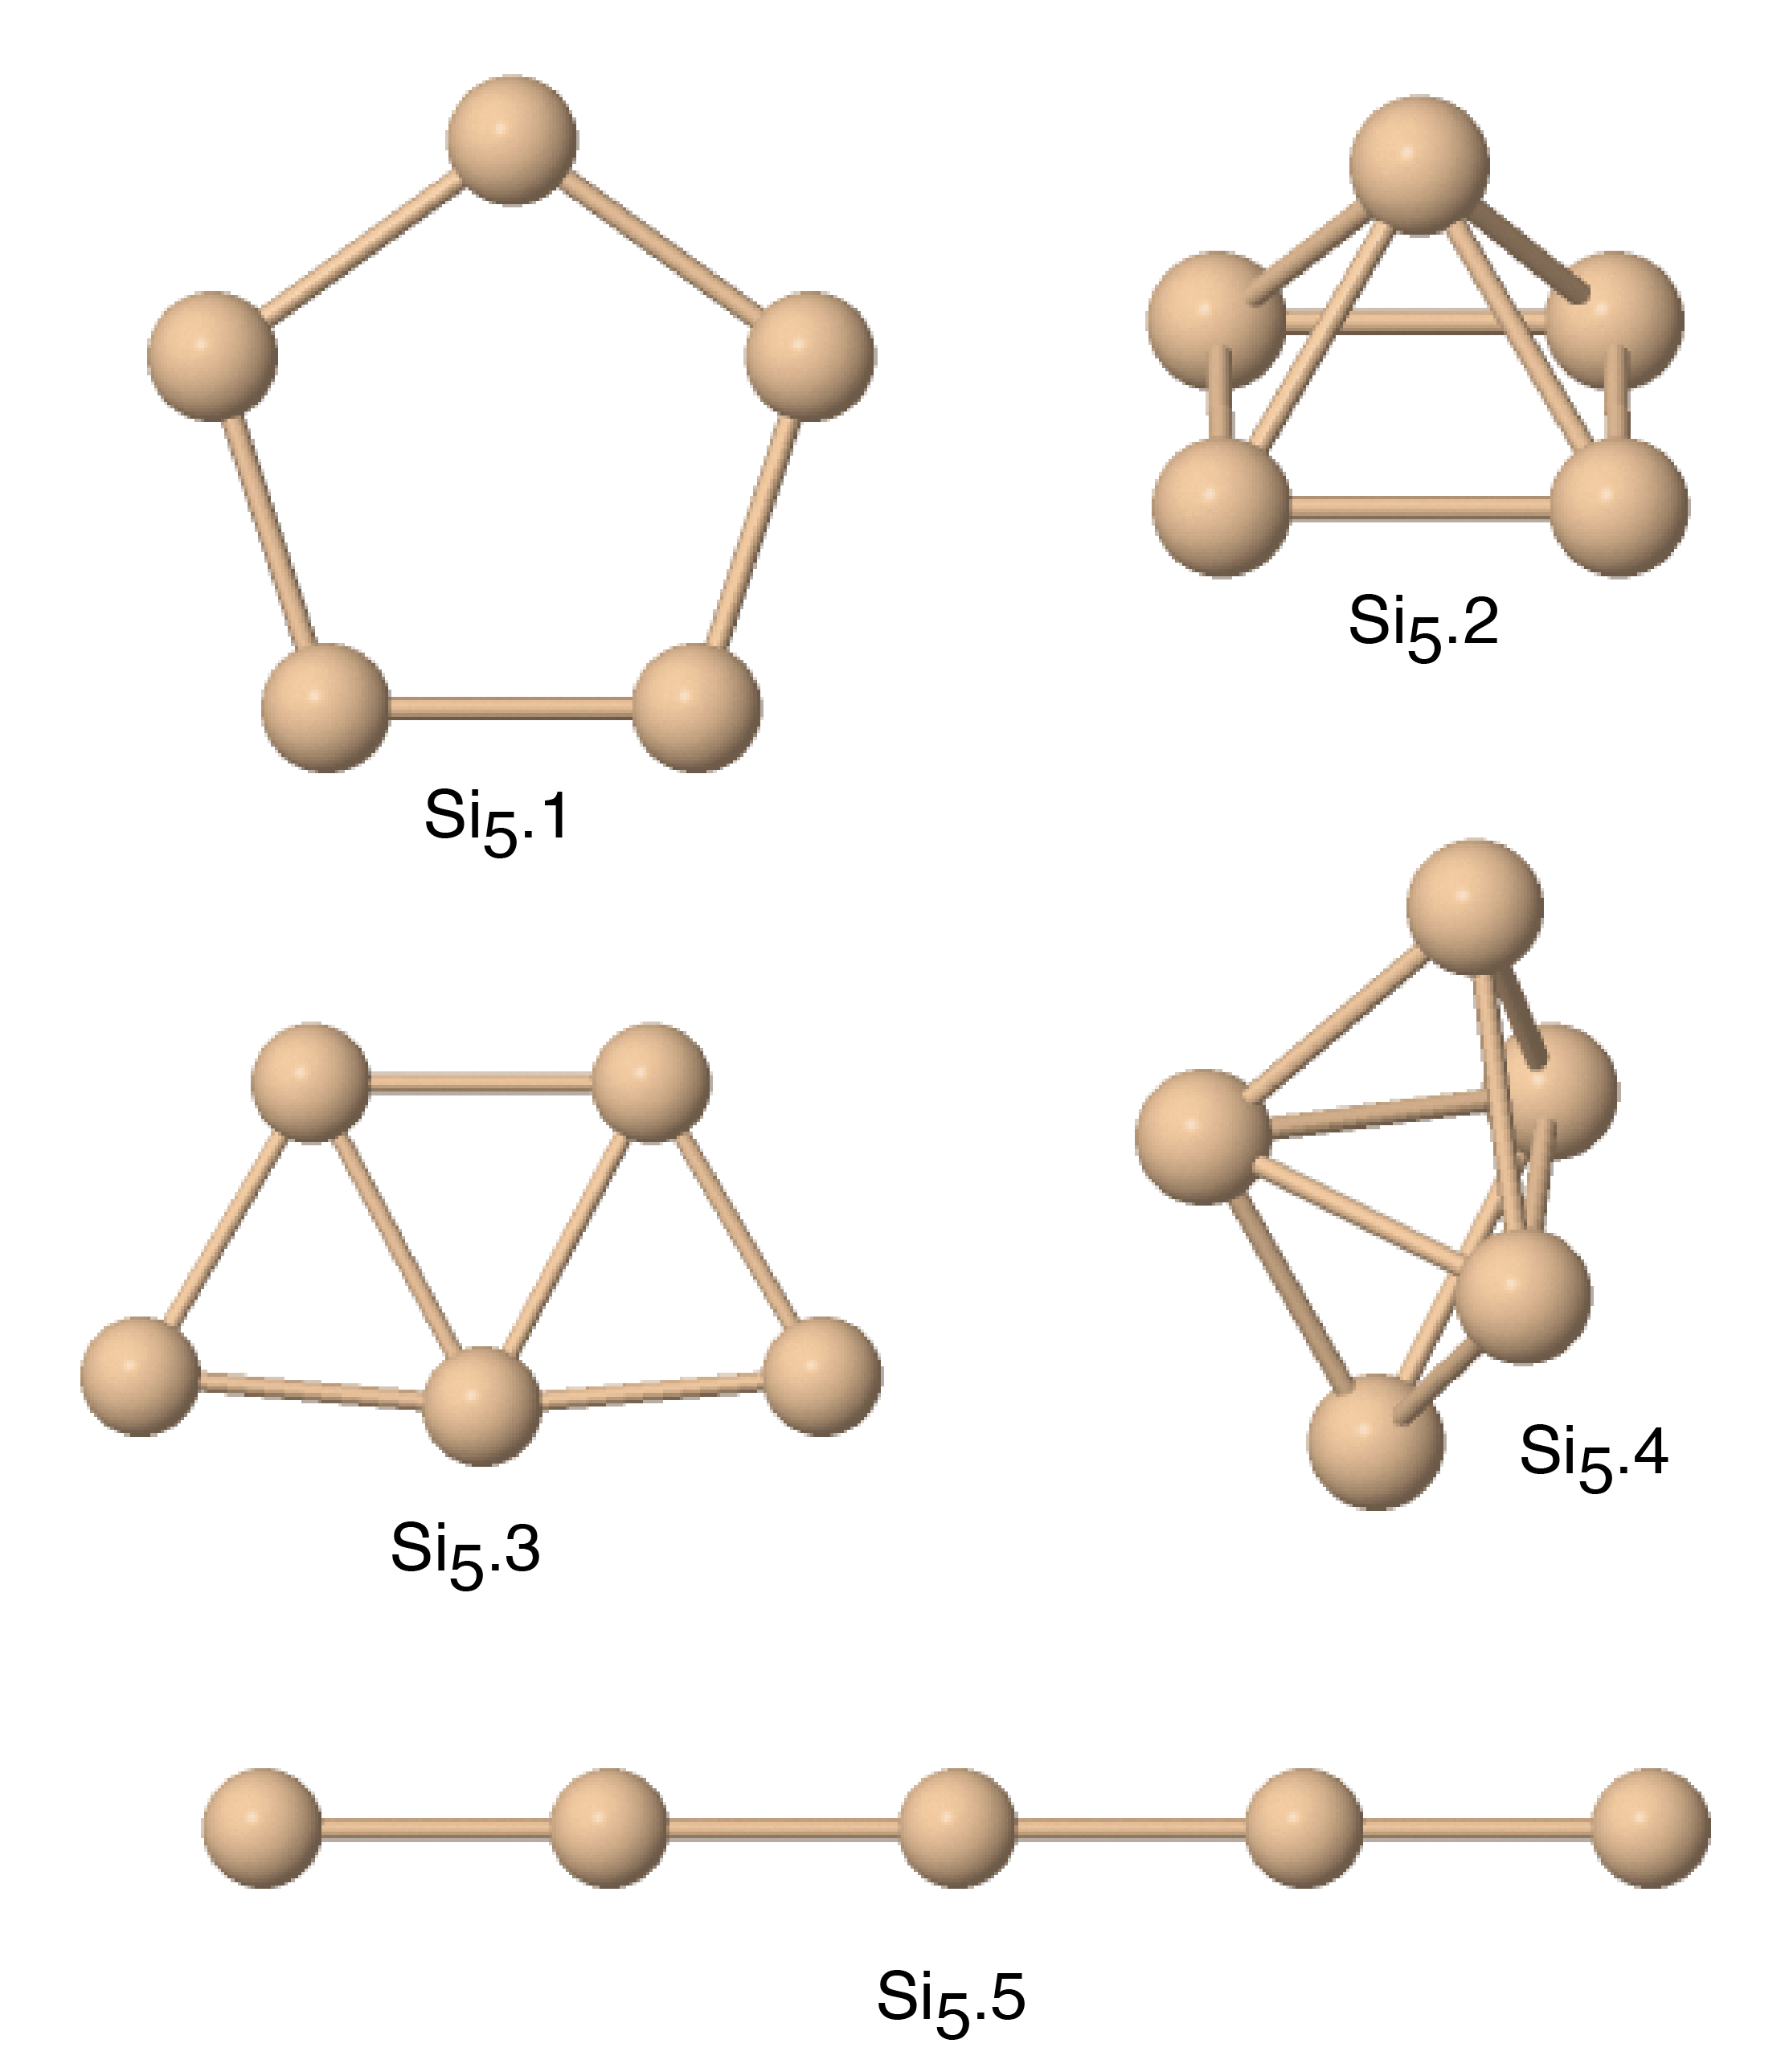 Figure 27
 Figure 28
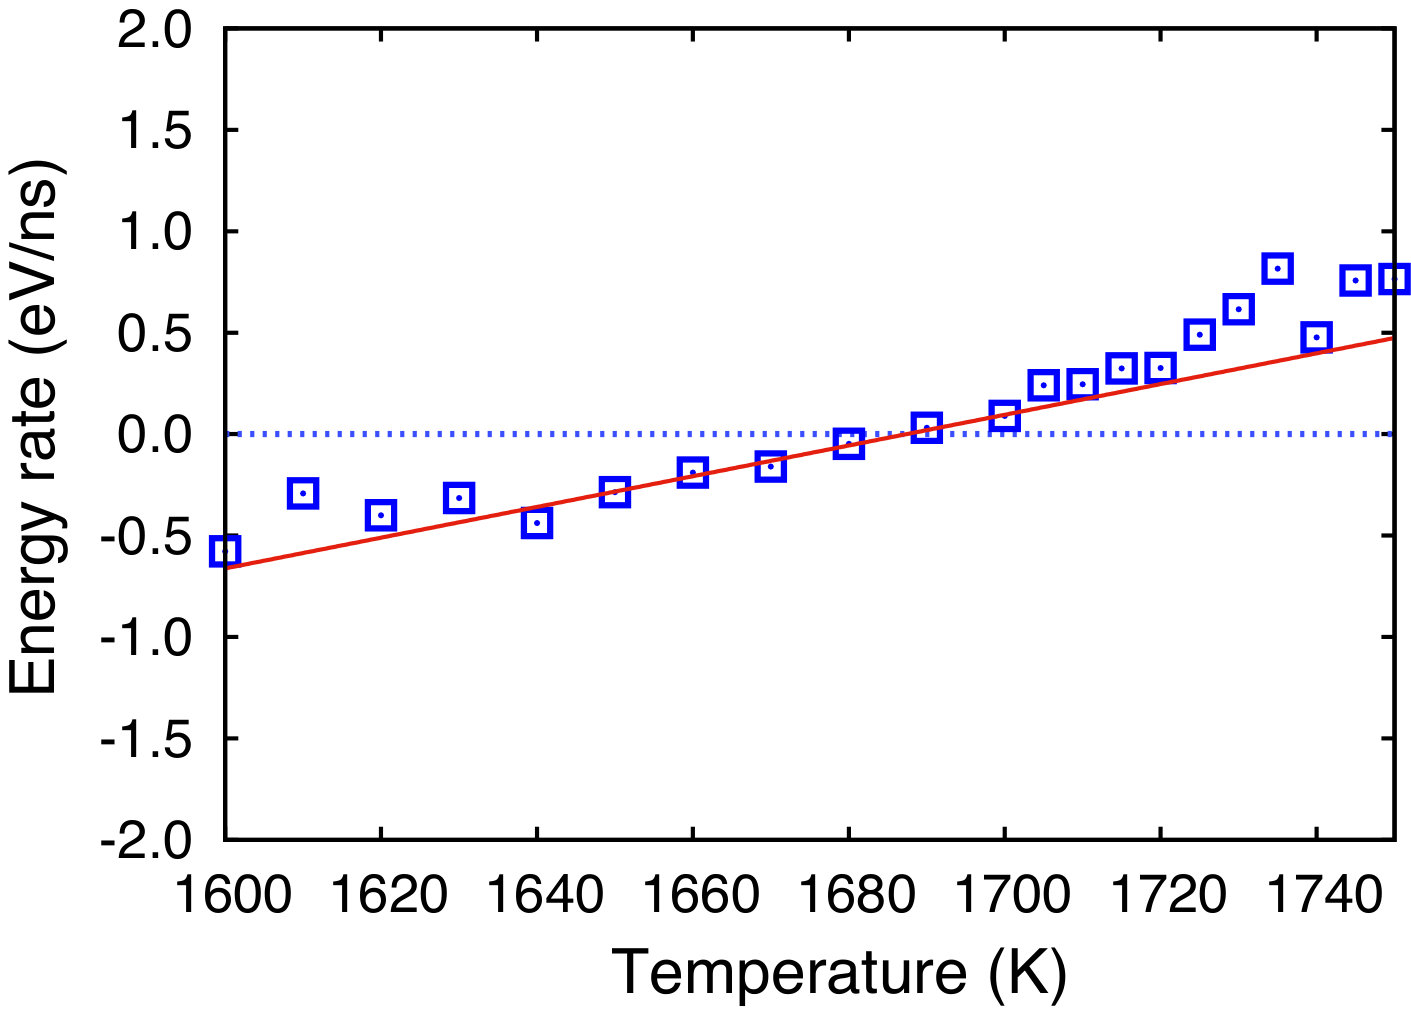 Figure 29
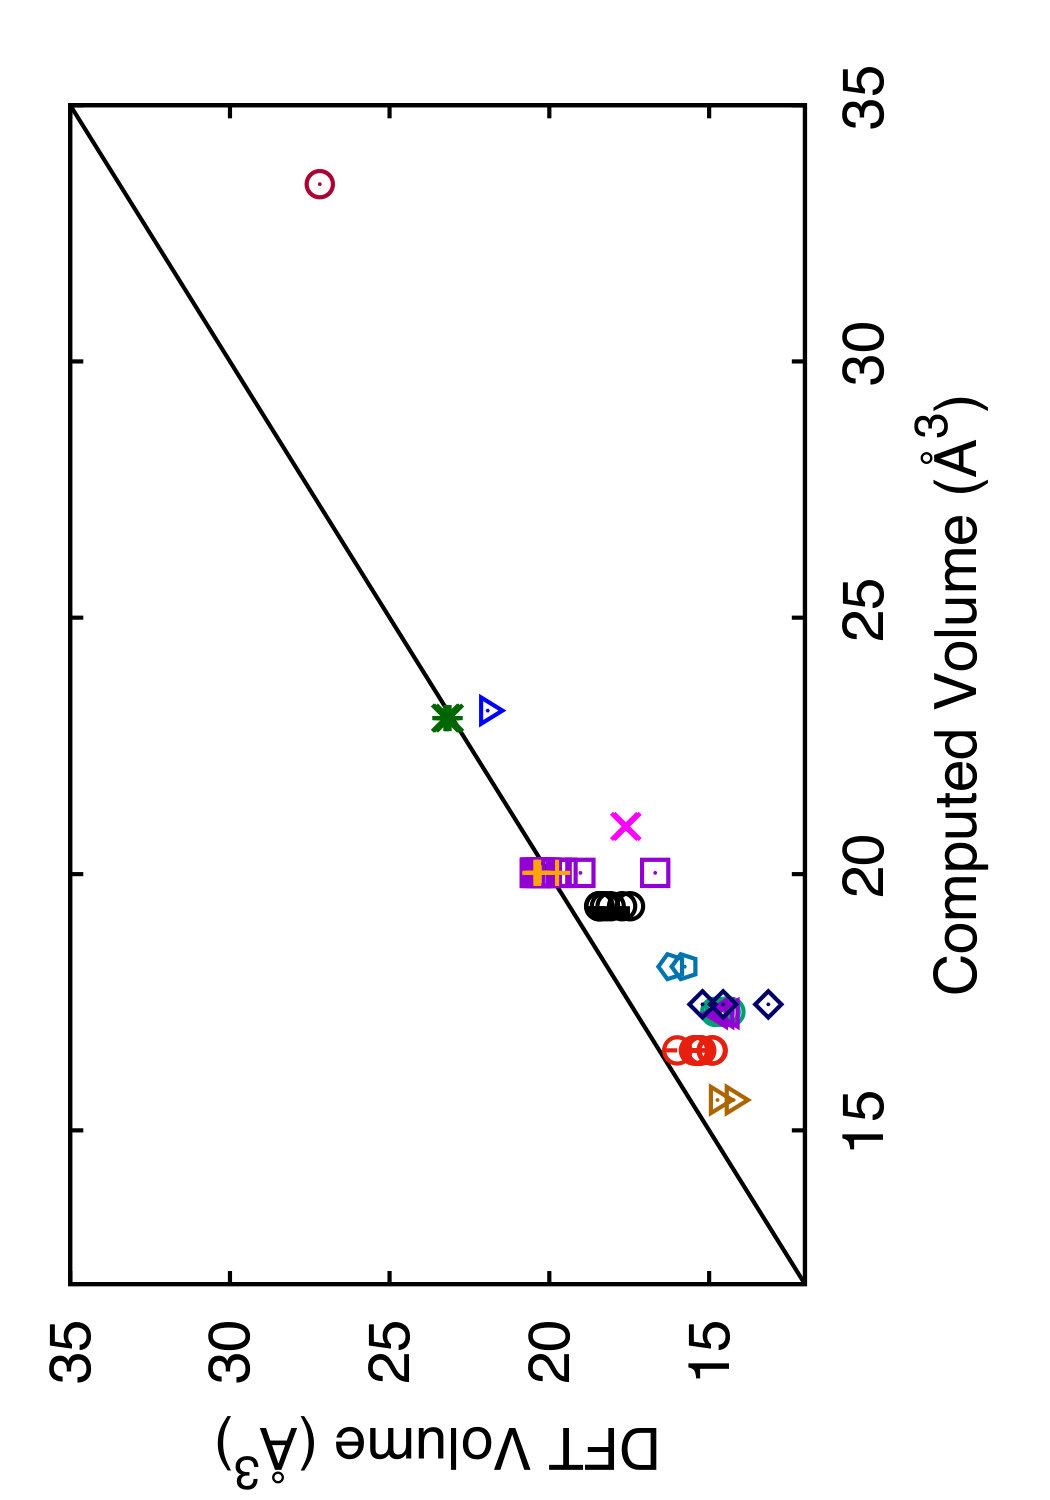 Figure 30
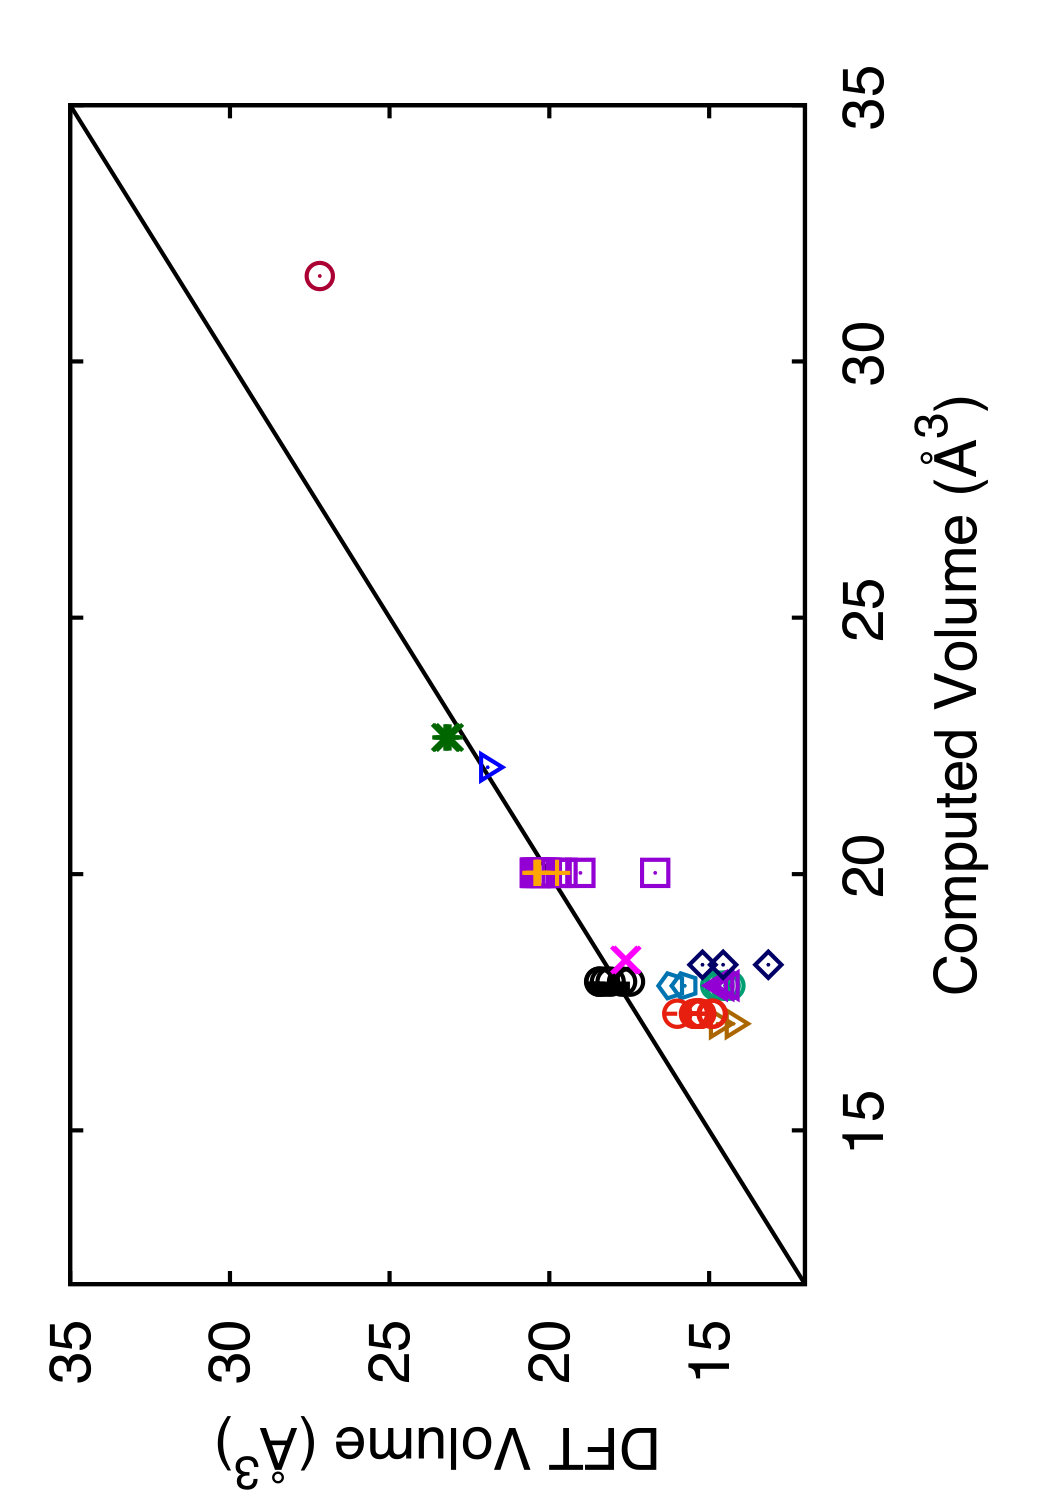 Figure 31
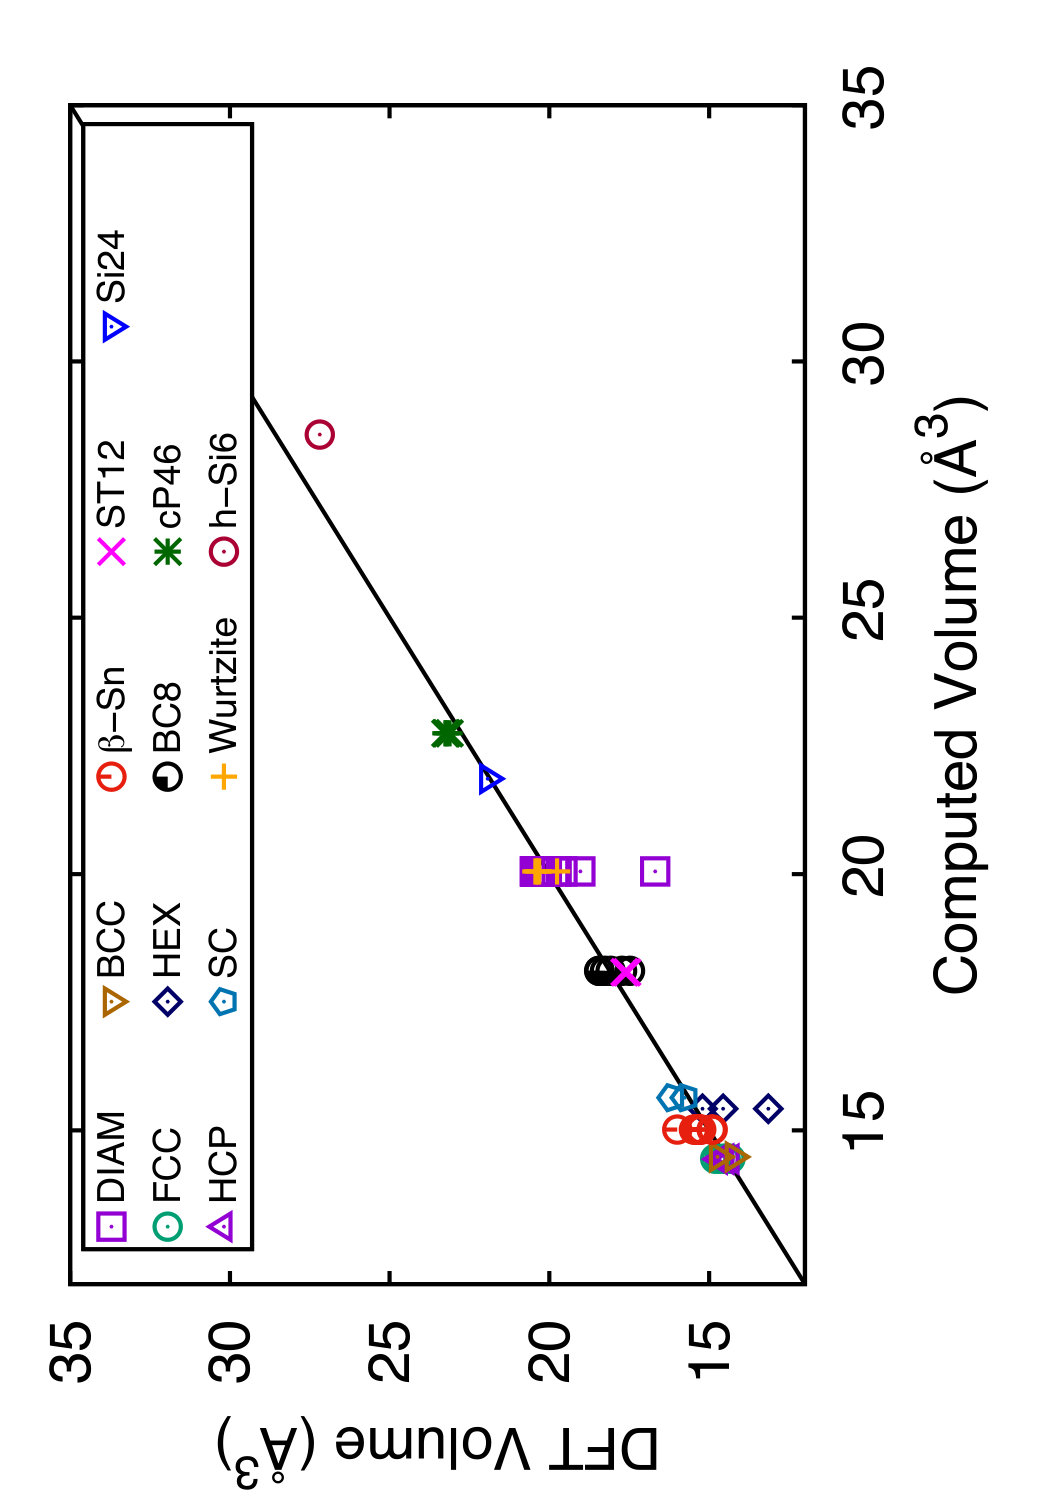 Figure 32
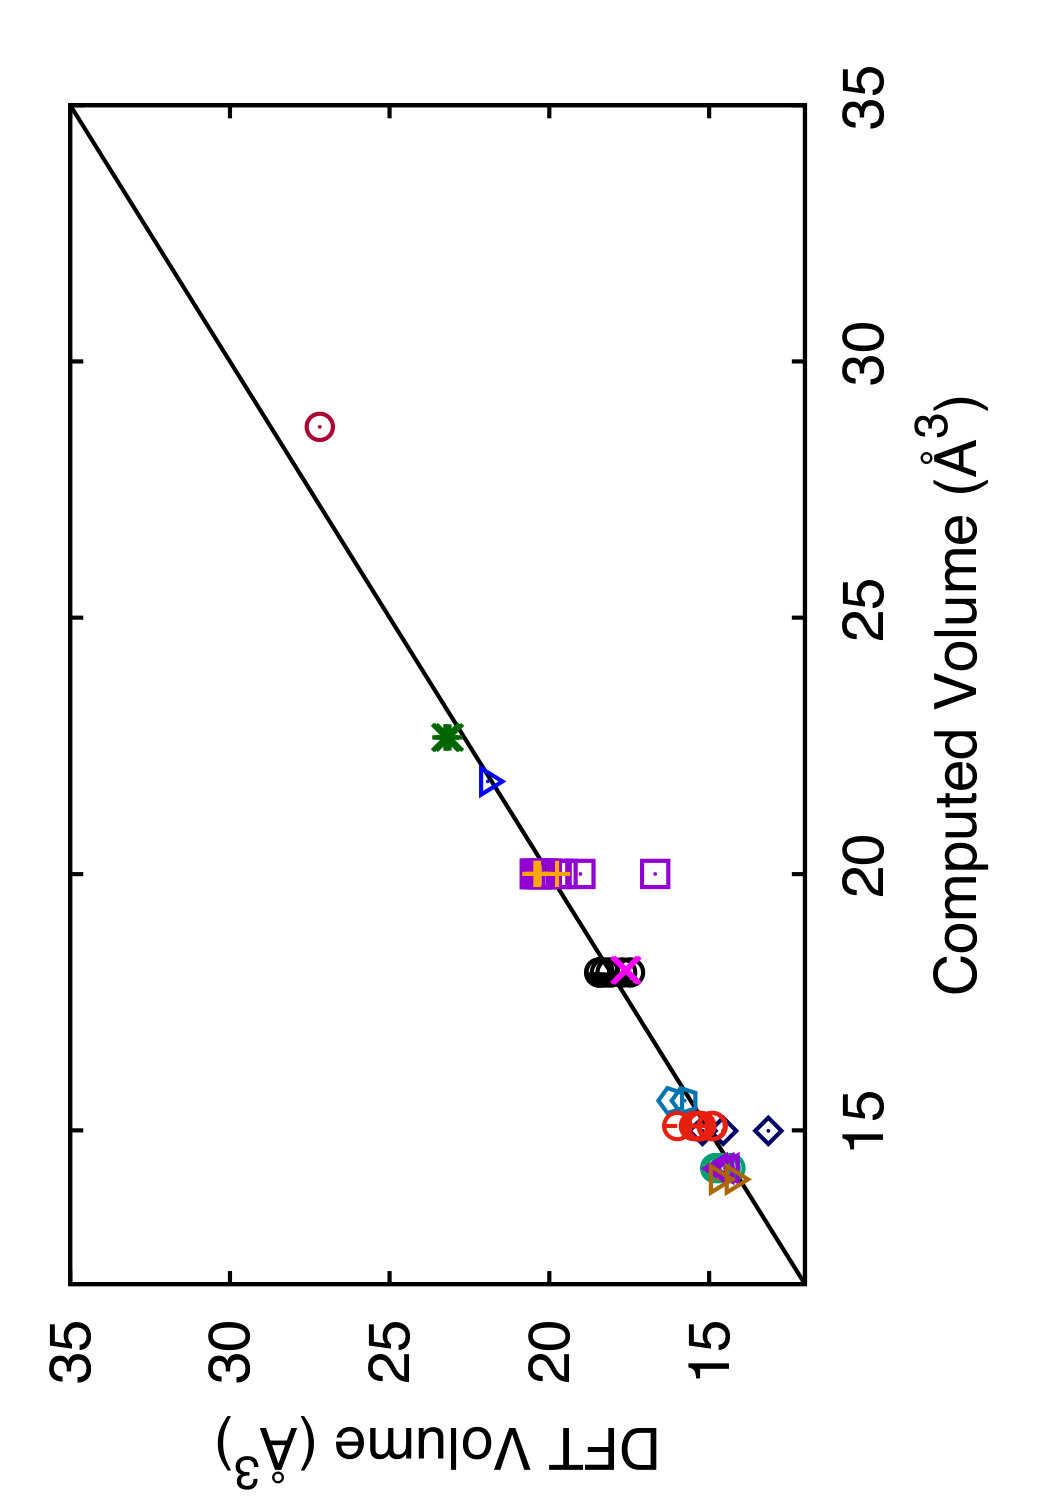 Figure 33
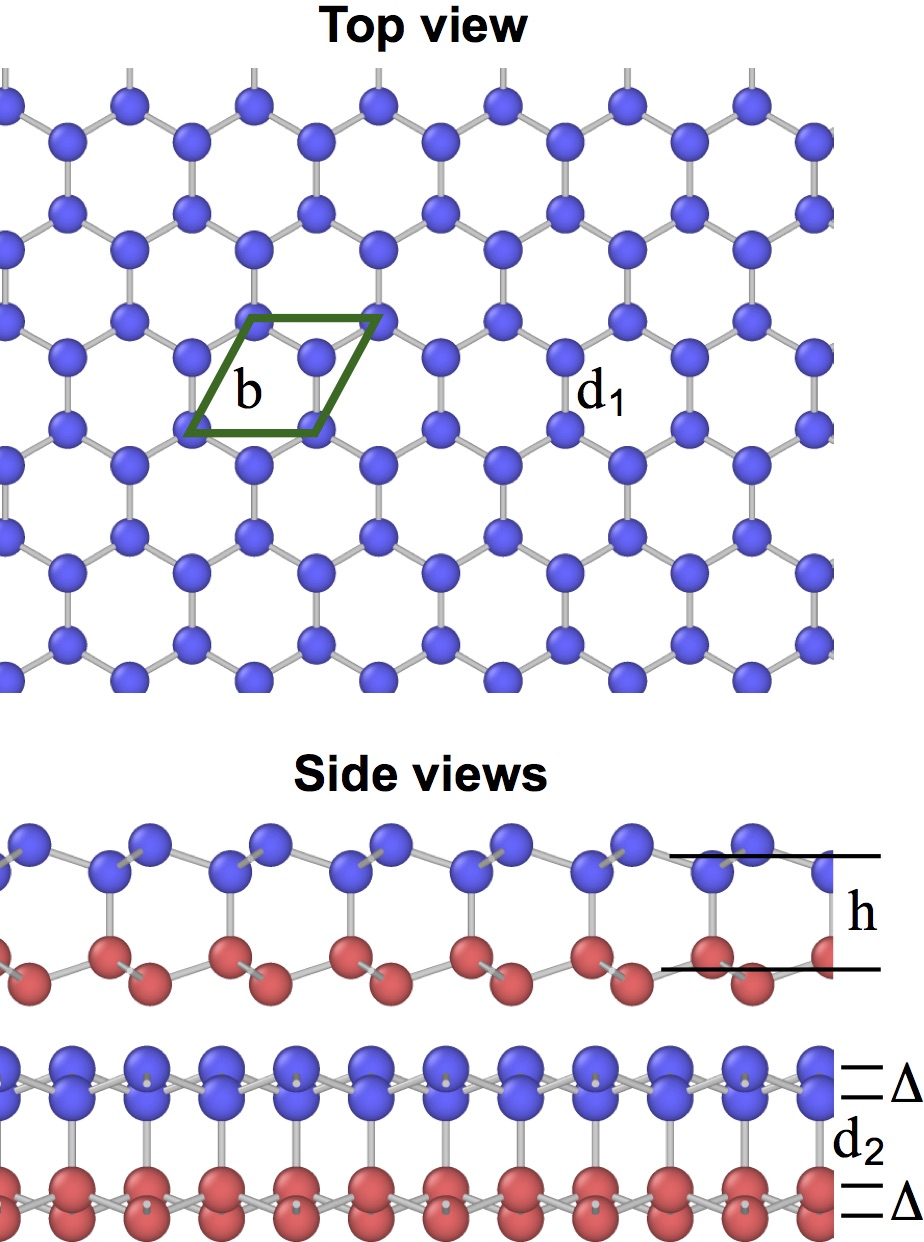 Figure 34
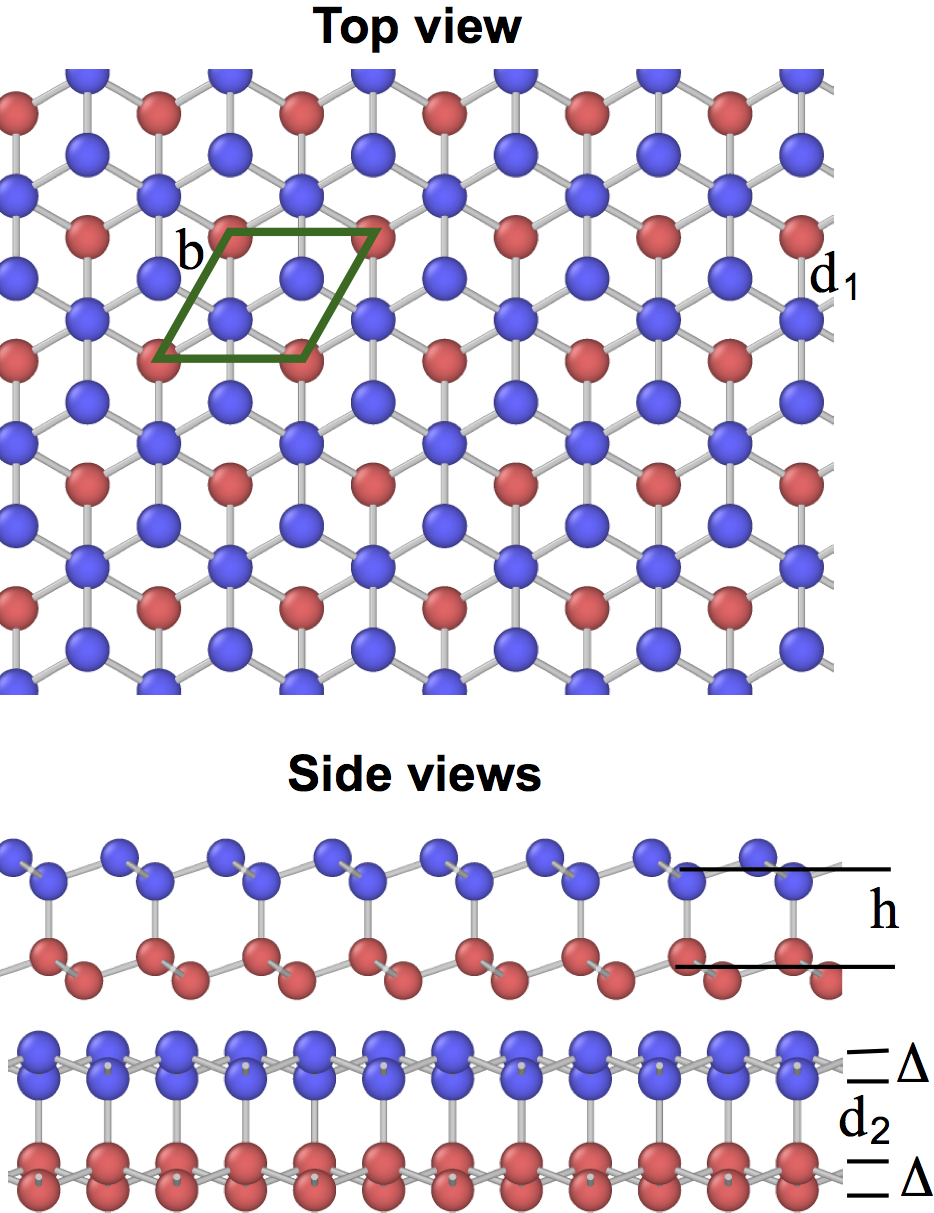 Figure 35
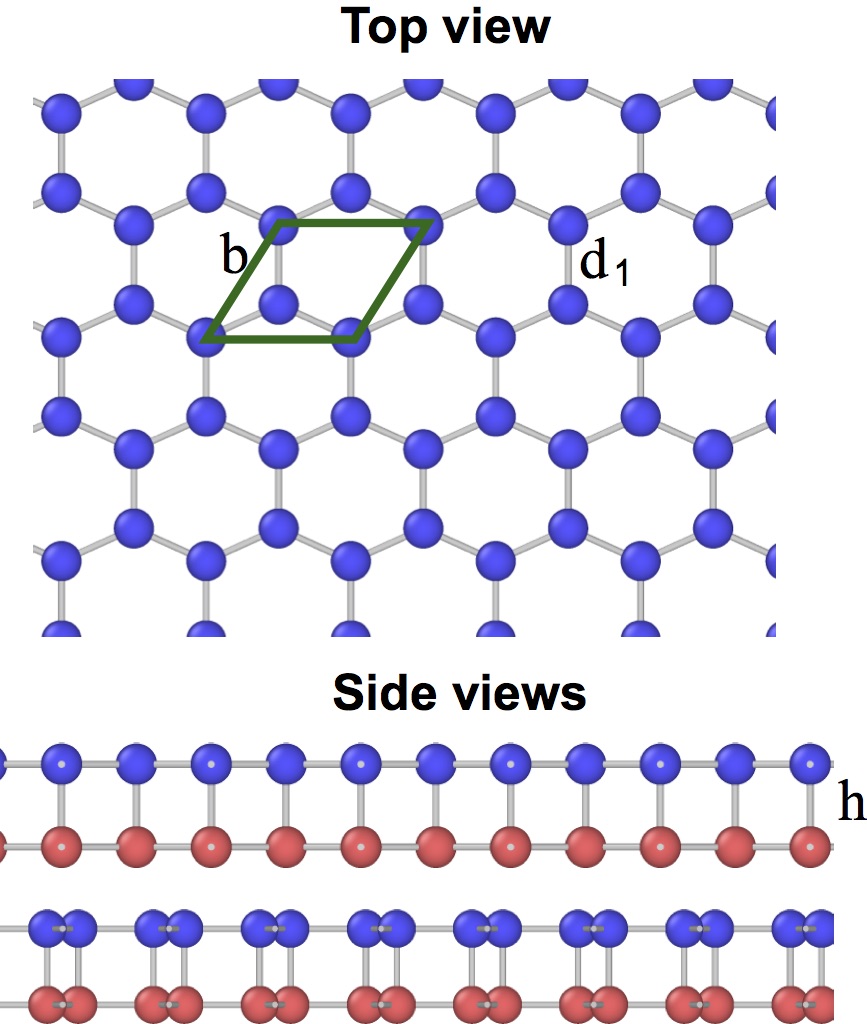 Figure 36
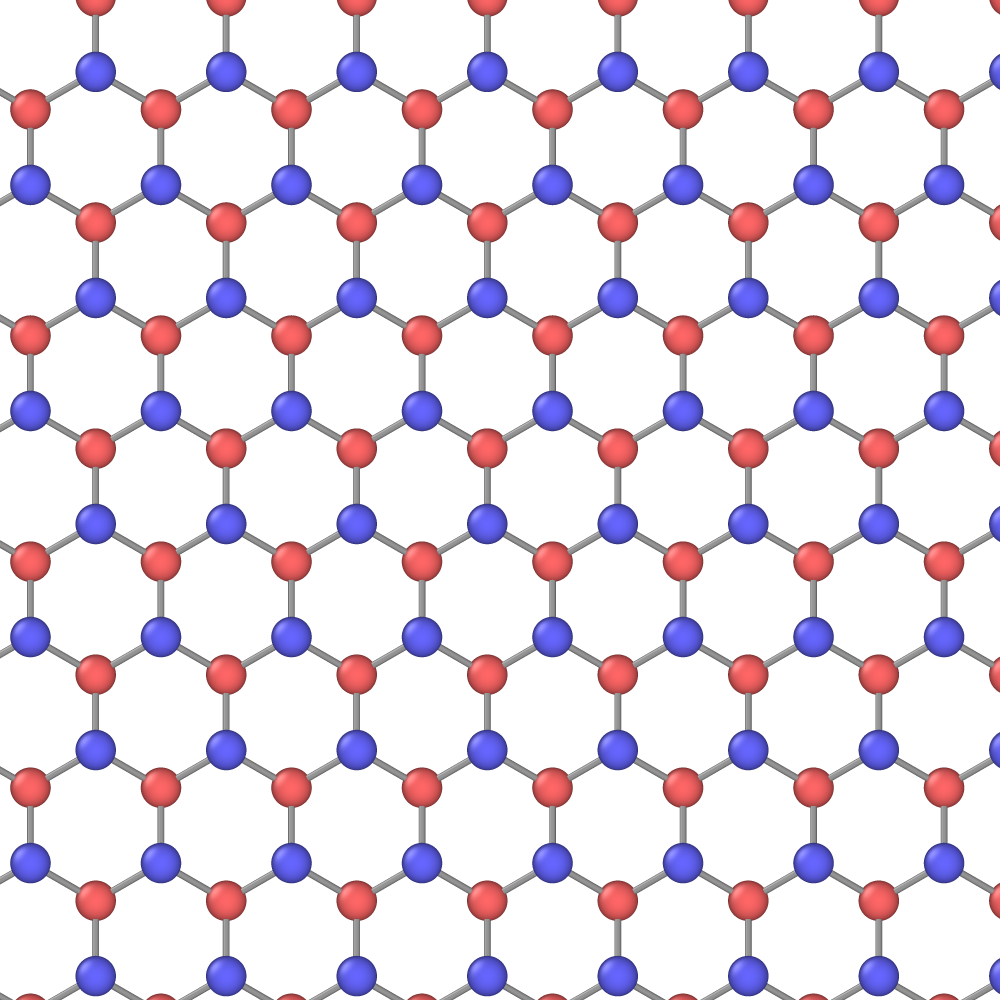 Figure 37
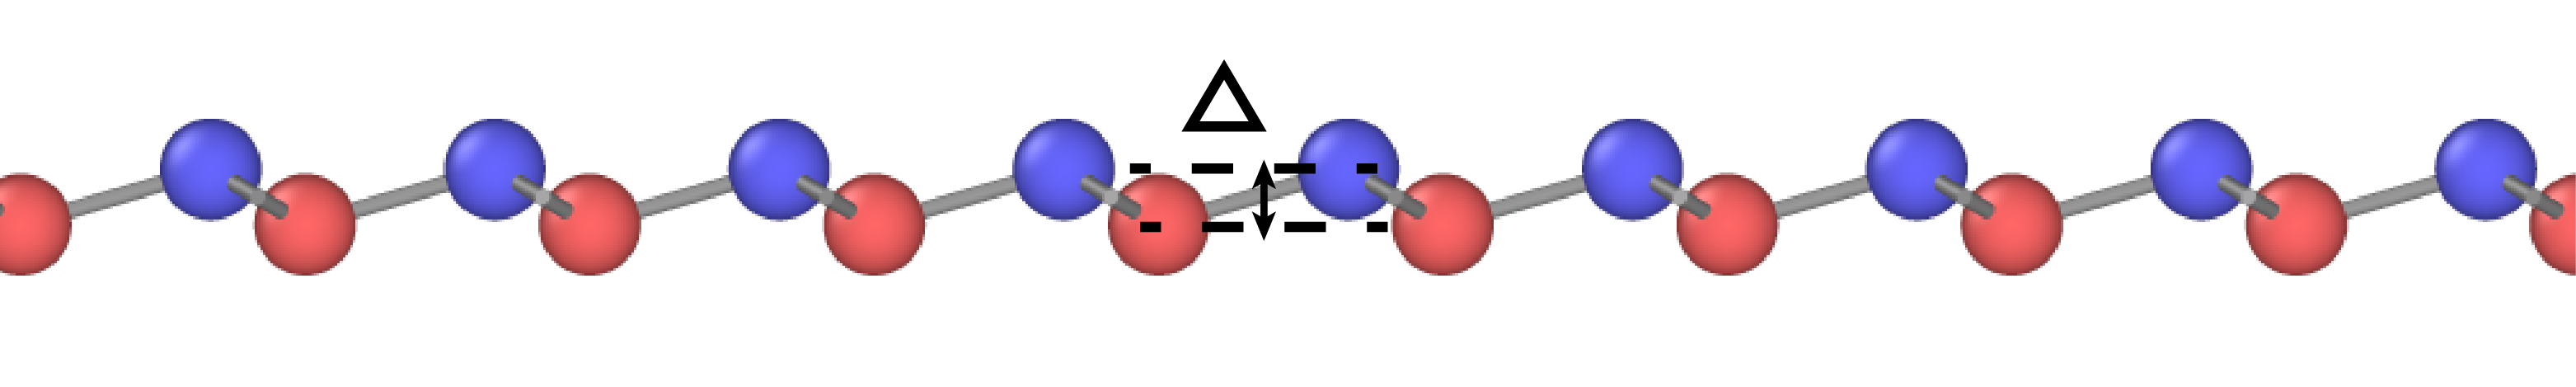 Figure 38
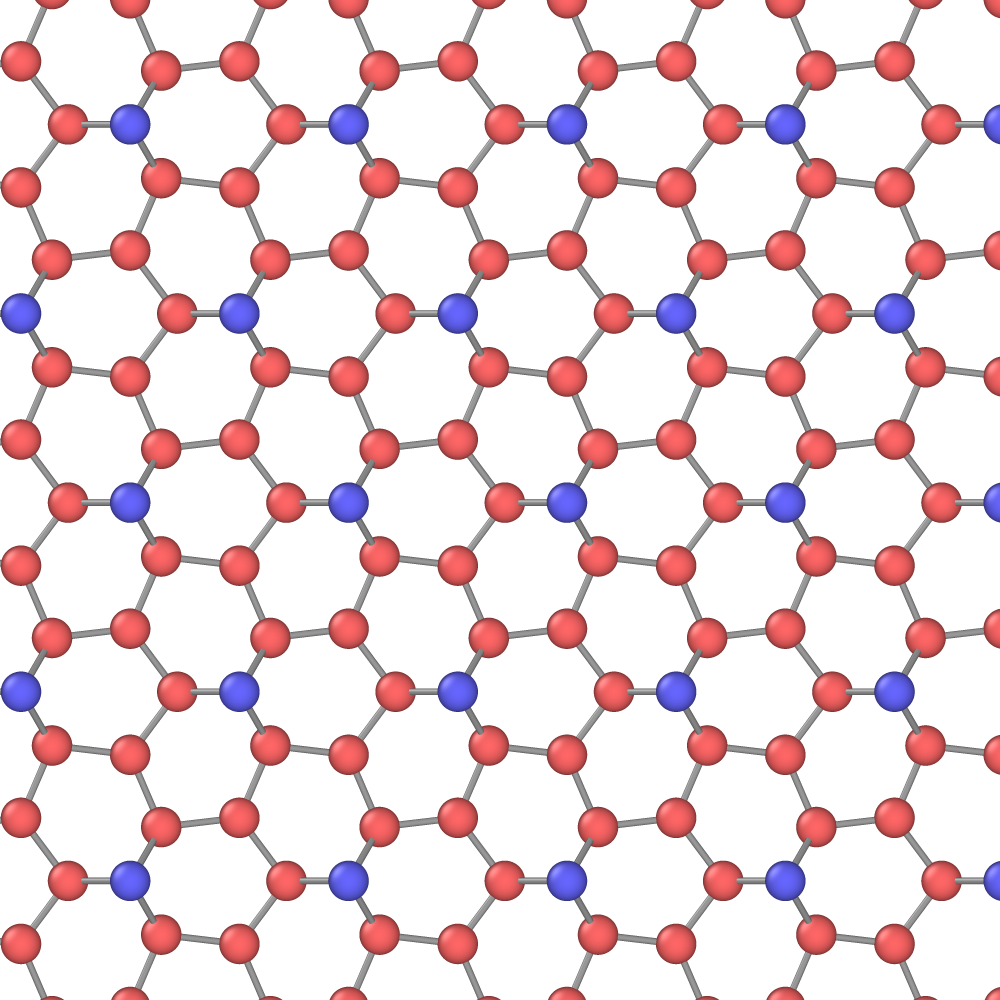 Figure 39
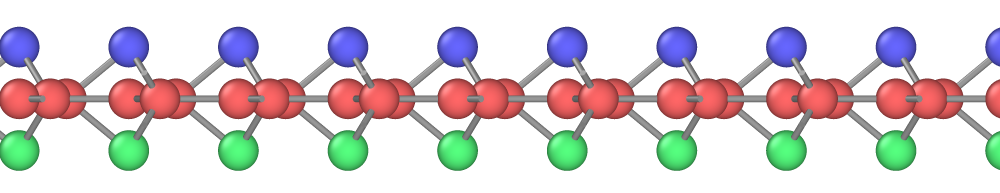 Figure 40
| Parameter | Present | MODa |
|---|---|---|
| (eV) | 3198.51383 | 3281.5905 |
| (eV) | 117.780724 | 121.00047 |
| (Å-1) | 3.18011795 | 3.2300135 |
| (Å-1) | 1.39343356 | 1.3457970 |
| 2.16152496 | 1.0000000 | |
| 0.544097766 | 0.53298909 | |
| 1.80536502 | 2.3890327 | |
| 3 | 1 | |
| (eV) | -0.0059204 | 0.0 |
| 0.201232428 | 0.20173476 | |
| 614230.043 | 730418.72 | |
| 996439.097 | 1000000.0 | |
| 3.33560562 | 1.0000000 | |
| 25.2096377 | 26.000000 | |
| -0.381360867 | –0.36500000 | |
| (Å) | 2.54388270 | 2.7 |
| (Å) | 3.20569403 | 3.3 |
| aRef. Kumagai et al.,2007 |
| Property | Experiment | DFT | Present | MODd | MEAMw | SWu |
|---|---|---|---|---|---|---|
| (eV/atom) | 4.63c | 4.84r | 4.630 | 4.630 | 4.630 | 4.337 |
| (Å) | 5.430a | 5.451r | 5.434 | 5.429 | 5.431 | 5.431 |
| (GPa) | 165a; 167.40b | 172.6 | 166.4 | 163.8 | 151.4 | |
| (GPa) | 64a; 65.23b | 64.6 | 65.3 | 64.5 | 76.4 | |
| (GPa) | 79.2a; 79.57b | 81.3 | 77.1 | 76.5 | 56.4 | |
| (THz) | 15.7o | 17.6 | 17.5 | 25.6 | 17.8 | |
| Vacancy: | ||||||
| () (eV) | 3.6j | 3.17m; 3.69t | 3.54 | 2.82 | 3.57 | 2.64 |
| 3.29–4.3h; 3.70-3.84s | ||||||
| () (eV) | 3.97t; 4.29v; 4.37n | 3.61 | – | 3.77 | – | |
| 3.67-3.70s; 5.023i | ||||||
| Interstitials: | ||||||
| (hex) (eV) | 3.31–5h; 2.87-3.80s | 3.51 | 4.13d | – | – | |
| () (eV) | 3.43–6h; 3.43-5.10s | 3.01 | 3.27d | 4.12 | 4.93 | |
| (B) (eV) | 4–5h | 4.34 | 5.03d | 6.78 | 5.61 | |
| (eV) | 3.31–3.84h; 2.87-3.84s | 3.26 | 3.57d | 3.91 | 4.41 | |
| Surface energy (J/m2): | ||||||
| {111} | 1.24q; 1.23p | 1.57l; 1.74f | 1.11 | 0.89 | 1.2 | 1.36 |
| {100} | 2.14l; 2.39f; 2.36k | 2.19 | 1.77 | 1.74e | 2.36 | |
| {100}2×1 | 1.36p | 1.71g; 1.45f; 1.51k | 1.21 | 1.07 | 1.24 | 1.45 |
| {110} | 1.43p | 1.75k | 1.36 | 1.08 | 1.41 | 1.67 |
| Melting: | ||||||
| Tm(K) | 1687 | 1687 | 1681d; 1682 | 1687w | 1691v; 1677 | |
| (%) | -5.1a | -3.8 | -12.5 | -2.7 | -7.2 | |
| (kJ/mol) | 50.6a | 24.0 | 34.7 | 43.2 | 31.1 | |
| aRef. Gale and Totemeir, 2004; bRef. McSkimin et al., 1951; cRef. Kittel, 1986; dRef. Kumagai et al., 2007; eConstrained relaxation; fRef. Stekolnikov et al.,2002 | ||||||
| gRef. Timonova et al., 2007; hReferences in Ref. Kumagai et al., 2007; iRef. Wright, 2006; jRef. Dannefaer et al.,1986 | ||||||
| kRef. Lu et al., 2005; lRef. Jelinek et al., 2012; mRef. Goedecker et al., 2002; nRef. Dabrowski and Kissinger, 2015; oRef. Dolling, 1963; pRef. Eaglesham et al.,1993 | ||||||
| qRef. Gilman, 1960; rRef. Yin and Cohen, 1982; sRef. Ganchenkova et al., 2015; tRef. Centoni et al., 2005; uRef. Stillinger and Weber, 1985; vRef. Puska et al., 1998; wRef. Ryu et al.,2009 | ||||||
| Structure | Ab initio | Present | MODi | MEAMl | SWa |
|---|---|---|---|---|---|
| FCC | 0.449c; 0.57f; 0.537h,m | 1.113 | 0.4473 | 0.8975 | 0.3963 |
| 0.6494n; 0.5536p | |||||
| HCP | 0.55f; 0.508m; 0.5946n; 0.5301p | 1.1019 | 0.4426 | 0.8909 | 0.3963 |
| BCC | 0.43q; 0.435c; 0.46j; | 0.6945 | 0.4377 | 0.5354 | 0.2810 |
| 0.53f; 0.523m; 0.6142p | |||||
| HEX | 0.293e | 0.7322 | 0.3901 | 0.5591 | 0.3876 |
| SC | 0.276c; 0.35f; 0.38b | 0.2849 | 0.3076 | 0.4688 | 0.2745 |
| 0.19d; 0.33d; 0.414d; 0.454d | 0.3725 | 0.3343 | 0.3671 | 0.2012 | |
| 0.3264n; 0.27f; 0.32b; 0.290h | |||||
| 0.2718p; 0.380r; 0.291m | |||||
| BC8 | 0.13s; 0.159h; 0.126j | 0.2008 | 0.2127 | 0.2502 | 0.1880 |
| 0.110k; 0.166n | |||||
| Wurtzite | 0.011h,m; 0.016f | 0.0000 | 0.0000 | 0.00001 | 0.0000 |
| ST12 | 0.136j; 0.1181k | 0.3900 | 0.4470 | 0.6031 | 0.4857 |
| cP46 | 0.063h; 0.0637n | 0.0703 | 0.0581 | 0.0625 | 0.0502 |
| h-Si6 | 0.35g | 0.5021 | 0.5863 | 0.6464 | 0.8417 |
| Si24 | 0.09t | 0.1816 | 0.1864 | 0.2340 | 0.1949 |
| RMS error | 0.2883 | 0.1124 | 0.2138 | 0.1745 | |
| aRef. Stillinger and Weber, 1985; bRef. Timonova et al., 2007 and references therein | |||||
| cRef. Kumagai et al., 2007; dRef. Sorella et al., 2011 and references therein | |||||
| eRef. Balamane et al., 1992 and references therein; fRef. Yin and Cohen,1982 | |||||
| gRef. Guo et al., 2015; hRef. Jain et al., 2013; iRef. Kumagai et al., 2007; jRef. Needs and Mujica, 1995; kRef. Crain et al.,1994 | |||||
| lRef. Ryu et al., 2009; mRef. Saal et al., 2013; nRef. Mihalkovic and Widom, 2011; pRefs. Curtarolo et al.,2012a, b | |||||
| qRef. Methfessel and Paxton, 1989; rRef. Kaltak et al., 2014; sRef. Yin, 1984; tRef. Kim et al.,2015 | |||||
| Structure | Experiment | Ab initio | Present | MODe | MEAMh | SWa |
| Diamond | 20.024f | 20.264c; 20.444d; 20.439i; 20.33b,l; | 20.052 | 20.002 | 20.024 | 20.023 |
| 19.59l; 20.46m; 19.03g; 16.686f; 20.385j | ||||||
| 19.77b; 20.42b; 20.124b; 20.21b; 20.08b | ||||||
| FCC | 14.678c; 14.484d; 14.504i; 14.810j; | 14.448 | 14.262 | 17.312 | 17.824 | |
| 14.337k | ||||||
| HCP | 14.477c; 14.313i; 14.68j | 14.439 | 14.257 | 17.279 | 17.824 | |
| BCC | 14.738c; 14.2427k | 14.483 | 14.045 | 15.592 | 17.082 | |
| HEX | 15.21l; 14.56l; 13.15p | 15.423 | 14.992 | 17.457 | 18.230 | |
| SC | 16.179c; 15.7653k | 15.639 | 15.581 | 18.194 | 17.822 | |
| 14.0f; 14.2f | 15.479c; 15.334d; 16.0f; 15.292i | 15.016 | 15.085 | 16.560 | 17.275 | |
| 14.92b; 15.45b; 15.25b; 15.34b | ||||||
| 15.31b; 15.405j; 15.35m; 14.8859k | ||||||
| BC8 | 18.13f; 18.26f | 17.724f; 17.48g; 18.44j; 18.427d | 18.112 | 18.079 | 19.374 | 17.902 |
| 18.2619k; 18.082n | ||||||
| Wurtzite | 20.324c; 20.440d; 20.380i; 19.7575k | 20.052 | 20.002 | 20.024 | 20.023 | |
| ST12 | 17.65g; 17.57g | 18.083 | 18.123 | 20.931 | 18.325 | |
| cP46 | 23.256d; 23.214i; 23.128j | 22.746 | 22.663 | 23.042 | 22.663 | |
| h-Si6 | 27.188q | 28.575 | 28.725 | 33.460 | 31.667 | |
| Si24 | 21.52r | 21.934r | 21.861 | 21.809 | 23.189 | 22.083 |
| RMS error | 0.6758 | 0.6609 | 1.9147 | 2.0452 | ||
| aRef. Stillinger and Weber, 1985; bRef. Sorella et al., 2011 and references therein; cRef. Yin and Cohen, 1982; dRef. Jain et al.,2013 | ||||||
| eRef. Kumagai et al., 2007; fRef. Needs and Mujica, 1995 and references therein; gRef. Crain et al., 1994; iRef. Saal et al.,2013 | ||||||
| jRef. Mihalkovic and Widom, 2011; kRef. Oloriegbe, 2008; lRef. Gaál-Nagy et al., 2004; mRef. Kaltak et al., 2014; nRef. Biswas et al., 1984; pRef. Balamane et al., 1992; qRef. Guo et al., 2015; rRef. Kim et al.,2015 | ||||||
| Property | Ab initio | Present | MODa | MEAMb | SWc |
| (111) shuffle | 1.81d,e | 1.09 | 1.04 | 1.40 | 0.87 |
| (111) glide | 4.97f | 5.25 | 5.00 | 4.58 | 6.37 |
| (111) glide | 2.02d,e | 2.39 | 2.05 | 2.86 | 3.09 |
| (100) | 2.15e | 2.44 | 1.77 | 2.19 | 1.61 |
| aRef. Kumagai et al., 2007; bRef. Ryu et al., 2009; cRef. Stillinger and Weber,1985 | |||||
| dRef. Kaxiras and Duesbery, 1993; eRef. Juan and Kaxiras, 1996; fDigitized from Ref. Juan and Kaxiras,1996 |
| Cluster | Experiment | Ab initio | Present | MODa | MEAMb | SWc |
| Si2 | 1.62d | 1.53d; 1.81e | 1.327 | 1.788 | 2.473 | 1.084 |
| Si3.1 | 2.03d; 2.41e | 1.710 | 2.003 | 2.519 | 1.267 | |
| Si3.2 | 2.6d | 2.39d; 2.58e | 1.757 | 2.197 | 2.672 | 1.446 |
| Si3.3 | 2.61e | 2.259 | 2.147 | 2.815 | 1.480 | |
| Si4.1 | 1.82d; 2.48e | 1.901 | 2.121 | 2.593 | 1.372 | |
| Si4.2 | 2.02d; 2.49e | 2.457 | 2.325* | 2.984 | 1.669* | |
| Si4.3 | 2.21d; 2.73e | 2.571 | 2.810 | 3.021 | 2.035 | |
| Si4.4 | 2.22d | 2.219 | 2.232 | 2.759 | 1.525 | |
| Si4.5 | 2.68d; 3.09e | 2.579 | 2.441* | 2.995 | 1.746* | |
| Si5.1 | 2.02d; 2.62e | 2.613 | 3.013 | 3.075 | 2.168 | |
| Si5.2 | 2.69d; 3.04e | 2.800 | 2.731 | 3.159 | 2.062 | |
| Si5.3 | 3.09e | 2.678 | 2.549* | 3.037 | 1.845* | |
| Si5.4 | 2.78d; 3.30e | 2.836 | 2.821 | 3.124 | 2.146 | |
| Si5.5 | 2.017 | 2.192 | 2.626 | 1.433 | ||
| Si6.1 | 2.22d | 2.618 | 3.023 | 3.075 | 2.168 | |
| Si6.2 | 3.33e | 2.862 | 2.793 | 3.269 | 2.142 | |
| Si6.3 | 3.04d; 3.448e | 2.664* | 2.658* | 3.225 | 1.970* | |
| Si6.4 | 3.453e | 2.706* | 2.771* | 3.260 | 2.139* | |
| Si6.5 | 2.606 | 2.975 | 3.045 | 2.132 | ||
| Si6.6 | 2.093 | 2.239 | 2.651 | 1.475 | ||
| Si7.1 | 3.56e | 2.938 | 2.960 | 3.344 | 2.321* | |
| Si8.1 | 3.22e | 2.919 | 3.006* | 3.267 | 2.379* | |
| Chain | 2.260a | 2.477 | 2.475 | 2.771 | 1.680 | |
| aRef. Kumagai et al., 2007; bRef. Ryu et al., 2009; cRef. Stillinger and Weber,1985 | ||||||
| dRef. Raghavachari, 1986 and references therein; eRef. Fournier et al.,1992 | ||||||
| Property | Ab initio | Present | MODa | MEAMb | SWc |
|---|---|---|---|---|---|
| Honeycomb planar: | |||||
| (eV/atom) | 3.96f | 3.6955 | 3.8280 | 3.6234 | 3.1450 |
| (Å) | 3.895f | 4.042 | 4.019 | 4.306 | 4.104 |
| (Å) | 2.249f | 2.332 | 2.321 | 2.486 | 2.369 |
| Honeycomb buckled: | |||||
| (eV/atom) | 0.76e | 0.88 | 0.69 | 0.89 | 1.09 |
| (eV/atom) | 0.048d | 0.14 | -0.08 | 0.08 | 0.07 |
| (Å) | 3.88k; 3.87d,g; 3.83e | 3.870 | 3.820 | 3.944 | 3.840 |
| (Å) | 2.28d; 2.25e,l | 2.328 | 2.312 | 2.449 | 2.352 |
| (Å) | 0.44d,e; 0.45g,j | 0.655 | 0.694 | 0.901 | 0.784 |
| 0.46i; 0.49l | |||||
| Dumbbell: | |||||
| (Å) | 6.52d,h | 6.475 | 6.471 | 6.312 | 6.604 |
| (Å) | 2.40d,h | 2.393 | 2.425 | 2.526 | 2.513 |
| (Å) | 2.28d | 2.333 | 2.425 | 2.456 | 2.359 |
| (Å) | 2.76h | 3.0564 | 3.111 | 3.160 | 3.261 |
| aRef. Kumagai et al., 2007 ; bRef. Ryu et al., 2009; cRef. Stillinger and Weber, 1985; dRef. Kaltsas and Tsetseris, 2013; eRef. Cahangirov et al., 2009;fRef. Balamane et al., 1992; | |||||
| gRef. Ge et al., 2016; hRef. Cahangirov et al., 2014; iRef. Ni et al., 2012; jRef. Matusalem et al., 2015; kRef. Roome and Carey, 2014; lRef. Sahin and Peeters,2013 | |||||
| Property | Ab initio | Present | MODa | MEAMb | SWc |
| Bilayer planar silicene AAp: | |||||
| (eV/atom) | 4.16d; 4.27d | 4.3067 | 4.2183 | 4.1739 | 3.8542 |
| (Å) | 4.12e; 4.13d | 4.3264; 3.9804 | 4.0913 | 4.2685 | 4.1497 |
| 4.14d | |||||
| (Å) | 2.38d,e; 2.39d | 2.3641,2.3737 | 2.3621 | 2.4644 | 2.3958 |
| (Å) | 2.41d,e | 2.3916 | 2.4393 | 2.4869 | 2.4428 |
| Bilayer buckled silicene AA′: | |||||
| (eV/atom) | 4.1866 | 4.2776 | 4.1626 | 3.7945 | |
| (eV/atom) | 0.33e | 0.1201 | -0.0593 | 0.0113 | 0.0597 |
| (Å) | 3.84e | 3.8430 | 3.8245 | 3.9155 | 3.8402 |
| (Å) | 2.3405 | 2.3311 | 2.4081 | 2.3517 | |
| (Å) | 2.3543 | 2.3515 | 2.3801 | 2.3517 | |
| (Å) | 3.0994 | 3.0990 | 3.2101 | 3.1356 | |
| (Å) | 0.7451 | 0.7475 | 0.8300 | 0.7839 | |
| Bilayer buckled silicene AB: | |||||
| (eV/atom) | 4.10d; 4.25d | 4.1866 | 4.2776 | 4.1626 | 3.7945 |
| (eV/atom) | 0.17e | 0.1201 | -0.0593 | 0.0113 | 0.0597 |
| (Å) | 3.84d,e; 3.86d | 3.8429 | 3.8245 | 3.9155 | 3.8402 |
| (Å) | 2.32d | 2.3405 | 2.3311 | 2.4082 | 2.3517 |
| (Å) | 2.51d; 2.54d | 2.3543 | 2.3515 | 2.3801 | 2.3517 |
| (Å) | 3.19d; 3.20d | 3.0994 | 3.0990 | 3.2101 | 3.1359 |
| (Å) | 0.66d; 0.68d | 0.7451 | 0.7475 | 0.8300 | 0.7839 |
| aRef. Kumagai et al., 2007; bRef. Ryu et al., 2009; cRef. Stillinger and Weber, 1985; dRef. Fu et al., 2014; eRef. Padilha and Pontes,2015 | |||||
Peer Reviews
No public reviews on file for this paper yet. If you reviewed it on a platform where reviews are public (OpenReview, ICLR, NeurIPS, ICML), you can paste yours below so the community can read it here.
Videos
No videos yet. Explain this paper in a talk, walkthrough, or lecture? Add one.
An optimized interatomic potential for silicon and its application
to thermal stability of silicene
G. P. Purja Pun
Department of Physics and Astronomy, MSN 3F3, George Mason University, Fairfax, Virginia 22030, USA
Y. Mishin
Department of Physics and Astronomy, MSN 3F3, George Mason University, Fairfax, Virginia 22030, USA
Abstract
An optimized interatomic potential has been constructed for silicon using a modified Tersoff model. The potential reproduces a wide range of properties of Si and improves over existing potentials with respect to point defect structures and energies, surface energies and reconstructions, thermal expansion, melting temperature and other properties. The proposed potential is compared with three other potentials from the literature. The potentials demonstrate reasonable agreement with first-principles binding energies of small Si clusters as well as single-layer and bilayer silicenes. The four potentials are used to evaluate the thermal stability of free-standing silicenes in the form of nano-ribbons, nano-flakes and nano-tubes. While single-layer silicene is mechanically stable at zero Kelvin, it is predicted to become unstable and collapse at room temperature. By contrast, the bilayer silicene demonstrates a larger bending rigidity and remains stable at and even above room temperature. The results suggest that bilayer silicene might exist in a free-standing form at ambient conditions.
Atomistic modeling, interatomic potential, silicon, silicene, thermal stability.
I Introduction
Silicon is one of the most important functional materials widely used in electronic, optical, energy conversion and many other applications. Not surprisingly, Si has been the subject of many classical molecular dynamics (MD) and other large-scale atomistic computer studies for almost three decades. Although classical atomistic simulations cannot access electronic or magnetic properties, they are indispensable for gaining a better understanding of the atomic structures, thermal and mechanical properties of the crystalline, liquid and amorphous Si and various nano-scale objects such as nano-wires and nano-dots. Atomistic simulations rely on semi-empirical interatomic potentials. The accuracy of the results delivered by atomistic simulations depends critically on the reliability of interatomic potentials.
Several dozen semi-empirical potentials have been developed for Si. Although none of them reproduces all properties accurately, there is a trend towards a gradual improvement in their reliability as more sophisticated potential generation methods are developed and larger experimental and first-principles datasets become available for the optimization and testing. The most popular Si potentials were proposed by Stillinger and Weber (SW)(Stillinger and Weber, 1985) and Tersoff.(Tersoff, 1988a, b, 1989) The original Tersoff potentials were modified by several authors by slightly changing the analytical functions and improving the optimization.(Dodson, 1987; Ramana Murty and Atwater, 1995; Kumagai et al., 2007; Yu et al., 2007; Monteverde et al., 2012; Martinez et al., 2013) Other Si potential formats include the environment-dependent interatomic potential,(Justo et al., 1998) the modified embedded atom method (MEAM) potentials,(Baskes et al., 1989; Lenosky et al., 2000; Ryu et al., 2009; Timonova and Thijsse, 2010, 2011; Jelinek et al., 2012; Liu et al., 2015) and bond-order potentials.(Gillespie et al., 2007; Oloriegbe, 2008)
One of the most significant drawbacks of the existing Si potentials is the overestimation of the melting temperature , in many cases by hundreds of degrees. Other typical problems include underestimated vacancy and surface energies and positive Cauchy pressure , which in reality is negative ( being elastic constants). Kumagai et al.(Kumagai et al., 2007) constructed a significantly improved Tersoff potential that predicts K in close agreement with the experimental value of 1687 K, gives the correct Cauchy pressure, and is accurate with respect to many other properties. This potential, usually referred to as MOD,(Kumagai et al., 2007) is probably the most advanced Tersoff-type potential for Si available today. However, it still suffers from a low vacancy formation energy, low surface energies, and overestimated thermal expansion at high temperatures and the volume effect of melting.
The goal of this work was twofold. The first goal was to further improve on the MOD potential(Kumagai et al., 2007) by addressing its shortcomings with a minimal impact on other properties. This was achieved by slightly modifying the potential format and performing a deeper optimization. When testing the new potential, we compare it not only with MOD but also with the popular SW potential.(Stillinger and Weber, 1985) We further include the MEAM potential developed by Ryu et al.(Ryu et al., 2009) to represent a different potential format. To our knowledge, this is the only MEAM potential whose melting point is close to experimental.
The second goal was to test the four potentials for their ability to predict the energies of low-dimensional structures, such as small Si clusters and single- and double-layer forms of silicene (2D allotrope of Si). Si potentials are traditionally considered to be incapable of reproducing low-dimensional structures. This view is largely based on testing the SW potential. The MOD and MEAM potentials have not been tested for the properties of clusters or silicenes in any systematic manner. Such tests were conducted in this work using all four potentials. The results suggest that the present potential, MOD and MEAM do capture the main trends and in many cases agree with first-principles density functional theory (DFT) calculations. As such, they can be suitable for exploratory studies of thermal and mechanical stability of Si clusters and 2D structural forms of Si. In this work we apply them to evaluate the stability of free-standing single-layer and bilayer silicenes at room temperature.
II Potential generation procedures
The total energy of a collection of atoms is represented in the form
[TABLE]
where is distance between atoms and and the bond energy is taken as
[TABLE]
Here, the bond order is given by
[TABLE]
where
[TABLE]
The term represent an effective coordination number of atom and is a cutoff function. The latter has the form
[TABLE]
where and are cutoff radii. The outer cutoff is chosen between the first and second coordination shells of the diamond cubic structure. The angular function has the generalized form
[TABLE]
where is the angle between the bonds and . These functional forms are the same as for the MOD potential,(Kumagai et al., 2007) except for the new coefficient that was added to better control the attractive part of the potential.
The adjustable parameters of the potential are , , , , , , , , , , , , , , and . The power is a fixed odd integer. In the original Tersoff potential(Tersoff, 1988a, b, 1989) , whereas Kumagai et al.(Kumagai et al., 2007) chose . We tried both numbers and found that gives a better potential.
The free parameters of the potential were trained to reproduce basic physical properties of the diamond cubic (A4) structure and the energies of several alternate structures. Specifically, the fitting database included the experimental lattice parameter , cohesive energy , elastic constants , and the vacancy formation energy . The alternate structures were: simple cubic (SC), -Sn (A5), face-centered cubic (FCC), hexagonal closed pack (HCP), body-centered cubic (BCC), simple hexagonal (HEX), wurtzite (B4), BC8, ST12, and clathrate (cP46). Their energies obtained by DFT calculations are available from open-access databases such as Materials Project,(Jain et al., 2013) OQMD(Saal et al., 2013) and AFLOW.(Curtarolo et al., 2012a, b) Some of these structures were found experimentally as Si polymorphs under high pressure, others were only generated in the computer for testing purposes. The parameter optimization process utilized a simulated annealing algorithm. The objective function was the sum of weighted squares of deviations of properties from their target values. Numerous optimization runs were conducted using the weights as a tool to achieve the most meaningful distribution of the errors over different properties. Several versions of the potential were generated and the version deemed to be most reasonable was selected as final.
The optimized potential parameters are listed in Table 1. The potential has been incorporated in the molecular dynamics package LAMMPS (Large-scale Atomic/Molecular Massively Parallel Simulator)(Plimpton, 1995) as the pair style tersoff/mod/c.
The transferability of the new potential was evaluated by computing a number of physical properties that were not included in the training database and comparing the results with experimental data and/or DFT calculations available in the literature. The same comparison was made for the MOD, MEAM and SW potentials to demonstrate their strengths and weaknesses relative to the new potential. We utilized the MOD and SW potential files from the LAMMPS potential library. The MEAM potential file was obtained from the developers.(Ryu et al., 2009) The potential testing results are reported in the next Section.
III Properties of solid Si
Table 2 summarizes some of the properties of crystalline Si predicted by the four potentials. All properties have been computed in this work unless otherwise is indicted by citations. The defect energies are reported after full atomic relaxation.
III.1 Lattice properties
The present potential, MOD and MEAM accurately reproduce the elastic constants. The SW potential gives less accurate elastic constants and a positive Cauchy pressure contrary to experiment.(Gale and Totemeir, 2004; McSkimin et al., 1951) The phonon density of states (DOS) and phonon dispersion relations were computed by the method developed by Kong(Kong, 2011) and implemented in LAMMPS. The MD simulation was performed at 300 K utilizing a primitive supercell with 8192 atoms. The DOS plots are shown in Fig. 1(a) and the respective zone-center optical frequencies are indicated in Table 2. The present potential, MOD and SW predict surprisingly similar values that underestimate the experimental frequency by about 2 THz. The MEAM potential overshoots by about 10 THz and the entire DOS is stretched by a factor of 1.63. Note that none of the four potentials reproduces the sharp peak at about 5 THz arising from the acoustic zone-boundary phonons.
Fig. 1(b) displays the phonon dispersion curves predicted by the present potential. While general agreement with experiment(Dolling, 1963; Nilsson and Nelin, 1972; Zdetsis and Wang, 1979; Kulda et al., 1994) is evident and the longitudinal acoustic branches are reproduced accurately, the potential overestimates the transverse acoustic zone-boundary frequencies and the optical frequencies.
The cubic lattice parameter was computed as a function of temperature by zero-pressure MD simulations. The linear thermal expansion coefficient relative to room temperature ( at 295 K) is compared with experimental data in Fig. 2. The SW potential demonstrates exceptionally good agreement with experiment. The present potential slightly overestimates the experiment at temperatures below 1300 K and underestimates at higher temperatures. The negative slope at high temperatures is unphysical, but the overall agreement with experiment is reasonable. The MOD potential gives a similar thermal expansion at low temperatures but over-predicts it at high temperatures. The MEAM potential grossly overestimates the thermal expansion. Given also the poor agreement for phonons, care should be exercised when using this potential for thermodynamic calculations of crystalline Si. Note that neither phonon properties nor thermal expansion were not included in the fitting databases of the potentials.
III.2 Lattice defects
According to DFT calculations,(Puska et al., 1998; Goedecker et al., 2002; Centoni et al., 2005; Wright, 2006; Dabrowski and Kissinger, 2015) a Si vacancy can exist in several metastable structures. In the lowest-energy structure, the four neighbor atoms slightly move towards the vacant site preserving the tetrahedral () symmetry and leaving four dangling bonds. A slightly less favorable structure is obtained when one of the four atoms moves towards the other three and forms six identical bonds. This configuration has a hexagonal () symmetry and is referred to as the “dimerized” or “split” vacancy. This vacancy reconstruction eliminates the dangling bonds but increases the elastic strain in the surrounding lattice. The present potential and MEAM correctly predict the split vacancy to be less stable than the vacancy. The latter has the formation energy within the range of DFT calculations and consistent with the experimental value of 3.6 eV.(Dannefaer et al., 1986) (It should be noted, though, that the experiments are performed at high temperatures at which the vacancy structure is unknown.) The MOD and SW potentials significantly under-predict the formation energy of the vacancy. In addition, with the MOD potential the split vacancy spontaneously transforms to a structure with the energy of 3.41 eV (the DFT value is 3.46 eV)(Sholihun et al., 2015), whereas the SW potential predicts the split vacancy to be mechanically unstable and spontaneously transform to the structure.
Self-interstitials can exist in four distinct configurations: hexagonal (hex), tetrahedral (), bond center (B) and split (Table 2). Given the large scatter of the DFT formation energies, all four potentials perform almost equally well. There is one exception: the MEAM and SW potentials predict the hexagonal interstitial to be mechanically unstable and spontaneously transform to the tetrahedral configuration. Both potentials overestimate the B-interstitial energy.
Surface energies were computed for the low-index orientations {100}, {110} and {111}. Experiments have shown that these surfaces can undergo reconstructions to several different structures.(Tong et al., 1988; Tromp et al., 1985; Qian and Chadi, 1987) Reconstructions of the {110} and {111} surfaces are accompanied by a modest energy reduction of about 0.3-0.4 J/m2. In this paper, these surfaces were tested in unreconstructed states. By contrast, the dimer reconstruction of the {100} surface to the more stable structure reduces the surface energy by almost 1 J/m2. In this case, both reconstructed and unreconstructed structures were compared with DFT calculations. Table 2 shows that the SW potential does an excellent job reproducing the DFT surface energies. The MOD potential is the least accurate: it systematically underestimates the surfaces energies for all orientations. The present potential demonstrates a substantial improvement over MOD: all energies are higher and closer to the DFT data. The MEAM potential is equally good for all surfaces except for the unreconstructed {100} structure. The latter is mechanically unstable with this potential and reconstructs to the structure spontaneously during static relaxation at 0 K. This instability was not observed in the DFT calculations.(Stekolnikov et al., 2002) The surface energy of 1.74 J/m2 shown in the table was obtained by constrained relaxation of this surface, in which the atoms were only allowed to move in the direction normal to the surface to prevent the dimerization. With the potential proposed in this work, the unreconstructed {100} surface is stable at 0 K and forms symmetrical rows of dimers corresponding to the reconstruction upon heating to 1000 K and slowly cooling down to 0 K.
As another test of the potentials, unstable stacking fault energies were calculated for the {111} and {100} crystal planes. Such faults are important for the description of dislocation core structures. In silicon, dislocations glide predominantly on {111} planes. The spacing between {111} planes alternates between wide and narrow. In the former case the chemical bonds are normal to the planes while in the latter they are at 19.47*∘* angles. A generalized stacking fault is obtained by translation of one half-crystal relative to the other in a chosen direction parallel to a {111} plane. Depending on whether the cutting plane passes between widely spaced or narrowly spaced atomic layers, the stacking fault is called shuffle type or glide type, respectively. After each increment of crystal translation, the atoms are allowed to minimize the total energy by local displacements normal (but no parallel) to the fault plane. The excess energy per unit surface area plotted as a function of the translation vector is called the gamma-surface. If the dislocation Burgers vector is parallel to a crystallographic direction , then its core structure is dictated by the cross-sections of the gamma-surface. The unstable stacking fault energy is the maximum energy in this cross-section.
Figure 5 displays three cross-sections of the {111} gamma surface computed with the four potentials in comparison with DFT calculations. The figure additionally includes the cross-section for which DFT data is available. The respective values are summarized in Table 5. While none of the potentials reproduces the DFT curves well, the SW potential tends to be the least accurate. For some of the cross-sections, the Tersoff-type potentials “chop off” the tip of the curve due to the short range of atomic interactions and a relatively sharp cutoff. It should also be noted that the potentials do not reproduce the stable stacking fault predicted by DFT calculations [Fig. 5(c)]. This fault arises due to long-range interactions and is not captured by these potentials.
IV Melting temperature and liquid properties of Si
The melting temperature was computed by the interface velocity method. A periodic simulation block containing a (111) solid-liquid interface was subject to a series of isothermal MD simulations in the NPT ensemble (zero pressures in all directions) at several different temperatures. The interface migrated towards one phase or the other, depending on whether the temperature was above or below the melting point. The total energy of the system was monitored in this process and was found to be a nearly linear function of time. The slope of this function gives the rate of the energy change due to the phase transformation. A plot of this energy rate as a function of temperature was used to find the melting point by linear interpolation to the zero rate (Fig. 3). For the present potential, the melting temperature obtained was found to be K (the error bar is the standard deviation of the linear fit). This temperature is in excellent agreement with the experimental melting point of 1687 K, even though it was not included in the fitting procedure.
To verify our methodology, similar calculations were performed for the MOD potential. The result was K, which matches 1681 K reported by the potential developers.(Kumagai et al., 2007) For the SW potential, the same method gives K. This number is consistent (within the error bars) with K obtained by thermodynamic calculations.(Broughton and Li, 1987) The energy rate versus temperature plots for the MOD and SW potentials can be found in the Supplemental Material to this paper.(Sup, ????)
Table 2 summarizes the predictions of the four potentials for the latent heat of melting and the volume effect of melting relative to the volume of the solid . None of the potentials reproduces these properties well. The present potential gives the most accurate volume effect but the least accurate latent heat . The MOD potential predicts a better value of but overestimated the volume effect a factor of two.
Prediction of structural properties of liquid Si presents a significant challenge to interatomic potentials. The nature of atomic bonding in Si changes from covalent to metallic upon melting,(Müller et al., 1978) causing an increase in density. In this work, the structure of liquid Si was characterized by the pair correlation function and the bond-angle distribution function . These functions were averaged over 300 uncorrelated snapshots from NPT MD simulations under zero pressure at 1750 K using a simulation block containing 6912 atoms. The angular distribution was computed for bonds within the radius of the first minimum of and normalized by unit area under the curve.
The results are shown in Fig. 4. The present potential turns out to be the least accurate for the liquid properties. The first maximum of is too high and the first minimum too deep in comparison with experiment.(Waseda et al., 1995) The other potentials perform better but still show significant departures from the experiment. For the bond-angle distribution, the results computed with the four potentials are very different and none agrees with the DFT simulations. The DFT simulations (ab initio MD)(Štich et al., 1989; Jank and Hafner, 1990) yield a broader distribution with two peaks of comparable height centered at and . The present potential strongly underestimates the peak, overestimates the peak at 90*∘, and creates another peak at the tetrahedral angle of 109.47∘. Using the other potentials, the position of the large peak varies between 90∘and 109.47∘*. Overall, our potential overestimates the degree of structural order in the liquid phase. This seems somewhat surprising given that this potential predicts the most accurate volume effect of melting.
V Alternate crystal structures of Si
Tables 3 and 4 show the equilibrium energies of several crystal structures of Si relative to the diamond cubic structure and the respective equilibrium atomic volumes. All these structures were included in the potential fitting procedure except for two. The h-Si6 structure was recently found by DFT calculations as a new mechanically stable polymorph of Si attractive for optoelectric applications due to its direct band gap of 0.61 eV and interesting transport and optical properties.(Guo et al., 2015) The h-Si6 structure is composed of Si triangles forming a hexagonal unit cell with the P63/mmc space group. Si24 is another mechanically stable polymorph that has recently been synthesized by removing Na from the Na4Si24 precursor.(Kim et al., 2015) The orthorhombic Cmcm structure of Si24 contains open channels composed of 6 and 8-member rings. This polymorph has a quasi-direct 1.3 eV band gap and demonstrates unique electronic and optical properties making it a promising candidate for photovoltaic and other applications. The h-Si6 and Si24 structures were used for testing purposes to evaluate the transferability of the potentials. All structures were equilibrated by isotropic volume relaxation without local displacements of atoms. For the HCP and Wurtzite structures, the ratios were fixed at the ideal values. For the simple hexagonal, -Sn and h-Si6 structures, was fixed at the DFT values of 0.94, 0.552 and 0.562, respectively. It is worth mentioning that the present potential and MOD predict the wurtzite phase to be mechanically unstable at 0 K, which appears to be a generic feature of Tersoff-type potentials.
In Tables 3 and 4, we compare the predictions of the four potentials with DFT calculations available in the literature. Since the tables are overloaded with numerical data, we found it instructive to recast this information in a graphical format. In Figs. 6 and 7 we plot the energies (volumes) predicted by each potential against the respective DFT energies (volumes) computed by different authors. The bisecting line is the line of perfect correlation. The first thing to notice is the large scatter of the DFT data reported by different sources, which makes a comparison with potentials somewhat ambiguous. For each potential, the agreement was quantified by the root-mean-square (RMS) deviation of the data points from the bisecting line. The RMS deviations obtained are shown in the last row of Tables 3 and 4. It should emphasized that these RMS deviations reflect not only the differences between the potentials and the DFT calculations but also the scatter of the DFT points themselves. Thus, only comparison of relative values of the RMS deviations makes sense. It should also be noted that the energy deviations are strongly dominated by high-energy structures, such as the close-packed FCC and HCP phases. With this in mind, it is evident that the present potential is the least successful in reproducing the structural energies, whereas the MOD potential is the most successful. For the atomic volumes, however, the present potential and MOD are equally accurate, while the SW and MEAM potentials show significantly larger deviations.
It is interesting to note that the present potential gives the most accurate predictions for the energy and volume of the novel h-Si6 and Si24 structures that were not included in the fitting database. The MOD potential comes close second, whereas the MEAM and SW potentials are significantly less accurate. The energy-volume plots for several selected structures can be found in the Supplemental Material to this article.(Sup, ????)
VI Silicon clusters
Structure and properties of small Si clusters offer a stringent test of interatomic potentials. Potentials are usually optimized for bulk properties, whereas the clusters display very different and much more open environments in which the coordination number and the type of bounding may change very significantly from one structure to another. Si potentials are traditionally considered to be incapable of reproducing cluster properties, unless such properties are specifically included in the fitting process as in the case of the Boulding and Andersen potential.(Boulding and Andersen, 1990) It was thus interesting to compare the predictions of the four potentials with first-principles calculations.
Figs. 8 and 9 show the structures of the Sin () clusters tested in this work. Several different structures are included for each cluster size whenever first-principles data is available. Such structures are labeled by index in the Si format in the order of increasing cohesive (binding) energy according to the DFT calculations.(Fournier et al., 1992) Thus, the structure labeled Si represents the DFT-predicted ground state for each cluster size (except for the dimer Si2 that has a single structure). In addition to the DFT calculations,(Fournier et al., 1992) we included the results of quantum-chemical (QC) calculations on the Hartree-Fock level.(Raghavachari, 1986) Such calculations are more accurate but the energy scale is not fully compatible with that of the DFT calculations. To enable comparison, we followed the proposal(Raghavachari and Logovinsky, 1985; Raghavachari and Rohlfing, 1988) that the QC energies be scaled by a factor of 1.2 to ensure agreement with experiment for the dimer energy.
Table 6 summarizes the predictions of the four potentials in comparison with DFT calculations(Fournier et al., 1992) and unscaled QC energies.(Raghavachari, 1986) In addition to the clusters, we included an infinitely long linear chain for the sake of comparison. To aid visual comparison, Fig. 10 shows the cluster energies grouped by the cluster size (same-size clusters are connected by straight lines). The QC energies are plotted in the scaled format. Note that the scaling does indeed bring the QC and DFT energies to general agreement with each other. Despite the significant scatter of the individual energies on the level of 0.2-0.4 eV/atom, both calculation methods predict the same ground state for trimers, tetramers and pentamers. None of the potentials predicts the correct ordering for all DFT/QC energies. The present potential and MOD show about the same level of accuracy, but the present potential makes less mistakes in the ordering. Both potentials tend to slightly under-bind the clusters. The MEAM potential is the most successful in reproducing the cluster energies, except for the dimer energy for which it is least accurate. There are mistakes in the ordering, but overall the deviations from the first-principles calculations are about the same as the difference between the two first-principles methods. The SW potential performs poorly: for some of the clusters, the binding energy is underestimated by more than 1 eV/atom. For the infinite atomic chain, the present potential and MOD are in closest agreement with the DFT/QC energies (Table 6).
This comparison leads to the conclusion that, at least for the cluster structures tested here, the present potential, MOD and MEAM are quite capable of predicting the general trends of the cluster energies with a reasonable accuracy without fitting.
VII 2D silicon structures
VII.1 Single-layer silicenes
Silicenes are 2D allotropes of Si that have recently attracted much attention due to their interesting physical properties and potential device applications.(Kara et al., 2012; Roome and Carey, 2014; Grazianetti et al., 2016; Kaloni et al., 2016; Lew Yan Voon et al., 2016) By contrast to carbon, the sp3 hybridized Si would seem to be an unlikely candidate for a 2D material. Nevertheless, epitaxial honeycomb Si layers have been found on metallic substrates such as (111)Ag.(Lalmi et al., 2010; Kara et al., 2012; Vogt et al., 2012; Lin et al., 2012; Feng et al., 2012; Gao and Zhao, 2012; Acun et al., 2013; Arafune et al., 2013; Sone et al., 2014; Roome and Carey, 2014; Grazianetti et al., 2016). Unlike in graphene, some of the 2D forms of Si can have a band gap and could be incorporated in Si-based microelectronics. In particular, electric field applied to the buckled honeycomb structure of silicene, which is normally semi-metallic, can open a band gap whose magnitude increases with the field. It was predicted,(Ni et al., 2012) and recently demonstrated,(Tao et al., 2015) that single-layer silicene can work as a field-effect transistor.(Ni et al., 2012) Experimentally, it has not been possible so far to isolate free-standing silicenes. They are presently considered hypothetic 2D materials and have only been studied by DFT calculations. Such calculations predict that single-layer silicene can possess remarkable electric, optical and magnetic properties,(Ezawa, 2012; Liu et al., 2013, 2011; Xu et al., 2012) in addition to ultra-low thermal conductivity.(Peng et al., 2016)
The planar (graphene-like) silicene [Fig. 11(a)] is mechanically unstable and spontaneously transforms to the more stable buckled structure [Fig. 11(b,c)].(Cahangirov et al., 2009, 2014; Matusalem et al., 2015) The latter has a split width of about 0.45-0.49 Å and a first-neighbor distance slightly different from that in the planar structure.(Cahangirov et al., 2009; Ni et al., 2012; Sahin and Peeters, 2013; Kaltsas and Tsetseris, 2013; Matusalem et al., 2015; Ge et al., 2016) Furthermore, adsorption of Si ad-atoms on the buckled silicene creates a series of periodic dumbbell structures that are even more stable.(Peng et al., 2016; Kaltsas and Tsetseris, 2013; Cahangirov et al., 2014) An ad-atom pushes a nearby Si atom out of its regular position and the two atoms form a dumbbell aligned perpendicular to the silicene plane. The dumbbell atoms have a fourfold coordination (counting the dumbbell bond itself) consistent with the sp3 bonding. One of the best studied dumbbell silicenes has the structure shown in Fig. 11(d,e,f) (the dumbbell atoms are shown in blue and green). The dumbbells distort the hexagonal structural units and create three slightly different nearest-neighbor distances: , and [Fig. 11(f)].
The energies and geometric characteristics of the three silicene structures predicted by the four potentials are listed in Table 7. The results of DFT calculations reported in the literature are included for comparison. The agreement with the DFT data is reasonable, especially considering that the 2D structures were not included in the fitting datasets of the potentials. The present potential, MOD and MEAM demonstrate about the same agreement with the DFT calculations. The SW potential tends to be less accurate. For the planar structure, the MOD potential is the most accurate, followed by the present potential, MEAM and then SW. All four potentials correctly predict that the planar structure is mechanically unstable and transforms to the buckled structure. The present potential, MEAM and SW correctly predict that the dumbbell structure has a lower energy than the buckled structure. By contrast, the MOD potential predicts that the dumbbell structure has a higher energy, which is contrary to the DFT calculations. All four potentials overestimate the split width in the buckled structure and the distance between the dumbbell atoms in the structure, the present potential being closest to the DFT data.
Thermal stability of single-layer silicenes has been evaluated by MD simulations. The simulated systems were subject to periodic boundary conditions at zero pressure. Fig. 12 demonstrates that a nano-ribbon of buckled silicene is unstable at finite temperatures and quickly collapses to a cluster before temperature reaches 300 K. Likewise, a free-standing sheet (flake) of buckled silicene (Fig. 13) collapses into a cluster with the shape of a bowl when temperature reaches 300 K. The nano-ribbon and nano-flake made of the dimerized silicene collapse as well.
A single-wall nano-tube was also tested for thermal stability. The latter was obtained by wrapping a layer planar silicene into a tube 49 Å in diameter (Fig. 14). The period along the tube axis was 122 Å. As soon as temperature began to increase starting from 0 K, the wall of the tube transformed to the buckled structure and then collapsed before the temperature reached 300 K. Qualitatively the same behavior of the single-layer silicene structures was found with all four potentials. In all cases, the single layer silicene easily developed waves due to thermal fluctuations until neighboring surface regions came close enough to each other to form covalent bonds. Once this happened, the bond-forming process quickly spread over the entire surface and the structure collapsed. This chemical reactivity and the lack of bending rigidity are the main factors that cause the instability of free-standing single-layer silicenes at room temperature.
VII.2 Bilayer silicenes
Another interesting 2D form of silicon is the bilayer silicene.(Resta et al., 2013; Arafune et al., 2013; Liu et al., 2013; Fu et al., 2014; Pflugradt et al., 2014; Padilha and Pontes, 2015; Yaokawa et al., 2016) Like the single-layer silicene discussed above, the bilayer silicene was found experimentally on top of metallic surfaces such as Ag(111).(Resta et al., 2013; Arafune et al., 2013; Pflugradt et al., 2014; Yaokawa et al., 2016) By contrast to bilayer graphene, the interlayer bonds in bilayer silicene are covalent sp3 type. As a result, the formation of a bilayer is accompanied by a significant energy release. It can be expected, therefore, that bilayer silicene should be more stable than two single layers.
Several structural forms of the bilayer silicene have been found in experiments and studied by DFT calculations, depending on the type of stacking of the two layers and whether they are planar or buckled.(Resta et al., 2013; Arafune et al., 2013; Liu et al., 2013; Fu et al., 2014; Pflugradt et al., 2014; Padilha and Pontes, 2015; Yaokawa et al., 2016) Three of the structures, referred to as AAp, AA*′* and AB, are shown in Fig. 15. The AAp structure is obtained by stacking two planar silicene layers (A) on top of each other and connecting them by vertical covalent bonds [Fig. 15(a)]. This structure is characterized by the geometric parameters (side of the rhombic structural unit) and the interlayer spacing . The bond length between Si atoms is within each layer and between the layers. In the AA*′* structure, both layers are buckled, and the buckling of one layer (A*′*) is inverted with respect to the buckling of the other layer (A) [Fig. 15(b)]. As a result, half of the interlayer distances are short, leading to the formation of covalent bonds, and the other half of the distances are longer and covalent bonds do not form. The geometric parameters of the structure are (defined above), the in-layer bond length , the interlayer bond length , and the split width of each layer . The distance between the layers is . Finally, in the AB structure, two buckled silicene layers A and B are stacked together so that half of the atoms of one layer project into the centers of the hexagonal units of the other layer [Fig. 15(c)]. The remaining half of the atoms project onto each other and form vertical covalent bonds. As with the single-layer silicenes, it has not been possible so far to isolate free-standing bilayer silicene experimentally.
The cohesive energies and geometric parameters of three bilayer silicenes computed with four interatomic potentials are compared with DFT data in Table 8. The Table also shows the energies of the buckled bilayers AA*′* and AB relative to the planar bilayer AAp. None of the potentials matches the DFT calculations accurately. However, the present potential displays the closest agreement. The MOD potential incorrectly predicts that the buckled structures AA*′* and AB are more stable than AAp (negative values), which is contrary to the DFT calculations. It should be noted that all four potentials predict virtually identical properties of the AA*′* and AB silicenes. This is not surprising: considering only nearest neighbor bonds, the local atomic environments in the two structures are identical. Their DFT lattice parameters are indeed the same (3.84 Å),(Padilha and Pontes, 2015) but the DFT energies are different (0.33 and 0.17 eV/atom, respectively;(Padilha and Pontes, 2015) our potential gives eV/atom for both). This discrepancy apparently reflects a common feature of all short-range Si potentials.
To assess thermal stability of bilayer silicenes, MD simulations were conducted for the same nano-ribbon, nano-flake and nano-tube configurations as discussed above. The most stable AAp silicene was chosen for the tests. The samples were heated up to 300 K and annealed at this temperature for 10 ns. The systems developed significant capillary waves, especially the nano-ribbon, but none of them collapsed (Fig. 16). Although 10 ns is a short time in comparison with experimental times, these tests confirm that the bilayer silicene has a much greater bending rigidity and smaller reactivity in comparison with its single-layer counterpart. As such, it has a much better chance of survival in a free-standing form at room temperature.
In additional tests, the nano-flake was heated from 300 K to 1000 K in 6 ns followed by an isothermal anneal for 2 ns at 1000 K. The surface of the flake developed a set of thermally activated point defects, such as ad-atoms and locally buckled configurations, but the flake itself did not collapse. This again confirms the significant thermal stability of the bilayer silicene, possibly even at high temperatures. The same tests were conducted with all four potentials and the results were qualitatively similar. With the MOD potential, the initial AAp silicene quickly transformed to the more stable buckled structure, but the system still did not collapse.
VIII Discussion and conclusions
Silicon is one of the most challenging elements for semi-empirical interatomic potentials. It has over a dozen polymorphs that are stable at different temperatures and pressures and exhibit different coordination numbers and types of bonding ranging from strongly covalent to metallic. The diamond cubic phase displays a rather complex behavior with several possible structures of point defects, a number of surface reconstructions, and an increase in density upon melting. It is not surprising that the existing Si potentials are not nearly as successful in describing this material as some of the embedded-atom potentials for metals.(Daw and Baskes, 1983, 1984; Mishin, 2005) In this work, we developed a new Si potential with the goal of improving some of the properties that were not captured accurately by other potentials. For comparison, we selected three potentials from the literature that we consider most reliable(Kumagai et al., 2007; Ryu et al., 2009) or most popular.(Stillinger and Weber, 1985)
Extensive tests have shown that the present potential does achieve the desired improvements, in particular with regard to the vacancy formation energies, surface formation energies and reconstructions, thermal expansion factors and a few other properties. The potential is more accurate, in comparison with other potentials, in reproducing the DFT data for the novel Si polymorphs h-Si6 and Si24 without including them in the fitting database. But the tests have also shown that each of the four potentials has its successes and failures. The present potential makes inaccurate predictions for the energies of high-lying Si polymorphs (although their atomic volumes are quite accurate), for the latent heat of melting, and for the short-range order in the liquid phase. The MOD potential(Kumagai et al., 2007) has its own drawbacks mentioned in Section I. The MEAM potential(Ryu et al., 2009) grossly overestimates the phonon frequencies and thermal expansion factors, in addition to the incorrect {100} surface reconstruction. The SW potential successfully reproduces the surface energies and thermal expansion factors but predicts a positive Cauchy pressure and systematically overestimates the atomic volumes of Si polymorphs (as does the MEAM potential).
The potentials were put through a very stringent test by computing the binding energies of small Sin clusters. Such clusters were not included in the potential fitting procedure and are traditionally considered to be out of reach of potentials unless specifically included in fitting database. Surprisingly, the present potential, the MOD potential,(Kumagai et al., 2007) and especially the MEAM potential(Ryu et al., 2009) reproduce the general trends of the cluster energies reasonably well (Fig. 10). In many cases, the ranking of the energies of different geometries for the same cluster size agrees with first-principles calculations. The SW potential is less accurate: it systematically under-binds the clusters and makes more mistakes in the energy ordering.
Encouraged by the reasonable performance for the clusters, we applied the potentials to model single-layer and bilayer silicenes, which were not included in the potential fitting either. While none of the potentials reproduces all DFT calculations accurately, they generally perform reasonably well. One notable exception is the MOD potential, which under-binds the dumbbell structure of the single-layer silicene and fails to reproduce the correct ground-state of the bilayer silicene. Furthermore, all four potentials predict identical energies of the AA*′* and AB bilayer silicenes, whereas the DFT energies are different. Other than this, the trends are captured quite well. The present potential demonstrates the best performance for the bilayer silicenes.
Experimentally, silicenes have only been found on metallic substrates. Whether they can exist in a free-standing form at room temperature remains an open question. Evaluation of their thermal stability requires MD simulations of relatively large systems for relatively long times that are not currently accessible by DFT methods. Although interatomic potentials are less reliable, they can be suitable for a preliminary assessment. The MD simulations performed in this work indicate that single-layer silicenes are unlikely to exist in a free-standing form. Their large bending compliance and chemical reactivity lead to the development of large shape fluctuations and eventually the formation of covalent bonds between neighboring surface regions at or below room temperature. By contrast, bilayer silicenes exhibit much greater bending rigidity and lower surface reactivity. Nano-structures such as nano-ribbons, nano-flakes and nano-tubes remain intact at and above room temperature, at least on a 10 ns timescale. The fact that this behavior was observed with all four potentials points to the generality of these observations and suggests that free-standing bilayer silicenes might be stable at room temperature. Of course, this tentative conclusion requires validation by more detailed and more accurate studies in the future.
The four potentials discussed in this work are likely to represent the limit of what can be achieved with short-range semi-empirical potentials. Further improvements can only be made by developing more sophisticated, longer-range, and thus significantly slower potentials. Analytical bond-order potentials offer one option.(Oloriegbe, 2008; Gillespie et al., 2007; Drautz et al., 2007) Recent years have seen a rising interest in machine-learning potentials.(Mueller et al., 2016; Behler and Parrinello, 2016; Bartok et al., 2010; Behler and Parrinello, 2007; Behler et al., 2008; Botu and Ramprasad, 2015) While even slower, they allow one to achieve an impressive accuracy of interpolation between DFT energies, in some cases up to a few meV/atom. However, the lack of transferability to configurations outside the training dataset remains an issue.
Acknowledgements
This work was supported by the U.S. Department of Energy, Office of Basic Energy Sciences, Division of Materials Sciences and Engineering, the Physical Behavior of Materials Program, through Grant No. DE-FG02-01ER45871.
The reference list from the paper itself. Each links out to its DOI / PubMed record.
- 1Stillinger and Weber (1985) F. H. Stillinger, T. A. Weber, Computer simulation of local order in condensed phases of silicon, Phys. Rev. B 31 (1985) 5262–5271.
- 2Tersoff (1988 a) J. Tersoff, New empirical approach for the structure and energy of covalent systems, Phys. Rev. B 37 (1988 a) 6991–7000.
- 3Tersoff (1988 b) J. Tersoff, Empirical interatomic potential for silicon with improved elastic properties, Phys. Rev. B 38 (1988 b) 9902–9905.
- 4Tersoff (1989) J. Tersoff, Modeling solid-state chemistry: Interatomic potentials for multicomponent systems, Phys. Rev. B 39 (1989) 5566–5568.
- 5Dodson (1987) B. W. Dodson, Development of a many-body Tersoff-type potential for silicon, Phys. Rev. B 35 (1987) 2795–2798.
- 6Ramana Murty and Atwater (1995) M. V. Ramana Murty, H. A. Atwater, Empirical interatomic potential for Si-H interactions, Phys. Rev. B 51 (1995) 4889–4893.
- 7Kumagai et al. (2007) T. Kumagai, S. Izumi, S. Hara, S. Sakai, Development of bond-order potentials that can reproduce the elastic constants and melting point of silicon for classical molecular dynamics simulation, Comp. Mater. Sci. 39 (2007) 457–464.
- 8Yu et al. (2007) J. Yu, S. B. Sinnott, S. R. Phillpot, Charge optimized many-body potential for the Si/Si O 2 system, Phys. Rev. B 75 (2007) 085311.