Core or cusps: The central dark matter profile of a redshift one strong lensing cluster with a bright central image
Thomas E. Collett (ICG, Portsmouth), Elizabeth Buckley-Geer, Huan Lin,, David Bacon, Robert C. Nichol, Brian Nord, Xan Morice-Atkinson, Adam Amara,, Simon Birrer, Nikolay Kuropatkin, Anupreeta More, Casey Papovich, Kathy K., Romer, Nicolas Tessore, Tim M. C. Abbott, Sahar Allam

TL;DR
This study analyzes a high-redshift galaxy cluster lens with a bright central image, revealing a shallow dark matter profile that challenges standard cold dark matter models unless the cluster is a merger, which aligns better with simulations.
Contribution
The paper provides the first detailed mass profile reconstruction of a z=1.06 cluster with a bright central image, testing dark matter models against observational data.
Findings
Central density profile is shallower than expected from CDM simulations.
A two-halo merger model fits the data better, consistent with CDM predictions.
Predictions for future HST imaging will help distinguish between models.
Abstract
We report on SPT-CLJ2011-5228, a giant system of arcs created by a cluster at . The arc system is notable for the presence of a bright central image. The source is a Lyman Break galaxy at and the mass enclosed within the 14 arc second radius Einstein ring is solar masses. We perform a full light profile reconstruction of the lensed images to precisely infer the parameters of the mass distribution. The brightness of the central image demands that the central total density profile of the lens be shallow. By fitting the dark matter as a generalized Navarro-Frenk-White profile---with a free parameter for the inner density slope---we find that the break radius is kpc, and that the inner density falls with radius to the power at 68 percent confidence. Such a shallow profile is in strong tension with our understanding of relaxed…
Click any figure to enlarge with its caption.
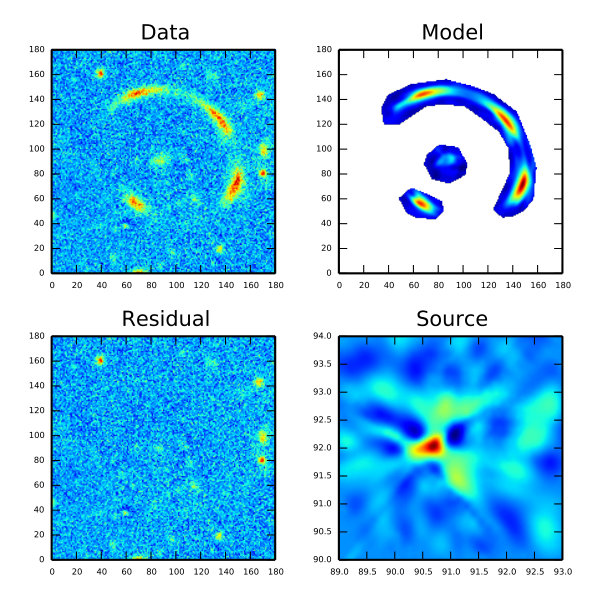 Figure 1
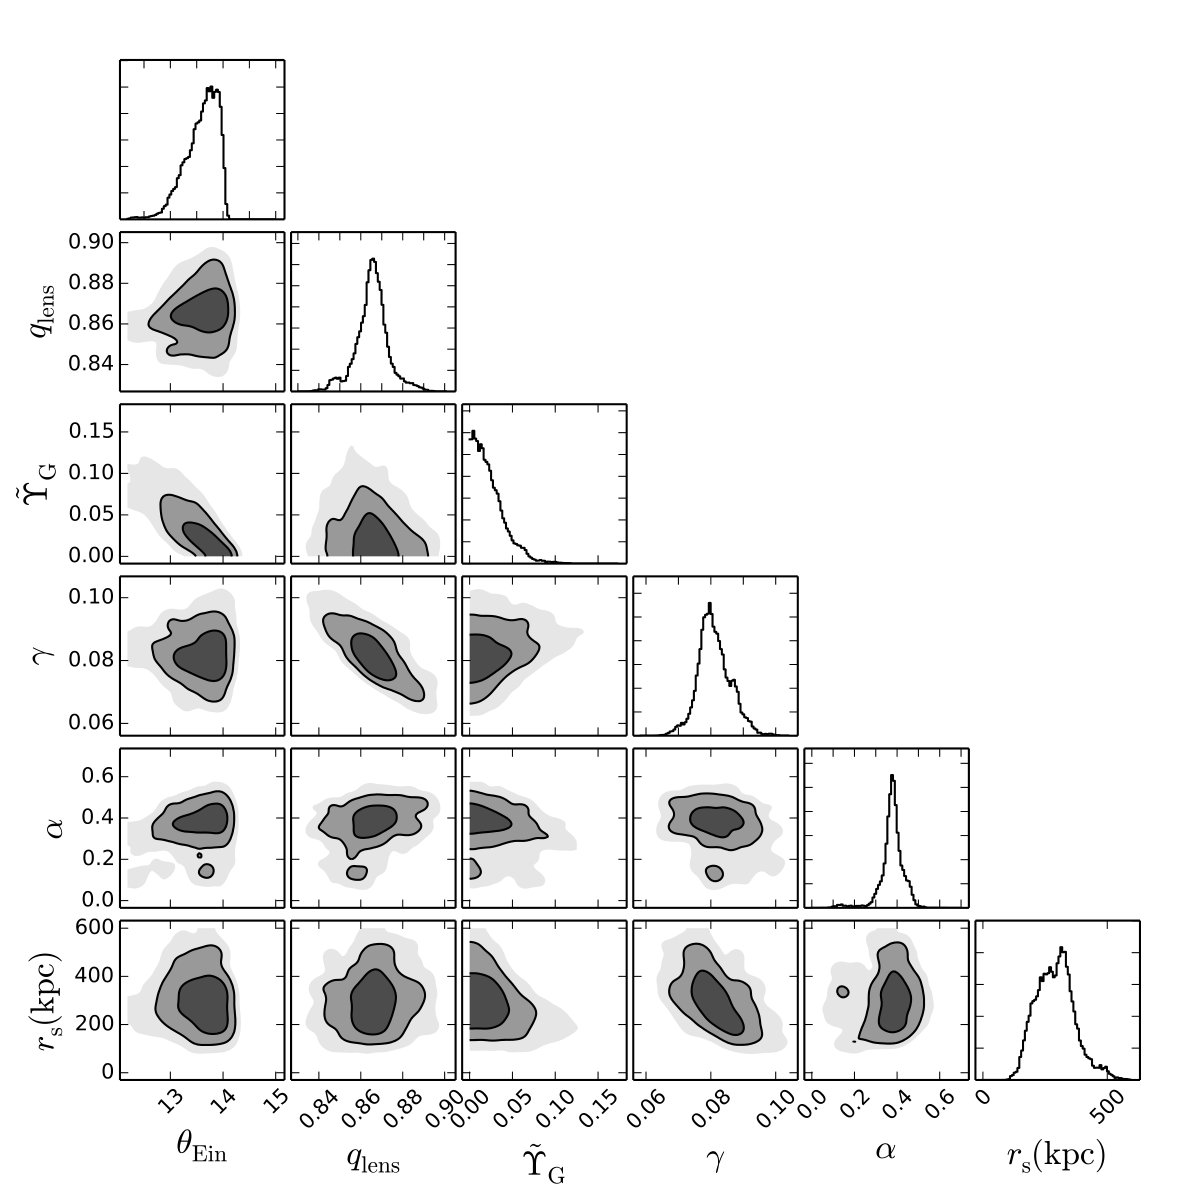 Figure 2
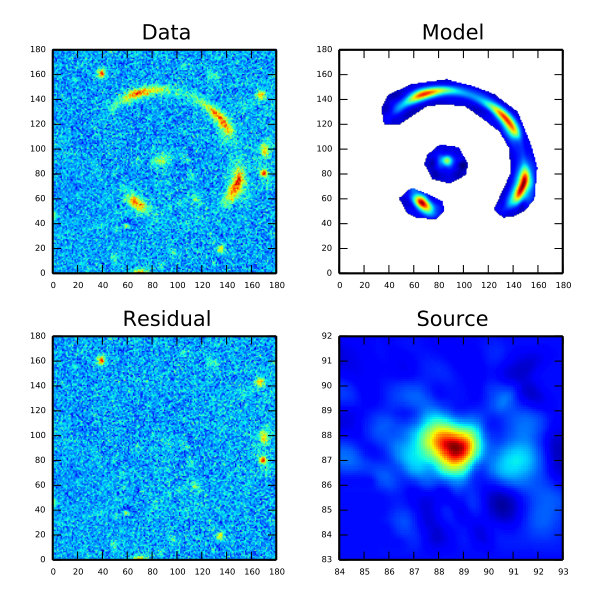 Figure 3
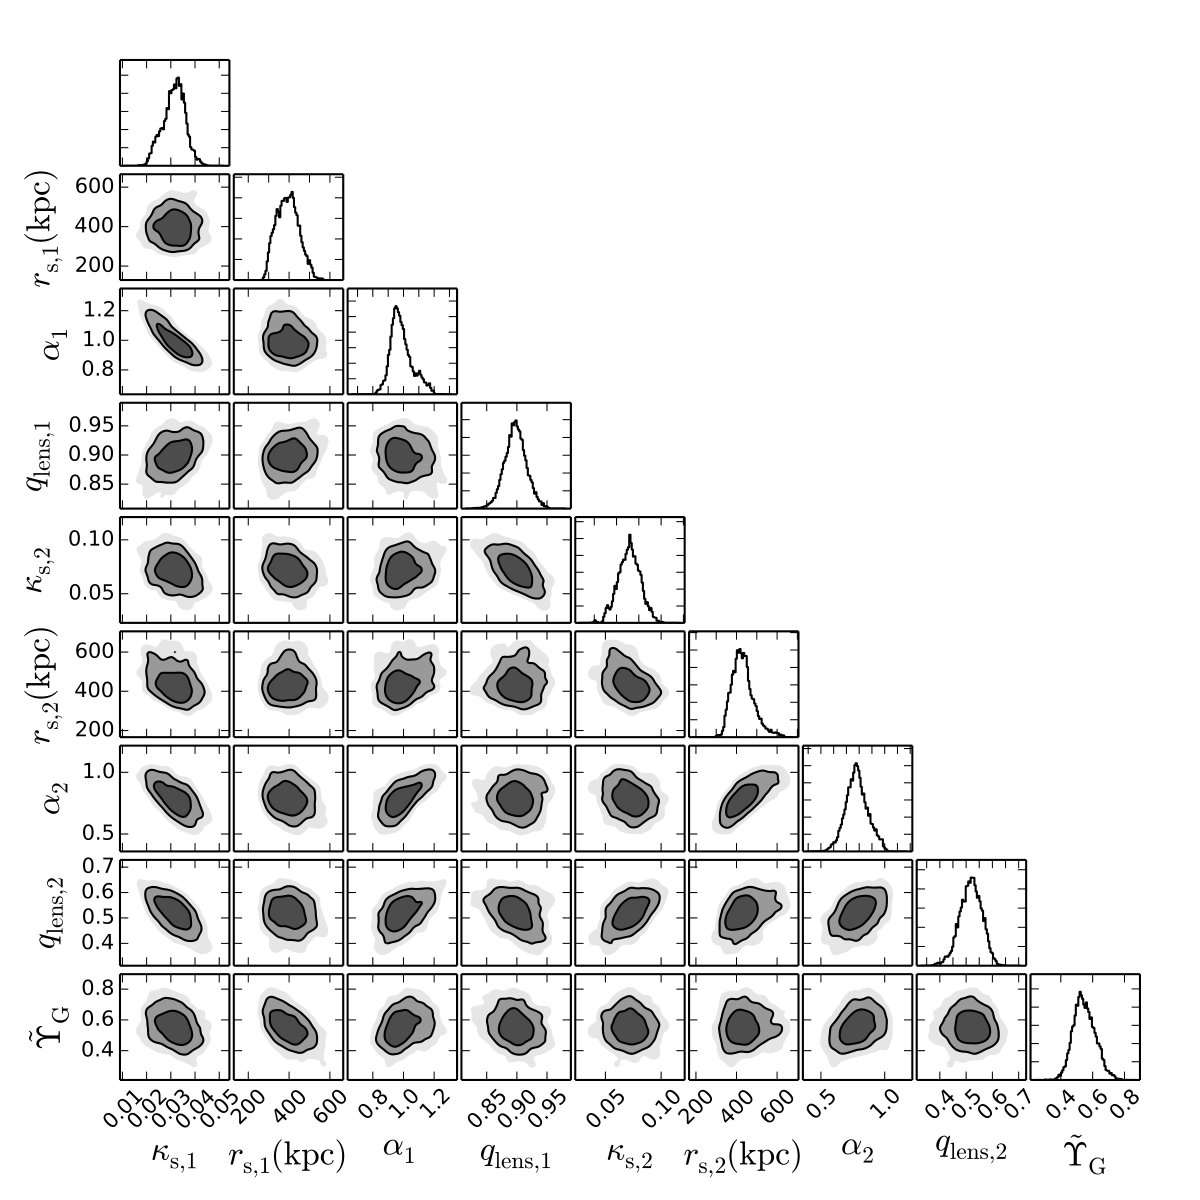 Figure 4
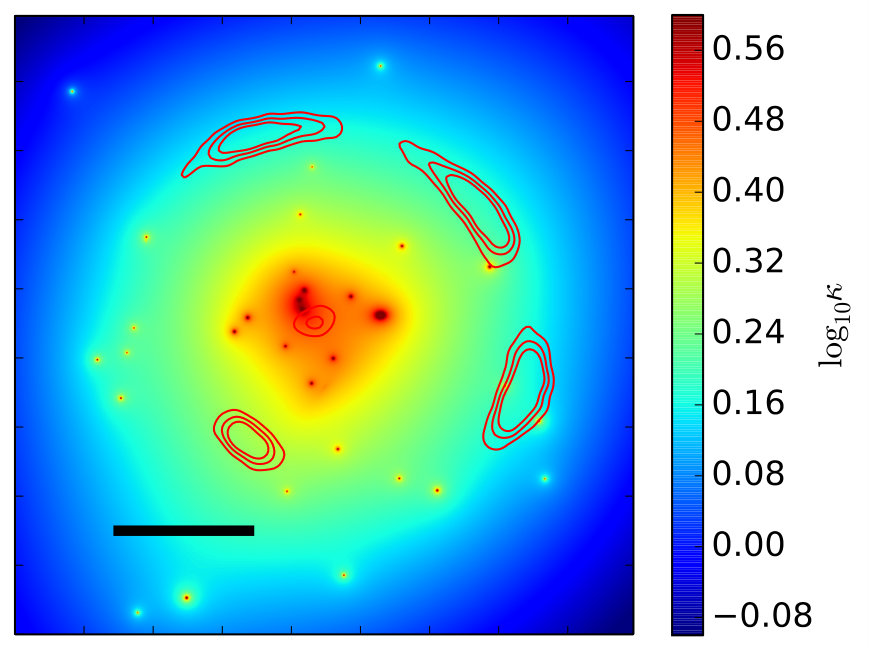 Figure 5
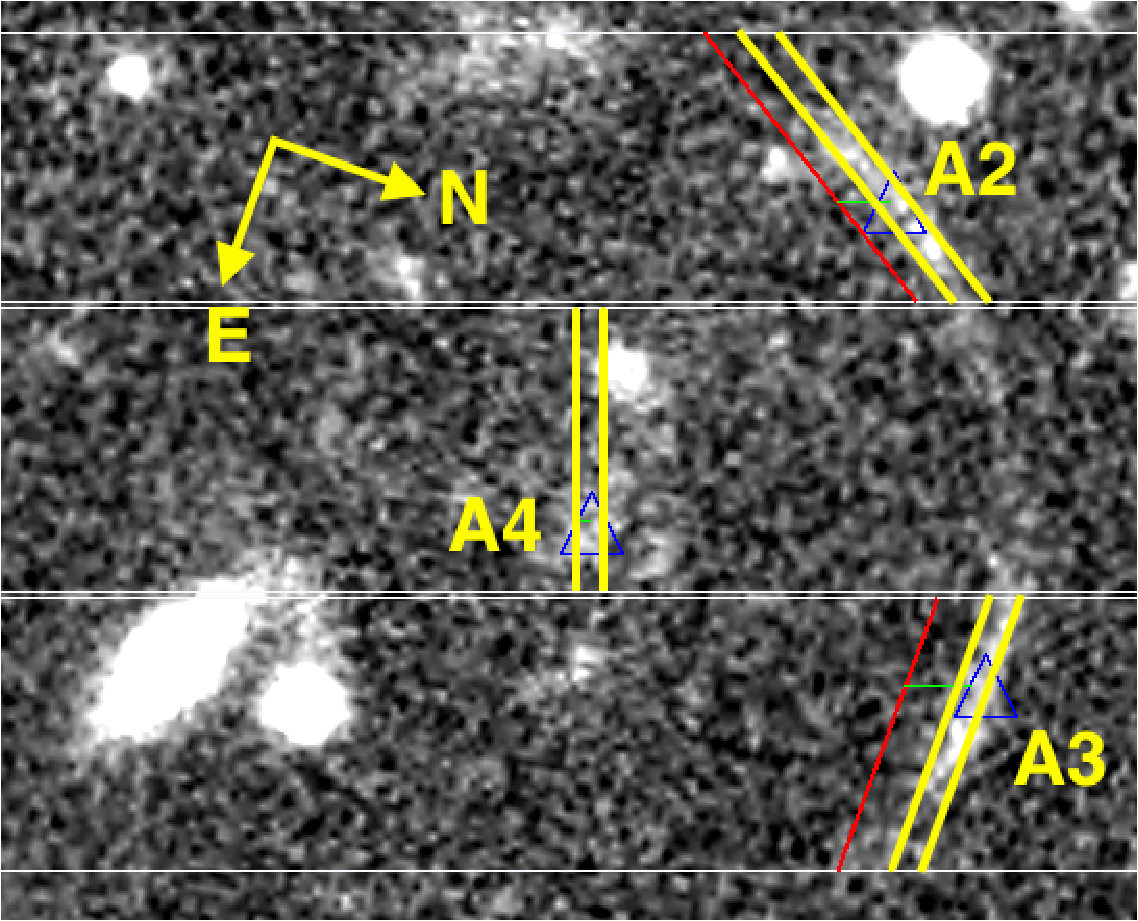 Figure 6
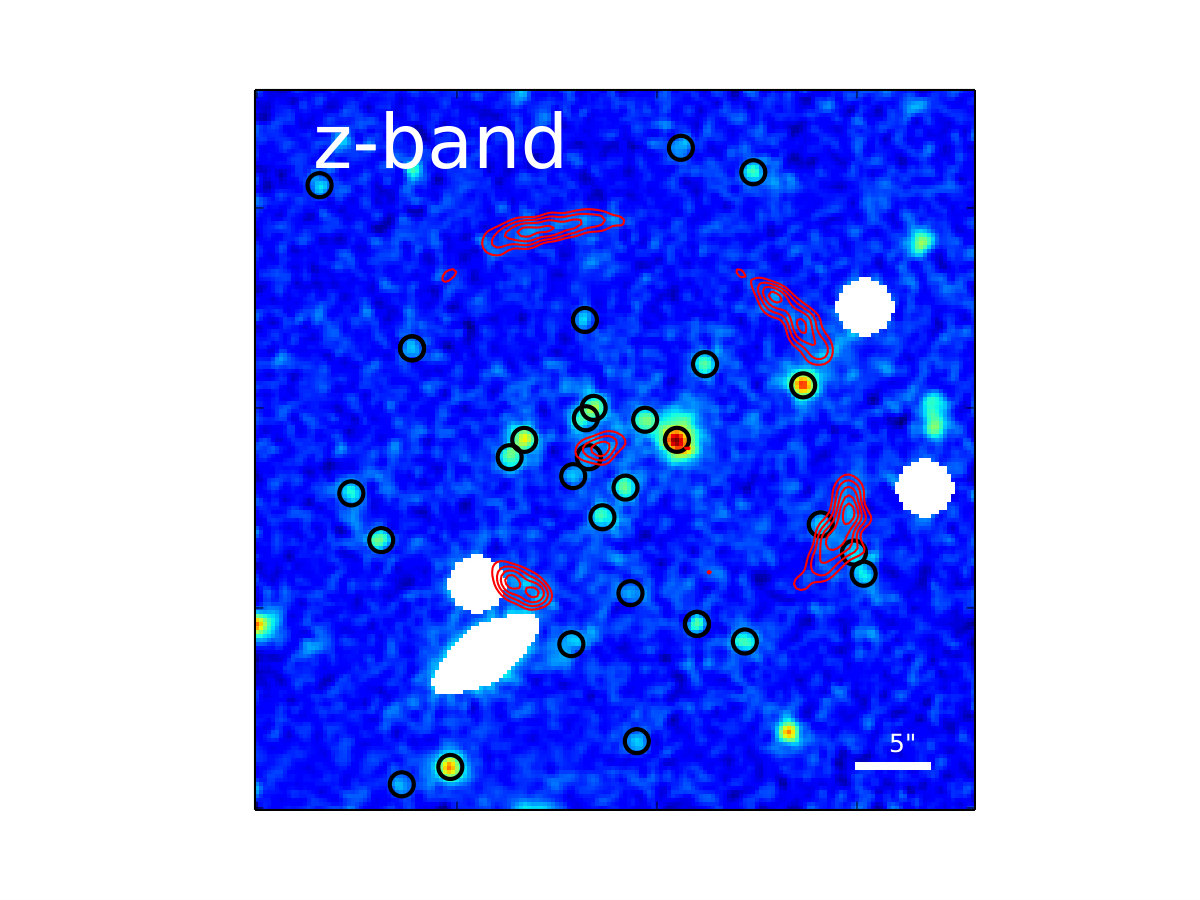 Figure 7
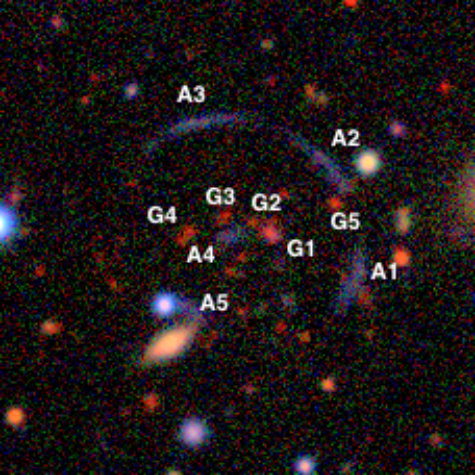 Figure 8
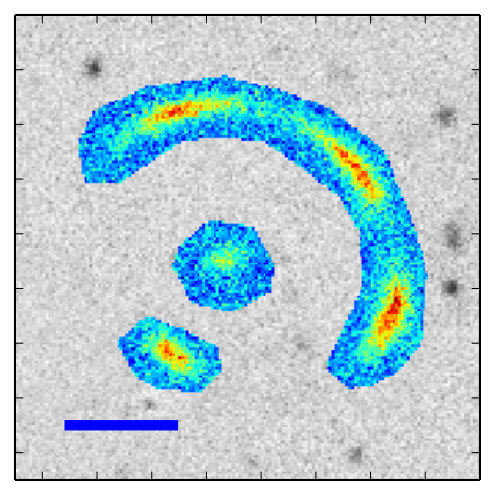 Figure 9
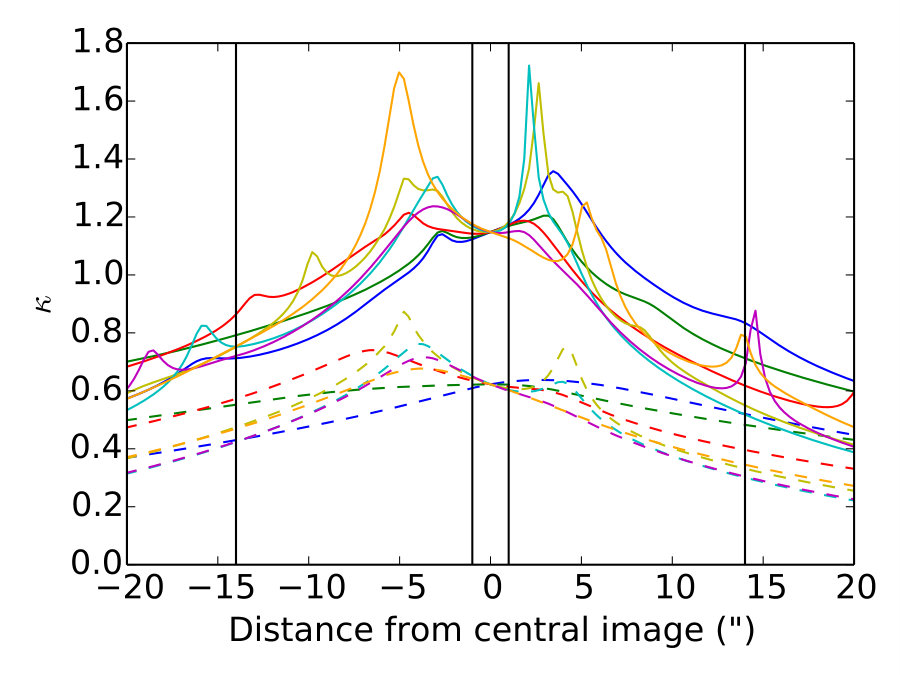 Figure 10
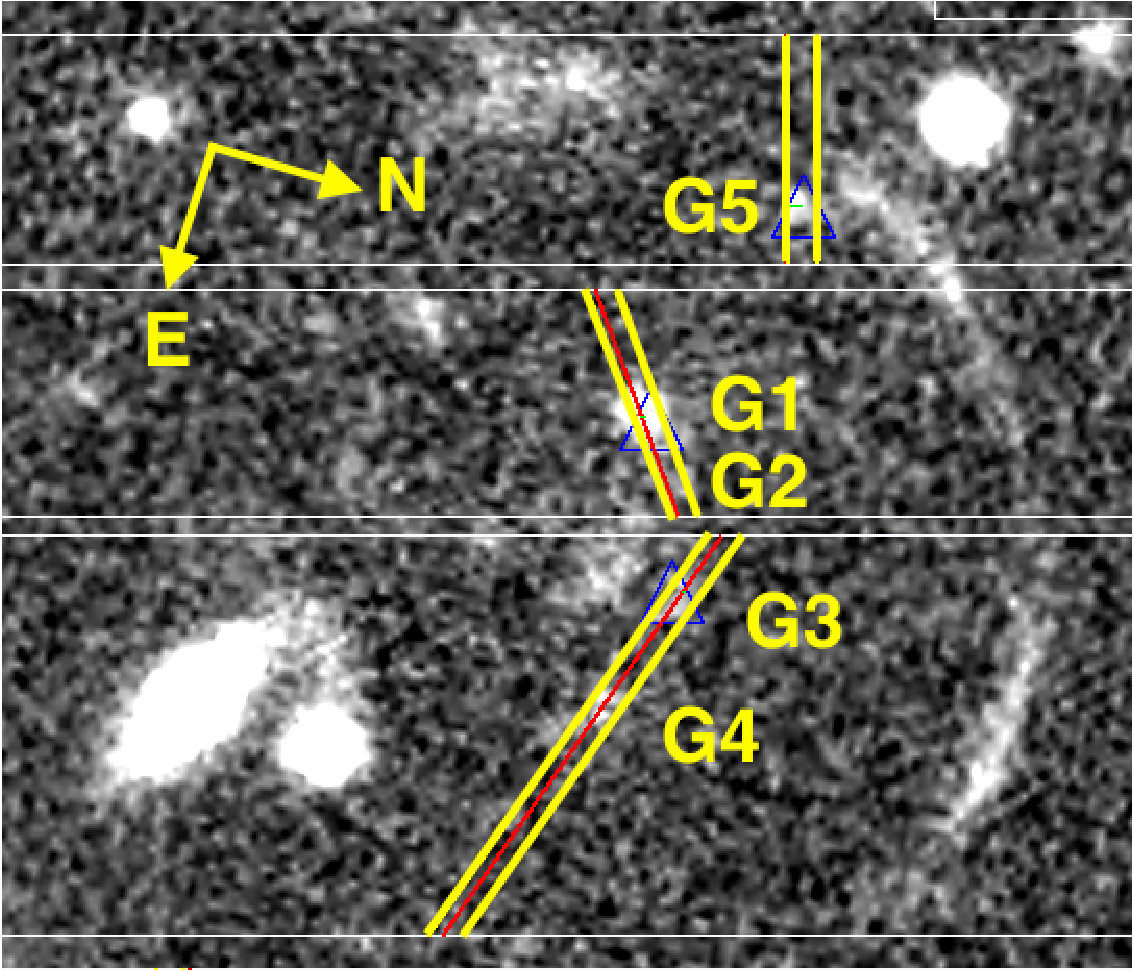 Figure 11
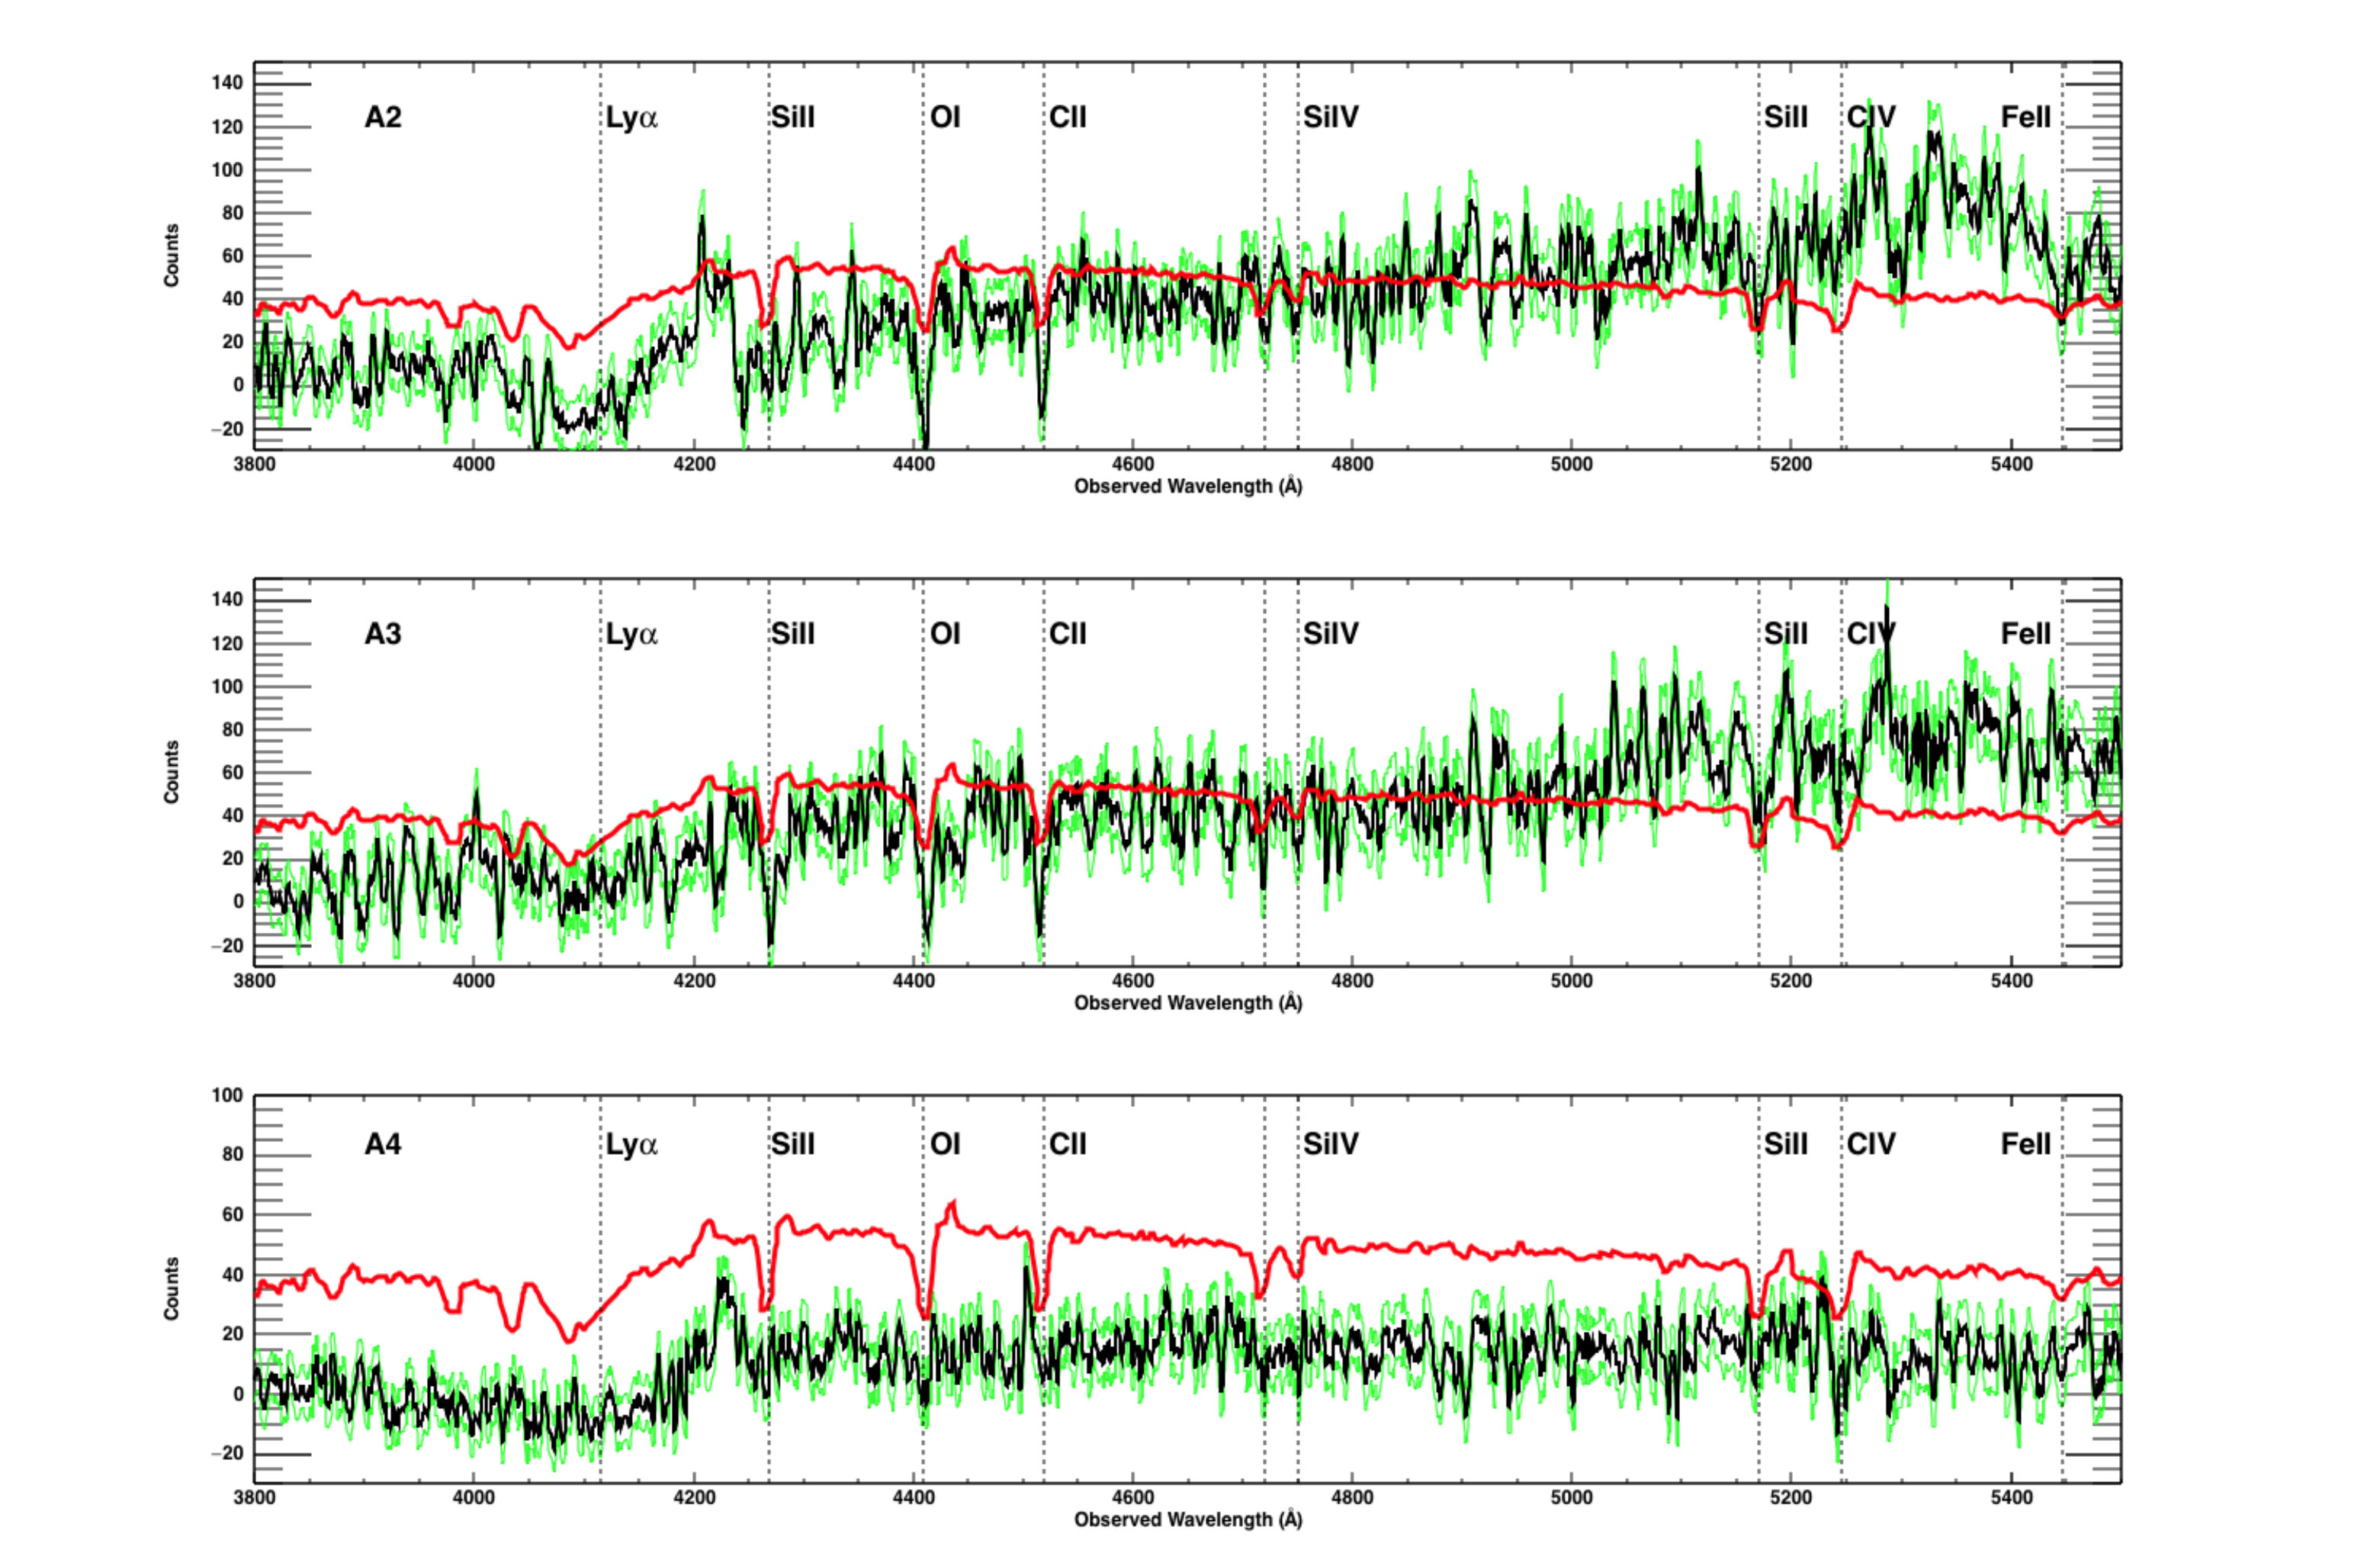 Figure 12
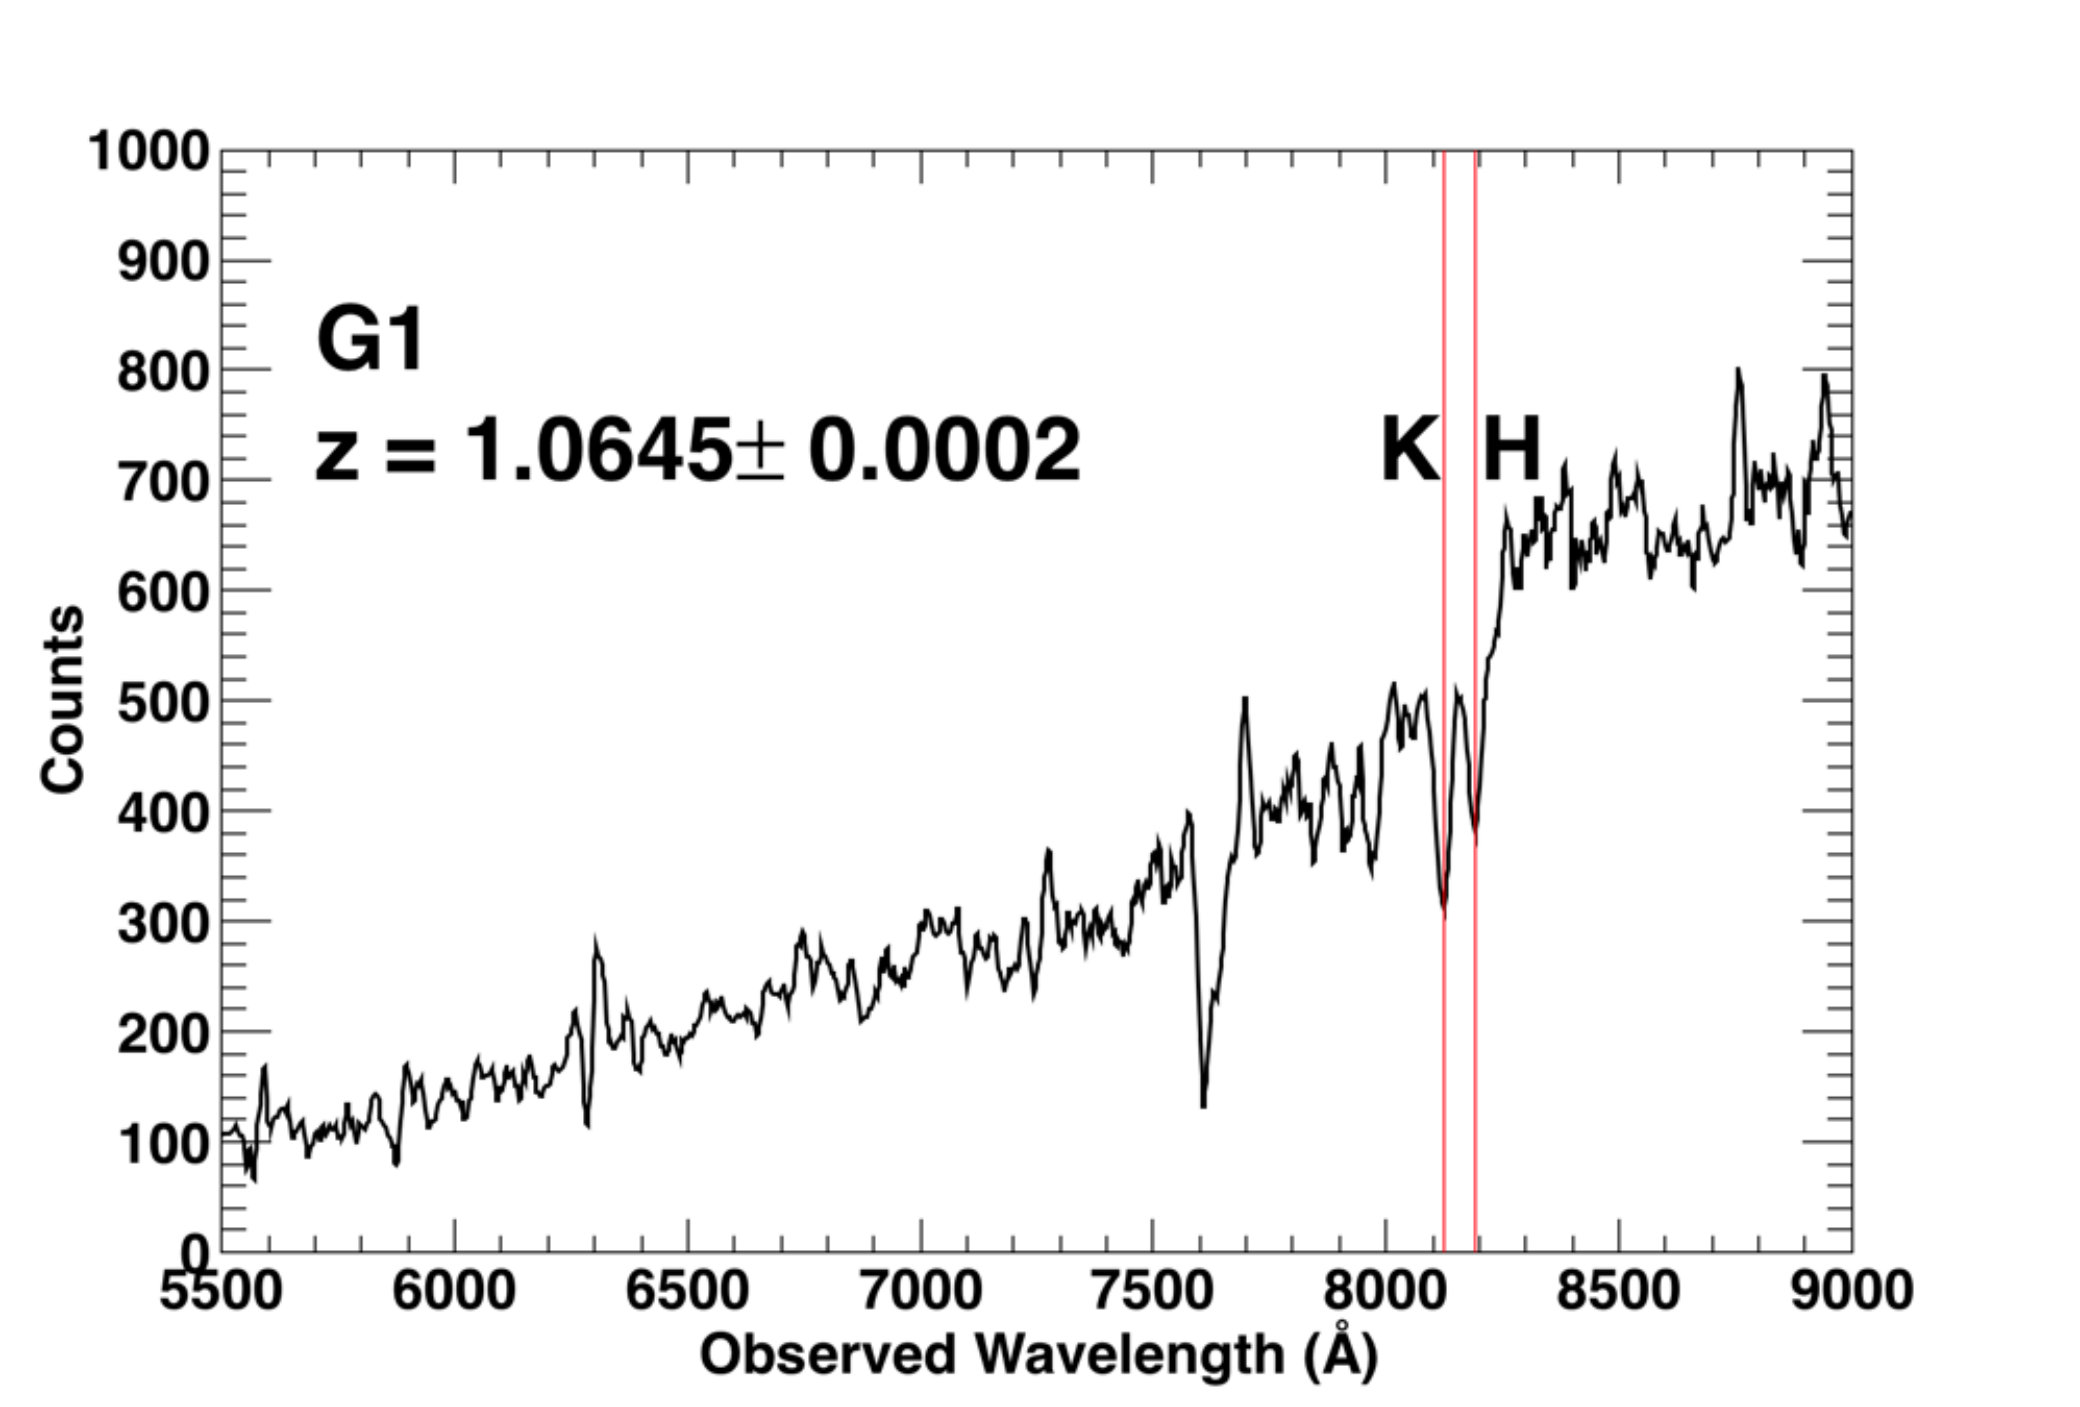 Figure 13
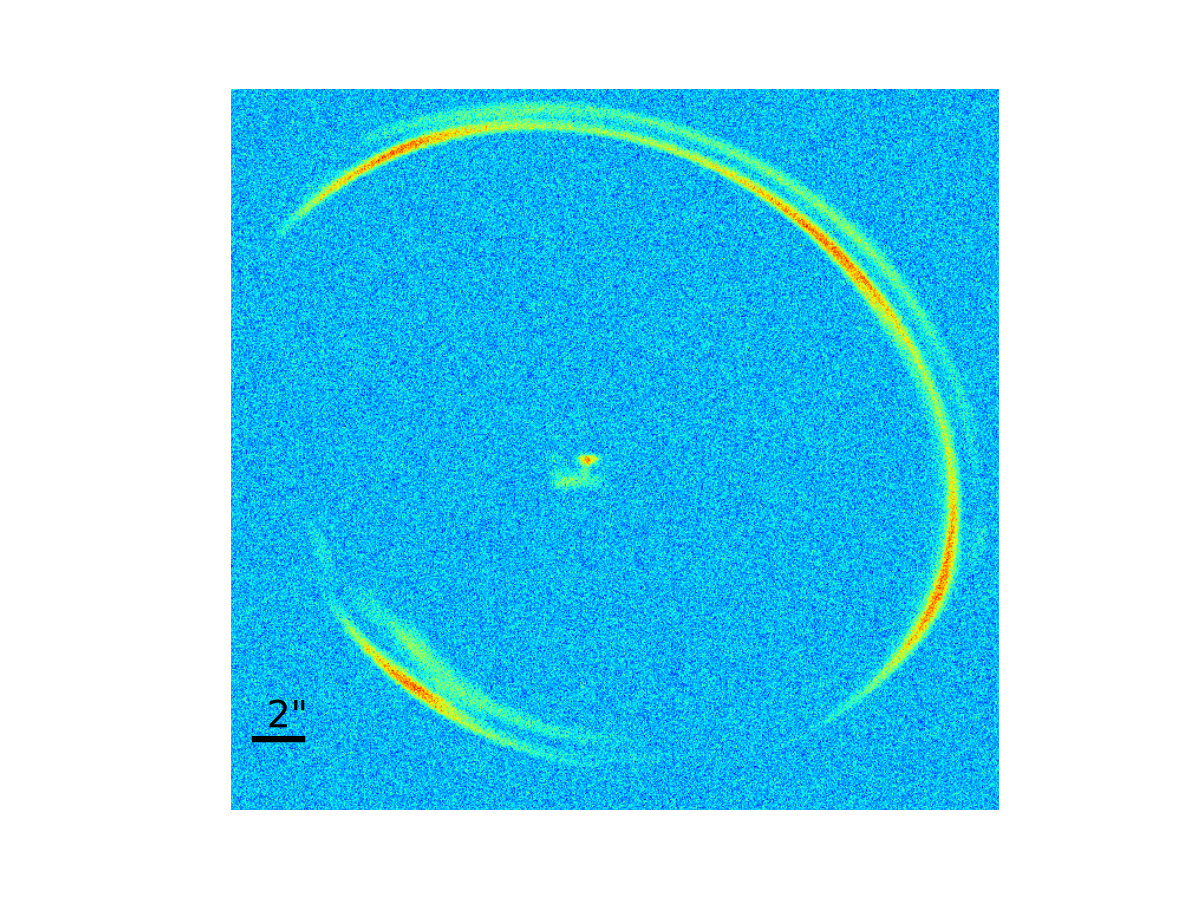 Figure 14
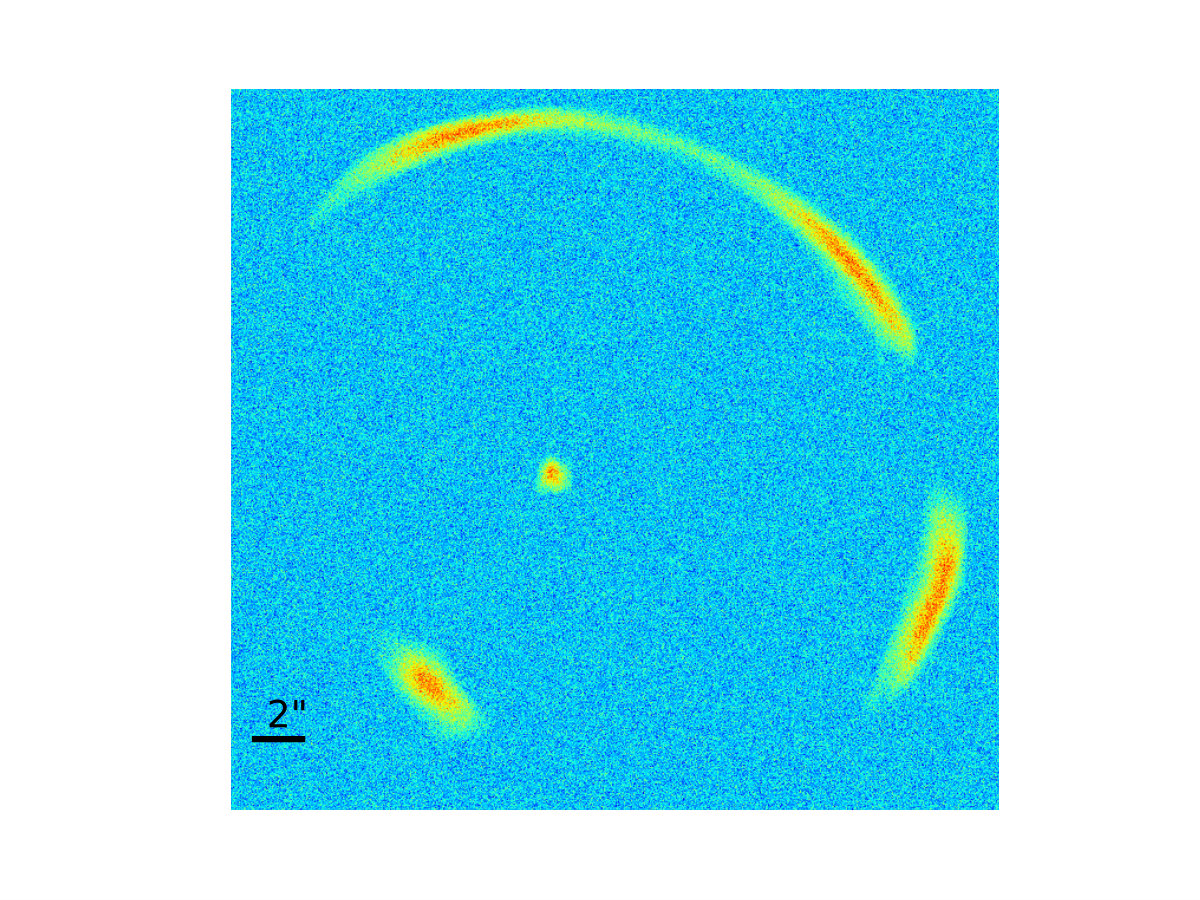 Figure 15
| Object | UT Date | Telescope- | Grating | Total Integration | Seeing |
|---|---|---|---|---|---|
| Instrument | (hours) | () | |||
| Arcs | 2014 Oct 20,24 | Gemini-GMOS | B600 | 3 | 0.86,0.66 |
| Arcs | 2015 Jul 17,19 | Gemini-GMOS | R150 | 0.93 | 0.9,1.06 |
| Lens | 2014 Oct 24 | Gemini-GMOS | R150 | 1 | 0.66 |
| Object | RA | DEC | Redshift | R-value |
|---|---|---|---|---|
| A2 | 302.777796 | -52.468769 | 4.62 | |
| A3 | 302.785149 | -52.467079 | 5.34 | |
| A4 | 302.783661 | -52.471130 | 2.26 |
| Object | RA | DEC | Redshift |
|---|---|---|---|
| G1 | 302.78122 | -52.47105 | |
| G2 | 302.78244 | -52.47035 | |
| G3 | 302.78418 | -52.47032 | |
| G4 | 302.78605 | -52.47087 | |
| G5 | 302.77766 | -52.46994 |
| Parameter | (kpc) | |||||||||
|---|---|---|---|---|---|---|---|---|---|---|
| Inference |
| Parameter | (kpc) | |||||||
|---|---|---|---|---|---|---|---|---|
| Inference | ||||||||
| Parameter | (kpc) | |||||||
| Inference |
Peer Reviews
No public reviews on file for this paper yet. If you reviewed it on a platform where reviews are public (OpenReview, ICLR, NeurIPS, ICML), you can paste yours below so the community can read it here.
Videos
No videos yet. Explain this paper in a talk, walkthrough, or lecture? Add one.
Core or cusps: The central dark matter profile of a redshift one strong lensing cluster with a bright central image
Thomas E. Collett1, Elizabeth Buckley-Geer2, Huan Lin2, David Bacon1, Robert C. Nichol1, Brian Nord2, Xan Morice-Atkinson1, Adam Amara3, Simon Birrer4,3, Nikolay Kuropatkin2, Anupreeta More5, Casey Papovich6, Kathy K. Romer7, Nicolas Tessore8, Tim M. C. Abbott9, Sahar Allam2, James Annis2, Aurélien Benoit-Lévy10,11,12, David Brooks11, David L. Burke13,14, Matias Carrasco Kind15,16, Francisco Javier J. Castander17, Chris B. D’Andrea18, Luiz N. da Costa19,20, Shantanu Desai21, H. Thomas Diehl2, Peter Doel11, Tim F. Eifler22,23, Brenna Flaugher2, Josh Frieman2,24, David W. Gerdes25,26, Daniel A. Goldstein27,28, Daniel Gruen13,14, Julia Gschwend19,20, Gaston Gutierrez2, David J. James29,9, Kyler Kuehn30, Steve Kuhlmann31, Ofer Lahav11, Ting S. Li2,6, Marcos Lima32,19, Marcio A. G. Maia19,20, Marisa March18, Jennifer L. Marshall6, Paul Martini33,34, Peter Melchior35, Ramon Miquel36,37, Andrés A. Plazas23, Eli S. Rykoff13,14, Eusebio Sanchez38, Vic Scarpine2, Rafe Schindler14, Michael Schubnell26, Ignacio Sevilla-Noarbe38, Mathew Smith39, Flavia Sobreira40,19, Eric Suchyta41, Molly E. C. Swanson16, Gregory Tarle26, Douglas L. Tucker2, Alistair R. Walker9
1Institute of Cosmology & Gravitation, University of Portsmouth, Portsmouth, PO1 3FX, UK
2Fermi National Accelerator Laboratory, P. O. Box 500, Batavia, IL 60510, USA
3Department of Physics, ETH Zurich, Wolfgang-Pauli-Strasse 16, CH-8093 Zurich, Switzerland
4Department of Physics and Astronomy, UCLA, PAB, 430 Portola Plaza, Box 951547, Los Angeles, CA 90095-1547, USA
5Kavli IPMU (WPI), UTIAS, The University of Tokyo, Kashiwa, Chiba 277-8583, Japan
6George P. and Cynthia Woods Mitchell Institute for Fundamental Physics and Astronomy, and Department of Physics and Astronomy, Texas A&M University, College Station, TX 77843, USA
7Department of Physics and Astronomy, Pevensey Building, University of Sussex, Brighton, BN1 9QH, UK
8Jodrell Bank Center for Astrophysics, School of Physics and Astronomy, University of Manchester, Oxford Road, Manchester, M13 9PL, UK
9Cerro Tololo Inter-American Observatory, National Optical Astronomy Observatory, Casilla 603, La Serena, Chile
10CNRS, UMR 7095, Institut d’Astrophysique de Paris, F-75014, Paris, France
11Department of Physics & Astronomy, University College London, Gower Street, London, WC1E 6BT, UK
12Sorbonne Universités, UPMC Univ Paris 06, UMR 7095, Institut d’Astrophysique de Paris, F-75014, Paris, France
13Kavli Institute for Particle Astrophysics & Cosmology, P. O. Box 2450, Stanford University, Stanford, CA 94305, USA
14SLAC National Accelerator Laboratory, Menlo Park, CA 94025, USA
15Department of Astronomy, University of Illinois, 1002 W. Green Street, Urbana, IL 61801, USA
16National Center for Supercomputing Applications, 1205 West Clark St., Urbana, IL 61801, USA
17Institut de Ciències de l’Espai, IEEC-CSIC, Campus UAB, Carrer de Can Magrans, s/n, 08193 Bellaterra, Barcelona, Spain
18Department of Physics and Astronomy, University of Pennsylvania, Philadelphia, PA 19104, USA
19Laboratório Interinstitucional de e-Astronomia - LIneA, Rua Gal. José Cristino 77, Rio de Janeiro, RJ - 20921-400, Brazil
20Observatório Nacional, Rua Gal. José Cristino 77, Rio de Janeiro, RJ - 20921-400, Brazil
21Department of Physics, IIT Hyderabad, Kandi, Telangana 502285, India
22Department of Physics, California Institute of Technology, Pasadena, CA 91125, USA
23Jet Propulsion Laboratory, California Institute of Technology, 4800 Oak Grove Dr., Pasadena, CA 91109, USA
24Kavli Institute for Cosmological Physics, University of Chicago, Chicago, IL 60637, USA
25Department of Astronomy, University of Michigan, Ann Arbor, MI 48109, USA
26Department of Physics, University of Michigan, Ann Arbor, MI 48109, USA
27Department of Astronomy, University of California, Berkeley, 501 Campbell Hall, Berkeley, CA 94720, USA
28Lawrence Berkeley National Laboratory, 1 Cyclotron Road, Berkeley, CA 94720, USA
29Astronomy Department, University of Washington, Box 351580, Seattle, WA 98195, USA
30Australian Astronomical Observatory, North Ryde, NSW 2113, Australia
31Argonne National Laboratory, 9700 South Cass Avenue, Lemont, IL 60439, USA
32Departamento de Física Matemática, Instituto de Física, Universidade de São Paulo, CP 66318, CEP 05314-970, São Paulo, SP, Brazil
33Center for Cosmology and Astro-Particle Physics, The Ohio State University, Columbus, OH 43210, USA
34Department of Astronomy, The Ohio State University, Columbus, OH 43210, USA
35Department of Astrophysical Sciences, Princeton University, Peyton Hall, Princeton, NJ 08544, USA
36Institució Catalana de Recerca i Estudis Avançats, E-08010 Barcelona, Spain
37Institut de Física d’Altes Energies (IFAE), The Barcelona Institute of Science and Technology, Campus UAB, 08193 Bellaterra (Barcelona) Spain
38Centro de Investigaciones Energéticas, Medioambientales y Tecnológicas (CIEMAT), Madrid, Spain
39School of Physics and Astronomy, University of Southampton, Southampton, SO17 1BJ, UK
40Instituto de Física Gleb Wataghin, Universidade Estadual de Campinas, 13083-859, Campinas, SP, Brazil
41Computer Science and Mathematics Division, Oak Ridge National Laboratory, Oak Ridge, TN 37831
Abstract
We report on SPT-CLJ2011-5228, a giant system of arcs created by a cluster at . The arc system is notable for the presence of a bright central image. The source is a Lyman Break galaxy at and the mass enclosed within the 14 arc second radius Einstein ring is . We perform a full light profile reconstruction of the lensed images to precisely infer the parameters of the mass distribution. The brightness of the central image demands that the central total density profile of the lens be shallow. By fitting the dark matter as a generalized Navarro-Frenk-White profile—with a free parameter for the inner density slope—we find that the break radius is kpc, and that the inner density falls with radius to the power at 68 percent confidence. Such a shallow profile is in strong tension with our understanding of relaxed cold dark matter halos; dark matter only simulations predict the inner density should fall as . The tension can be alleviated if this cluster is in fact a merger; a two halo model can also reconstruct the data, with both clumps (density going as and ) much more consistent with predictions from dark matter only simulations. At the resolution of our Dark Energy Survey imaging, we are unable to choose between these two models, but we make predictions for forthcoming Hubble Space Telescope imaging that will decisively distinguish between them.
Subject headings:
gravitational lensing: strong
1. Introduction
Cosmological cold dark matter (CDM) simulations suggest a model of hierarchical structure formation that produces a cuspy dark matter (DM) profile. Navarro et al. (1996) found that the halo profiles are universal and well fit by the form
[TABLE]
The mass of a Navarro-Frenk-White (NFW) halo and the scale radius are the only free parameters, and CDM simulations show that these parameters are connected—with some scatter—by a mass–concentration relation (Duffy et al., 2010; Neto et al., 2007). However, baryonic physics complicates this simple cold dark matter picture (Gnedin et al., 2004): gas can radiatively cool and contract, dragging DM inwards and increasing the central density, but supernovae, active galactic nuclei and dynamical heating can inject energy into the interstellar medium, causing the halo to expand (Pontzen & Governato, 2012; Teyssier et al., 2011; Abadi et al., 2010; Laporte et al., 2012). Halos will also deviate from NFW if the dark matter is self interacting or if it has a large de Broglie wave length. In these cosmologies the dark matter self interaction creates a pressure that leads to the formation of central cores rather than high density cusps (Peter et al., 2013; Rocha et al., 2013; Vogelsberger, Zavala, & Loeb, 2012). The central density profiles of halos are therefore sensitive probes of both baryonic feedback effects and the CDM paradigm.
Observationally, it has been shown that NFW profiles do not reproduce the central regions of halos over a range of masses. On the scales of dwarf galaxies there is evidence for central dark matter cores (de Blok, McGaugh, & Rubin, 2001; Amorisco, Agnello, & Evans, 2013) derived from kinematic constraints, however recent simulations have cast doubt on the interpretation of these data (Pineda et al., 2017). On the scale of elliptical galaxies there is evidence for cuspy dark matter profiles that are much steeper than NFW. Sonnenfeld et al. (2012) find for an individual strong lensing galaxy with multiple background sources, and Grillo (2012) found that the average inner DM slope of 38 strong lenses is close to isothermal although these results depend on the assumed stellar mass-to-light ratio.
On the scale of galaxy clusters the central profiles are often seen to be flatter than NFW. Sand et al. (2004) found that for a sample of 6 strong lensing clusters. Work by Newman et al. (2013a) combining stellar kinematics with strong and weak lensing found that the total mass profile in their clusters was consistent with NFW. However, because the total mass profile in those clusters is dominated by the baryonic content of the brightest cluster galaxy (BCG) they inferred that the dark matter profile was significantly shallower than NFW (Newman et al., 2013b). However either a shallow central dark matter cusps or a cored NFW profile were able to reconstruct the data. Recently Oldham & Auger (2016) showed that the dark matter halo of M87 has a 19 kpc core although the core size is degenerate with orbital anisotropy.
The primary difficulty of previous work on clusters has been the presence of a massive galaxy that dominates the total mass profile at the centre of the cluster. Inference on the dark halo are therefore only as robust as the subtraction of the stellar component.
In this work we present imaging, spectroscopy and modelling of SPT-CLJ2011-5228 (hereafter J2011). J2011 is a cluster (Reichardt et al., 2013) at acting as a strong gravitational lens with an Einstein radius of arcsecond (Figure 1). The arc system is notable due to the presence of a bright central image. Central images are typically highly demagnified since in dense regions a small perturbation to the impact parameter of a light ray will produce a large change to the deflection angle. To date very few true central images are known (Sharon et al., 2012; Inada et al., 2005; Winn et al., 2004; Colley et al., 1996), and are typically highly demagnified. The presence of a bright central image in J2011 is therefore an exciting discovery and opens up the possibility to precisely constrain the central dark matter profile of this cluster.
In Section 2 of this paper we present our observations of J2011 using the Dark Energy Camera on the 4m Victor M. Blanco telescope and the GMOS spectrograph on the 8m Gemini South telescope. In Section 3, we describe our lens modelling approach for this lens and present the result of two models for the dark matter distribution in the lens; a one halo model representing a relaxed cluster scenario in Section 3.1 and a two halo model representing a merging scenario in 4. We provide interpretation of the results in Section 5 and conclude in Section 6. Unless otherwise stated, coordinates are measured West, North relative to 20:11:10.611, -52:28:40.12 (J2000) with a pixel size of 0.263 arcseconds. Throughout this work we assume a flat CDM cosmology with kms*-1Mpc-1* and (Planck Collaboration et al., 2016).
2. Discovery of a giant arc system in DES and SPT data
J2011 was first reported as one of the 224 galaxy clusters detected in the first 720 of the South Pole Telescope (SPT) Sunyaev-Zel’dovich (SZ) survey. The SPT data selection is described in Reichardt et al. (2013). The cluster has a reported mass of with a detection significance of 4.58 (Bleem et al., 2015). The SPT collaboration carried out follow-up optical and NIR imaging of these clusters using various telescopes and instruments as described in Song et al. (2012). In Table 3 of Song et al. (2012) this cluster is noted as having a strong lensing arc. This area of the SPT footprint was imaged as part of the Year 1 (Y1) observations (Diehl et al., 2014; Flaugher et al., 2015) of the Dark Energy Survey (Flaugher, 2005, DES). The DES subsequently rediscovered the system in a targeted visual search of all known SPT clusters in the Y1 footprint and separately in a visual search of red sources with multiple neighbours (H. T. Diehl in prep). The visual scans were performed on false-color PNG images, which are made by combining coaddition tiles into color images (da Costa, 2016).
2.1. DES Imaging
The lens modelling requires as input an image of the lensed arcs, a sigma image and a point-spread function (PSF) for each band. We use imaging from the first three years of DES to provide this data. The DESDM image processing pipeline (summarized in Balbinot et al., 2015 and described in detail in Sevilla et al., 2011; Desai et al., 2012; Mohr et al., 2012) carries out image coaddition for each band and creates a sigma image which is the total uncertainty on each pixel of the coadd image due to noise. The DESDM pipeline also fits a model of the PSF using PSFEX (Bertin, 2011; Bertin & Arnouts, 1996). The PSF model is used to generate a model star at the location of the cluster. The default DESDM sigma image only includes the noise from the sky photons and not the photons contributing to the objects in the image. We therefore modified and re-ran the image processing pipeline to generate a sigma image that also includes shot noise from the objects.
With our data, the lensed arc is brightest in the -band, where there is negligible contribution to the flux from the cluster members, since the Balmer break lies redward of the -band filter. There is however g-band emission close to arcs associated with two foreground stars (close to A2 and A5), a foreground galaxy (close to A5) plus emission from the BCG (which is close to the central image A4) (potentially produced by an AGN). These foregrounds are fitted with point sources for the stars, and Sérsic profiles for the BCG and foreground galaxy. To ensure flux from the arcs is not attributed to the foregrounds, we simultaneously model the foregrounds and arcs using an elliptical powerlaw density profile for the lens (Barkana, 1998) and a parametric source with three Sersic components222The powerlaw lens model fits the outer arcs well but does not reproduce the central image.. This lens model is then optimized and the g-band foregrounds subtracted. We use the foreground subtracted -band data for our lens modelling. The foreground subtracted -band data is shown in Figure 2; it is this data that we use for the lens modelling in Section 3.
2.2. Gemini Spectroscopy of J2011
We obtained spectroscopic follow-up observations with the Gemini Multi-Object Spectrograph (Hook et al., 2004, GMOS) on the Gemini South Telescope, as part of the Gemini Large and Long Program GS-2014B-LP-5333http://www.gemini.edu/?q=node/12238#Buckley.
We targeted four of the red galaxies, labelled G1–G4 in Figure 1, in the center of the cluster including the Brightest Cluster Galaxy (BCG - labelled G1) along with another smaller galaxy close to arc A2 (labelled G5) and the arc features labelled A2–A4 using the multi-object mode on GMOS. We created two masks, one for the galaxies and the other for the arc features. The slits were in width and of varying length in order to accommodate both the object and an amount of sky sufficient to perform reliable background subtraction. For some of the objects, we tilted the slits to maximize the captured flux. The two masks are shown in Figure 3.
We observed the galaxies and arcs using two configurations with GMOS to cover the full wavelength range from . We use the R150 grating in conjunction with the GG455 filter in order to obtain spectra with wavelength coverage Å. If the source is a late-type emission line galaxy, this would allow us, in most cases, to detect [OII]3727 to , to and in the range . We use the B600 grating to obtain spectral coverage of Å, which would allow us to detect sources with that emit . The observations are summarized in Table 1. The seeing is taken from the Gemini data quality assessment.
An observing sequence consisted of a pair of exposures, followed by a flat-field taken with a quartz-halogen lamp and a calibration spectrum taken with a CuAr arc lamp. We then dithered to a different central wavelength to cover the gap between the CCDs and took a CuAr spectrum, followed by the flat-field exposure and then two more exposures. Exposure times were either 900 seconds or 840 seconds. Dividing the integration time into multiple exposures facilitates the removal of cosmic rays. The data were binned , giving effective dispersions of and nm/pixel for the B600 and R150 gratings, respectively.
We used the Gemini IRAF package v2.16444http://www.gemini.edu/sciops/data-and-results/processing-software to reduce all exposures. In each system, for each wavelength dither, we first process the flat field using the gsflat task (this includes subtraction of the bias). Each science exposure in a single dither is then reduced with gsreduce (using the previously processed flat fields), and then the two exposures are combined with gemcombine. Wavelength calibration and transformation are performed on each dither (using the gswavelength and gstransform tasks) before the pairs of dithers are coadded on a common wavelength scale to eliminate CCD chip gaps. We perform sky subtraction and 1D spectral extraction using gsextract, which employs the apall task. Feature identification and redshift estimation are performed using the rvsao IRAF package (Kurtz & Mink, 1998).
2.2.1 Redshift of the lens
The extracted un-fluxed 1-D spectra for the BCG (G1) is shown in Figure 4. The characteristic Ca H and K absorption lines present in early type galaxy spectra are visible in the spectra of all five galaxies at and respectively (indicated by the red lines in Figure 4). The redshifts obtained for the five galaxies G1-G5 using a cross-correlation technique (Kurtz & Mink, 1998, XCSAO) are listed in Table 3. The BCG has a redshift of . The average redshift of the five galaxies is . In addition we obtained spectra for two additional galaxies that are likely to be members of the cluster as they have very similar redshifts. They are both about 1.5 arcmin from the cluster center with redshifts of and .
2.2.2 Redshift of the source
The extracted un-fluxed spectra and their errors (green spectra) for the arcs A2 thru A4 are shown in Figure 5 for the B600 grating. We detected continuum flux in all three arcs but no obvious emission line features. We do however observe a break in the spectrum at around and absorption features at , and . These features are indicative of those found in the spectra of a Lyman Break Galaxy (LBG) (Steidel et al., 2004) but with Ly absorption rather than emission. We perform a cross-correlation (Kurtz & Mink, 1998, XCSAO) against the LBG template of Shapley et al. (2003) for all three arcs. The results are listed in Table 2. The R value in Table 2 provides a measure of the confidence of the redshift extraction and the uncertainty (Tonry & Davis, 1979). The R values for A2 and A3 are both greater than 4 which is an indication of a secure redshift (as defined by Kurtz & Mink (1998)). The R value for A4 is lower and reflects the lower signal to noise in the spectrum. However the presence of a break in the spectrum at around consistent with the ones observed in A2 and A3 and the resulting redshift which is consistent with those obtained from A2 and A3 give us confidence that A4 is indeed a lensed image of the source galaxy. The mean redshift from the three arcs is . Figure 5 shows the locations of the expected spectral features for an LBG and the red spectrum is the LBG template of Shapley et al. (2003) shifted by the measured redshift. The redshift of the lens and source imply a total mass within the Einstein radius of .
3. Lens modelling of the lensed arcs and central image
We model J2011 with a cluster-scale dark matter halo plus subhalos to describe the baryons and dark matter associated with the cluster members and a single Sérsic component light profile to describe the source. The presence of the central image gives us a unique opportunity to test the central density profile of the DM halo. We therefore fit the dark matter with a generalized NFW profile (Wyithe et al., 2001). This allows us to test models with central cores or shallow cusps.
For the generalized NFW profile we assume the form
[TABLE]
where is the three dimensional distance from the halo centre. The profile is characterised by an inner slope, , with the density falling as , an outer profile slope 3 and a break radius . The case of is approximately the NFW profile but with a slightly different behaviour in the turnover region. Using in the denominator rather than has the advantage that deflection angles for the spherical model can be calculated analytically (Muñoz, Kochanek, & Keeton, 2001). For computational efficiency we include ellipticity in the lensing potential rather than the density profile; this is a good approximation for almost spherical halos (Barkana, 1998).
In addition to the cluster scale dark matter halo(es), mass is associated with the individual cluster members (Shaw et al., 2006). We account for this mass by placing isothermal mass clumps in the locations where cluster members are observed. Using the z-band data, we fit the BCG light profile with an elliptical Sérsic profile, and model the other cluster members with circular de Vaucoleurs profiles. For the BCG the ellipticity and position angle of the mass is fixed to those observed for the light profile. The other cluster members are modelled as isothermal spheres. In order to minimimize the number of free parameters in the model, we assume a constant mass-to-light ratio for all the cluster members. The Einstein radius of each component is proportional to the square root of the fitted z-band flux of each component: the constant of proportionality, , is a free parameter of the model, is scaled in units such that it is also the Einstein radius of the BCG in arcseconds. The cluster members included in our model are shown in Figure 6.
The final component of the lens model is an external shear, which allows for perturbative lensing from nearby perturbers (e.g. Holder & Schechter, 2003) and line-of-sight structures (e.g. Collett et al., 2013; McCully et al., 2017).
In order to fully exploit the information content of the central image it is necessary to attempt to reconstruct the light profiles of the lensed images. Full light profile fitting is more computationally challenging than conjugate point methods (as used in Jullo et al., 2007, for example), however it allows us to use the observed fluxes in many thousands of pixels as constraints on the lens model.
Full light profile fitting requires some assumptions to be made about the unlensed source. Simply parameterized sources are quick to calculate and are robust against predicting images where none are observed, although they often require many non-linear source model parameters (e.g. Brewer et al., 2011), and the extra sampling negates the computational benefits. More seriously the simplicity of the assumed light profile means that significant residuals are often present in regions of high magnification. These residuals cause simply parameterized sources to underestimate the uncertainties on the lens model (Collett & Auger, In Prep). Pixellated sources are much more agnostic about the source profile, yielding better fits to the data and more robust estimates of the lens model parameters. However this is only true when the lens model is reasonably close to truth: The high computational cost of pixellated source modelling means that only a small amount of data can be reconstructed—the region including and immediately surrounding the lensed images—and lens models that predict images outside of the reconstructed region are not penalized.
We therefore first optimize our models towards an approximate best fit assuming the brightest observed pixel of the five lensed images are conjugate points, and use this lens model to initialize our full light profile fitting. We only model the parts of the image plane that contain flux from the source (shown in Figure 2). To avoid the model predicting images outside of the masked region, we cast 100 pixels (outside of the mask) back onto the source plane and discard any model for which these pixels are within the source, defined as the smallest circle containing all five conjugate points. For the best fit model we also remodel the system with a much larger mask and verify visually that there are no extra images predicted.
For the source profile we adopt a pixellated source model, following the semilinear approach of Warren & Dye (2003). We use an adaptive 50 by 50 grid of square pixels as detailed in Collett & Auger (2014) in order to avoid artificially breaking the mass-sheet degeneracy (Falco, Gorenstein, & Shapiro, 1985). We use curvature regularised sources as favoured by the analysis of Suyu et al. (2006); the regularisation encodes the prior that astrophysical sources are reasonably smooth. We follow the Bayesian prescription of Suyu et al. (2006) and allow the data to tell us the optimal degree of source regularization for each iteration of the lens model.
Our lens model now has ten free non-linear parameters: two for the centroid of the halo (,), one for the Einstein radius of the main halo (), two for the ellipticity and position angle of the halo (,), the inner slope () and break radius of the halo (), two parameters for the external shear (,), and one for the mass-to-light ratio of the cluster members (). We probe the posterior of these non-linear parameters using a Markov Chain Monte Carlo method. We use the ensemble sampler of Foreman-Mackey et al. (2013).
3.1. Results: A shallow cusp in the Dark Matter Halo
Applying the model of the previous section to J2011, we find that the DES data can be well reconstructed with an astrophysically reasonable source and a plausible mass distribution for the lens. The best fit reconstruction of the data is shown in Figure 7. This model has an almost spherical dark matter halo with flattening , a shallow inner density slope, and a scale radius of 290 kpc, 2.2 percent of the mass within the Einstein radius is in subhalos. We see that the arcs and central image are reproduced with surprisingly small residuals given the simplicity of the mass model. The model slightly under predicts the flux of the central image, indicating that the true central profile may be shallower than quoted. Due to the 1 arcsecond seeing of our imaging, the reconstructed source is not well resolved, however the model predicts that the source has one bright clump and possibly two extended nearby features; this irregularity is typical of the blue sources reconstructed in previous strong lensing studies (e.g. Brewer et al., 2011; Shu et al., 2016).
Our MCMC results show that the DM halo requires a shallow central density profile. Figure 10 shows the marginalized two dimensional posterior for the DM halo properties. The inner slope, and scale radius are degenerate, however inner slopes steeper than and scale radii smaller than 100 kpc are strongly excluded, indicating that the central profile deviates from the NFW prediction of over a large radius. Marginalizing over the other parameters we derive 68 % confidence intervals of , and kpc. The halo flattening is constrained to be . The external shear is . And the constant of proportionality relating z-band flux to cluster member mass is , defined in units where is the Einstein radius of the BCG in arcseconds and the Einstein radii of the other members going as .
4. An alternative model: Two merging Dark Matter halos
In the previous Section we found that the arcs and central image cannot be adequately reconstructed by a single (non-generalized) NFW halo, however the generalized NFW gets very close to reproducing the lens system, despite only having a small number of free parameters.
However the fact that gNFW model requires a much shallower profile than simulations predict and the slight underfitting of the central image implies that the true mass distribution may be more complicated than our simple gNFW model allows. One alternative hypothesis is that J2011 is a merger of two (or more) sub halos. We test this theory by adding a second gNFW clump to the model used in the previous section. Since the halos are no longer guaranteed to be critical, we characterize them by their central convergence, , as defined in Equation 3 of Muñoz, Kochanek, & Keeton (2001) and not by their Einstein radius. We also do not include external shear in the two halo model as it is not required to reproduce the data. This model also prefers both halos to be approximately NFW. The model requires most of the mass to be in an almost spherical NFW halo, to the North West of the central image, with a less massive, highly flattened component to the South East. In this model twenty percent of the mass within the Einstein radius is associated with subhaloes. The central density of the two halos goes as radius to the powers and respectively. The break radii are kpc and kpc. We show the convergence map of the two dark matter halos in Figure 11.
Figure 12 shows the convergence of the total density profile for various slices through the central image. Despite the fact that the DM halos and the cluster members are cuspy, the sum of the components gives a remarkably flat profile at the location of the central image.
5. Interpretation of J2011 : a tension with CDM or a merger of two NFW halos?
Both the one and two halo models are able to reproduce the observed light profile of the arcs and the central image. The two halo model provides a somewhat better fit to the data. However, the log likelihood (base 10) of the residuals differ by only 17 totalled over 4892 pixels. The two halo model has 5 extra free parameters but also has a comparatively simpler source: the penalization term of the merit function (Suyu et al., 2006) prefers the two halo source by 19. Without the source penalization term, the Bayesian Information Criterion (Schwarz, 1978) would prefer the one halo model, however with the penalization term it prefers the two halo model.
The source penalization term of Suyu et al. (2006) is however designed to prefer smoother sources, rather than precisely encode a known astrophysical prior about the clumpiness of sources, it is therefore unclear how to use the regularization term in quantitative Bayesian model selection. This same issue has been tackled in time delay cosmography (Wong et al., 2016), with similarly unsatisfactory conclusions. We therefore conclude that with our data alone, both models are reasonable interpretations for this system.
Choosing between the two models thus reverts to astrophysical priors. From a physical perspective, neither model is totally satisfactory: in neither model is a DM halo centred on the BCG. For the one halo model the DM centroid is offset from the BCG by 30 kpc. For the two halo model, the main DM halo is centred around the clump of galaxies to the North West of the central image. The second DM halo is associated with the pair of galaxies to the South - although given the extreme elongation of this halo it may be more likely that these galaxies are associated with two separate DM halos. The offset between the DM and the BCG in the one halo model is physically unrealistic in CDM (Schaller et al., 2015), however since CDM should also not create giant dark matter cores, the two problems may be linked. In the two halo scenario it may not be surprising to see an offset between DM and the BCG as the system is not relaxed. The small Einstein radii of the cluster members in the one halo model is also in tension with the typical Einstein radii of galaxy-scale lenses at lower redshifts. The one halo model implies a maximum velocity dispersion of only 60 km/s for the BCG whilst the two halo model gives a velocity dispersion of km/s. This may rule out the one halo model, but it could also be due to our simplistic assumptions about the cluster member density profiles.
Both our models assume a single lens plane; neglecting lensing by mass along the line of sight (e.g. McCully et al., 2017). There is a foreground spiral galaxy centred 5 arcseconds South East of Arc 5 which we have neglected throughout this work, although it may contribute to the external shear of the one halo model. There is no evidence that it significantly modifies the lensing potential at Arc 5, but even small changes in the geometry of a compound lens can have a significant effect in rare cases (Collett & Bacon, 2016).
Conclusively discriminating between the two models presented in this work will require higher resolution imaging. HST program GO 14630 (PI: Collett) will observe J2011 in cycle 24 - and will trivially distinguish between the two models presented in this work777The HST data were taken shortly before submission of this paper. To avoid confirmation bias none of the authors of this paper (including the PI) had data access rights to view the HST data before this paper was submitted.. We show simulated HST images for this program in Figure 13. The figures are generated assuming the sources are no more clumpy than those reconstructed from the low resolution DES data.
It is clear from Figure 13 that whilst both models yield similar images in the DES data, the predictions for the HST data are very different, with both the shape of the central image and the radial width of the arcs providing tight constraints on the dark matter distribution.
6. Conclusions
In this work we have presented SPT-CLJ2011-5228, a giant system of arcs created by a cluster at possessing a unique central image. The cluster was already known from SPT Song et al. (2012), but we have added followup in the form of DES imaging and Gemini spectroscopy.
With our data we have been able to spectroscopically confirm the cluster redshift to be . The source is a Lyman Break Galaxy at , implying a total mass within the arc of , consistent with the SZ mass of (Bleem et al., 2015)
Irrespective of the source redshift we are able to model the density profile of the cluster. By describing the cluster as a single gNFW halo plus isothermal cluster members, we are able to reconstruct the arcs and central image so long as the DM halo is significantly shallower than NFW within the central kpc. We have also presented a two halo model that reproduces the images. In this model both halos are cuspy, but the total profile at the location of the central image is remarkably flat, allowing for the formation of a bright central image that is not demagnified.
At the signal-to-noise and resolution and of our imaging, the merger (two halo) model provides a somewhat better fit to the data than the shallow cusped (one halo) model, but at the expense of extra free parameters. Forthcoming HST imaging will be able to conclusively resolve between the shallow cusp and merger models. The stakes for these data are high, as the one halo model cannot be consistent with the concordance model of cold dark matter unless extreme amounts of baryonic feedback have re-sculpted the halo over hundreds of kiloparsecs. The forthcoming HST data will soon allow us to explain the unique central image of J2011, infer the dark matter profile in this system and perhaps shine a light on the nature of dark matter.
Acknowledgements
We thank the referee for their helpful comments in improving upon the original manuscript. We are grateful to Tomasso Treu and Wojciech Hellwing for fruitful discussions. TEC is grateful to Matt Auger for his significant contributions to the lens modelling code used in this work. We are grateful to Marusa Bradac and Matt Auger for encouraging us to investigate the merging halo scenario.
Funding for the DES Projects has been provided by the U.S. Department of Energy, the U.S. National Science Foundation, the Ministry of Science and Education of Spain, the Science and Technology Facilities Council of the United Kingdom, the Higher Education Funding Council for England, the National Center for Supercomputing Applications at the University of Illinois at Urbana-Champaign, the Kavli Institute of Cosmological Physics at the University of Chicago, the Center for Cosmology and Astro-Particle Physics at the Ohio State University, the Mitchell Institute for Fundamental Physics and Astronomy at Texas A&M University, Financiadora de Estudos e Projetos, Fundação Carlos Chagas Filho de Amparo à Pesquisa do Estado do Rio de Janeiro, Conselho Nacional de Desenvolvimento Científico e Tecnológico and the Ministério da Ciência, Tecnologia e Inovação, the Deutsche Forschungsgemeinschaft and the Collaborating Institutions in the Dark Energy Survey.
The Collaborating Institutions are Argonne National Laboratory, the University of California at Santa Cruz, the University of Cambridge, Centro de Investigaciones Energéticas, Medioambientales y Tecnológicas-Madrid, the University of Chicago, University College London, the DES-Brazil Consortium, the University of Edinburgh, the Eidgenössische Technische Hochschule (ETH) Zürich, Fermi National Accelerator Laboratory, the University of Illinois at Urbana-Champaign, the Institut de Ciències de l’Espai (IEEC/CSIC), the Institut de Física d’Altes Energies, Lawrence Berkeley National Laboratory, the Ludwig-Maximilians Universität München and the associated Excellence Cluster Universe, the University of Michigan, the National Optical Astronomy Observatory, the University of Nottingham, The Ohio State University, the University of Pennsylvania, the University of Portsmouth, SLAC National Accelerator Laboratory, Stanford University, the University of Sussex, Texas A&M University, and the OzDES Membership Consortium.
The DES data management system is supported by the National Science Foundation under Grant Number AST-1138766. The DES participants from Spanish institutions are partially supported by MINECO under grants AYA2015-71825, ESP2015-88861, FPA2015-68048, SEV-2012-0234, SEV-2012-0249, and MDM-2015-0509, some of which include ERDF funds from the European Union. IFAE is partially funded by the CERCA program of the Generalitat de Catalunya.
Based on observations obtained at the Gemini Observatory (processed using the Gemini IRAF package), which is operated by the Association of Universities for Research in Astronomy, Inc., under a cooperative agreement with the NSF on behalf of the Gemini partnership: the National Science Foundation (United States), the National Research Council (Canada), CONICYT (Chile), Ministerio de Ciencia, Tecnología e Innovación Productiva (Argentina), and Ministério da Ciência, Tecnologia e Inovação (Brazil).
The reference list from the paper itself. Each links out to its DOI / PubMed record.
- 1Abadi et al. (2010) Abadi M. G., Navarro J. F., Fardal M., Babul A., Steinmetz M., 2010, MNRAS, 407, 435
- 2Amorisco, Agnello, & Evans (2013) Amorisco N. C., Agnello A., Evans N. W., 2013, MNRAS, 429, L 89
- 3Balbinot et al. (2015) Balbinot E., et al., 2015, MNRAS, 449, 1129
- 4Barkana (1998) Barkana R., 1998, Ap J, 502, 531
- 5Benítez (2000) Benítez N., 2000, Ap J, 536, 571
- 6Bertin (2011) Bertin E., 2011, ASPC, 442, 435
- 7Bertin & Arnouts (1996) Bertin E., Arnouts S., 1996, A&AS, 117, 393
- 8Bleem et al. (2015) Bleem L. E., et al., 2015, Ap JS, 216, 27