Empirical study on social groups in pedestrian evacuation dynamics
Cornelia von Kr\"uchten, Andreas Schadschneider

TL;DR
This empirical study investigates how social groups within pedestrian crowds affect evacuation dynamics, revealing that group behavior can influence evacuation times and configurations, with larger groups potentially reducing evacuation times due to self-ordering effects.
Contribution
The paper introduces new parameters to quantify social group dynamics and configurations, providing empirical evidence on their impact during evacuations.
Findings
Large groups may decrease evacuation times due to self-ordering.
Social groups tend to form elliptical shapes aligned with movement.
Cooperative behavior increases group aggregation and causes intermittent evacuation patterns.
Abstract
Pedestrian crowds often include social groups, i.e. pedestrians that walk together because of social relationships. They show characteristic configurations and influence the dynamics of the entire crowd. In order to investigate the impact of social groups on evacuations we performed an empirical study with pupils. Several evacuation runs with groups of different sizes and different interactions were performed. New group parameters are introduced which allow to describe the dynamics of the groups and the configuration of the group members quantitatively. The analysis shows a possible decrease of evacuation times for large groups due to self-ordering effects. Social groups can be approximated as ellipses that orientate along their direction of motion. Furthermore, explicitly cooperative behaviour among group members leads to a stronger aggregation of group members and an intermittent way…
Click any figure to enlarge with its caption.
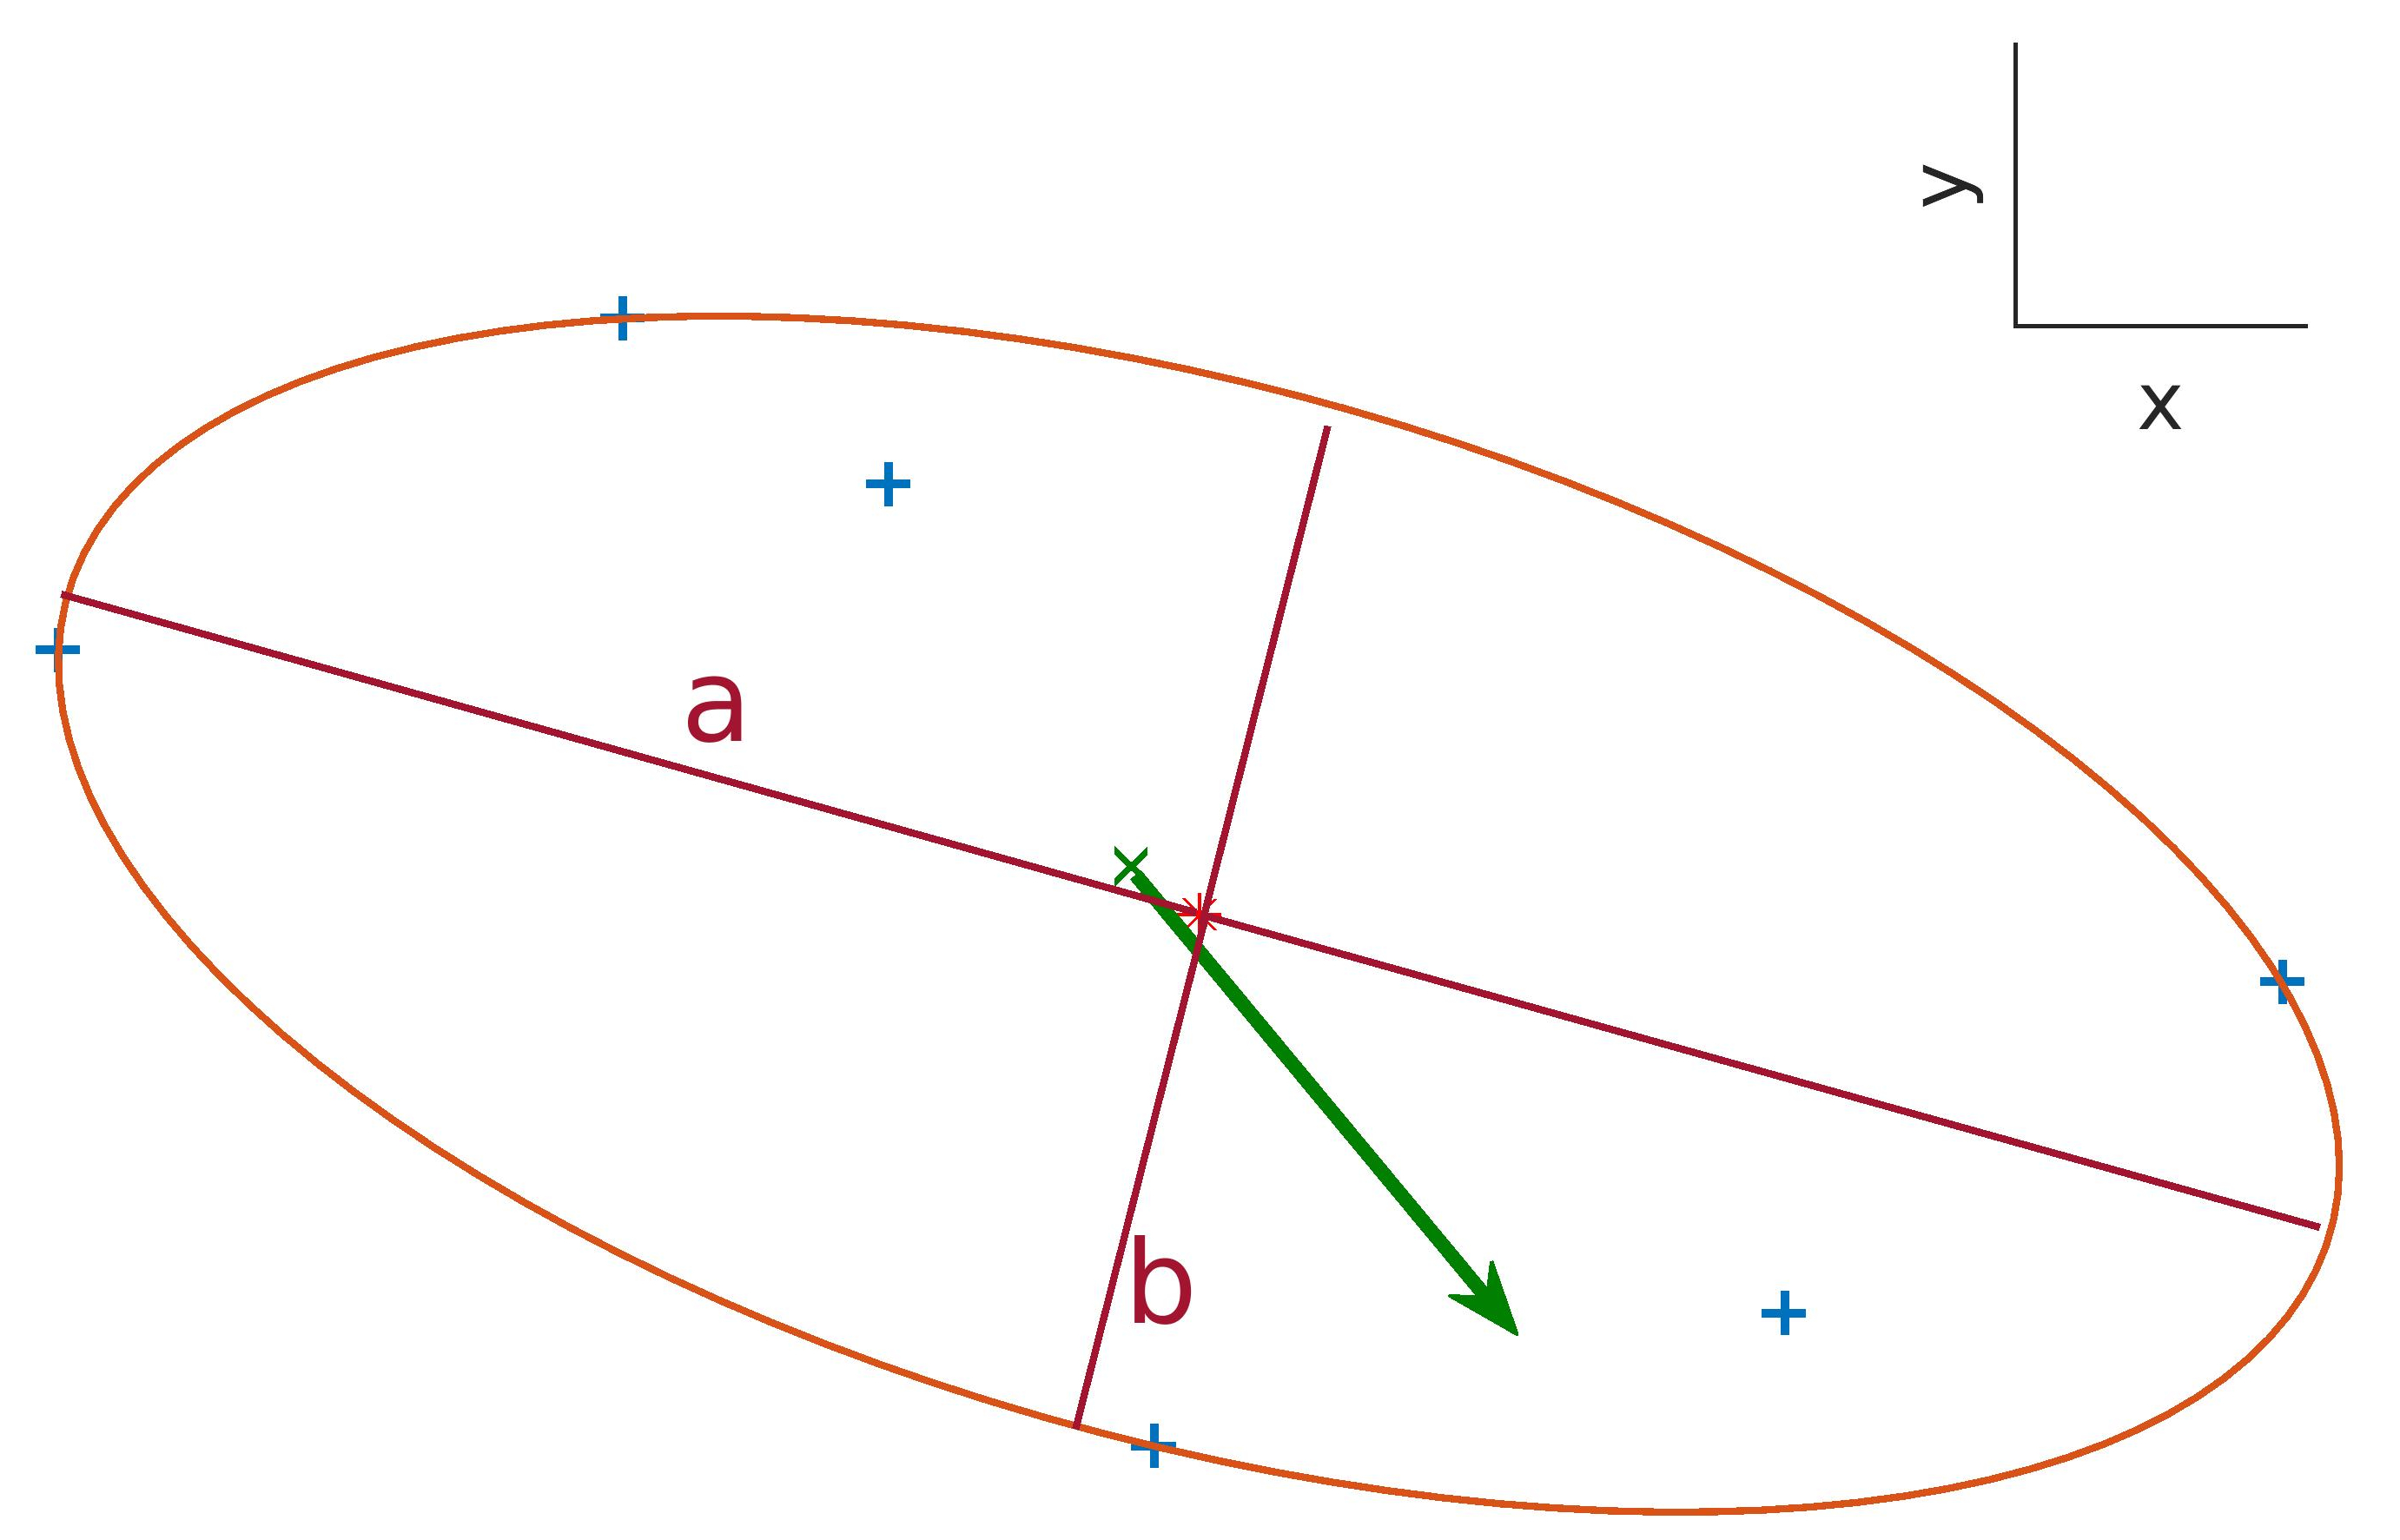 Figure 1
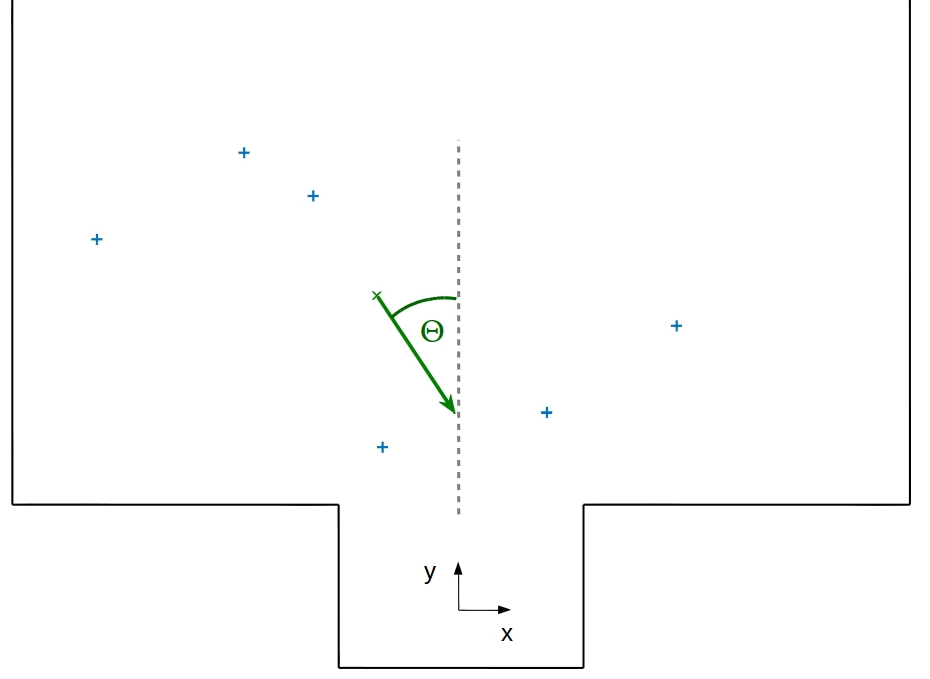 Figure 2
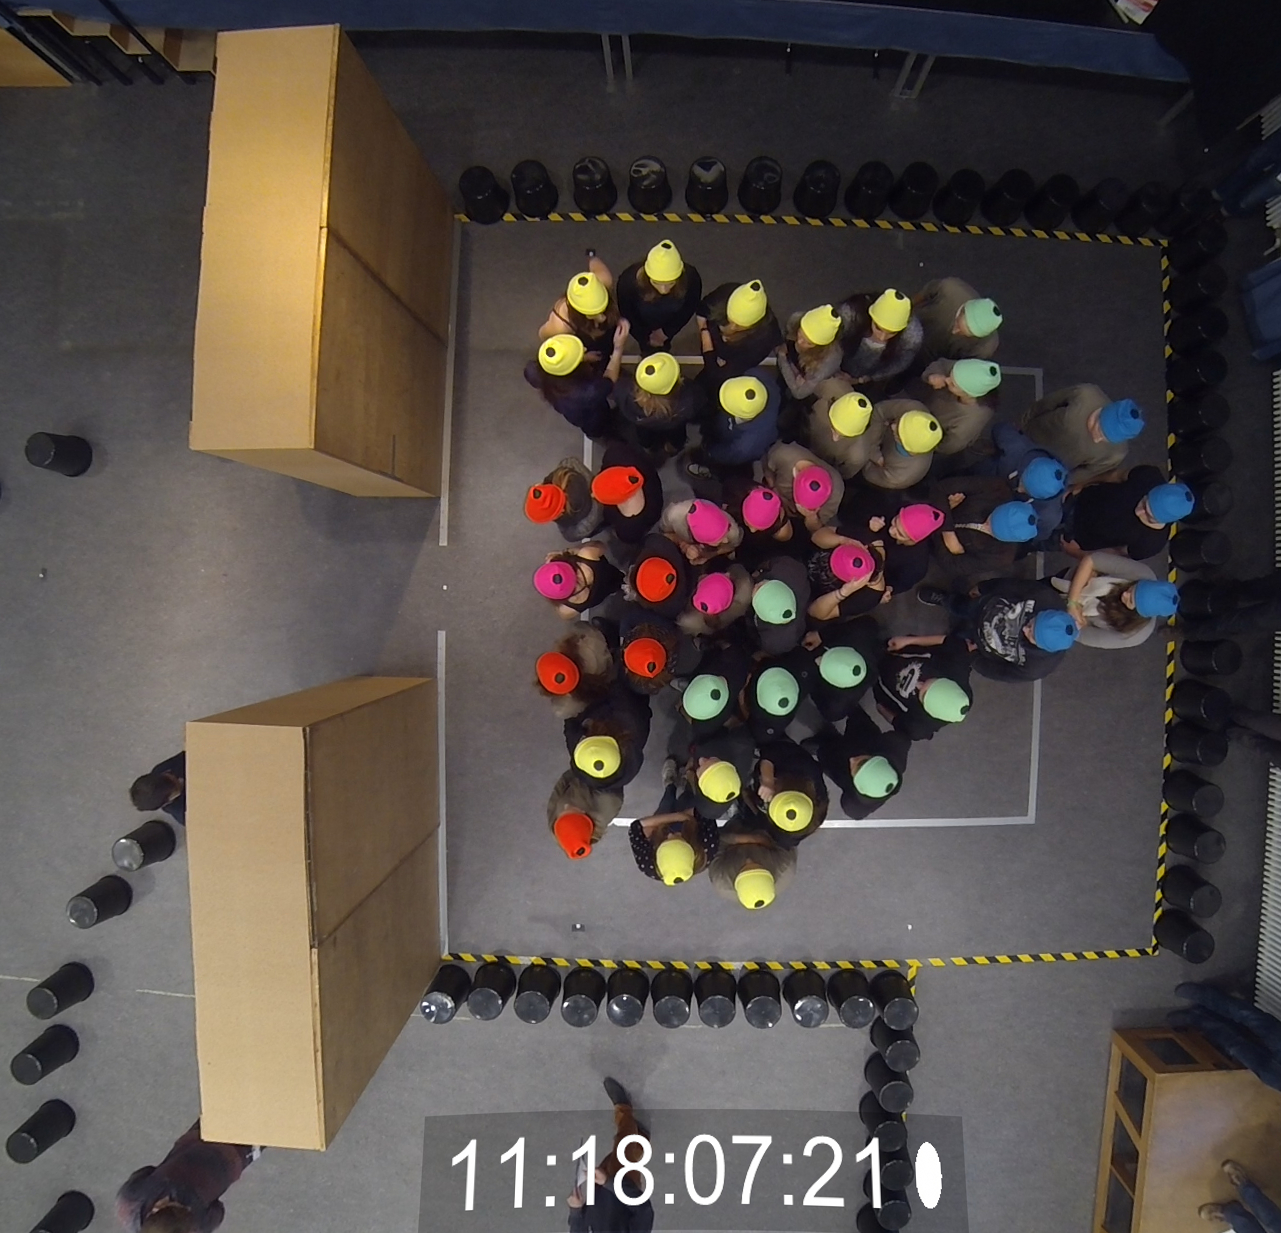 Figure 1
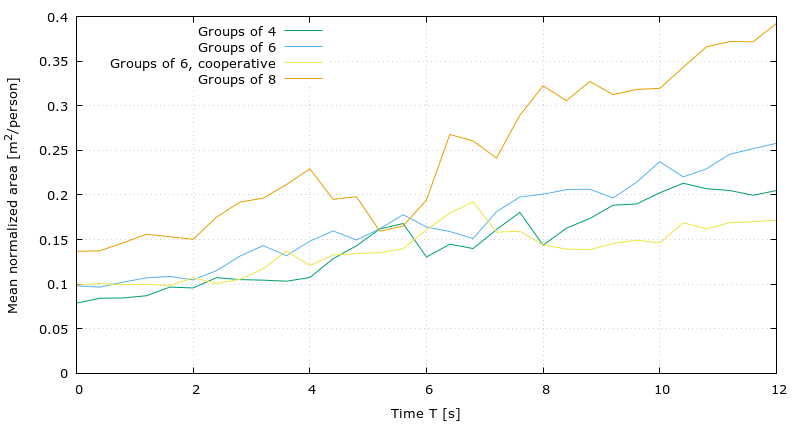 Figure 10
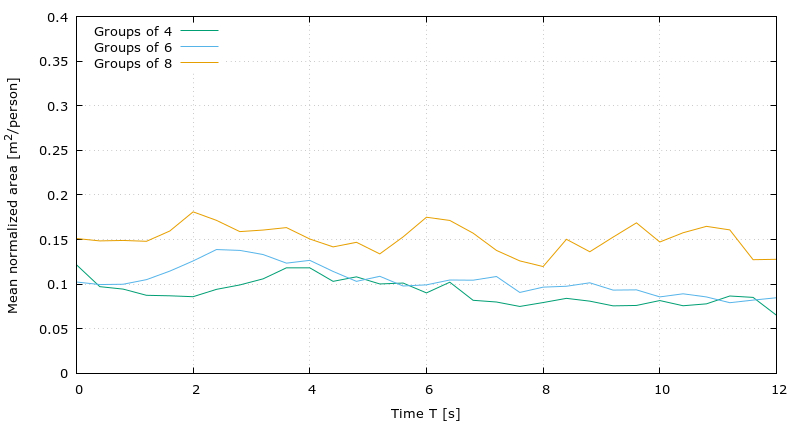 Figure 11
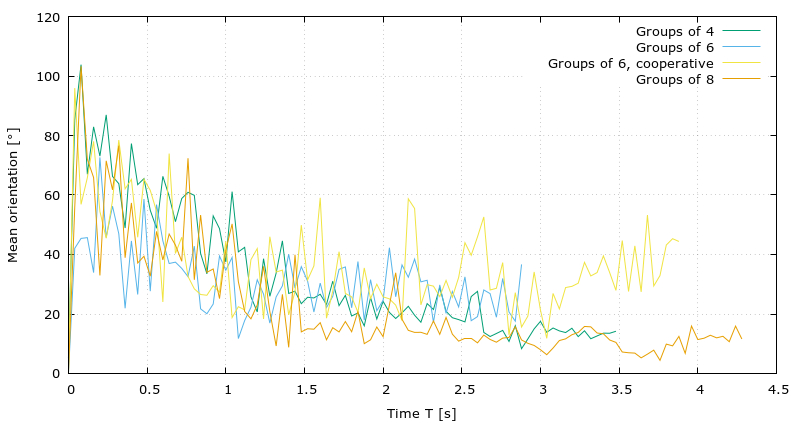 Figure 12
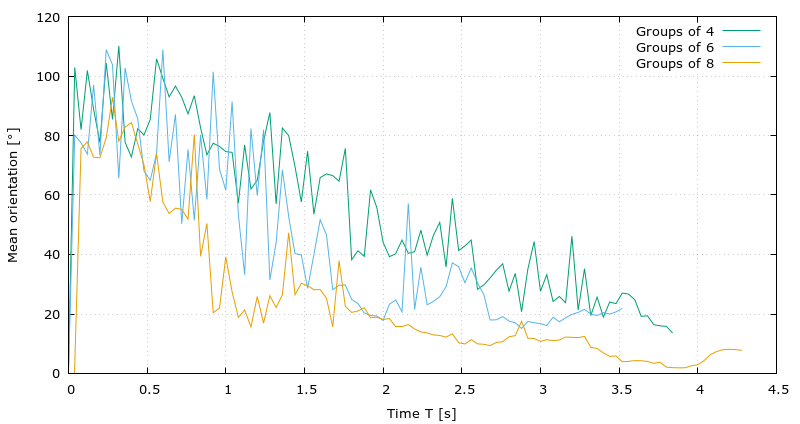 Figure 13
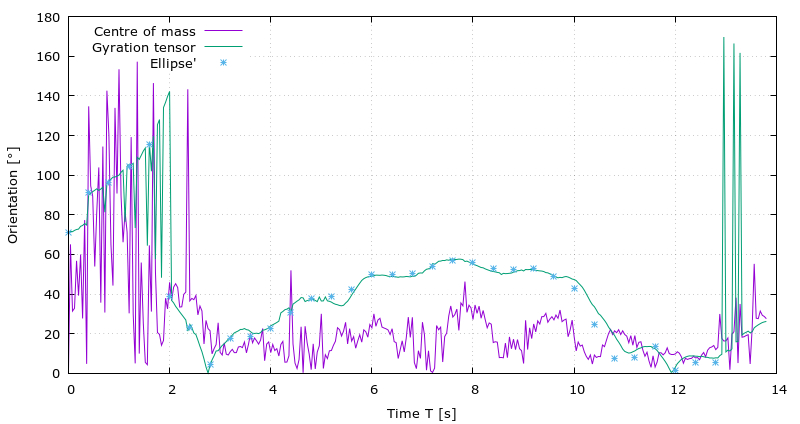 Figure 14
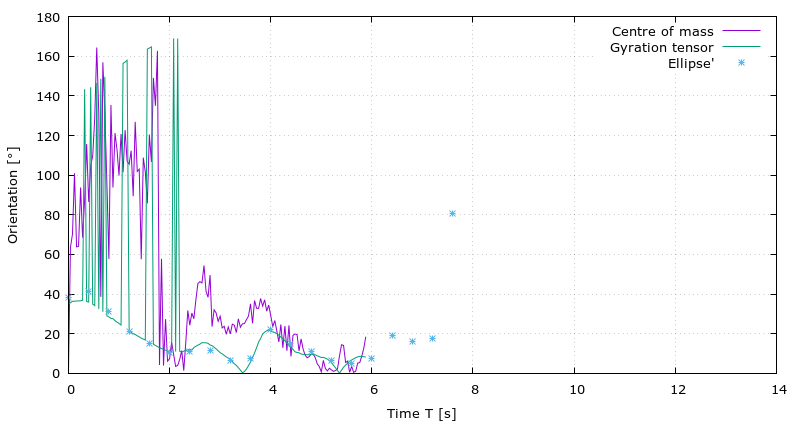 Figure 15
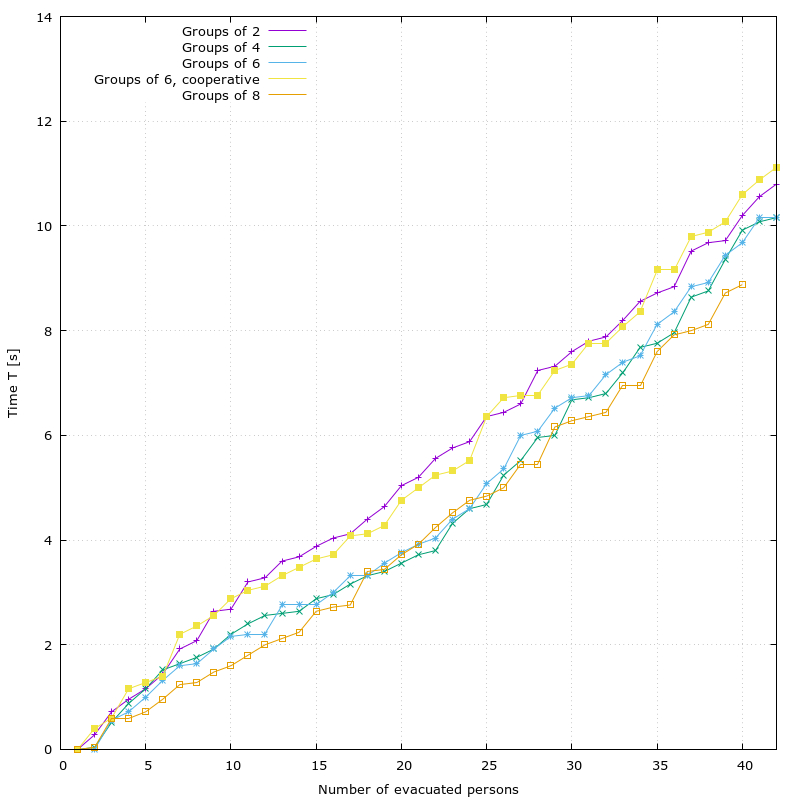 Figure 2
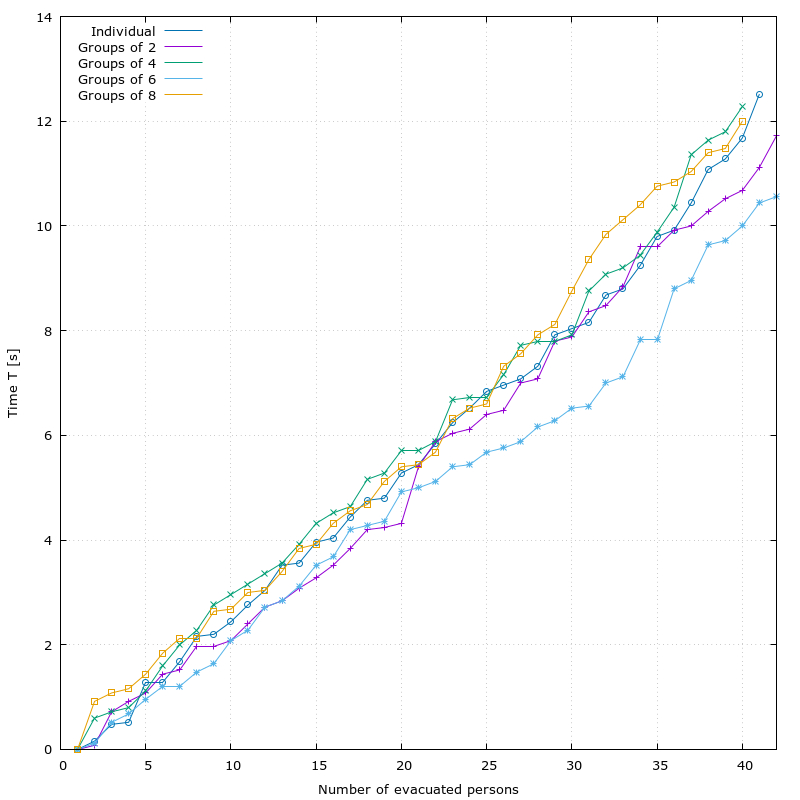 Figure 3
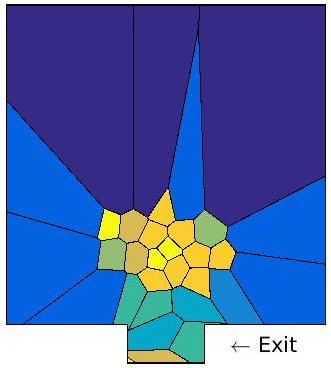 Figure 4
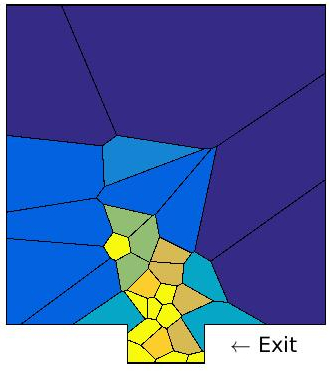 Figure 4
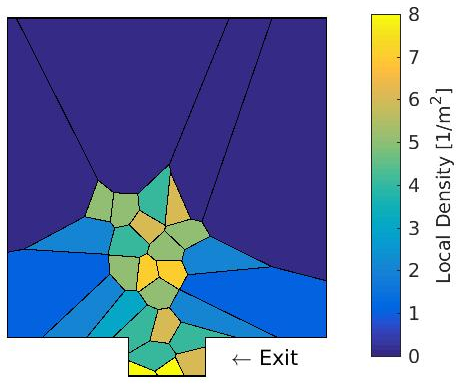 Figure 4
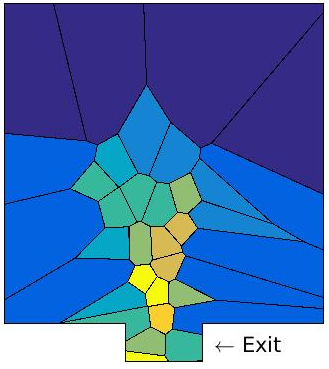 Figure 4
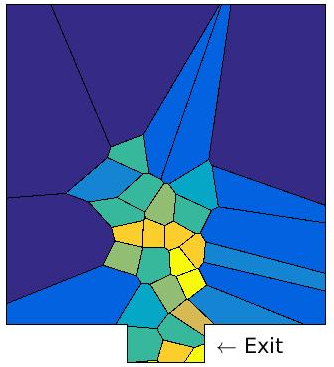 Figure 4
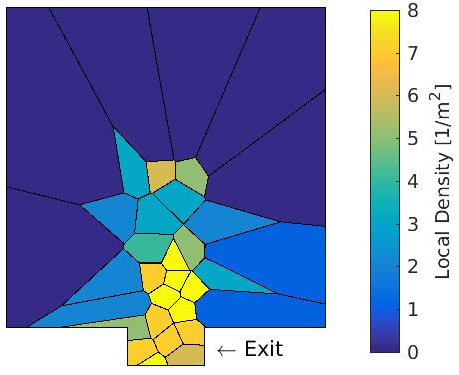 Figure 4
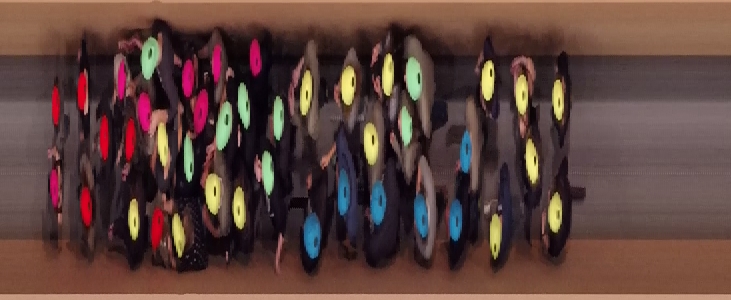 Figure 5
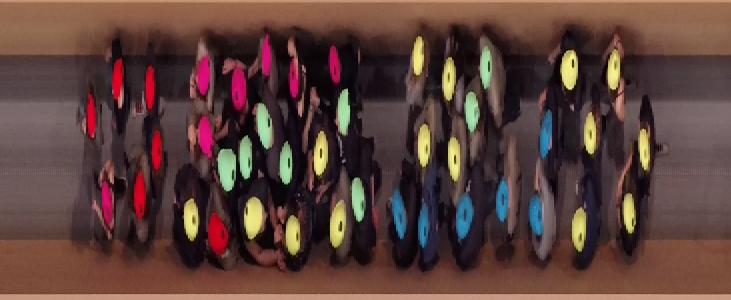 Figure 5
 Figure 5
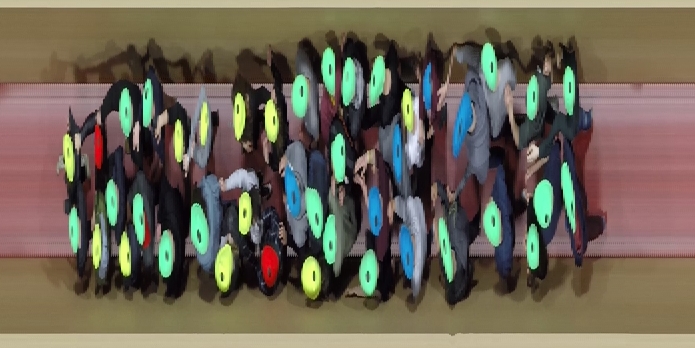 Figure 5
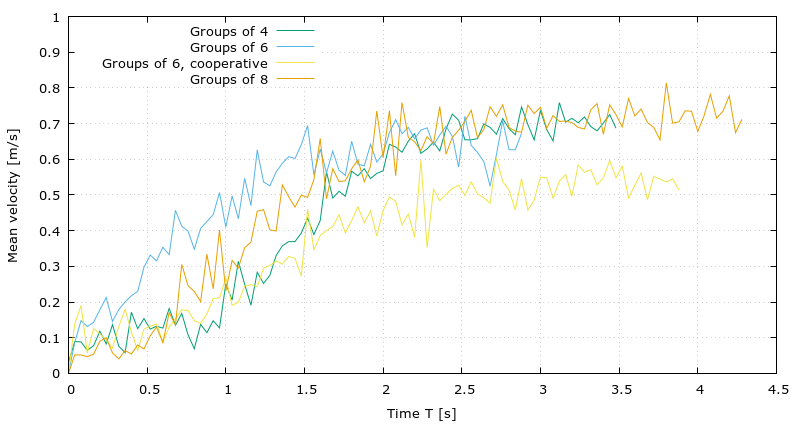 Figure 6
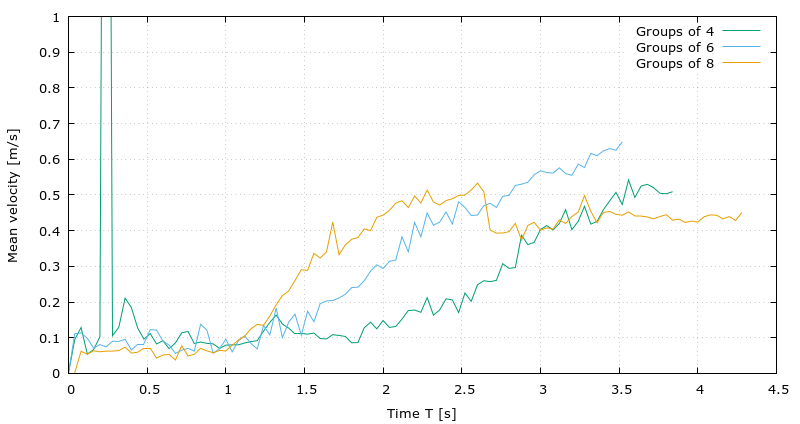 Figure 7
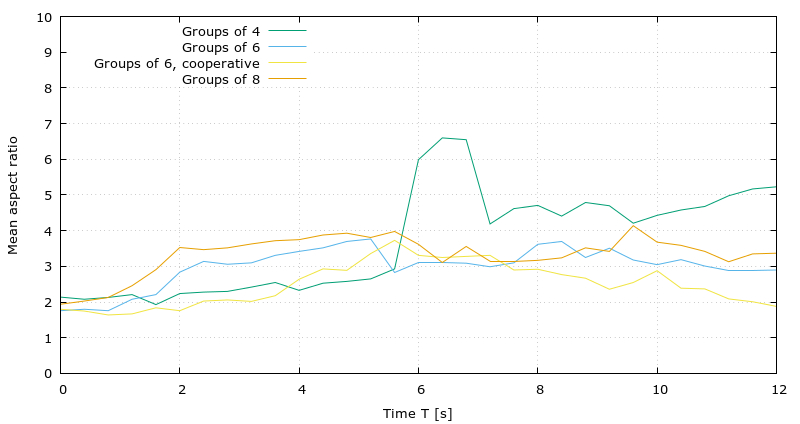 Figure 8
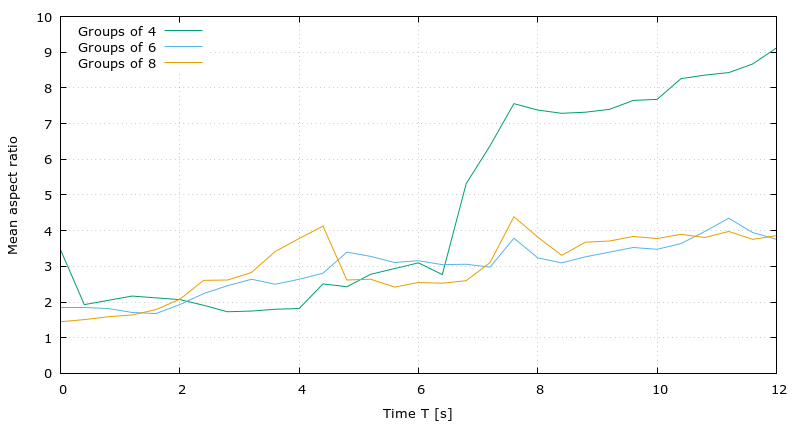 Figure 9
Peer Reviews
No public reviews on file for this paper yet. If you reviewed it on a platform where reviews are public (OpenReview, ICLR, NeurIPS, ICML), you can paste yours below so the community can read it here.
Videos
No videos yet. Explain this paper in a talk, walkthrough, or lecture? Add one.
Empirical study on social groups in pedestrian evacuation dynamics
Cornelia von Krüchten
Andreas Schadschneider
Institut für Theoretische Physik, Universität zu Köln, Germany
Institut für Physik und ihre Didaktik, Universität zu Köln, Germany
Abstract
Pedestrian crowds often include social groups, i.e. pedestrians that walk together because of social relationships. They show characteristic configurations and influence the dynamics of the entire crowd. In order to investigate the impact of social groups on evacuations we performed an empirical study with pupils. Several evacuation runs with groups of different sizes and different interactions were performed. New group parameters are introduced which allow to describe the dynamics of the groups and the configuration of the group members quantitatively. The analysis shows a possible decrease of evacuation times for large groups due to self-ordering effects. Social groups can be approximated as ellipses that orientate along their direction of motion. Furthermore, explicitly cooperative behaviour among group members leads to a stronger aggregation of group members and an intermittent way of evacuation.
keywords:
Pedestrian dynamics , Social groups , Empirical study , Evacuation scenarios
††journal: Physica A
1 Introduction
The significance of social groups in pedestrian crowds is known for almost forty years. In 1977, Aveni [1] found that most pedestrians do not walk alone, but in pairs or groups. Likewise, more recent studies observed the dominance of groups in crowds of pedestrians [2, 3, 4]. Moussaid et al. [5] reported that up to 70% of urban pedestrian traffic happens in social groups, whereas 95% of pedestrians were found to walk in groups at major events [6].
In this contribution, the term “crowd” describes the entire group of walking or evacuating people. Groups of pedestrians that walk or stand together because of social relationships and interactions are referred to as “social groups” (see [5] and references therein). Using these terms, we do not want to imply collective behaviour as it is mentioned in [7]. The presence of social groups can influence the dynamics of pedestrian crowds. Social groups often move slower and reduce the walking speed of the pedestrians [3, 8, 9, 10]. However, Manenti et al. [11] observed that group members can walk faster than individuals in high density scenarios. The average walking speed decreases with increasing group size [3, 5, 6, 12].
Pedestrians of social groups order in certain configurations depending on the surrounding density and the group size. Pairs and larger groups at lower density walk abreast. At higher densities, groups of three pedestrians often walk in a “V”-like shape. This configuration becomes “U”-like for groups with four pedestrians. Larger groups tend to split up to smaller groups of two or three members [3, 5, 13, 14, 15]. In pedestrian crowds the averaged minimum distance headway within a social group increases with increasing group size. This leads to a larger space requirement for larger groups [16].
Based on simulation results Reuter et al. [2] identify large social groups as “moving obstacles” amongst pedestrians. As a consequence, the authors assume that large cohesive groups inhibit fast evacuations. Köster et al. [12] performed an experimental study with students. They had to egress from their classroom starting at their desks and enter the room again afterwards. The authors of the study observed a negative impact of groups on egress times, but a positive impact on ingress times. The students entered the room starting in the same configuration of the crowd as it results from the egress process. Thereby, the separation of the participants into social groups caused the ordering of students in accordance with their position in the classroom before the ingress process started. The authors assume that this kind of ordering effect was responsible for the faster ingress with groups. A more recent study [17] also found that pairs can evacuate faster than individuals. Laboratory experiments performed by Bode et. al [18] revealed that social groups of three evacuated slower compared to individuals due to a larger pre-movement time and larger time to reach the vicinity of the target.
In order to investigate social groups in pedestrian crowds further, this contribution presents the first results of laboratory experiments on social groups in evacuation scenarios. These experiments were part of a joint study by the Universities of Cologne and Wuppertal and the Forschungszentrum Jülich which aimed at the investigation of the influence of inhomogeneities on the fundamental diagram [19] and evacuation times. Here we report preliminary results from experiments on evacuation scenarios with pairs and larger social groups.
2 Experimental study
The experiments were performed in November 2015 and April 2015 in two schools in Wuppertal, Germany (Gymnasium Bayreuther Straße, “GymBay”, and Wilhelm-Dörpfeld-Gymnasium, “WDG”). The pupils of different classes participated as part of project work (see also [20, 21]).
2.1 Experimental concept
The experiments consisted of several evacuation runs. The focus was on varying the composition of the crowd of pupils. Different configurations helped to investigate the influence of different parameters. Overall, there were three quantities that specified the composition of the crowd:
Social group composition: There were two classes of age: children (aged around 11 years) and young adults (aged around 16 years). The groups could therefore consist only of children, only of youths and of mixtures of both. A distribution of body height of the runs that are used in the analysis can be found in A.2.
- 2.
Social group interaction: The interaction between group members was specified in two ways:
- (a)
Bond between group members: Members of the same social group could be connected either loosely or fixed. Loosely bonded groups had to try to stay together through eye contact, fixed bonded group members had to hold physical contact, e.g. hold each others’ hands.
- (b)
Hierarchy of group members: The hierarchy between group members could be flat, with each pupil treated equally. They had to leave the room as well as to stay together in their social group. Otherwise, one group member was declared as ‘leader’, the other ones as ‘followers’. Leaders had to leave the room without regarding other members of the groups. Followers had to stay as close as possible to their leader.
- 3.
Social group size: The pupils evacuated individually, in pairs or in larger groups with four, six or eight participants per group.
Large groups were built successively. Two pupils were teamed up to pairs. Groups of four consisted of two pairs, groups with six participants of three pairs and groups of eight were built by four pairs (two groups of four). Members of larger groups were bound only loosely. If required, the leader was chosen randomly in age-matched pairs. In pairs or groups of mixed ages the older pupil or one of the older pupils were assigned as leader. For age-matched large groups there was no leader at all.
2.2 Experimental set-up
The experimental set-up consisted of a rudimentary room built in the schools’ assembly hall. This room was a square area of 55 m2 bounded by small buckets on three sides (see Fig. 1). There was a gap on one side that was used as an entrance to the experimental area. The fourth side was an artificial wall with an exit door of variable width. Door widths of 0.8 m and 1.2 m were used. Behind the exit door more buckets formed an aisle that led to a waiting area in front of the entrance. In the centre of the experimental room a square starting area of 33 m2 was marked. To record the experiments a video camera system was mounted on the ceiling of the hall. All pupils wore caps with different colours. Each colour represented a certain interval of body heights which was measured for each pupil before the experiments. They were used for an exact determination of the pupils’ position by reducing perspective errors [22]. In addition, the caps came with black points in the middle of the head. This point was used for the recognition and tracking of the pupils in the videos [22]. The video recordings were processed using the PeTrack software [22, 23] so that trajectories for each pupil in each run were available for our analysis. All videos and trajectories are available under http://ped.fz-juelich.de/database.
2.3 Experimental procedure
In each experimental run, there were 32 - 46 participants. In the waiting area in front of the entrance the pupils were told in which configuration they had to evacuate and were separated into pairs or groups, if required. Afterwards, they entered the room and assembled in the starting area, uniformly distributed. Groups or pairs should stand together before the start of each experimental run. The students were told to raise their hands in this groups so that single social groups could be identified in the video recordings later. After an acoustic starting signal the pupils left the room. They were told to go briskly but not to run or to scramble. The current group configuration had to maintain during the whole egress. After passing the exit door the pupils had to walk down the aisle and to assemble again in the waiting area.
3 Analysis of experimental data
In order to investigate the influence of groups the data of the youths of both schools were used. We compare runs with large groups (four, six and eight participants), loosely bonded pairs without leader-follower relationship and, if available, individual runs. In addition, the youths of “GymBay” performed a run with groups of six and explicit cooperative behaviour. They were told to particularly concentrate on their group members. A detailed list of the used runs can be found in the appendix.
3.1 Macroscopic analysis
A first approach to consider social groups in pedestrian evacuation dynamics is to investigate their influence on the entire crowd. Therefore, the macroscopic quantities of evacuation times, density distributions and information from spatio-temporal diagrams can be regarded. They may give some indication of changes of the crowd’s dynamic due to the presence of social groups.
3.1.1 Evacuation times
Figures 2 and 3 show the number of evacuated persons plotted against the respective evacuation times for each school, respectively. The evacuation time of each person can be calculated as the time difference between the beginning of the evacuation and the moment when the participant passes the door. Since the acoustic starting signal is not audible on the video recordings, the beginning of the evacuation can be determined only inaccurately. To compensate this and other delays (e.g. pre-movement time, delays due to a lack of concentration) the evacuation time of the first evacuated person is subtracted as an off-set from all the other times. Additionally, the adjusted times allows for a better comparison between different runs.
Both plots show approximately linear behaviour of the curves. The evacuation times of “GymBay” separate into two branches after about three to six evacuated persons. The runs with groups of four, six and eight persons are significantly faster than the runs with pairs and with groups of six and cooperative behaviour. One should notice that the run with cooperative behaviour is considerably slower than the evacuation with the same group size but normal behaviour. There is no such separation in the plot of “WDG”, however, the run with groups of six becomes faster than the others in the second half of the evacuation. On this basis, there are two conjectures that can be made:
The presence of groups is not necessarily disadvantageous, in some cases the evacuation can be even faster with social groups. 2. 2.
Explicitly cooperative behaviour can inhibit an advantageous impact of groups on the evacuation process.
Further investigation of the pedestrians’ behaviour during the evacuation may give a hint of possible reasons for the differences in evacuation times.
3.1.2 Density distributions
By means of density distributions the configuration of the pedestrians during the evacuation can be depicted. A density profile can be determined using Voronoi diagrams [24, 25]. These diagrams consist of Voronoi cells for each pedestrian. Each cell represents the “personal space” [26] of the respective person. The size of the Voronoi cells can be used as a measure of density: the (local) density encountered by a person is inversely proportional to the area of the corresponding Voronoi cell [25]. In Fig. 4 the cells are coloured corresponding to their size: large cells (low density) are coloured in shades of blue, smaller cells (high density) in shades of red. In doing so, dense configurations of pedestrians can be recognized easily.
Density distributions of different runs for “GymBay” and “WDG” are exemplarily shown in Fig. 4. The participants congest in front of the exit. The pupils in the pairwise run for “GymBay” order in a broad shape symmetrically around the door. This configuration is elongated for the runs with larger social group sizes. The pupils order rather behind one another than next to each other when evacuating in larger groups. This queue-like formation of the crowd is observed in all runs of “WDG” independently of the group size.
Nevertheless, the differences in the positioning of the pedestrians of the “GymBay” experiments may explain the differences in evacuation times. The run with pairs was significantly slower than the runs with groups of larger size and normal behaviour. A kind of self-ordering phenomenon within the groups may lead to an ordering effect of the entire crowd. In front of the exit, the pedestrians compete for space in the door. The observed ordering effect could reduce the number of these conflicts. As a consequence, the evacuation processes smoother and faster. There are no distinct differences in evacuation times for “WDG”, except for the run with groups of six at the end, but there are also no differences in the pupils’ configuration. Also the density distribution does not supply an explanation for the slower evacuation with cooperative behaviour. Therefore, one has to chose other approaches.
3.1.3 Spatio-temporal diagrams
The compactness of the pedestrians during the evacuation can be visualized using spatio-temporal diagrams [27, 28]. They represent the temporal development of a certain spatial region. In the case of the evacuation experiments the line of pixels corresponding to the end of the exit door built by the platforms is plotted for every frame (Fig. 5).
In all runs with normal behaviour for “GymBay” as well as for “WDG” the pupils move in a compact way. There are no distinct gaps between single pedestrians over the course of time. In contrast, the (slower) run with groups of six and cooperative behaviour shows an intermittent behaviour, see Fig. 5 (b). The students are separated into four bursts. Each burst mostly consists of closed social groups. Cooperative behaviour seems to lead to a stronger aggregation to the own group members and a neglect of other pupils at the same time. This loss of cooperation with the rest of the students may slow down the evacuation process.
The pupils of “WDG” evacuate in a continuous way for all group sizes. They are distributed uniformly, but loosely, except for the run with groups of six. In this case, the pedestrian flow is higher. This is represented by a higher density in the spatio-temporal diagram Fig. 5 (d). It is conceivable that this very compact configuration accelerates the evacuation process. The runs with normal behaviour of “GymBay” also show temporal periods of higher flow. In case of larger groups, this period occurs in the first third of the evacuation. For the pairwise run a period of higher flow can be observed in the middle of the evacuation. It might be advantageous if there is a high pedestrian flow at an early state of the evacuation.
3.2 Microscopic analysis
Besides the influence of the social groups on the entire crowd the behaviour and dynamics of the groups themselves are interesting. In the following sections several “group parameters” are introduced. The velocity of the centre of mass helps to describe the dynamics of a group. Furthermore, the shape and elongation of a group provides information about the positioning of the group members. The orientation of the group is also regarded on different ways. For a more detailed description, we refer to [29].
3.2.1 Centre of mass of social groups
The dynamics of a social group as whole is described by the behaviour of its centre of mass. This approach is adopted from the investigation of starling flocks [30]. The position of the centre of mass is calculated as the averaged position of all group members:
[TABLE]
In order to describe the dynamics we consider the velocity of the centre of mass
[TABLE]
that describes the change of position of the centre of mass with time. In this case, corresponds to the frame rate of the video recordings, s.
Fig. 6 shows velocity of the centre of mass at time averaged over the number of social groups for “GymBay” and “WDG”. The calculation of the mean velocity is cancelled as soon as one social group has left the region of detection.
All velocity curves for “GymBay” increase almost linearly at the beginning of the evacuation and flatten after approximately 1.5 s. The groups with normal behaviour reach a nearly similar constant velocity around 0.7 ms*-1*. In contrast, the run with cooperative behaviour is significant slower. This curves bottoms out at approximately 0.5 ms*-1*. This difference in velocity may be an additional explanation for the longer evacuation time for the run with cooperative groups. Overall, in all runs the groups accelerate and reach a nearly constant velocity in the first few seconds of evacuation.
For the runs of “WDG”, the velocity profile is different. The groups do not accelerate in the first second. The increase is almost linear only for the run with groups of six. This curve also does not flatten during the measurement period. The runs with groups of four and eight participants show different increases at the beginning. The velocity of the groups of eight reaches a constant level at above 0.4 m/s, the curve of the run with groups of four flattens at a slightly higher velocity. These various progresses of the mean velocity are not explainable at first sight. For whatever reasons the dynamics of the groups at “WDG” was different from that of “GymBay” and more inconsistent.
3.2.2 Shape of social groups
Besides the dynamics of the group as a whole, the behaviour and configuration of the pupils within the social group is also of interest. The shape of the group can be approximated as an ellipse. This ellipse should incluce all group members and have the minimal possible area at the same time. Therefore, it is directly determined by the position of the pedestrians within the social group. Even its aspect ratio, i.e. the ratio of its major and minor axis, and its area is determined by the positioning of the group members [31, 32]. An exemplary ellipse is shown in Fig. 7 (a).
The aspect ratio averaged over the number of groups is plotted for both schools in Fig. 8. For all runs the aspect ratio is distinctly greater than one. It indicates that the groups form a prolate ellipse. In this case the pedestrians have a elongated configuration in the direction of the exit door. The aspect ratio increases with time for all runs, only for “GymBay” it decreases again later for most of the runs. It is remarkable that the aspect ratio of the runs with groups of six and eight develop very similarly with time in both schools. The aspect ratio of the runs with groups of four increases sharply in the middle of the evacuation in both cases. This is caused by single social groups whose members are separated during the evacuation process. The run with cooperative behaviour shows a similar process of the aspect ratio than the run with groups of six and eight. However, at most times the absolute value of the aspect ratio is smaller than in the runs with normal behaviour. Cooperative behaviour seems to lead to a more rotund configuration of the group members than evacuations without this instruction.
The area of the ellipse can also be considered. It is normalized with respect to the number of pedestrians of the group in order to allow for a quantitative comparison. In doing so, the space requirement per person within the group is determined. This approach is similar to a method that is used to probe the dispersion of social groups, e.g. in [33, 34]. In our case the ellipse is used instead of a polygon to determine the space that is occupied by the group members. The averaged normalized area of the ellipses for both data sets is shown in Fig. 9. The general behaviour of the curves is different in “GymBay” and “WDG”. For the runs of “GymBay” the mean normalized area increases during the evacuation for all runs. The group members fan out over a larger area with time. In contrast, the normalized area decreases during the evacuation process for all group sizes in “WDG”. In these cases the pedestrians come closer within the groups. However, both types of behaviour are consistent within one data set.
For both schools the normalized area is slightly larger or even similar for groups of six compared to groups of four. In contrast, the values for the groups of eight are significantly higher, expect for a small outlier for “GymBay”. The run with groups of six and cooperative behaviour shows the same normalized area than the group with same group size but normal behaviour in the beginning of the evacuation. The process of both curves is comparable in the first half of the evacuation. Later, the ellipses become smaller for the runs with cooperative behaviour. In that case, the stronger aggregation of the particularly cooperative group members is represented by a closer configuration of the participants.
As a consequence, larger groups seem often to require more space. This effect is mitigated by including cooperative behaviour. Cooperative groups cover less space compared to groups of the same size but with normal behaviour. Accordingly, the stronger aggregation of cooperative groups that was observed in the spatio-temporal diagrams reflects that the participants stay closer than usual during the evacuation.
3.2.3 Orientation of social groups
The orientation of the social groups can be determined in different ways. First, the orientation of the centre of mass can be calculated. It is defined as the angle between the velocity of the centre of mass and an axis of reference [30]. In our case this is the room axis that points into the room perpendicular to the exit door. Therefore, the orientation angle of the social group can be determined using the scalar product:
[TABLE]
where is the component of the centre of mass’ velocity in the direction of and is the absolute vlaue of the velocity at time . This angle represents the orientation of the movement of the entire group. The averaged values are shown in Fig. 10 for “GymBay” and “WDG”. In both cases, the angle decreases (after a short starting phase) and flattens at low values between and . During the evacuation the social groups move in a narrow cone around the door. The orientation is comparable for all runs in “GymBay”, whereas for the runs of “WDG” the angle decreases with increasing group size. In these cases, the cone in which the pedestrians move is even narrower for larger groups.
Another way to describe the orientation of the social groups is to determine the orientation of the ellipses [31]. It is defined as the angle between the major axis of the ellipses and the room axis . Here, the differences between the orientation curves of single groups are rather large, especially for groups of four. Hence, it is not sensible to calculate an averaged value. These differences arise from the special configuration four pedestrians can acquire. Four pupils can order in a square-like shape in contrast to groups with six or eight persons. While moving in this square configuration even small shifts of single persons can lead to considerable shifts of the ellipse’s orientation. Nevertheless, the orientation of the ellipse can be compared to the orientation of the centre of mass for each single group. A good accordance of both orientations would mean that the group members order along the direction of movement. Indeed, many of the orientations match at least temporarily as shown in Fig. 11. Therefore, pedestrians in social groups seem to order along their general direction of motion.
The groups’ orientation can also be calculated by a third approach based on the gyration tensor [35]
[TABLE]
where is again the number of group members, the position of the group member and the position of the centre of mass at time . The orientation of the group is then defined as the eigenvector to the largest eigenvalue in our case. This approach has e.g. been used to determine the orientation of red blood cells [35]. The gyration tensor is calculated using the positions of the pedestrians in the group. Therefore, this orientation of the single social group is directly determined by the positioning of the group members. It matches the orientations of the ellipses well for the single groups at least temporarily. This indicates that the approximation of social groups as ellipses is an appropriate choice to describe their internal dynamics.
Overall, the social groups seem to orientate along their direction of motion that proceeds within a narrow cone around the door.
4 Conclusion
The presence of social groups in pedestrian crowds and their characteristics have been observed experimentally for several years now. In order to analyse the influence of social groups on evacuation scenarios we have conducted an empirical study with pupils. The influence of social groups is investigated using data of youths that evacuate in social groups of different sizes and different intra-group interactions.
The evaluation of evacuation times shows that the presence of social groups can have an advantageous influence on the evacuation process. If the pedestrians form a queue in front of the door, the evacuation is faster compared to a broad distribution of the pedestrians around the exit. The reduction of conflicts arising from this ordering within the groups may accelerate the whole evacuation process. In addition, evacuations were faster for pedestrians that move compactly, especially at an early stage of evacuation.
We have found several characteristics of the dynamics of the social groups during the evacuation process. Social groups accelerate at the beginning of the evacuation but reach a constant velocity soon. There are no distinct differences in group velocity that might explain differences in evacuation times between the runs with pairs and large groups. During the evacuation, social groups can well be approximated by ellipses which typically have a prolately elongated shape. In addition, their orientation shows that groups move in a narrow cone around the exit. Following the orientation of the ellipses, members of social groups order along their direction of motion. Groups of large sizes have an higher space requirement per person, especially for groups of eight. Therefore, faster evacuations for larger group sizes do not arise from denser configurations of the group members. The comparison of the orientations also shows that the approximation of groups as ellipses supplies reasonable results.
Explicit cooperative behaviour can inhibit an advantageous impact of groups. The pedestrians concentrate on their own group members and pay less attention to other pedestrians. Therefore, the participants evacuate in an intermittent way separated into several bursts. The stronger aggregation within the social group is also reflected in a smaller space requirement for cooperative behaviour compared to same group size with normal behaviour. In addition, groups with cooperative behaviour reach a lower constant velocity level. All this factors lead to a slower evacuation.
Summarizing, our experiments have shown that the presence of social groups can have a substantial impact on evacuation scenarios. We have introduced “group parameters” which allow to quantify the dynamics of groups and their members.
Acknowledgements
We thank the teams of the Universities of Wuppertal and Cologne and the Forschungszentrum Jülich for their support with the experiments, especially Maik Boltes for providing the trajectory data. We also thank the students and teachers of Gymnasium Bayreuther Straße and Wilhelm-Dörpfeld-Gymnasium for their participation. Financial support by Deutsche Forschungsgemeinschaft (DFG) under grant SCHA 636/9-1 and Bonn-Cologne Graduate School of Physics and Astronomy (BCGS) is gratefully acknowledged.
Appendix A Details of experimental runs
A.1 List of experiments
The proportion of male participants in the crowd was estimated from the video recordings.
A.2 Distribution of body height in the experiments
In order to classify the students’ body heights it was measured before the experiments. Afterwards, the interval between the maximum and minimum body height of the entire group was divided by the number of available cap colours. In the Gase of “GymBay”, the youths were separated into five different body height intervals, for “WDG”, there were four categories for the young adults. For each body height interval the middle value was approximated and is stated in the tables below. It represents approximately the averaged body height of the persons belonging to the respective body height interval.
A.3 Instructions during the experiments
Instructions for the experiments at “GymBay”:
Pairs: Try to stay together with your group partner and to leave the room as fast as possible. There is no leader.
- 2.
Groups of four: Tray to stay together. Imagine that you have visited a concert with friends and you don’t want to loose them while leaving the room.
- 3.
Groups of six: The same as before: try to stay together in your groups and not to be split up.
- 4.
Groups of six with cooperative behaviour: The groups should be close even at the beginning of the evacuation. Try more to stay together and let another group go first if there is the risk that your own group would be split up otherwise. Imagine that you’re visiting a place you don’t know and that the group members have to find the way all together.
- 5.
Groups of eight: The same as before, try to stay together.
Instructions for the experiments at “WDG”:
Individual: Try to leave the room as fast as possible without running or scrambling. Imagine that you’re leaving your classroom.
- 2.
Pairs: Try to stay together and to leave the room quickly. There are equal partners and no leaders.
- 3.
Groups of four: Try to stay together in your groups of four without scrambling each other.
- 4.
Groups of six: The same as before, try to stay together.
- 5.
Groups of eight: Try to stay together without scrambling each other.
References
- [1] A. Aveni, “The not-so-lonely crowd: friendship groups in collective behavior”, Sociometry, vol. 40, pp. 96-99, 1977
- [2] V. Reuter, B. S. Bergner, G. Köster et al., “On modeling groups in crowds: empirical evidence and simulation results including large groups”, Pedestrian and Evacuation Dynamics 2012, Springer, Berlin Heidelberg, pp. 835-845, 2014
- [3] M. Schultz, L. Rößger, H. Fricke and B. Schlag, “Group dynamics behaviour and psychometric profiles as substantial driver for pedestrian dynamics”, Pedestrian and Evacuation Dynamics 2012, Springer, Berlin Heidelberg, pp. 1097-1111, 2014
- [4] S. Xu and H. B.-L. Duh, “A simulation of bonding effects and their impacts on pedestrian dynamics”, IEEE Transactions on Intelligent Transportation Systems, vol. 9, pp. 153-161, 2010
- [5] M. Moussaïd, N. Perozo, S. Garnier et al., “The walking behaviour of pedestrian social groups and its impact on crowd dynamics”, PLoS ONE, 5.e10047, 2010
- [6] D. Oberhagemann, R. Könnecke and V. Schneider, “Effect of social groups on crowd dynamics: empirical findings and numerical simulations”, Pedestrian and Evacuation Dynamics 2012, Springer, Berlin Heidelberg, 2014
- [7] A. Templeton, J. Drury and A. Philippides, “From mindless masses to small groups: conceptualizing collective behavior in crowd modeling”, Review of General Psychology 19, pp. 215-229, 2015
- [8] A. Gorrini, S. Bandini, M. Sarvi et al., “An empirical study of crowd and pedestrian dynamics: the impact of different angle paths and grouping”, Transp. Res. Proc. 41, pp.42, 2014
- [9] A. Gorrini, G. Vizzari and S. Bandini, “Age and group-driven pedestrian behaviour: from observations to simulations”, Collective Dynamics 1, pp. 1-16, 2016
- [10] X. Wei, X. Mai, W. Lv and W. Song, “Microscopic character and movement consistency of pedestrian group: an experimental study in campus”, Proceedings of the Eleventh International Symposium, pp.1103-1114, 2014
- [11] L. Manenti, S. Manzoni, G. Vizzari et al., “Towards an agent-based proxemic model for pedestrian and group dynamic”, Proceedings on Eleventh WOA 2010 Workshop 621, 2010
- [12] G. Köster, M. J. Seitz, F. Treml et al., “On modelling the influence of group formations in a crowd”, Contemporary Social Science 6, pp. 397-414, 2011
- [13] M. Costa, “Interpersonal distances in group walking”, Journal of Nonverbal Behaviour 34, pp. 15-26, 2010
- [14] J.-A. Xi, X.-L. Zou, Z. Chen and J.-J. Huang, “Multi-pattern of complex social pedestrian groups”, Transp. Res. Proc. 2, pp. 60-68, 2014
- [15] F. Zanlungo and T. Kanda, “Do walking pedestrians stabily interact inside a large group? Analysis of group and sub-group spatial structure”, COGSCI13, pp. 3847-3852, 2013
- [16] D. Duives, W. Daamen and S. Hoogendoorn, “Influence of group size and group composition on the adhered distance headway”, Transp. Res. Proc. 2, pp. 183-188, 2014
- [17] N. Guo, R. Jiang, J.-X. Ding and Z.-J. Ding, “Escaping in couples facilitates evacuation: experimental study and modeling”, arXiv:1512.05120, 2015
- [18] N. W. F. Bode, S. Holl, W. Mehner and A. Seyfried, “Disentangling the impact of social groups on response times and movement dynamics in evacuations”, PLoS ONE, 10(3): e0121227
- [19] V. Ziemer, A. Tordeux, A. Seyfried, in preparation
- [20] C. von Krüchten, F. Müller, A. Svachiy et al., “Empirical study of the influence of social groups in evacuation scenarios“, to appear in: Traffic and Granular Flow ’15, Springer, Berlin Heidelberg, 2016
- [21] C. von Krüchten, F. Müller and A. Schadschneider, “Influence of social groups in evacuation scenarios: model predictions and empirical studies”, to appear in: Proceedings of the 8th International Conference on Pedestrian and Evacuation Dynamics, 2016
- [22] M. Boltes, A. Seyfried, B. Steffen and A. Schadschneider, “Automatic extraction of pedestrian trajectories from video recordings”, Pedestrian and Evacuation Dynamics 2008, Springer, Berlin Heidelberg, pp. 43-54, 2010
- [23] M. Boltes, “Automatische Erfassung präziser Trajektorien in Personenströmen hoher Dichte“, Dissertation, Universität zu Köln, 2014 (available at http://kups.ub.uni-koeln.de/5914)
- [24] G. Voronoi, “Nouvelles applications des paramètres continus à la théorie des formes quadratiques”, Journal für die reine und angewandte Mathematik 133, pp. 198-287, 1907
- [25] B. Steffen and A. Seyfried, “Methods for measuring pedestrian density, flow, speed and direction with minimal scatter”, Physica A 389, pp. 1902-1910, 2010
- [26] J. Liddle, A. Seyfried and B. Steffen, “Analysis of bottleneck motion using Voronoi diagrams”, Pedestrian and Evacuation Dynamics 2010, Springer, Berlin Heidelberg, pp. 833-836, 2011
- [27] I. Zuriguel, D. Parisi, R. C. Hidalgo et al., “Clogging transition of many-particle systems flowing through bottlenecks”, Scientific Reports 4, no. 7324, 2014
- [28] M. Boltes, Jülich Supercomputing Centre, Forschungszentrum Jülich, 2014, private communication
- [29] C. von Krüchten, “The influence of social groups on pedestrian evacuation dynamics”, Master thesis, University of Cologne, 2016
- [30] M. Ballerini, N. Cabibbo, R. Candelier et al., “Empirical investigation of starling flocks: a benchmark study in collective animal behaviour”, Animal behaviour 76, pp. 201-215, 2008
- [31] N. Moshtag, MATLAB File Exchange, 2006, http://www.mathworks.com/matlabcentral/fileexchange/9542-minimum-volume-enclosing-ellipsoid/content/MinVolEllipse.m, visited on 01/08/2016
- [32] N. Moshtag, MATLAB File Exchange, 2007, http://www.mathworks.com/matlabcentral/fileexchange/13844-plot-an-ellipse-in--center-form-, visited on 01/08/2016
- [33] S. Bandini, F. Rubagotti, G. Vizzari and K. Shimura, “An agent model of pedestrian and group dynamics: experiments on group cohesion”, AIIA 2011, Lecture Notes in Computer Science* 6934, pp. 104-116, 2011
- [34] G. Vizzari, L. Manenti and L. Crociani, “Adaptive pedestrian behaviour for the preservation of group cohesion”, Complex Adaptive Systems Modeling 1:7, 2013
- [35] J. Mauer, “Shapes and dynamics of blood cells in Poiseuille and shear flows”, PhD thesis, University of Cologne, 2016 (available at http://kups.ub.uni-koeln.de/6718)
The reference list from the paper itself. Each links out to its DOI / PubMed record.
- 1[1] A. Aveni, “The not-so-lonely crowd: friendship groups in collective behavior”, Sociometry , vol. 40, pp. 96-99, 1977
- 2[2] V. Reuter, B. S. Bergner, G. Köster et al., “On modeling groups in crowds: empirical evidence and simulation results including large groups”, Pedestrian and Evacuation Dynamics 2012 , Springer, Berlin Heidelberg, pp. 835-845, 2014
- 3[3] M. Schultz, L. Rößger, H. Fricke and B. Schlag, “Group dynamics behaviour and psychometric profiles as substantial driver for pedestrian dynamics”, Pedestrian and Evacuation Dynamics 2012 , Springer, Berlin Heidelberg, pp. 1097-1111, 2014
- 4[4] S. Xu and H. B.-L. Duh, “A simulation of bonding effects and their impacts on pedestrian dynamics”, IEEE Transactions on Intelligent Transportation Systems , vol. 9, pp. 153-161, 2010
- 5[5] M. Moussaïd, N. Perozo, S. Garnier et al., “The walking behaviour of pedestrian social groups and its impact on crowd dynamics”, P Lo S ONE , 5.e 10047, 2010
- 6[6] D. Oberhagemann, R. Könnecke and V. Schneider, “Effect of social groups on crowd dynamics: empirical findings and numerical simulations”, Pedestrian and Evacuation Dynamics 2012 , Springer, Berlin Heidelberg, 2014
- 7[7] A. Templeton, J. Drury and A. Philippides, “From mindless masses to small groups: conceptualizing collective behavior in crowd modeling”, Review of General Psychology 19, pp. 215-229, 2015
- 8[8] A. Gorrini, S. Bandini, M. Sarvi et al., “An empirical study of crowd and pedestrian dynamics: the impact of different angle paths and grouping”, Transp. Res. Proc. 41, pp.42, 2014