The Effect of Population Control Policies on Societal Fragmentation
Zvi Lotker, David Peleg

TL;DR
This paper examines how population control policies can lead to societal fragmentation by altering family size distributions, highlighting risks associated with policies restricting families to fewer than three children.
Contribution
It provides a theoretical and simulation-based analysis of the impact of population policies on societal cohesion, revealing potential fragmentation risks.
Findings
Policies banning families of 3+ children may cause societal fragmentation.
Simulation results demonstrate the risk of fragmentation under certain policies.
Analysis shows dependence of societal stability on family size distribution.
Abstract
Population control policies are proposed and in some places employed as a means towards curbing population growth. This paper is concerned with a disturbing side-effect of such policies, namely, the potential risk of societal fragmentation due to changes in the distribution of family sizes. This effect is illustrated in some simple settings and demonstrated by simulation. In addition, the dependence of societal fragmentation on family size distribution is analyzed. In particular, it is shown that under the studied model, any population control policy that disallows families of 3 or more children incurs the possible risk of societal fragmentation.
Click any figure to enlarge with its caption.
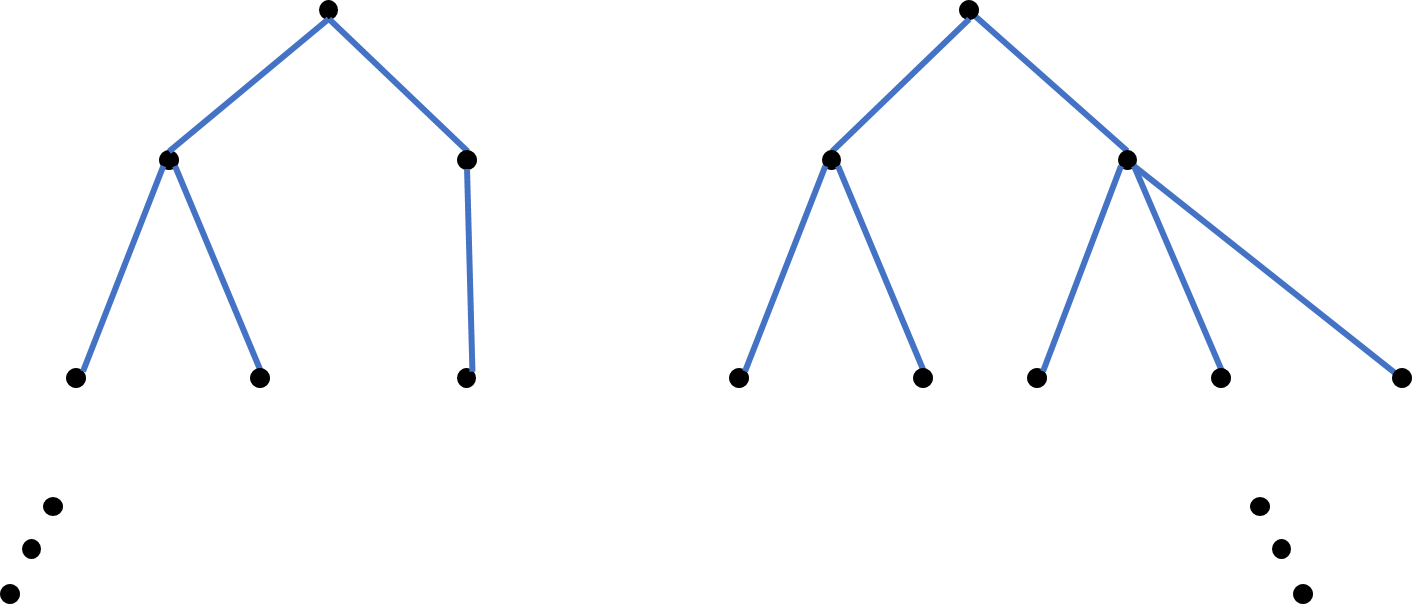 Figure 1
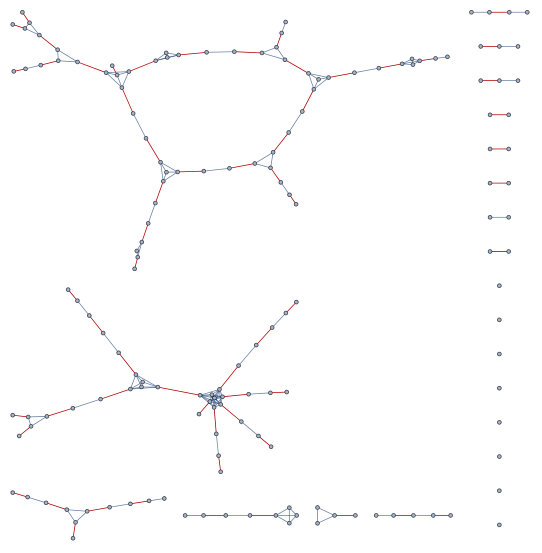 Figure 2
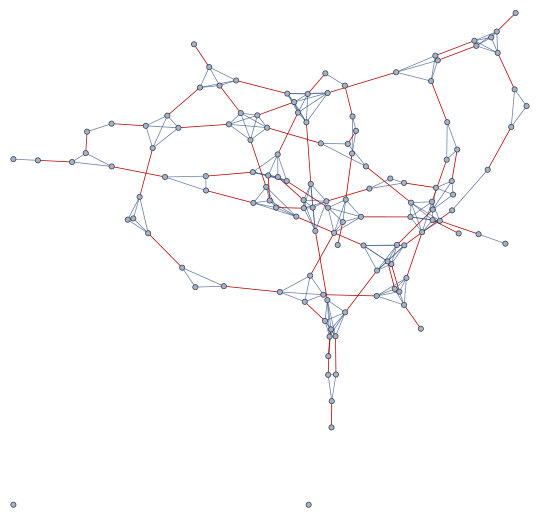 Figure 3
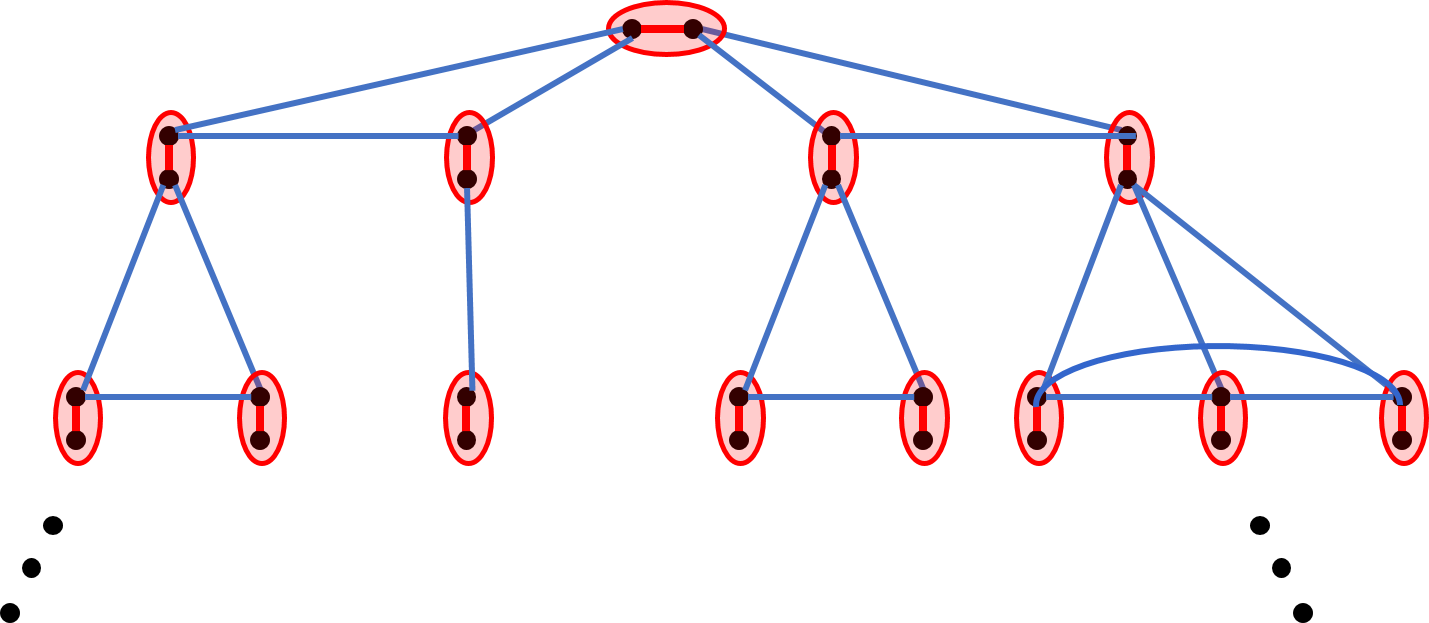 Figure 4
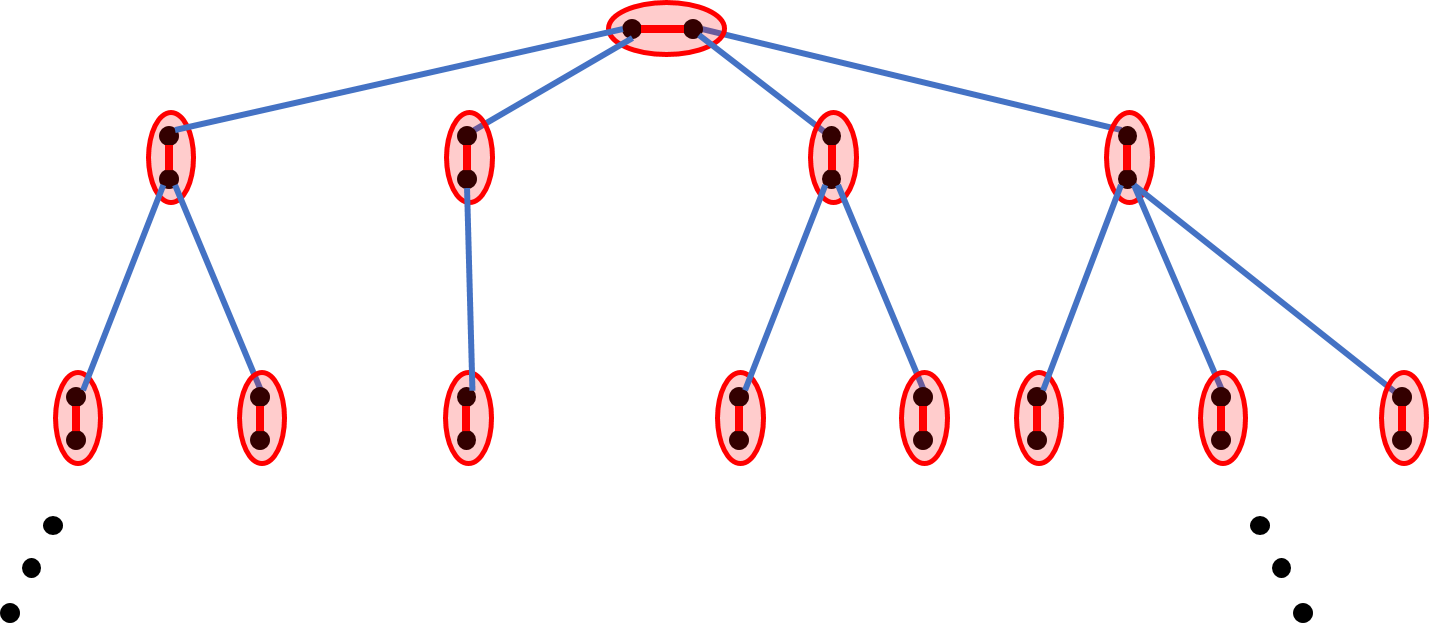 Figure 5
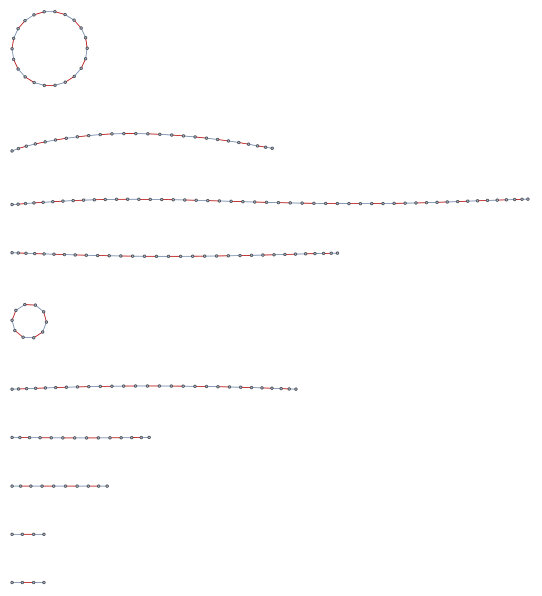 Figure 100
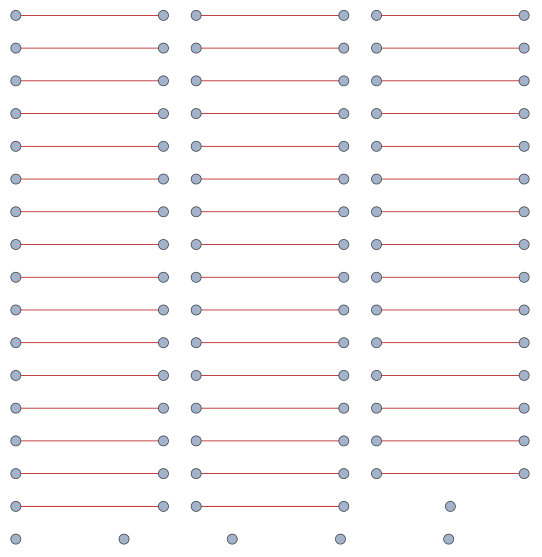 Figure 100
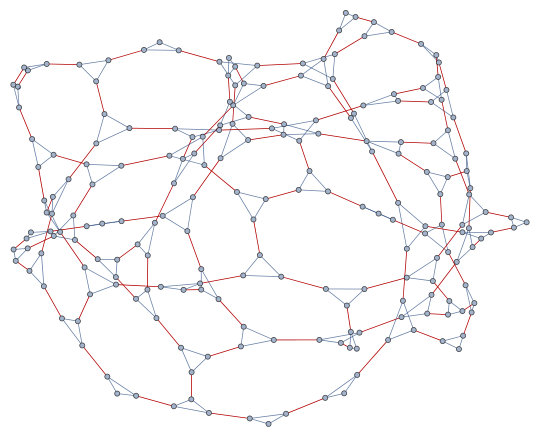 Figure 100
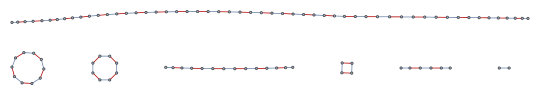 Figure 100
Peer Reviews
No public reviews on file for this paper yet. If you reviewed it on a platform where reviews are public (OpenReview, ICLR, NeurIPS, ICML), you can paste yours below so the community can read it here.
Videos
No videos yet. Explain this paper in a talk, walkthrough, or lecture? Add one.
Taxonomy
TopicsDemographic Trends and Gender Preferences · Family Dynamics and Relationships · Income, Poverty, and Inequality
The Effect of Population Control Policies
on Societal Fragmentation ††thanks: Supported in part by the Israel Science Foundation (grant 1549/13).
Zvi Lotker Department of Communication Systems Engineering, Ben Gurion University of the Negev, Beer-Sheva, Israel. E-mails: [email protected]
David Peleg Department of Computer Science, The Weizmann Institute of Science, Rehovot, Israel. E-mail: [email protected]
Abstract
Population control policies are proposed and in some places employed as a means towards curbing population growth. This paper is concerned with a disturbing side-effect of such policies, namely, the potential risk of societal fragmentation due to changes in the distribution of family sizes. This effect is illustrated in some simple settings and demonstrated by simulation. In adition, the dependence of societal fragmentation on family size distribution is analyzed. In particular, it is shown that under the studied model, any population control policy that disallows families of 3 or more children incurs the possible risk of societal fragmentation.
1 Introduction
1.1 Background
Global population explosion is viewed by many as a major threat to the well-being and stability of the human race. Consequently, various population control policies were proposed, with the goal of curbing the growth of the human population on earth. Some of those policies were even implemented in different countries, the Chinese one-child policy being the most well-known instance.
This paper is concerned with a less well-studied side-effect of such policies, namely, the potential risk to the fabric structure of society, in the form of societal fragmentation. Our main contribution is to demonstrate the potential occurrence of this effect, by viewing society as a social network and employing tools of social network theory. Moreover, we demonstrate that different population control policies may yield radically different outcomes in terms of fragmentation, even if they yield essentially the same outcome in terms of the resulting population size.
A social network represents society as a graph, in which vertices represent individual members of society and a link connecting two vertices represents a social connection between the two individuals. By “societal fragmentation” we refer to the situation where the social network becomes disconnected, and breaks into a large number of separate (medium to large) connected components. In contrast, the network is considered to be connected, or non-fragmented, if it consists of essentially one large connected component (a so-called “giant” component), possibly along with some additional vanishingly small components.
Let us stress at the outset that a complete analysis of fragmentation as a function of population control policy in real networks requires a very precise and careful modeling, taking into account multiple parameters, and is outside the scope of the current paper. Rather, our purpose is to illustrate the fragmentation effect and demonstrate its crucial dependence on the particular population control policies being utilized. We therefore adopt a simplistic societal model, stripping away many of the complicating parameters and focusing only on the pertinent features.
Societal connections are often classified into “strong” and “weak” ties, see [1]. We employ a strong-ties network model of connectivity, namely, one that focuses only on strong ties, and ignores weak ties. Hence, we consider the social network as fragmented into separate connected components if there are no strong ties connecting those components, even if there exist some weak ties that connect them.
In particular, our model assumes that family ties are strong ties, namely, there is a link connecting a person to his or her parents and siblings, as well as between spouses. In contrast, weaker types of social links (e.g., based on work/school relationships etc.) are ignored.
Viewing the recent Chinese history as a key example central to understanding the phenomena of population reduction and societal fragmentation, we seek to model social interconnections between the part of society that was directly affected by the population control policy, somewhat arbitrarily defined to be the generation born after 1980, see [3, 4].
Therefore, we view the social network as layered into generations, and focus on analyzing the connectivity properties within a single generation (particularly, the latest). In view of this, we ignore parent-child links and include in our strong-ties network model only links between siblings and spouses111We simplify our model by ignoring the fact that marital relations can be untied by divorce, in most of the world.. Hence in our model, a strong-ties social network is a social network where edges indicate sibling or marriage relations.
1.2 Family parameters and fragmentation
The size and fabric structure of society are largely determined by two central parameters, collectively referred to hereafter as the family parameters, namely, the distribution of family sizes and the marriage ratio.
The distribution of family sizes is described by a real vector
[TABLE]
where is the fraction of families with children, and
[TABLE]
The marriage ratio is defined as the parentage of married couples in the population. Clearly, there could be a difference between men and women. Since we are interested in population control, and assuming monogamy, we will measure the marriage ratio as the ratio between the total number of married women and the total number of women.
In order to be able to analyze strong-ties social networks, we distinguish between the two different types of links based on family ties, namely, sibling links and marital links. In our graphical illustrations, these two types of links are drawn in blue and red, respectively.
As a first illustration of the effects of the family parameters on societal fragmentation, let us consider two relevant examples, namely, the societal structure of the populations of current-day China and India.
Based on the national statistics of China, see [7], the family size distribution in urban society in China (with the vector truncated after the first six positions, i.e., taking the last entry to represent the fraction of families with 5 or more children) is
[TABLE]
The marriage ratio in China is [6].
Figure 1 depicts a social network denoted , generated by a simulation over a population of 157 individuals based on the above family parameters.
Similarly, based on recent data on family size in India, see [5], the family size distribution vector in India (again truncated after the first six positions, so that represents the fraction of families with 5 or more children) is
[TABLE]
Figure 2 depicts a social network denoted , generated by a simulation over a population of 130 individuals based on this family size distribution and an estimated222We were unable to ascertain the exact data for India. marriage ratio of .
As can be clearly seen, these two simulations exhibit strikingly different behavior between the resulting strong-ties social networks in terms of connectivity. Whereas the strong-ties social network is fragmented, the network remains connected and forms a giant component.
Our main goal in this paper is to try to explain and quantify the dependence of network fragmentation on the family parameters, in the hope of gaining a better understanding of the role and effects of population control policies.
1.3 Results
We begin (in Section 2) by formally defining a class of population control policies and introducing a number of typical examples. We then study the implications of these policies on societal fragmentation, by simulating the implementation of these policies on a population of 200 individuals, and inspecting the resulting strong-ties social networks.
Our simulations indicate that the family size distribution resulting from the employed population control policy directly affects fragmentation. More interestingly, it turns out that different policies may exhibit very different fragmentation effects, even when their effects on the population size are very similar.
We then turn to analyzing the probability that a given population control policy of the type described above will yield a fragmented society. In order to carry out this analysis we turn to studying infinite populations. This may appear odd, as clearly, population control deals with finite groups of people. However, mathematical analysis of percolation systems tends to be easier on infinite graphs. Moreover, there is a standard way to transform the result from infinite graphs to finite graphs. Basically, when dealing with infinite graphs the main question in percolation theory is the appearance of an infinite size connected component. In the context of a finite graph, this transforms into the existence of a linear sized “giant” connected component. Therefore, we prove our results on an infinite size population.
It follows from our results that strict policies, such as the 1-child policy employed in China until recently, effectively reduces population size, but are likely to result in a highly fragmented society, composed of many separate components. In fact, we prove that in order to avoid societal fragmentation, the population control policy must allow (at least a small fraction of) families of 3 or more children.
2 Population control policies
In this section we introduce a simple class of population control policies, characterized as follows. A population control policy is defined as a real vector
[TABLE]
where is the target fraction of families with children (or the desired probability that a random family will have children). These values should satisfy
[TABLE]
The condition imposed by the population control policy P is that at any given time, the family size distribution F must satisfy the following condition:
[TABLE]
A possible method that can be applied in order to implement such a policy would be as follows. For every family , draw a target integer at random with the distribution P, i.e., setting with probability for every . Consequently, the maximum number of children allowed for the family will be .
In order to demonstrate the sensitivity of the strong-ties social network to the population control policy used, we focus on a number of specific population control policies, to be described next.
We begin by comparing two basic policies, named hereafter the 1-child policy and the -children policy. Generally, these policies aim at reducing the population size by 50% in each generation, by attempting to impose an average of one child per family.
The 1-child policy (1C): Under this policy, each family is allowed at most one child. This policy can be described by the vector
[TABLE]
If imposed, such a policy ensures that at any given time,
[TABLE]
(or necessarily ), i.e., there are no families with two or more children.
In the context of our discussion, this policy may be viewed as representing (a simplified version of) the original Chinese population control policy.
The main effect of the 1-child policy is that it strongly curbs the population size. For example, consider a generation consisting of a hundred men and a hundred women, where the marriage ratio is . The (approximately) 90 couples of this generation will have (at most) one child per family. This means that the population size was reduced to well below 50% of the size of the previous generation.
What interests us about this policy, however, is the fact that it completely eliminates sibling ties from the network of the new generation. Hence the network breaks down into about 45 (disconnected) couples and a few unmarried individuals. Figure 3 depicts the resulting strong-ties social network of the new generation under policy 1C.
The -children policy (0/2C): This policy also attempts to maintain the average family size at one child. It is described by the vector
[TABLE]
namely, and all other probabilities are zero. As discussed earlier, such a policy can be implemented by flipping an unbiased coin for each family and, depending on the outcome, allowing the family either zero or two children333We deliberately ignore societal, moral and philosophical issues, such as fairness, involved in implementing such an “arbitrarily heartless” policy..
Observe that the outcome of applying the -children policy is essentially almost identical to that of the 1-child policy in terms of controlling population size. On the other hand, we claim that it does a better job maintaining sibling ties and thus keeping society connected.
Indeed, consider again the scenario of a generation consisting of a hundred men and a hundred women, with a marriage ratio of . Figure 4 depicts the resulting strong-ties social network of the next generation when applying policy 0/2C in this scenario.
Note that of the married couples of the first generation, about half will have (at most) two children per family, and the other half will have no children at all (hence these families will not be represented in the network of the next generation). This means that the goal of reducing the population size by 50% is achieved by the 0/2-child policy just as effectively as by the 1-child policy. However, the 0/2-child policy produces a next generation that still has sibling links, although perhaps not enough to maintain complete connectivity, as implied by the simulated network appearing in Figure 4.
Next, we similarly compare two population control policies that aim at maintaining the population size at steady state, i.e., attempt to impose an average of two children per family.
The 2-children policy (2C): Under this policy, each family is allowed at most two children. This policy can be described by the vector
[TABLE]
If imposed, such a policy ensures that at any given time,
[TABLE]
i.e., there are no families with three or more children.
In the context of our discussion, this policy may represent (a simplified version of) the new Chinese population control policy.
Again, this policy keeps population size more or less stable, but it also limits the number of sibling ties in the network. Returning to the scenario examined with the previous two policies, of 200 individuals with marriage ratio , under the 2-children policy the married couples of the first generation will have two children per family, so the population size in the next generation will remain similar to (or slightly smaller than) that of the previous generation. Note, hhowever, that sibling ties will occur in the resulting network of the new generation with the same frequency as in the 0/2C policy.
Figure 5 depicts the strong-ties social network of the new generation resulting in the above scenario under policy 2C. Observe that this network is similar in structure to the network of Figure 4, but is about twice its size.
The -children policy (0/3C): This policy also attempts to maintain the average family size at two children. It is described by the vector
[TABLE]
namely, and and all other probabilities are zero. Such a policy can be implemented by flipping an biased coin for each family and, depending on the outcome, allowing the family either zero or three children.
The outcome of applying this policy is essentially almost identical to that of the 2-child policy in terms of controlling population size, but again, its impact on societal fragmentation is rather different. This can be realized by inspecting Figure 6, which depicts the resulting strong-ties social network of the new generation when applying policy 0/3C in the scenario discussed above.
It should be realized that of the approximately 90 married couples of the original generation, about 30 families have no children, hence these families are not represented in the network. The other 60 families, however, have 3 children each, which yields a next generation with a population of about 180. Most significantly, observe that in this network, the effect of the higher fraction of families with three children already suffices to ensure rather solid connectivity.
3 Analysis
In this section we analyze the likelihood that the strong-ties social network becomes fragmented, and show that this is dependent on the two family parameters discussed above, namely, the family size distribution F and the marriage ratio , hence in turn it depends also on the population control policy P that’s being used.
One of the interesting implications of our analysis is that under the studied model, any population control policy that disallows families of 3 or more children incurs the possible risk of societal fragmentation.
Specifically, for the -children population control policy 0/3C, our results imply that there is a critical value for the marriage ratio , such that the network becomes fragmented for values below this threshold, and is connected for higher values.
As discussed earlier, we perform this analysis on an infinite size population, and hence our definition for societal fragmentation changes with respect to the simulation based observations presented in the previous section. We say that society is non-fragmented if an infinite size connected component emerges (with positive probability).
3.1 The Galton-Watson branching process
The Galton-Watson branching process (cf. [2], pp. 31-32) generates a (potentially infinite) tree rooted at . The level of a node in the tree is its distance from the root (whose level is 0).
Let , , be independent identically distributed nonnegative integer valued random variables, where represents the number of children on level of the th vertex on level . Let
[TABLE]
be a prescribed child distribution, where is the probability for children,
[TABLE]
Denote the expected value of by
[TABLE]
The Galton-Watson process constructs the tree iteratively as follows. For the th vertex on level , the process assigns the variable a value at random according to the child distribution p, and adds to this vertex exactly new children on level .
Figure 7 illustrates two possible outcomes of the Galton-Watson branching process.
Define the sequence , for all by
[TABLE]
and
[TABLE]
The variable represents the number of vertices at level (namely, at distance from the root).
We are now ready to cite Theorems 2.1.2, 2.1.3 and 2.1.4 from [2]. Let us denote by the probability that an infinite size connected component will emerge in the Galton-Watson branching process.
Theorem 1**.**
[2**]****
(a)
If then for all sufficiently large . (Hence , i.e., the resulting tree has no infinite size connected component.)
(b)
If and then for all sufficiently large . (Hence .)
(c)
If then for all sufficiently large . (Hence , i.e., the tree has an infinite size connected component with nonzero probability.)
3.2 The strong-ties branching process
In order to analyze the situation where the probability of a family to have exactly children is limited by the population control policy P to be at most , we use the following strong-ties branching process, which is similar to the Galton-Watson process.
The strong-ties branching process also constructs a (possibly infinite) tree rooted at . Here, however, each node in the tree represents a married couple. The level of a node in the tree is its distance from the root (whose level is 0). The level of a person is the level of the node (i.e., the couple) it belongs to.
We start with a married couple serving as the root of the process. The root’s children are new nodes representing the couples involving the married siblings of (either one of the spouses in) the couple . Note that each of those new nodes consists of two spouses, say, and . One of these spouses, say , has exactly one married sibling in and all the other married siblings are on level in the tree. All the married siblings of the other spouse, , are on level .
This construction process proceeds by induction. Consider a node , representid a married couple and , on level of the tree generated by the branching process. Its children are new nodes representing the couples involving the married siblings of and that are not in the tree already. For one of spouses, say , one married sibling is on level and all the other are on level . (We hereafter refer to this spouse as the “connected” spouse.) All the married siblings of the other spouse, , are on level of the tree. (We hereafter refer to this spouse as the “new” spouse.)
Observe that if we take into account all the sibling links among the added nodes, then the constructed strong-ties graph is not a tree, since nodes corresponding to siblings are connected by a clique. Figure 8 illustrates such a possible graph.
However, we may transform this graph into a strong-ties tree by erasing the clique connecting a group of siblings, and replacing it with a “star” connecting the first sibling (on some level ) to all other sibling (on the next level ). Figure 9 illustrates the strong-ties tree corresponding to the strong-ties graph of Figure 8.
Note that the resulting strong-ties tree is constructed rather similarly to the Galton-Watson tree . The only technical difference is that in the strong-ties branching process, the process is applied twice at the root . Hence, for example, the resulting tree depicted in Figure 9 corresponds to the tree obtained by “fusing” the roots of the two GW trees depicted in Figure 7.
To analyze the strong-ties branching process, we first compute the probability distribution of the actual number of children of an arbitrary non-root node. Denote this distribution by
[TABLE]
where is the probability that a non-root node will actually have children in the tree. Note that the number of children of a node in our process depends on two factors: one is the number of sibling of the new spouses, and the other is how many of those are married. We next derive the formula for , starting with the cases of children, and then analyzing the general case.
Consider first the case where a node on some level in the branching tree has [math] children. This means that in the married couple of the node , the new spouse comes from a family that has children for some , where only one of those is married and all other siblings are unmarried. Note that this married sibling is already in the tree (on level ). Therefore, the probability of this event to happen is
[TABLE]
Next, consider the case where a node on some level in the tree has one child. This means that in the married couple of the node , the new spouse comes from a family that has children for some , where only two of those siblings are married and the rest are unmarried. The probability of this event to happen is
[TABLE]
In the general case, where a node has children in the tree, the new spouse of comes from a family that havs children, where only of those siblings are married and the rest are not. The probability of this event to happen is
[TABLE]
We now use Theorem 1 to draw some conclusions on the size of the connected component of the strong-ties branching process that starts at . (Note that, as explained before, the strong-ties tree generated by the strong-ties branching process is similar to the Galton-Watson tree , and therefore the theorem is applicable to it as well.)
According to Theorem 1, the dynamics of the strong-ties branching process is completely determined by . So to understand the emergence of an infinite size connected component in the strong-ties social network, we need to determine the expected number of children in the strong-ties tree . This, by our calculations, is equal to
[TABLE]
We thus get the following. Denote by the probability that an infinite size connected component will emerge in the strong-ties branching process.
Theorem 2**.**
Assume that , and consider any population control policy s.t. for all . Then for all sufficiently large (hence ).
Proof.
By the definition of , if for all , then by Eq. (3) it follows that
[TABLE]
This implies that
[TABLE]
and in addition, by Eq. (4),
[TABLE]
Note that since , Eq. (2) implies that . It follows that . The theorem now follows from Thm. 1(a). ∎
Corollary 3**.**
For any population control policy P, having a nonzero fraction of families with 3 or more children (namely, for some ) is a necessary condition for the emergence of an infinite size component in the strong-ties branching process.
Proof.
By Theorem 2, having for some is a necessary condition for the emergence of an infinite size component in the strong-ties branching process. Assume, towards contradiction, that in the population control policy P, for every , and yet there exists some for which . Then
[TABLE]
but
[TABLE]
This contradicts Eq. (1) for . ∎
3.3 The strong-ties social network
Observe that the strong-ties social network is not necessarily a tree. The strong-ties branching process results in a tree because the nodes added to each level during the construction process are always new nodes. In contrast, in the strong-ties social network, even assuming an infinite supply of new nodes, there’s always the possibility that a cycle will occur due to the spouse selection process. In particular, if we try to mimic the branching process by looking at an arbitrary couple , and constructing the network around it level by level as in the branching process, it may happen that for a couple added to level , some of the siblings of both spouses already appear on level .
Denote by the probability that an infinite size connected component will emerge in a strong-ties social network on an infinite population. Then the above discussion implies that
[TABLE]
Hence the conclusion of Cor. 3 applies to strong-ties social networks as well.
Let us examine the two concrete examples of the 2-child policy 2C and the -child policy 0/3C presented earlier. Note that as a direct consequence of the last corollary, the 2-child policy prevents the emergence of an infinite size connected component. Hence the 2-child policy inherently yields a fragmented social network.
Turning to the -child policy, the situation depends on the marriage rate . For example, assume . Furthermore, assume that each family utilizes its allocated number of children to the maximum. Then
[TABLE]
Hence
[TABLE]
implying that such a policy stands a chance to keep society connected and result in an infinite size connected component (dependent on other parameters omitted from the discussion here, e.g., the possibility that a family allowed 3 children will actually have fewer children).
4 Conclusion
In this paper we examine the role of population control policies and show that they affect (simultaneously) two independent issues: they manage global population growth, but also affect the connectivity of strong social network ties.
We show that in order to avoid fragmentation of the strong-ties social network, it should be allowed to have families with three or more children, in order to overcome the (however small) percentage of unmarried people, which is an unavoidable phenomenon.
The paper gives several examples for population control policies, and shows that while some of them provide an equal guarantee on the number of people, there are vast differences in terms of the resulting fragmentation in the strong-ties social network.
A somewhat dissatisfying aspect of our model of population control policies is that some of the policies introduced in our model (such as 0/2C or 0/3C) involve a certain degree of unfairness, as they assign non-uniform family sizes. What’s worse, the assignment is done in an arbitrary way. This makes these policies inherently problematic from a moral point of view. To make such policies more viable, it may be desirable to consider ways to reduce or restrict their level of arbitrariness, and perhaps augment them by introducing some social mechanisms of exception handling.
To illustrate these considerations, and possible approaches towards handling them, let us give yet another concrete example for a possibly more attractive population control policy. Consider a policy such as the following, which, for lack of a better name, we might call the policy. Its probability distribution is
[TABLE]
It can be implemented by allowing each family two children, and in addition selecting 10% of the families and granting them permission for a third child. This selection may be done randomly (thus ensuring at least some minimal degree of fairness), or alternatively by applying a variety of social and economic criteria.
Such a policy (or one designed along similar principles) may succeed in curbing population size, keeping in mind the fact that the marriage ratio is below 1. Specifically, assuming , the expected population reduction in one generation when using policy is 3.4%, even assuming each family utilizes its quota of allowed children in full.
At the same time, the policy succeeds also in preventing societal fragmentation. Note that the expected value of when using policy is
[TABLE]
so assuming specifically , we get hence by Theorem 1(c), an infinite size connected component will emerge (in an infinite population) with nonzero probability.
Finally, the policy can be seen as significantly more balanced, and less harsh, compared to the ones discussed earlier.
The reference list from the paper itself. Each links out to its DOI / PubMed record.
- 1[1] Ronald S Burt. Structural holes: The social structure of competition . Harvard university press, 2009.
- 2[2] Rick Durrett. Random Graph Dynamics . Cambridge Univ. Press, 2007.
- 3[3] Esther C. L. Goh. China’s One-Child Policy and Multiple Caregiving: Raising little suns in Xiamen . Routledge, 2011.
- 4[4] Wentao Han, Xiaowei Zhu, Ziyan Zhu, Wenguang Chen, Weimin Zheng, and Jianguo Lu. Weibo, and a tale of two worlds. In Proc. 2015 IEEE/ACM Int. Conf. on Advances in Social Networks Analysis and Mining (ASONAM) , pages 121–128, 2015.
- 5[5] Census of India. HH-01 Normal Households By Household Size, 2011.
- 6[6] National Bureau of Statistics of China. women and Men in China: Facts and Figures 2012 . 2012.
- 7[7] National Bureau of Statistics of China. Table 2-15 Family households by size and region (2013), 2014.