Observational signatures of past mass-exchange episodes in massive binaries: The case of LSS 3074
F. Raucq, E. Gosset, G. Rauw, J. Manfroid, L. Mahy, N. Mennekens and, D. Vanbeveren

TL;DR
This study investigates the observational signatures of past mass exchange in the massive binary LSS 3074, revealing chemical anomalies, overcontact configuration, and evidence of Roche lobe overflow affecting its evolution.
Contribution
It provides a detailed analysis of LSS 3074's stellar parameters, chemical composition, and evolutionary history, highlighting the impact of past mass transfer episodes.
Findings
Confirmed low stellar masses and radii consistent with previous reports.
Detected nitrogen overabundance and carbon/oxygen depletion in both stars.
Identified strong helium enrichment and overcontact configuration.
Abstract
The role of mass and momentum exchanges in close massive binaries is very important in the subsequent evolution of the components. Such exchanges produce several observational signatures such as asynchronous rotation and altered chemical compositions, that remain after the stars detach again. We investigated these effects for the close O-star binary LSS 3074 (O4 f + O6-7 :(f):), which is a good candidate for a past Roche lobe overflow (RLOF) episode because of its very short orbital period, P = 2.185 days, and the luminosity classes of both components. We determined a new orbital solution for the system. We studied the photometric light curves to determine the inclination of the orbit and Roche lobe filling factors of both stars. Using phase-resolved spectroscopy, we performed the disentangling of the optical spectra of the two stars. We then analysed the reconstructed primary and…
Click any figure to enlarge with its caption.
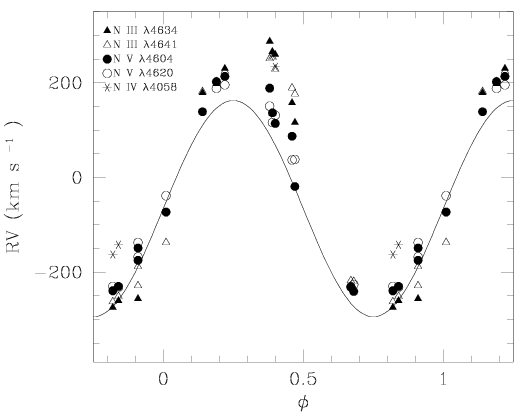 Figure 1
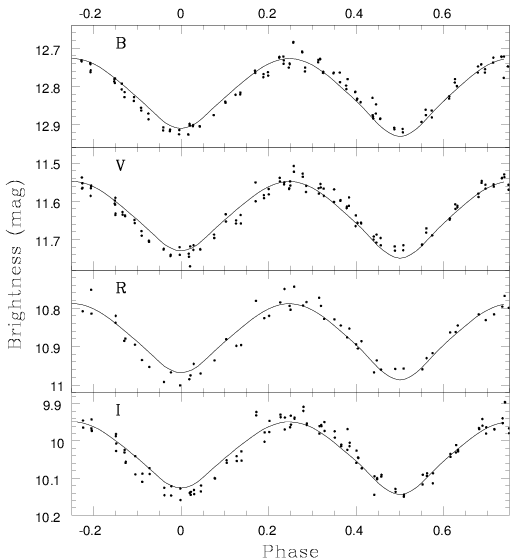 Figure 2
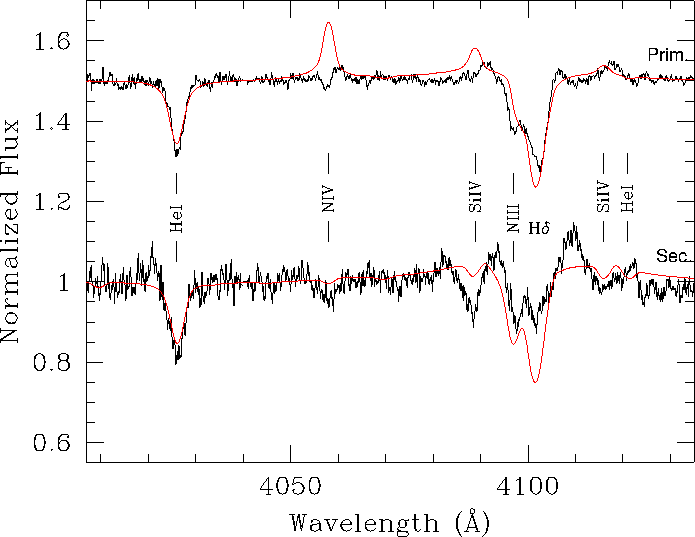 Figure 1
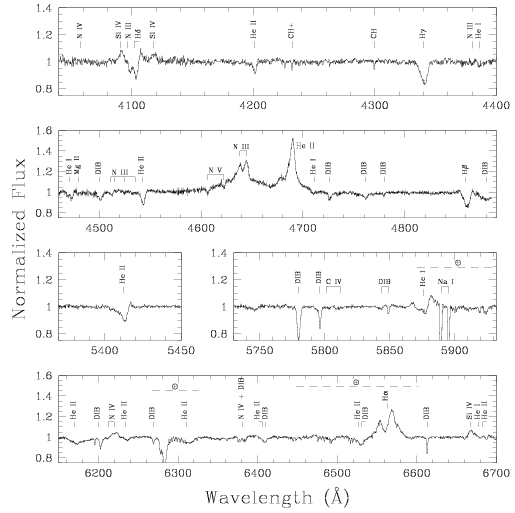 Figure 1
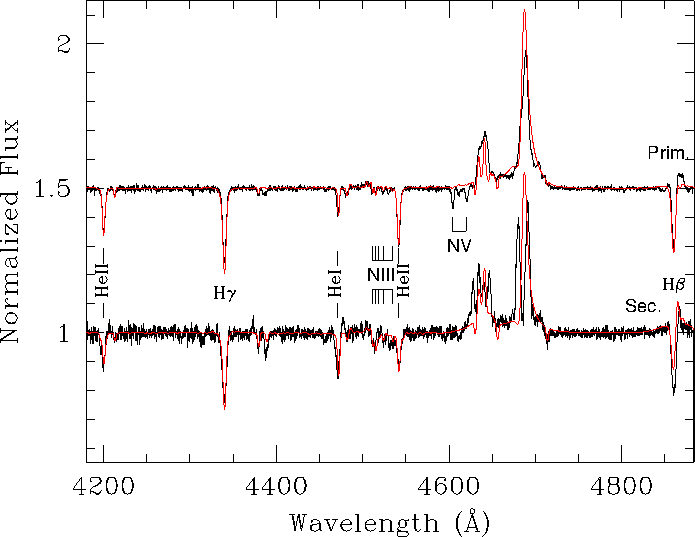 Figure 3
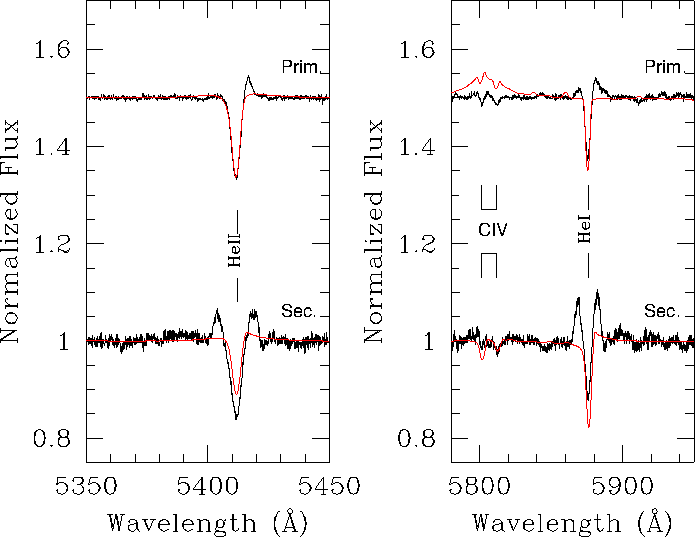 Figure 4
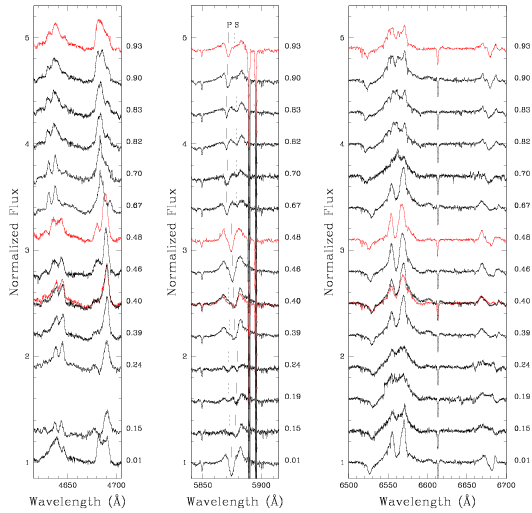 Figure 4
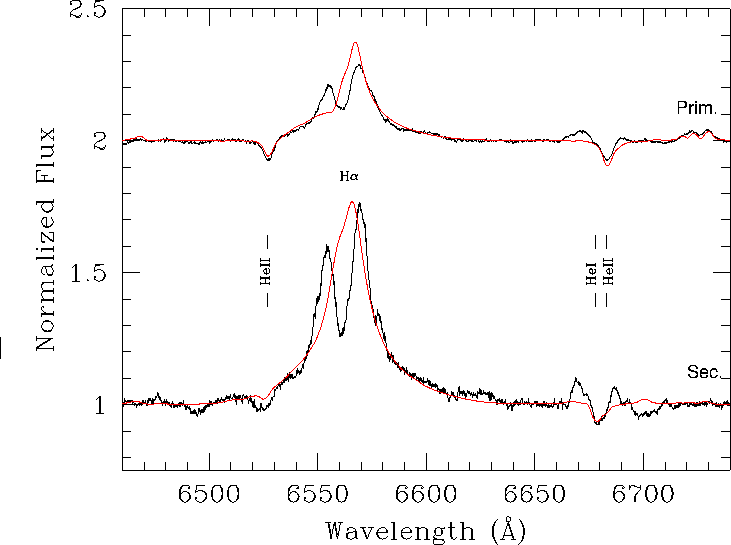 Figure 5
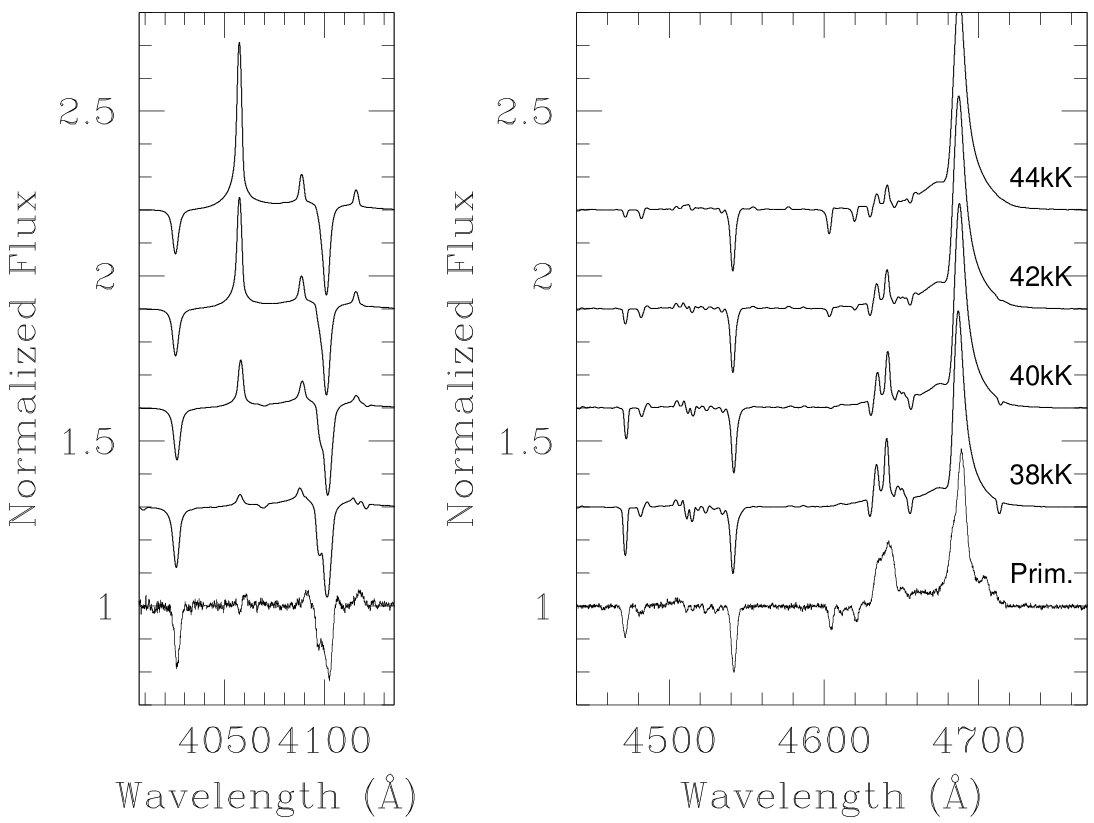 Figure 9
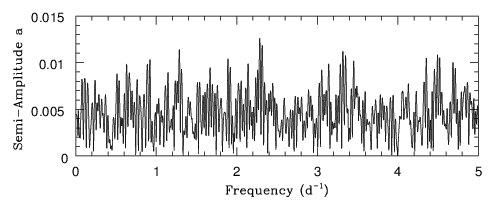 Figure 10
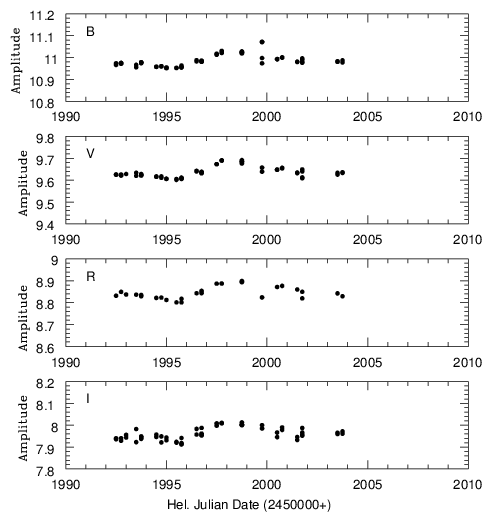 Figure 11
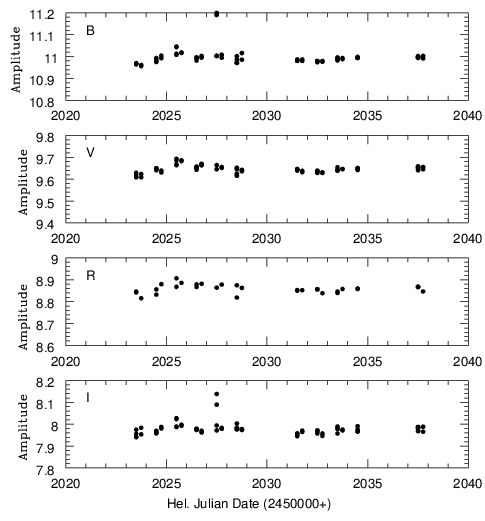 Figure 12
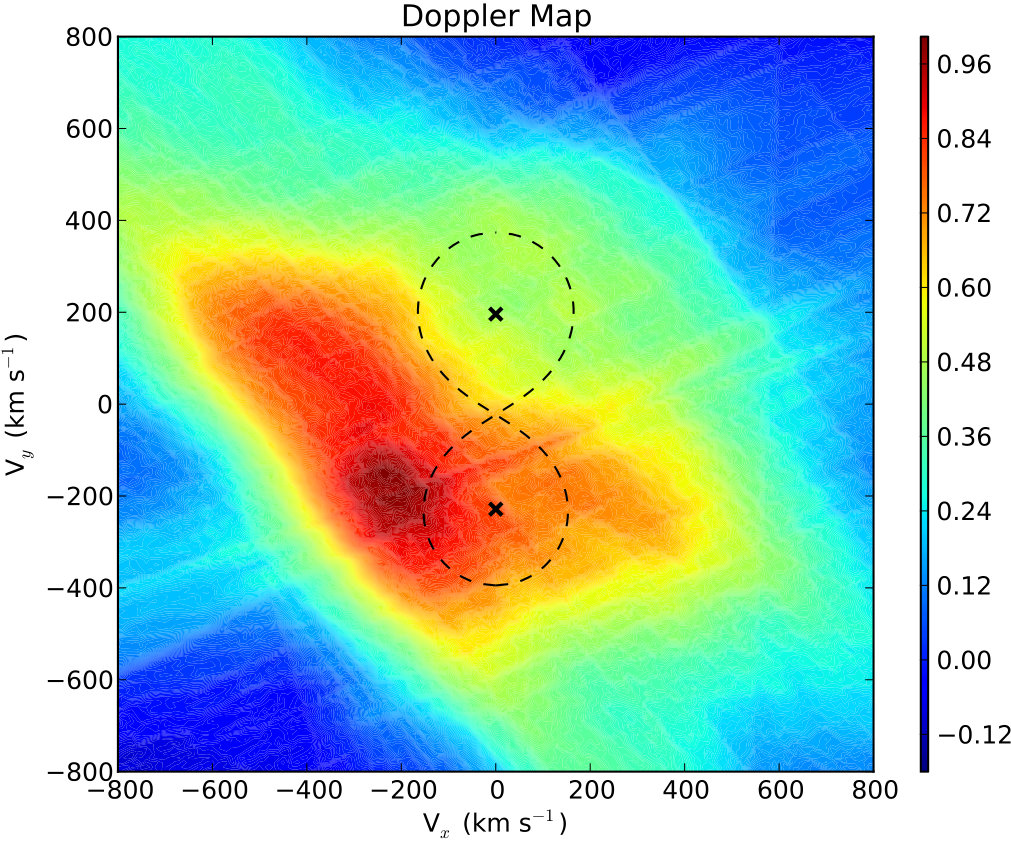 Figure 13
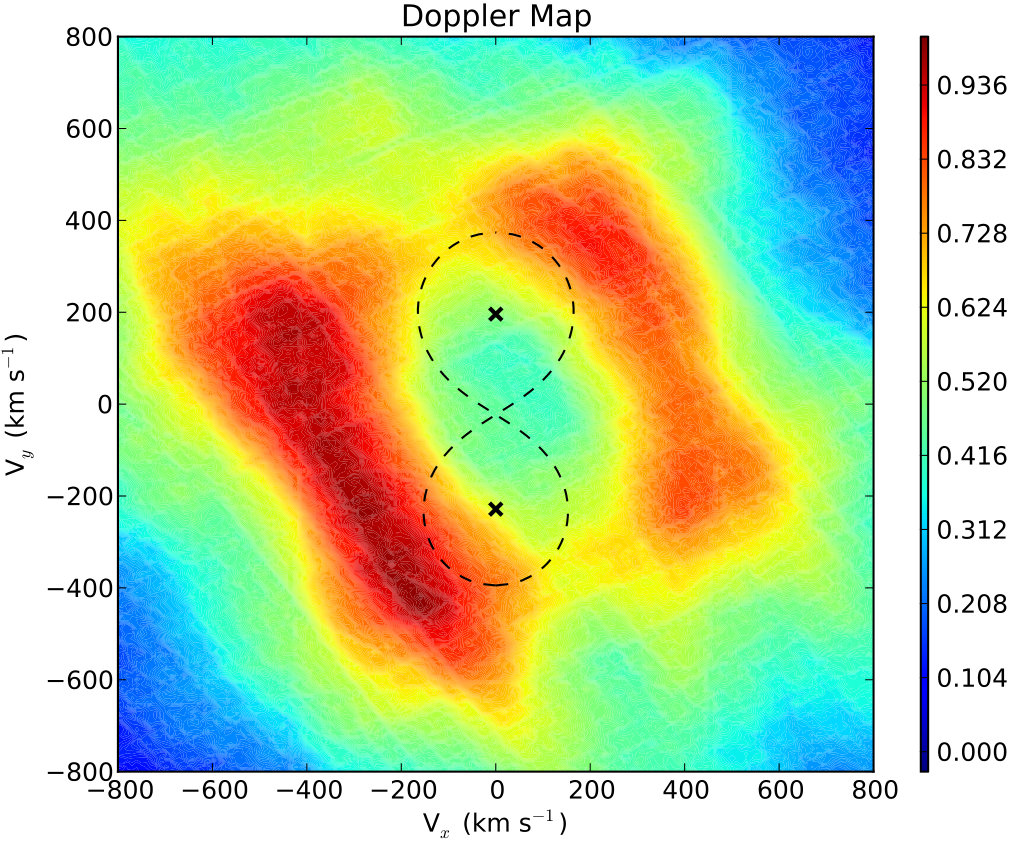 Figure 14
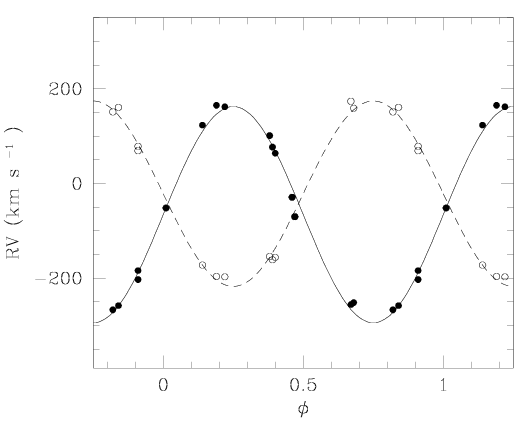 Figure 15
| HJD-2 450 000 | Instrument | Exp. time | RV1 | RV2 | RV1,corr | RV2,corr | |
|---|---|---|---|---|---|---|---|
| (min.) | (km s-1) | (km s-1) | (km s-1) | (km s-1) | |||
| 2353.719 | EMMI | 60 | 0.48 | -68.9 | -70.3 | ||
| 2354.691 | EMMI | 60 | 0.93 | -183.6 | 72.4 | -184.2 | 78.6 |
| 2355.720 | EMMI | 60 | 0.40 | 108.3 | -160.7: | 101.2 | -154.4: |
| 2381.596 | FEROS | 60 | 0.24 | 165.8 | -203.6 | 161.9 | -197.4 |
| 2382.597 | FEROS | 60 | 0.70 | -246.7: | 170.8: | -251.8: | 159.1: |
| 2383.598 | FEROS | 60 | 0.15 | 127.9: | -178.9: | 123.2: | -172.6: |
| 2783.576 | FEROS | 60 | 0.19 | 169.9: | -192.9 | 165.2: | -196.7 |
| 2784.620 | FEROS | 60 | 0.67 | -255.6: | 177.8: | -256.1: | 173.8: |
| 3130.613 | FEROS | 60 | 0.01 | -51.3 | -51.8 | ||
| 3131.594 | FEROS | 75 | 0.46 | -31.8 | -29.1 | ||
| 3132.576 | FEROS | 75 | 0.90 | -198.0 | 77.3: | -203.1 | 69.1: |
| 3133.629 | FEROS | 40 | 0.39 | 81.5 | -156.3 | 76.9 | -161.3 |
| 3133.660 | FEROS | 40 | 0.40 | 68.5 | -151.3: | 63.8 | -156.3: |
| 3134.578 | FEROS | 40 | 0.82 | -266.7 | 154.7 | -267.0 | 151.3 |
| 3134.608 | FEROS | 40 | 0.83 | -257.8 | 162.8 | -258.3 | 160.8 |
| Rev. | Instrument | Duration | JD(start) | JD(end) |
|---|---|---|---|---|
| (ks) | -2 450 000 | -2 450 000 | ||
| 0309 | MOS1 & pn | 9.9 & 6.0 | 2138.830 | 2138.945 |
| 0575 | MOS1 & MOS2 | 50.5 & 50.8 | 2668.865 | 2669.452 |
| Rev. | norm | |||||||
|---|---|---|---|---|---|---|---|---|
| (cm-2) | (keV) | (cm-5) | ( erg cm-2 s-1) | |||||
| 0309 | ||||||||
| 0575 | ||||||||
| comb. | ||||||||
| Spectrum | Wavelength (Å) |
|---|---|
| H i | 4340.47 |
| He i | 4471.48 |
| He ii | 4541.59 |
| He ii | 5411.52 |
| He i | 5875.62 |
| He ii | 6406.44 |
| He i | 7065.24 |
| Primary | Secondary | |
|---|---|---|
| (HJD - 2 450 000) | 2000.851 0.008 | |
| (km s-1) | -66.0 5.0 | -21.7 4.7 |
| K (km s-1) | 228.5 7.1 | 196.0 6.1 |
| a sin i (R⊙) | 9.9 0.3 | 8.5 0.3 |
| q = m1/m2 | 0.86 0.04 | |
| m sin3i (M⊙) | 8.0 0.5 | 9.3 0.7 |
| /() | 0.37 0.01 | 0.39 0.01 |
| sin i (R⊙) | 6.7 0.2 | 7.2 0.2 |
| 3.11 | ||
| Line | Equivalent Width (Å) | ||||||
|---|---|---|---|---|---|---|---|
| Observations | Synthetic spectra | Conti (Conti1 (1973, 1974)) | |||||
| Primary | Secondary | O5.5 | O7 | O5.5 | O7 | ||
| He i 4026 | 0.42 | 0.19 | 0.51 | 0.69 | 0.46 | 0.61 | 3.00 |
| He ii 4200 | 0.41 | 0.17 | 0.53 | 0.45 | 0.58 | 0.59 | 2.00 |
| H | 0.90 | 0.34 | 1.56 | 1.75 | 1.85 | 2.22 | 3.00 |
| He i 4471 | 0.25 | 0.26 | 0.29 | 0.61 | 0.29 | 0.59 | 2.08 |
| He ii 4542 | 0.56 | 0.19 | 0.62 | 0.53 | 0.75 | 0.67 | 2.43 |
| Parameters | Primary | Secondary |
|---|---|---|
| i (°) | ||
| q = m1/m2 | ||
| Filter | ||||
| d | ||||
| 0.0901 | 0.0910 | 0.0964 | 0.0980 | |
| 0.0022 | 0.0022 | 0.0039 | 0.0027 | |
| 5.96 | 2.92 | 2.65 | 2.66 | |
| 0.0171 | 0.0171 | 0.0212 | 0.0212 | |
| d | ||||
| 0.0118 | 0.0125 | 0.0107 | 0.0125 | |
| 0.0020 | 0.0020 | 0.0038 | 0.0020 | |
| 0.0896 | 0.0905 | 0.0958 | 0.0905 | |
| 0.0019 | 0.0019 | 0.0037 | 0.0019 | |
| 4.60 | 2.20 | 2.38 | 1.30 | |
| 0.0150 | 0.0148 | 0.0200 | 0.0148 | |
| 120 | 122 | 58 | 118 | |
| 0.007 | 0.010 | 0.013 | 0.013 | |
| Line | Primary | Secondary |
|---|---|---|
| Si iv 4089 | - | 126 |
| He ii 4200 | 115 | - |
| He i 4471 | 97 | - |
| He ii 4542 | 119 | - |
| He ii 5412 | - | 128 |
| N iii 6075 | 92 | - |
| He ii 6118 | 125 | - |
| Mean value | 110 13 | 127 6 |
| Prim. | Sec. | |
|---|---|---|
| (R⊙) | ||
| (M⊙) | ||
| ( K) | ||
| log(g) (cgs) | ||
| log () | ||
| 1.30 | 1.40 | |
| (km s-1) | 2615 | 3055 |
| (M⊙ yr-1) |
| Primary | Secondary | Sun | |
|---|---|---|---|
| He/H | 0.25 | 0.09 | 0.089 |
| C/H | |||
| N/H | |||
| O/H |
| no solution | 34+7.9 M⊙, 560 d | 34+15 M⊙, 1000 d | |
| no solution | 34+7.9 M⊙, 90 d | 34+15 M⊙, 80 d | |
| no solution | 34+7.9 M⊙, 5.3 d | 34+15 M⊙, 1.4 d |
Peer Reviews
No public reviews on file for this paper yet. If you reviewed it on a platform where reviews are public (OpenReview, ICLR, NeurIPS, ICML), you can paste yours below so the community can read it here.
Videos
No videos yet. Explain this paper in a talk, walkthrough, or lecture? Add one.
11institutetext: *(1)*Department of Astrophysics, Geophysics and Oceanography, Liège University, Liège, BELGIUM11institutetext: *(2)*LUPM, Montpellier University 2, Montpellier, France11institutetext: Space sciences, Technologies and Astrophysics Research (STAR) Institute, Liège University, Quartier Agora, Allée du 6 Août 19c, Bât. B5c, B-4000 Liège, Belgium 22institutetext: Astronomy and Astrophysics Research Group, Vrije Universiteit Brussel, Pleinlaan 2, 1050 Brussels, Belgium
Observational signatures of past mass-exchange episodes in
massive binaries : The case of LSS 3074††thanks: Based on observations collected at the European Southern Observatory (La Silla, Chile) and the Cerro Tololo Inter-American Observatory (Chile). CTIO is a division of the National Optical Astronomy Observatory (NOAO). NOAO is operated by the Association of Universities for Research in Astronomy (AURA), Inc., under cooperative agreement with the National Science Foundation (USA). Also based on observations collected with XMM-Newton, an ESA science mission with instruments and contributions directly funded by ESA member states and the USA (NASA).,††thanks: Tables A1, A2 and A3 are only available in electronic form at the CDS via anonymous ftp to cdsarc.u-strasbg.fr (130.79.128.5) or via http://cdsweb.u-strasbg.fr/cgi-bin/qcat?J/A+A/
F. Raucq*(1)*
G. Rauw*(1)*
E. Gosset*(1)*
Y. Nazé*(1)*
L. Mahy*(1)*
A. Hervé*(2)*
and F. Martins*(2)*
F. Raucq Observational signatures of past mass-exchange episodes in massive binaries : The case of LSS 3074††thanks: Based on observations collected at the European Southern Observatory (La Silla, Chile) and the Cerro Tololo Inter-American Observatory (Chile). CTIO is a division of the National Optical Astronomy Observatory (NOAO). NOAO is operated by the Association of Universities for Research in Astronomy (AURA), Inc., under cooperative agreement with the National Science Foundation (USA). Also based on observations collected with XMM-Newton, an ESA science mission with instruments and contributions directly funded by ESA member states and the USA (NASA).,††thanks: Tables A1, A2 and A3 are only available in electronic form at the CDS via anonymous ftp to cdsarc.u-strasbg.fr (130.79.128.5) or via http://cdsweb.u-strasbg.fr/cgi-bin/qcat?J/A+A/ Observational signatures of past mass-exchange episodes in massive binaries : The case of LSS 3074††thanks: Based on observations collected at the European Southern Observatory (La Silla, Chile) and the Cerro Tololo Inter-American Observatory (Chile). CTIO is a division of the National Optical Astronomy Observatory (NOAO). NOAO is operated by the Association of Universities for Research in Astronomy (AURA), Inc., under cooperative agreement with the National Science Foundation (USA). Also based on observations collected with XMM-Newton, an ESA science mission with instruments and contributions directly funded by ESA member states and the USA (NASA).,††thanks: Tables A1, A2 and A3 are only available in electronic form at the CDS via anonymous ftp to cdsarc.u-strasbg.fr (130.79.128.5) or via http://cdsweb.u-strasbg.fr/cgi-bin/qcat?J/A+A/
E. Gosset Observational signatures of past mass-exchange episodes in massive binaries : The case of LSS 3074††thanks: Based on observations collected at the European Southern Observatory (La Silla, Chile) and the Cerro Tololo Inter-American Observatory (Chile). CTIO is a division of the National Optical Astronomy Observatory (NOAO). NOAO is operated by the Association of Universities for Research in Astronomy (AURA), Inc., under cooperative agreement with the National Science Foundation (USA). Also based on observations collected with XMM-Newton, an ESA science mission with instruments and contributions directly funded by ESA member states and the USA (NASA).,††thanks: Tables A1, A2 and A3 are only available in electronic form at the CDS via anonymous ftp to cdsarc.u-strasbg.fr (130.79.128.5) or via http://cdsweb.u-strasbg.fr/cgi-bin/qcat?J/A+A/ Observational signatures of past mass-exchange episodes in massive binaries : The case of LSS 3074††thanks: Based on observations collected at the European Southern Observatory (La Silla, Chile) and the Cerro Tololo Inter-American Observatory (Chile). CTIO is a division of the National Optical Astronomy Observatory (NOAO). NOAO is operated by the Association of Universities for Research in Astronomy (AURA), Inc., under cooperative agreement with the National Science Foundation (USA). Also based on observations collected with XMM-Newton, an ESA science mission with instruments and contributions directly funded by ESA member states and the USA (NASA).,††thanks: Tables A1, A2 and A3 are only available in electronic form at the CDS via anonymous ftp to cdsarc.u-strasbg.fr (130.79.128.5) or via http://cdsweb.u-strasbg.fr/cgi-bin/qcat?J/A+A/
G. Rauw Observational signatures of past mass-exchange episodes in massive binaries : The case of LSS 3074††thanks: Based on observations collected at the European Southern Observatory (La Silla, Chile) and the Cerro Tololo Inter-American Observatory (Chile). CTIO is a division of the National Optical Astronomy Observatory (NOAO). NOAO is operated by the Association of Universities for Research in Astronomy (AURA), Inc., under cooperative agreement with the National Science Foundation (USA). Also based on observations collected with XMM-Newton, an ESA science mission with instruments and contributions directly funded by ESA member states and the USA (NASA).,††thanks: Tables A1, A2 and A3 are only available in electronic form at the CDS via anonymous ftp to cdsarc.u-strasbg.fr (130.79.128.5) or via http://cdsweb.u-strasbg.fr/cgi-bin/qcat?J/A+A/ Observational signatures of past mass-exchange episodes in massive binaries : The case of LSS 3074††thanks: Based on observations collected at the European Southern Observatory (La Silla, Chile) and the Cerro Tololo Inter-American Observatory (Chile). CTIO is a division of the National Optical Astronomy Observatory (NOAO). NOAO is operated by the Association of Universities for Research in Astronomy (AURA), Inc., under cooperative agreement with the National Science Foundation (USA). Also based on observations collected with XMM-Newton, an ESA science mission with instruments and contributions directly funded by ESA member states and the USA (NASA).,††thanks: Tables A1, A2 and A3 are only available in electronic form at the CDS via anonymous ftp to cdsarc.u-strasbg.fr (130.79.128.5) or via http://cdsweb.u-strasbg.fr/cgi-bin/qcat?J/A+A/
J. Manfroid Observational signatures of past mass-exchange episodes in massive binaries : The case of LSS 3074††thanks: Based on observations collected at the European Southern Observatory (La Silla, Chile) and the Cerro Tololo Inter-American Observatory (Chile). CTIO is a division of the National Optical Astronomy Observatory (NOAO). NOAO is operated by the Association of Universities for Research in Astronomy (AURA), Inc., under cooperative agreement with the National Science Foundation (USA). Also based on observations collected with XMM-Newton, an ESA science mission with instruments and contributions directly funded by ESA member states and the USA (NASA).,††thanks: Tables A1, A2 and A3 are only available in electronic form at the CDS via anonymous ftp to cdsarc.u-strasbg.fr (130.79.128.5) or via http://cdsweb.u-strasbg.fr/cgi-bin/qcat?J/A+A/ Observational signatures of past mass-exchange episodes in massive binaries : The case of LSS 3074††thanks: Based on observations collected at the European Southern Observatory (La Silla, Chile) and the Cerro Tololo Inter-American Observatory (Chile). CTIO is a division of the National Optical Astronomy Observatory (NOAO). NOAO is operated by the Association of Universities for Research in Astronomy (AURA), Inc., under cooperative agreement with the National Science Foundation (USA). Also based on observations collected with XMM-Newton, an ESA science mission with instruments and contributions directly funded by ESA member states and the USA (NASA).,††thanks: Tables A1, A2 and A3 are only available in electronic form at the CDS via anonymous ftp to cdsarc.u-strasbg.fr (130.79.128.5) or via http://cdsweb.u-strasbg.fr/cgi-bin/qcat?J/A+A/
L. Mahy Observational signatures of past mass-exchange episodes in massive binaries : The case of LSS 3074††thanks: Based on observations collected at the European Southern Observatory (La Silla, Chile) and the Cerro Tololo Inter-American Observatory (Chile). CTIO is a division of the National Optical Astronomy Observatory (NOAO). NOAO is operated by the Association of Universities for Research in Astronomy (AURA), Inc., under cooperative agreement with the National Science Foundation (USA). Also based on observations collected with XMM-Newton, an ESA science mission with instruments and contributions directly funded by ESA member states and the USA (NASA).,††thanks: Tables A1, A2 and A3 are only available in electronic form at the CDS via anonymous ftp to cdsarc.u-strasbg.fr (130.79.128.5) or via http://cdsweb.u-strasbg.fr/cgi-bin/qcat?J/A+A/ Observational signatures of past mass-exchange episodes in massive binaries : The case of LSS 3074††thanks: Based on observations collected at the European Southern Observatory (La Silla, Chile) and the Cerro Tololo Inter-American Observatory (Chile). CTIO is a division of the National Optical Astronomy Observatory (NOAO). NOAO is operated by the Association of Universities for Research in Astronomy (AURA), Inc., under cooperative agreement with the National Science Foundation (USA). Also based on observations collected with XMM-Newton, an ESA science mission with instruments and contributions directly funded by ESA member states and the USA (NASA).,††thanks: Tables A1, A2 and A3 are only available in electronic form at the CDS via anonymous ftp to cdsarc.u-strasbg.fr (130.79.128.5) or via http://cdsweb.u-strasbg.fr/cgi-bin/qcat?J/A+A/
N. Mennekens Observational signatures of past mass-exchange episodes in massive binaries : The case of LSS 3074††thanks: Based on observations collected at the European Southern Observatory (La Silla, Chile) and the Cerro Tololo Inter-American Observatory (Chile). CTIO is a division of the National Optical Astronomy Observatory (NOAO). NOAO is operated by the Association of Universities for Research in Astronomy (AURA), Inc., under cooperative agreement with the National Science Foundation (USA). Also based on observations collected with XMM-Newton, an ESA science mission with instruments and contributions directly funded by ESA member states and the USA (NASA).,††thanks: Tables A1, A2 and A3 are only available in electronic form at the CDS via anonymous ftp to cdsarc.u-strasbg.fr (130.79.128.5) or via http://cdsweb.u-strasbg.fr/cgi-bin/qcat?J/A+A/ Observational signatures of past mass-exchange episodes in massive binaries : The case of LSS 3074††thanks: Based on observations collected at the European Southern Observatory (La Silla, Chile) and the Cerro Tololo Inter-American Observatory (Chile). CTIO is a division of the National Optical Astronomy Observatory (NOAO). NOAO is operated by the Association of Universities for Research in Astronomy (AURA), Inc., under cooperative agreement with the National Science Foundation (USA). Also based on observations collected with XMM-Newton, an ESA science mission with instruments and contributions directly funded by ESA member states and the USA (NASA).,††thanks: Tables A1, A2 and A3 are only available in electronic form at the CDS via anonymous ftp to cdsarc.u-strasbg.fr (130.79.128.5) or via http://cdsweb.u-strasbg.fr/cgi-bin/qcat?J/A+A/
and D. Vanbeveren Observational signatures of past mass-exchange episodes in massive binaries : The case of LSS 3074††thanks: Based on observations collected at the European Southern Observatory (La Silla, Chile) and the Cerro Tololo Inter-American Observatory (Chile). CTIO is a division of the National Optical Astronomy Observatory (NOAO). NOAO is operated by the Association of Universities for Research in Astronomy (AURA), Inc., under cooperative agreement with the National Science Foundation (USA). Also based on observations collected with XMM-Newton, an ESA science mission with instruments and contributions directly funded by ESA member states and the USA (NASA).,††thanks: Tables A1, A2 and A3 are only available in electronic form at the CDS via anonymous ftp to cdsarc.u-strasbg.fr (130.79.128.5) or via http://cdsweb.u-strasbg.fr/cgi-bin/qcat?J/A+A/ Observational signatures of past mass-exchange episodes in massive binaries : The case of LSS 3074††thanks: Based on observations collected at the European Southern Observatory (La Silla, Chile) and the Cerro Tololo Inter-American Observatory (Chile). CTIO is a division of the National Optical Astronomy Observatory (NOAO). NOAO is operated by the Association of Universities for Research in Astronomy (AURA), Inc., under cooperative agreement with the National Science Foundation (USA). Also based on observations collected with XMM-Newton, an ESA science mission with instruments and contributions directly funded by ESA member states and the USA (NASA).,††thanks: Tables A1, A2 and A3 are only available in electronic form at the CDS via anonymous ftp to cdsarc.u-strasbg.fr (130.79.128.5) or via http://cdsweb.u-strasbg.fr/cgi-bin/qcat?J/A+A/ [email protected]
Abstract
*Context. *The role of mass and momentum exchanges in close massive binaries is very important in the subsequent evolution of the components. Such exchanges produce several observational signatures such as asynchronous rotation and altered chemical compositions, that remain after the stars detach again.
*Aims. *We investigated these effects for the close O-star binary LSS 3074 (O4 f + O6-7 :(f):), which is a good candidate for a past Roche lobe overflow (RLOF) episode because of its very short orbital period, *P *= 2.185 days, and the luminosity classes of both components.
*Methods. *We determined a new orbital solution for the system. We studied the photometric light curves to determine the inclination of the orbit and Roche lobe filling factors of both stars. Using phase-resolved spectroscopy, we performed the disentangling of the optical spectra of the two stars. We then analysed the reconstructed primary and secondary spectra with the CMFGEN model atmosphere code to determine stellar parameters, such as the effective temperatures and surface gravities, and to constrain the chemical composition of the components.
*Results. *We confirm the apparent low stellar masses and radii reported in previous studies. We also find a strong overabundance in nitrogen and a strong carbon and oxygen depletion in both primary and secondary atmospheres, together with a strong enrichment in helium of the primary star.
*Conclusions. *We propose several possible evolutionary pathways through a RLOF process to explain the current parameters of the system. We confirm that the system is apparently in overcontact configuration and has lost a significant portion of its mass to its surroundings. We suggest that some of the discrepancies between the spectroscopic and photometric properties of LSS 3074 could stem from the impact of a strong radiation pressure of the primary.
Key Words.:
Stars: early-type – binaries: spectroscopic – Stars: fundamental parameters – Stars: massive – Stars: individual: LSS 3074
††offprints: F. Raucq
1 Introduction
Some recent studies have shown that a high percentage of massive stars belong to binary or higher multiplicity systems (e.g. Mason et al. Mason98 (1998), Sana et al. Sana (2012), Sana et al. Sana14 (2014), Sota et al. Sota14 (2014)). This multiplicity enables us to observationally determine the minimum masses of the stars through their orbital motion, but it also influences the evolution of the stars in various ways (e.g. Langer Langer1 (2012)). These evolutionary effects range from tidally induced rotational mixing (e.g. de Mink et al. deMink (2009)), over exchange of matter and angular momentum through a Roche lobe overflow (RLOF) interaction (e.g. Podsiadlowski et al. Podsiadlowski (1992), de Loore & Vanbeveren dLV (1994), Wellstein et al. Wellstein (2001), Hurley et al. Hurley (2002)), to the merging of both stars (e.g. Podsiadlowski et al. Podsiadlowski (1992), Wellstein et al. Wellstein (2001)). In RLOF interactions, one distinguishes three different situations: case A, if the RLOF episode occurs when the mass donor is on the core hydrogen-burning main sequence; case B, when the star is in the hydrogen shell burning phase; and case C, when the star is in the helium shell burning phase (Kippenhahn & Weigert KW (1967), Vanbeveren et al. VDLVR (1998)). Such binary interactions significantly affect the physical properties of the components and their subsequent evolution. Despite considerable progresses in theoretical models, a number of open issues, such as the actual efficiency of accretion, remain (e.g. Wellstein et al. Wellstein (2001), de Mink et al. deMink1 (2007), Dray & Tout DT (2007)). To better understand this phenomenon, in-depth studies of systems undergoing or having undergone mass exchange are needed.
In this context, the short-period spectroscopic binary LSS 3074 (also identified as V889 Cen and ALS 3074), classified as O4f*+*
- O6-7:(f): (Morrell & Niemela Morrell (1990)), with days, is an extremely interesting target. This system is located behind the Coalsack region. The distance of this region was evaluated as 188 4 pc (Seidensticker Seidensticker (1989) and Seidensticker & Schmidt-Kaler Seid-Schmi (1989)). LSS 3074 harbours one of the very few known O4f stars. These objects are rare since they probably represent a short-lived transition phase in the evolution of massive O-type stars before they become Wolf-Rayet stars. In addition, the very short orbital period of this system makes it a good candidate for a past RLOF episode. Obtaining a good orbital and photometric solution for this system and determining the fundamental properties of its components are therefore of the utmost importance to better understand these transition objects.
A first preliminary orbital solution of LSS 3074 was presented by Morrell & Niemela (Morrell (1990)). The low sin values inferred from this orbital solution (8 and 9 M*⊙) are rather surprising for such early-type objects. Niemela et al. (Niemela (1992)) provided an improved orbital solution and they discussed the phase-locked polarization variability of this system. Fitting a model to these variations, they inferred an inclination of , yielding very low absolute masses of 10-11 M⊙* and 11-12 M*⊙* for the O4f*+* and the O6-7 component, respectively. Niemela et al. cautioned however that tidal deformations could introduce additional polarization, biasing the inclination towards 90°. Optical light variations of LSS 3074 were first reported by Haefner et al. (Haefner (1994)), although these authors did not achieve a phase coverage of the light curve allowing them to clearly distinguish ellipsoidal variations from photometric eclipses. Haefner et al. suggested an inclination of 50-55°, yielding again rather low masses of 17-21 M*⊙* for both components.
In the present study, we discuss our determination of the orbital solution of this system and of the fundamental parameters of its components through several analysis techniques. Some very preliminary results were given in Gosset et al. (Gosset05 (2005)). The data used in our study are discussed in Sect. 2. In Sect. 3 and Sect. 4, we present the optical spectrum of LSS 3074 and our determination of its orbital solution. In Sect. 5, we perform a line profile variability study of several important lines of the optical spectrum of LSS 3074. In Sect. 6, we present the preparatory treatment of our data, including the disentangling of the observed spectra to reconstruct individual spectra of the binary components needed for the subsequent spectral analysis, and in Sect. 7, we analyse the light curve. The spectral analyses, carried out with the non-LTE model atmosphere code CMFGEN, are presented in Sect. 8. In Sect. 9, we conclude by a discussion concerning the evolutionary status of LSS 3074.
2 Observations and data reduction
2.1 Spectroscopy
Optical spectra of LSS 3074 were gathered with different instruments during several observing runs between 2002 and 2004 (see Table 1).
Three spectra were obtained with the EMMI instrument on the New Technology Telescope (NTT) at the European Southern Observatory (ESO) at La Silla during a three-day observing run in March 2002. The EMMI instrument was used in the échelle mode with grating #9 and grism #3, providing a resolving power of 7700. The data were reduced using the ECHELLE context of MIDAS, and 16 usable spectral orders, covering the wavelength domain from 4040 to 7000 Å, were extracted and normalized individually.
Twelve échelle spectra of LSS 3074 were taken with the Fiber-fed Extended Range Optical Spectrograph (FEROS; Kaufer et al. Kaufer (1999)). In April 2002, the spectrograph was attached to the ESO 1.52 m telescope at La Silla, while in May 2003 and May 2004, it was used at the 2.2 m ESO/MPE telescope at La Silla. The exposure times were 40 - 75 minutes. The detector was an EEV CCD with 2048 4096 pixels of mm. We used an improved version of the FEROS context within the MIDAS package provided by ESO to reduce the data (Sana et al. 2006a ).
2.2 Photometry
During March-April-May 2001, LSS 3074 was observed in photometry with the Yale 1m telescope at the Cerro Tololo Interamerican Observatory. The telescope was operated in service mode (project A01A0098, PI E. Gosset) by the YALO consortium. The telescope was equipped with the imaging camera ANDICAM.
Beyond some shortening due to bad weather conditions, the run was initially split into two periods: from HJD 2 451 992 (2001-03-24) to HJD 2 452 003 (2001-04-04) and from HJD 2 452 023 (2001-04-24) to HJD 2 452 037 (2001-05-08). It was designed to optimize the Fourier spectral window for period determination with the least observing effort, while reaching a frequency resolution corresponding to a total duration of about 50 days without being hampered by the aliasing due to the central gap. In order to reduce the effect of the one-day aliasing in the photometric data, we tried to observe the star three times per night roughly at 3 hours before meridian, at meridian and at 3 hours after it.
The ANDICAM camera was equipped with a Loral CCD of 2048 by 2048 15m pixels. The projection of a pixel on the sky corresponds to 0.30″ allowing a convenient sampling. The whole field was thus covering a 10′ by 10′ square on the sky. The CCD was read out with two amplifiers. At the time of the observations it was characterized by a 11 e*-/pixel readout noise; the gain was set to 3.6 e-* per ADU. Half of the CCD presented a variable noise pattern but the amplitude was sufficiently small not to be a concern. Moreover, LSS 3074 was systematically centred on the best half of the CCD.
The various measurements were performed using the Johnson system , , , and filters. Each measurement consisted of exposures of 210 s in , 23 s in , 11 s in , and 21 s in . For each night, a minimum of five dome flat fields in each filter and of 20 bias frames were acquired. A few Stetson standard fields (PG0918, PG1047, PG1323, PG1633, and SA107) were observed on three good nights (May 4, 5, and 8) to calibrate the above-mentioned photometric observations.
We reduced the raw data in the standard way (bias subtraction, division by a combined flat field, etc.) independently for the two halves of the CCD. The list of objects were built and the relevant instrumental magnitudes were extracted via DAOPHOT (Stetson Stetson (1987)) under IRAF with both an aperture integration approach and a psf-fitting technique. A consistent natural system was established using a multi-night, multi-star, and multi-filter method as described in Manfroid (Manfroid1 (1993); see also Manfroid et al. Manfroid2 (2001)). A set of constant stars was iteratively constructed to perform precise relative photometry. The differential data were calculated with an aperture radius of 1.5″. A least-square fit of the standard star data allowed us to obtain absolute zero points and colour transformation coefficients using the large aperture (3.3″) data. The derived colour transformation equations were
[TABLE]
[TABLE]
[TABLE]
[TABLE]
The internal precision of the data corresponds to = 0.007, 0.010, 0.013, and 0.013 mag for the , , , and filters respectively, whereas the accuracy of the absolute magnitudes turned out to be = 0.02 mag. The measurements for LSS 3074 are available at the CDS in Table A1. During the iterative removing of the variable stars, two stars were rejected early in the process and turned out to be significantly variable, i.e. HD 116827 and LSS 3072. They are further discussed in the Appendix and the corresponding measurements are available at the CDS in Tables A2 and A3.
2.3 XMM-Newton observations
XMM-Newton (Jansen et al. (2001)) observed LSS 3074 twice. The first observation (ObsID 0109100201), taken in August 2001, was centred on LSS 3074 itself. The three EPIC (Strüder et al. (2001); Turner et al. (2001)) cameras were operated in full-frame mode and the medium filter was used to discard optical and UV light. The corresponding X-ray image of the field can be found in Gosset et al. Gosset05 (2005). A second observation (ObsID 0036140201), centred on the low-mass X-ray binary XB 1323-619, was taken in January 2003. This time, the EPIC-pn camera and the central chip of the EPIC-MOS1 were operated in timing mode, whilst the EPIC-MOS2 was used in full-frame mode. All EPIC cameras were used in combination with the thin filter. The detectors used in timing mode do not provide data concerning LSS 3074. But since the star is located relatively far off axis in the second observation, it fell on one of the peripheral CCD chips of both MOS detectors. The raw data were processed with SAS v15.0.0 using calibration files available in June 2016 and following the recommendations of the XMM-Newton team222http://xmm.esac.esa.int/sas/current/documentation/threads/ . We notably filtered the data to keep only best-quality data (pattern of 0–12 for EPIC-MOS and 0–4 for EPIC-pn data). Whilst the background level was high during the first observation, no genuine background flares due to soft protons affected either of the two observations. In the first observation, LSS 3074 falls very close to the out-of-time events of the very bright X-ray binary in the MOS2 data, thus rendering these specific data difficult to use.
We extracted the EPIC spectra of LSS 3074 via the task especget. For the source regions, we used a circular region with radius 30″, centred on the Simbad coordinates of the binary. The background was evaluated over an annulus with inner and outer radii of 30 and 45″, respectively. Specific ARF and RMF response files were computed to calibrate the flux and energy axes. The EPIC spectra were grouped with the SAS command specgroup to obtain an oversampling factor of five and to ensure that a minimum signal-to-noise ratio of 3 (i.e. a minimum of 10 counts) was reached in each spectral bin of the background-corrected spectra.
The EPIC spectrum of LSS 3074 peaks between 1.0 and 2.0 keV. It contains very few photons at energies below 1.0 keV (mainly as a result of the heavy absorption) and displays very weak emission at energies above 2 keV. The fits of the X-ray spectra were performed with xspec (Arnaud (1996)) version 12.9.0i. To evaluate the neutral hydrogen column density due to the interstellar medium (ISM), we adopt . Accounting for the intrinsic quoted by Martins & Plez (2006) and using the conversion between colour excess and neutral hydrogen column density of Bohlin et al. (1978), we estimate cm*-2*. The X-ray absorption by the ISM was modelled using the Tübingen-Boulder model (Wilms et al. (2000)). X-ray spectra from massive stars can be further absorbed by the material of the ionized stellar wind. To model such an absorption, we imported the stellar wind absorption model of Nazé et al. (2004) into xspec as a multiplicative tabular model (hereafter labelled as wind). To the first approximation, the emission from massive stars can be represented by models of collisionally ionized equilibrium optically thin thermal plasmas. In our fits, we used apec models (Smith & Brickhouse (2001)) computed with ATOMBD v2.0.2 as provided within xspec. The plasma abundances were taken to be solar (Asplund et al. (2009)). Given the rather low quality of the spectra, reasonable fits were obtained for models of the kind tbabswindapec. The results are listed in Table 3. Whilst the best-fit parameters of the two observations differ, these differences could be due to the ambiguity between a soft, highly absorbed plasma and a harder, less absorbed plasma. We have thus also performed a fit of the combined datasets. The results are again quoted in Table 3.
We find that the X-ray flux corrected for the ISM absorption is close to erg cm*-2* s*-1*. If we consider the and magnitudes of LSS 3074 along with the bolometric corrections from Martins & Plez (2006), we obtain which, given the uncertainties on both the X-ray and bolometric fluxes, is entirely compatible with the canonical value observed for most O-type stars (Sana et al. 2006b , (Nazé, 2009, and references therein)).
3 Optical spectrum of LSS 3074
The spectrum of LSS 3074 is illustrated in Fig. 1. The stellar spectrum displays many absorption lines of H i, He i, He ii, N iii, N iv, and N v. The most prominent emission lines are He ii 4686, N iii 4634-41, H, and He i 5876. Weaker emission lines of Si iv 4089, 4116, 6668, and N iv 4058, 6212-20 as well as P-Cygni emission components in He ii 5412 and H lines are also seen. In addition to some interstellar absorption lines (Na i, CH, CH*+*), there are also numerous (and rather strong) diffuse interstellar bands (DIBs; see Herbig Herbig (1995)). The strength of these features is an indication of the heavy interstellar absorption towards LSS 3074.
The presence of N v 4604 and 4620 may indicate that one of the components of LSS 3074 is rather hot (O3-O4, Walborn Walborn (2001), Walborn et al. Walborn02 (2002)). The radial velocities of the N iii 4634, 4641, and N iv 4058 emission lines and the N v absorption lines are shown in Fig. 3 below and analysed in Sect. 6.2.
Several emission lines in the spectrum of the system display strong line profile variations. The most prominent modulations are seen in the He ii 4686, He i 5876, and H lines (see Fig. 4) and they are presented in Sect. 5.
4 Orbital solution
Since LSS 3074 is a rather faint and heavily reddened object, the accuracy of any radial velocity (RV) determination is mainly limited by the S/N ratio of the data. Therefore, we have concentrated our efforts on the strongest absorption lines that are essentially free from blends with other features. In this way, we have measured the RVs of H, He i 4471, 5876, and 7065 and He ii 4542, 5412, and 6406 in the spectra. We adopted the effective wavelengths of Underhill (Underhill (1995)), as listed in Table 4.
For each observation, the RVs of the primary and secondary components were computed as the mean of the corresponding RVs measured for the above listed lines on that observation. Unfortunately, either because of a low S/N or other problems, not all of these lines could be measured on all of our spectra. For instance, while we managed to deblend the primary and secondary components of the He i lines on most of our spectra, the intensity contrast between the two components is much larger for H and for the He ii lines. Therefore, the secondary component of the latter lines could only be resolved on the spectra with the highest S/N ratio. Another example is He ii 5412: the proximity of several DIBs of similar strength as the secondary line and the fact that the line develops a P-Cygni type profile (with an emission component at a velocity of km s*-1*) between phase and lead to rather complex blends and thus highly uncertain RVs at these specific orbital phases. As a result, not all of the RV data points are based on the same set of lines. Yet, it is well known that in early-type stars featuring relatively strong winds, the systemic velocities of the different spectral lines can be significantly different (Rauw et al. HDE228766 (2002)). Therefore combining different sets of spectral lines for different dates could bias the orbital solution. To circumvent this problem, we tied the RVs of the different lines to a single systemic velocity for each component. To do so, we first noted that the He i 5876 line is the one for which RVs of both components could be determined on nearly all observations, despite the fact that these absorptions lie on top of a broader emission. We thus selected He i 5876 as our reference line. The positions of the primary and secondary He i 5876 lines are shown in Fig. 4. For each of the other lines that we measured, we then determined the mean RV shift compared to He i 5876, and we subtracted this mean shift from the actual measurements. For each observation, the corrected RVs were then averaged, resulting in a homogeneous set of values, expressed in the rest frame of the He i 5876 line.
These resulting RVs are listed in Table 1. For most data points, the uncertainties on these RVs are about 10-15 km s*-1*. In some cases however (indicated by the colons in Table 1), the uncertainties are larger than 20 km s*-1* and can reach 40 km s*-1* in one case (HJD 2 452 382.597). To adopt the same notations as previous investigators, we refer to the brightest and hottest component of LSS 3074 as the primary, though its present-day mass appears to be lower than that of its companion (see below).
Owing to the severe aliasing problem, it is extremely difficult to obtain an independent determination of the orbital period of LSS 3074 from our set of RV measurements only. A Fourier analysis of the RV1 and RV2 data yields the highest peaks around d*-1* ( days) and d*-1* ( days). However, we caution that there are many more aliases that could hide the actual orbital period. It is worth pointing out that the second peak yields almost exactly the same period as found by Niemela et al. (Niemela (1992)). We performed the same Fourier analysis for each of the four bandpasses of the photometric data, , , , and , and obtained a highest peak at d*-1*, which corresponds to an orbital frequency of d*-1*, corresponding to days. While the periodogram of the photometric time series allows us to unambiguously identify the correct alias, the natural width of its peaks is much larger than in the case of our spectroscopic time series. In fact, folding the RVs into the photometric period yields an unacceptably large scatter. Therefore, combining the results from periodograms of the photometric and spectroscopic time series, we find that the most likely period of LSS 3074 is 2.1852 0.0006 days, with the error bars given as 1 deviation.
Also, the obtained with the photometric curves is HJD 2* 452 *000.9568, which corresponds to a phase shift of 0.05 with the obtained with the RV data. If we lock the RV data to this , we obtain a period of 2.1849 days. Considering that this result is well within the error bars of our previous calculations, we can admit the phase alignment of the RV and photometric data.
As a consistency check, we also combined our measurements in the band with those taken by Haefner et al. in Haefner (1994) and obtained a highest peak of the periodogram at d*-1*, which corresponds to an orbital frequency of d*-1*, corresponding to days. This result tends to confirm the quality of our determination of the orbital period of the system.
Adopting an orbital period of 2.1852 days, we computed an orbital solution assuming a circular orbit. The RVs were weighted according to their estimated uncertainties. The result is shown in Fig. 2 and the corresponding orbital elements are provided in Table 5.
The RV amplitudes of our solution are in reasonable agreement with values from the literature ( and km s*-1*; Niemela et al. Niemela (1992)). Consequently our orbital solution also leads to low minimum masses, similar to those of Niemela et al. ( sin and 10 M*⊙* for the O4f primary and the secondary, respectively). The apparent systemic velocity of the primary is significantly more negative than that of the secondary. This most likely indicates that the absorption lines of the primary are not entirely formed in the static photosphere, but arise at least partly from an expanding stellar wind.
Figure 3 shows the RVs of the nitrogen emission and absorption lines in the spectrum of LSS 3074. The adopted effective wavelengths of the studied lines are listed in Table 4. All the lines seem to move with the primary, but the scatter of the velocities of the various lines is rather large, especially at phases between the 0.25 quadrature and 0.5 conjunction. During this phase interval, the N iii emission lines yield systematically larger velocities than the N v absorption.
5 Line profile variability
The most prominent emission lines in the optical spectrum of LSS 3074 show strong profile variations (see Fig. 4). For instance, the He ii 4686 line evolves from a broad and skewed emission (around ) into a double-peaked feature with rather narrow individual peaks and the strongest peak closely following the orbital motion of the primary (at phases near 0.5).
On the other hand, the H emission features a double-peaked profile on most of our spectra and the profiles observed around the two conjunctions are very similar. At phases near quadrature, the peaks are broader and less clear cut. Apart from the moving absorption lines, the He i 5876 profile has a morphology relatively similar to that of the H line.
We measured the equivalent widths (EWs) of the H line between 6513 and 6604 Å. We find that Å. Although the dispersion around the mean is quite large, no obvious phase-locked behaviour is apparent. In particular, we do not see any variations attributable to the modulation of the continuum.
These complex line morphologies make it impossible to assign a single RV to the He ii 4686 and H emission lines, and suggest that these lines do not arise in the atmosphere of one of the two stars, but stem from an extended emission region. To further quantify this situation, we used the method of Doppler tomography to map the emitting regions of the He ii 4686 and H lines in velocity space. Our method is based on the Fourier-filtered back projection technique (Horne Horne91 (1991), Rauw et al. HDE228766 (2002), Mahy Mahy11 (2011)). The radial velocity of any gas flow that is stationary in the rotating frame of reference of the binary can be expressed as
[TABLE]
where stands for the orbital phase with , corresponding to the primary star being in front. The are the velocity coordinates of the gas flow. The and axes are located in the orbital plane. The -axis runs from the primary to the secondary, whilst the positive -axis points in the direction of the orbital motion of the secondary. The component represents the apparent systemic velocity of the line under consideration. The Doppler map consists of a projection of relation given by (5) on the plane. For a given value of , each pixel in a Doppler map, specified by its velocity coordinates, is therefore associated with a particular form of equation (5). All our spectra listed in Table 1 were given equal weights. The Doppler maps, computed adopting km s*-1*, are shown in Fig. 5. They reveal extended line formation regions in velocity space with different morphologies for the two lines. The He ii 4686 line features an emission lobe on the negative side and mostly with negative . This emission seems thus mostly associated with the primary star. The H Doppler map displays two lobes, extending on both sides of the Roche lobes in velocity space, with the strongest one closely matching the emission lobe of the Doppler map of He ii 4686.
A full interpretation of these Doppler maps in terms of wind-wind interactions is beyond the scope of the present paper. However, it is interesting to compare our Doppler maps with those of Algol-type systems where a cool star fills up its Roche lobe and transfers matter to a hotter companion (Richards et al. Richards14 (2014)). Our maps are clearly different from those presented by Richards et al. (Richards14 (2014)). The structures seen in Fig. 5 neither resemble those produced by gas streams that directly impact the mass gainer nor do they feature the ring-like structure, centred on the mass gainer, that appears for systems with Keplerian accretion disks. These results therefore do not support the presence of an accretion disk or an accretion stream in LSS 3074.
6 Preparatory analysis
6.1 Spectral disentangling
The determination of the orbital solution allowed us to recover the individual spectra of both components through the disentangling of the normalized spectra of the binary system. For this purpose, we used our disentangling routine (Rauw DSc (2007)) based on the method of González & Levato (GL (2006)), previously used by Linder et al. (Linder (2008)) and improved by Mahy et al. (Mahy (2012)). In this procedure, the mean spectra of each binary component are reconstructed in an iterative way by shifting the observed data into the frame of reference of one star and subtracting the best approximation of the spectrum of the other star shifted to its observed radial velocity. In the disentangling carried out in this work, we fixed the RVs of the binary components to those corresponding to the orbital solution of Sect. 4. For a more detailed description of the method, see Raucq et al. (Raucq (2016)).
As for any disentangling method, this technique also has its limitations (González & Levato GL (2006)). An important limitation for our study is that broad spectral features are not recovered with the same accuracy as narrow ones. Indeed, features that are wider than a few times the RV amplitude are barely properly recovered. This is the case of the wings of the Balmer lines, for example. Moreover small residual errors in the normalization of the input spectra can lead to oscillations of the continuum in the resulting disentangled spectra on wavelength scales of several dozen Å, and a reasonable observational sampling of the orbital cycle is needed because the quality of the results depends on the radial velocity ranges covered by the observations. Finally, spectral disentangling works on continuum-normalized spectra and does not yield the brightness ratio of the stars, which must be determined by other techniques (see below).
In the particular case of LSS 3074, we also encountered problems due to the large brightness ratio of the system. Indeed, as shown in Sect. 6.3, the primary star appears much brighter than the secondary star, meaning that the latter is faint in the observed spectra, which induces difficulties in the disentangling procedure, a lower S/N ratio, and thus larger uncertainties on the resulting secondary spectrum.
6.2 Spectral types
We then determined the spectral types of the stars through the measurement of the equivalent width ratio of some spectral lines of the reconstructed individual line spectra of the primary and secondary components. We used the He i 4471 and He ii 4542 lines, on the one hand, and Si iv 4089 and He i 4143 lines, on the other hand, and applied the Conti quantitative classification criteria for O-type stars (Conti & Alschuler CA (1971), Conti & Frost CF (1977), see also van der Hucht vdHucht (1996)) for both spectral types and luminosity classes. In this way, we obtain O5.5 I and O6.5-7 I classifications for the primary and secondary, respectively. The strong He ii 4686 and N iii 4634-41 emission lines lead to the addition of an f qualifier (see Walborn et al. Walborn02 (2002), Sota et al. Sota11 (2011), Maíz Apellániz et al. Jesus (2016) and references therein) for both components. The primary spectrum further displays emissions of Si iv 4089, 4116. Previously these features were indicated by an f*+* qualifier, but it has been suggested that this notation is obsolete (Sota et al. Sota11 (2011)).
However, the Conti criterion for the luminosity classes is formulated for spectral types from O7 to O9.7 and its application to the spectrum of the primary star is thus an approximation. Moreover, Walborn et al. (Walborn02 (2002)) argued that it would be preferable to use the N iv/N iii emission line ratio for the spectral classification of the earliest O-type stars rather than the ratio of the He i/He ii absorption lines. As shown in Fig. 3, the N iii 4634, 4641, and the very weak N iv 4058 emission line (when present) clearly move along with the primary star. The same holds true for the weak, but definite N v 4604 and 4620 absorption lines. As indicated in Sect. 3, the presence of these N v absorption lines points towards a rather hot star with an O3 to O4 spectral type (Walborn et al. Walborn02 (2002), Sota et al. Sota11 (2011)), which is at odds with our above classification based on the helium lines. We have thus compared our disentangled primary spectrum with the spectral atlas of Sota et al. (Sota11 (2011)). The strong He ii 4686 emission clearly confirms a supergiant luminosity class. The simultaneous presence of strong N iii, very weak N iv, and definite N v lines in the spectrum of the primary is clearly a challenge both for spectral classification and spectral modelling (see Sect. 8.4). The best match, although certainly not perfect, is found with the spectra of HD 14 947 (O4.5 If) and, to a lesser extent, HD 15 570 (O4 If). For a highly deformed star, such as the primary of LSS 3074, gravity darkening leads to a non-uniform surface temperature. Hence, the discrepancy between the O5.5 If spectral type inferred from the relative strengths of the He i and He ii lines and the O4-4.5 If type derived from the nitrogen spectrum could simply reflect the fact that these lines form over different parts of the stellar surface. We come back to this point in Sect. 8.4. For the secondary star, comparison with the atlas of Sota el al. (Sota11 (2011)) yields a spectral classification O6.5-7 If, in agreement with the results from the relative strengths of the helium lines.
Finally, since our classification is based on the disentangled spectra, it is less sensitive to a possible phase dependence of the line strengths and should thus be more robust than a classification based only on spectra collected near quadrature phases.
6.3 Brightness ratio
The spectral disentangling yields the strength of the lines in the primary and secondary stars relative to the combined continuum. But as we mentioned earlier, it does not allow us to establish the relative strengths of the continua. We therefore needed to first establish the brightness ratio of the stars to further analyse the reconstructed spectra.
To estimate the optical brightness ratio of the components of LSS 3074, we measured the equivalent widths, referring to the combined continuum of the two stars, of a number of spectral lines on the reconstructed primary and secondary spectra. The results are listed in Table 6 along with the mean equivalent widths of the same lines in synthetic spectra of stars of the same spectral type, computed with the non-LTE model atmosphere code CMFGEN (Hillier & Miller HM (1998)), which we describe in Sect. 8.2. For comparison, we also list the mean equivalent widths of the same lines in spectra of stars of similar spectral type as measured by Conti (Conti1 (1973, 1974)) and Conti & Alschuler (CA (1971)).
The brightness ratio of the two stars can then be evaluated from
.
By combining our measurements with those from synthetic spectra, we derive an optical brightness ratio of . As a consistency check, we can also determine the brightness ratio through a comparison with the measurements made by Conti, and we obtain .
The disentangled continuum normalized primary and secondary optical spectra are shown in Fig. 8.
7 Light curve
To improve our understanding of the system LSS 3074, and in particular its geometry, we performed an analysis of the photometric light curves by modelling the system using the eclipsing binary star simulator NIGHTFALL777For more details, see the Nightfall UserManual by Wichmann (1998) available at the URL: http://www.hs.uni-hamburg.de/DE/Ins/Per/Wichmann/Nightfall.html, developed by Wichmann, Kuster and Risse. We worked in an iterative way. First of all, we fixed the mass ratio and orbital period to the values obtained from the orbital solution (see Table 5) and the effective temperatures to typical values for stars of similar spectral types (Martins et al. Martins2 (2005)). This permitted us to obtain a first estimation of the photometric solution and of the stellar radii and masses. Based on these approximated parameters, together with the effective temperatures, we calculated the associated surface gravities and stellar luminosities. This first approximation of the stellar fundamental parameters was then used as starting point input in our study of the atmosphere modelling procedure (see Sect. 8.2 and 8.3). This procedure then permitted us to accurately determine the effective temperatures of the stars, giving us a new input for the light curve study with NIGHTFALL.
Inspection of the light curve reveals a lack of a plateau between the minima, indicating important contributions of ellipsoidal variations to the photometric variability. Actually, the shape of the light curve suggests that almost the entire photometric variations could stem from such ellipsoidal variations, thereby implying that at least one of the stars must fill or overflow its Roche lobe.
The only evidence for the existence of genuine eclipses comes from the fact that the secondary minimum seems about 0.02 mag deeper than the primary minimum. The primary minimum corresponds to the occultation of the primary star by the secondary. What is surprising here is that the deeper minimum actually corresponds to the spectroscopically hotter star being in front. Given the level of dispersion in the light curve, it is quite possible that the small difference in depth of the minima is not significant and could arise, for example, from intrinsic variations of the stars. An alternative explanation for this situation could be an atmospheric eclipse produced by the wind of the primary star. Antokhina et al. (Antokhina13 (2013)) studied the impact of free electron scattering in the wind of one star on the light curves of close eclipsing binaries. For a contact binary made of otherwise equal stars, these authors show that the presence of a stellar wind with M*⊙* yr*-1* around one component deepens the eclipse corresponding to the star with the wind passing in front of its companion by about 0.08 mag. At the same time, the depth of the other eclipse is slightly reduced. In the case of LSS 3074, the fact that most emission lines closely follow the motion of the primary star suggests that this star has the strongest wind, thus lending support to this explanation. However, as pointed out by Antokhina et al. (Antokhina13 (2013)), a quantitative assessment of the impact on the light curve requires some independent determination of the wind parameters (mass-loss rate, asymptotic velocity and exponent of velocity law). In our case, this is difficult to achieve (see Sect. 8). This is because of the lack of UV spectroscopy and the complexity of the line emission regions. Indeed, as revealed by our tomographic analysis, at least parts of the H and He ii 4686 emissions arise from an interaction zone and these lines hence do not necessarily reflect the genuine properties of the winds. Yet, our best-fit model atmosphere parameters (see the forthcoming Table 10) yield upper limits on the wind density that could be consistent with the observed difference in eclipse depth. However, these best-fit parameters also suggest that both binary components lose material at a similar rate. Hence, one would expect both eclipses to be affected by stellar wind absorption. We thus conclude that a better knowledge of the wind parameters of LSS 3074 is required before we can attempt a model of the light curve accounting for the effects of the stellar winds. Whatever the origin of the slight difference in depth of the minima, we need to keep in mind that this situation affects the quality of the fits of the light curve.
To explain the shape of the secondary minimum by the sole effect of ellipsoidal variations, we at least need to assume that either both components of the binary system fill up (contact-contact) or even overflow their Roche lobes (overcontact), or that one of the components must be much smaller and much fainter than the other star that fills up its Roche lobe. In the former case, one expects both stars to be of very comparable size and, given their effective temperatures, also of rather comparable brightness. To explain the depth of almost 0.2 mag by the sole effect of ellipsoidal variations is actually not possible here without requiring the presence of true eclipses. In this context, the necessity to invoke a contact-contact or an overcontact configuration remains valid, along with the conclusion that sizes and brightness of both stars should be comparable.
This is precisely the outcome of our fits with the NIGHTFALL code. The best-fit quality () is achieved for overcontact configurations with a filling factor of 1.008 (), where the corresponding -band brightness ratio is predicted to be 1.09. The corresponding photometric solution is presented in Table 9 and the associated plot is shown in Fig. 6. Yet, our spectroscopic analysis suggests an optical brightness ratio (primary/secondary) near 2.50. This situation is thus clearly at odds with explaining the photometric light curve via a double contact or overcontact configuration. To achieve a brightness ratio of , the ratio between the mean radii of the primary and secondary stars would have to be . This translates into a ratio of the filling factors of , which is only possible for detached or semi-detached configurations. As could be expected, the fact that the hotter star is in front during the deepest minimum leads to difficulties to fit this minimum.
Since the eclipses are only partial, one way to solve this issue would be to postulate the existence of a dark spot on the side of the secondary star facing the primary. Such a spot would then lead to a deeper minimum when the primary star is in front. From a purely numerical point of view this would improve the fit quality significantly with now approaching 2.9. In addition, it would certainly help to bring the spectroscopic and photometric brightness ratios into better agreement. Yet, aside from the difficulty of explaining the physical origin of such a spot, there is another issue that concerns the fact that the spot size and its dim factor (i.e. the reduction in local temperature) are not fully independent and we lack any objective constraints on these parameters. Test calculations have shown that for some situations, the best-fit model would actually correspond to a spot that covers more than 75 of the surface of the secondary, which is clearly not physical.
The reference list from the paper itself. Each links out to its DOI / PubMed record.
- 1(1) Almeida, L. A., Sana, H., de Mink, S. E., et al. 2015, Ap J, 812, 102
- 2(2) Antokhina, E. A., Antokhin, I. I., & Cherepashchuk, A. M. 2013, A&AT, 28, 3
- 3(3) Antokhina, E. A., & Kumsiashvili, M. I. 1999, Astronomy Letters, 25, 662
- 4Arnaud (1996) Arnaud, K. A. 1996, in Astronomical Data Analysis Software and Systems V , eds. G. Jacoby, & J. Barnes, ASP Conf. Series, 101, 17
- 5Asplund et al. (2009) Asplund, M., Grevesse, N., Sauval, A. J., & Scott, P. 2009, ARA&A, 47, 481
- 6Bohlin et al. (1978) Bohlin, R. C., Savage, B. D., & Drake, J. F. 1978, Ap J, 224, 132
- 7(7) Bouret, J.-C., Hillier, D. J., Lanz, T., & Fullerton, A. W. 2012, A&A, 544, A 67
- 8(8) Conti, P. S. 1973, Ap J, 179, 161