Searching for luminous absorbed sources in the WISE AGN catalogue
G. Mountrichas, I. Georgantopoulos, N. J. Secrest, I. Ordovas-Pascual,, A. Corral, A. Akylas, S. Mateos, F.J. Carrera, E. Batziou

TL;DR
This study identifies rare, luminous obscured AGN by cross-matching WISE IR-selected AGN with X-ray and optical data, revealing a subset with significant X-ray absorption but little optical obscuration, supporting models of AGN evolution.
Contribution
It provides the first detailed analysis of the X-ray properties of the largest IR-selected AGN sample, uncovering luminous obscured QSOs with outflowing ionized material.
Findings
Seven obscured AGN with high column density identified
Six show broad CIV absorption lines and are BALQSOs
No optical obscuration detected despite X-ray absorption
Abstract
Mid-IR colour selection techniques have proved to be very efficient in finding AGN. This is because the AGN heats the surrounding dust producing warm mid-IR colours. Using the WISE 3.6, 4.5 and 12 colours, the largest sample of IR selected AGN has already been produced containing 1.4 million AGN over the whole sky. Here, we explore the X-ray properties of this AGN sample by cross-correlating it with the subsample of the 3XMM X-ray catalogue that has available X-ray spectra and at the same time optical spectroscopy from SDSS. Our goal is to find rare luminous obscured AGN. Our final sample contains 65 QSOs with \,erg\,s. This IR luminosity cut corresponds to \,erg\,s, at the median redshift of our sample (), that lies at the bright end of the X-ray luminosity function at . The X-ray spectroscopic…
Click any figure to enlarge with its caption.
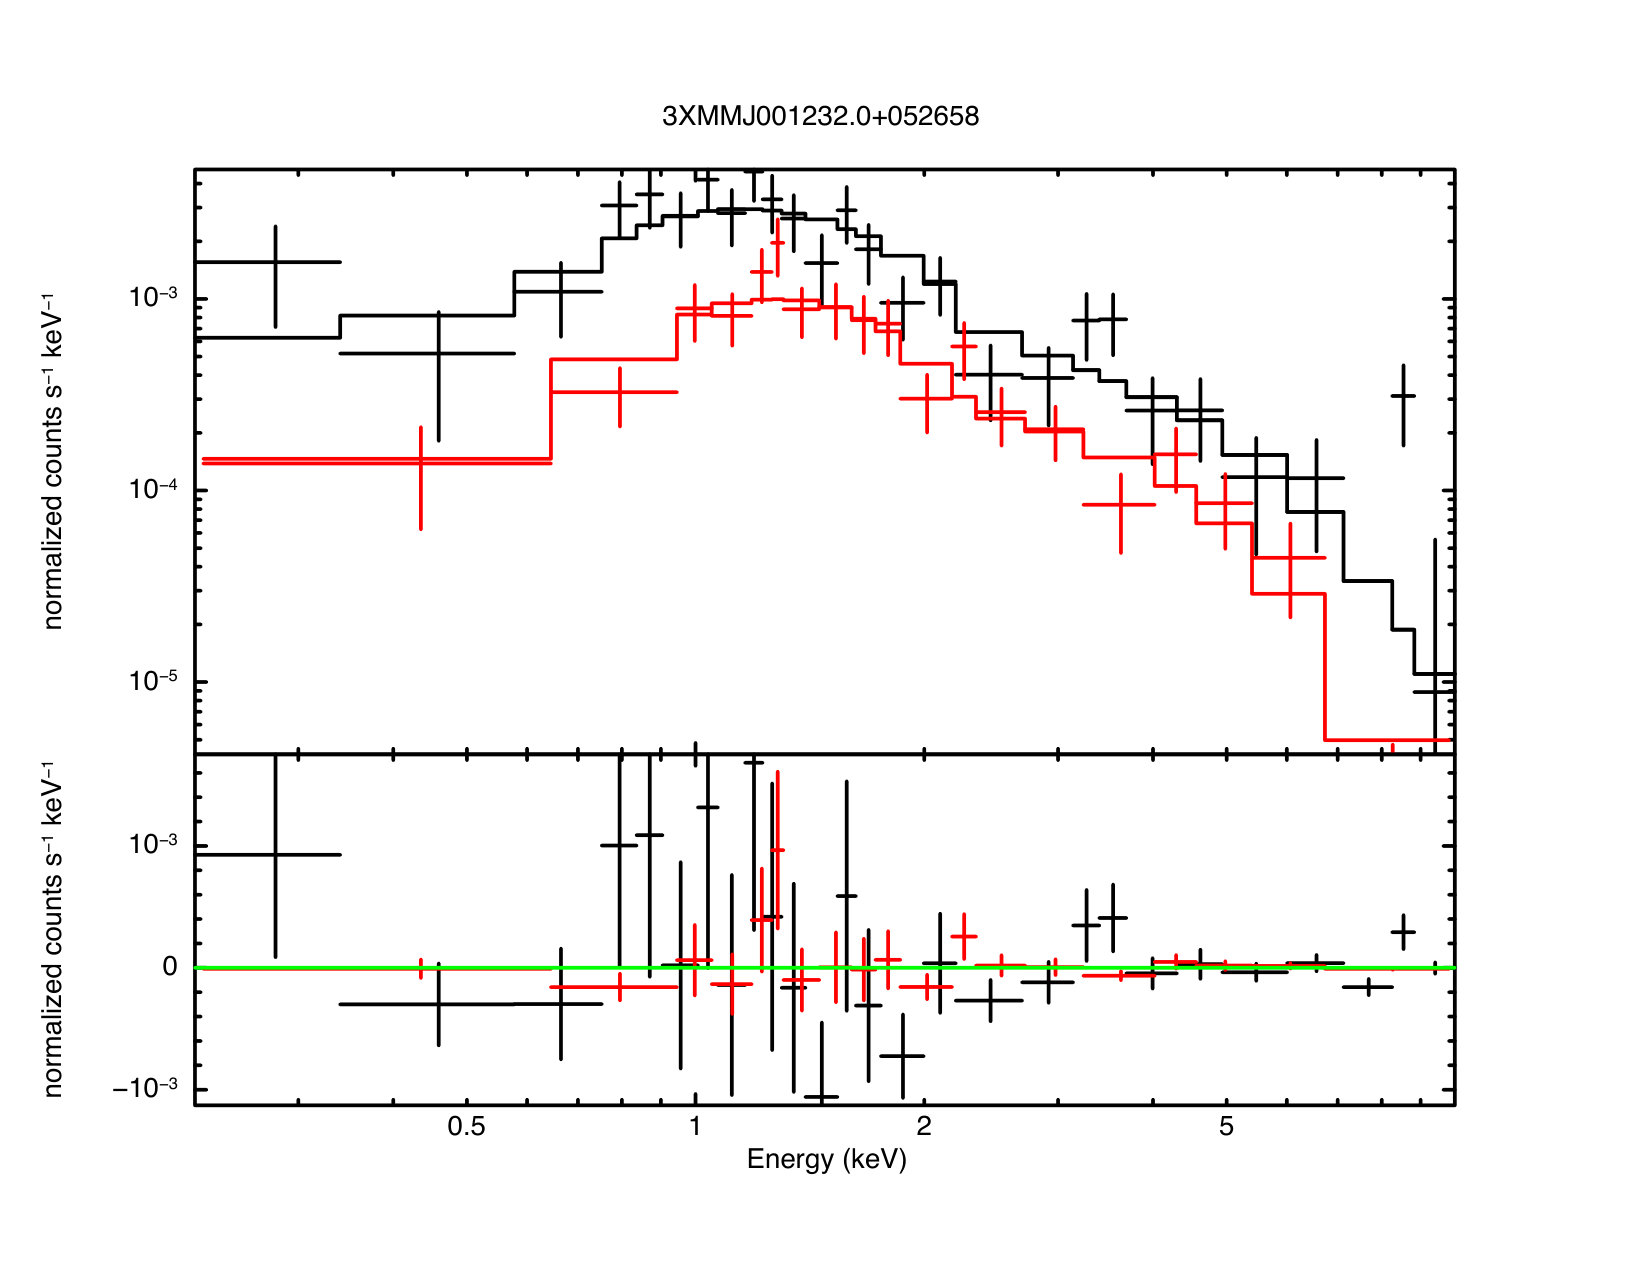 Figure 1
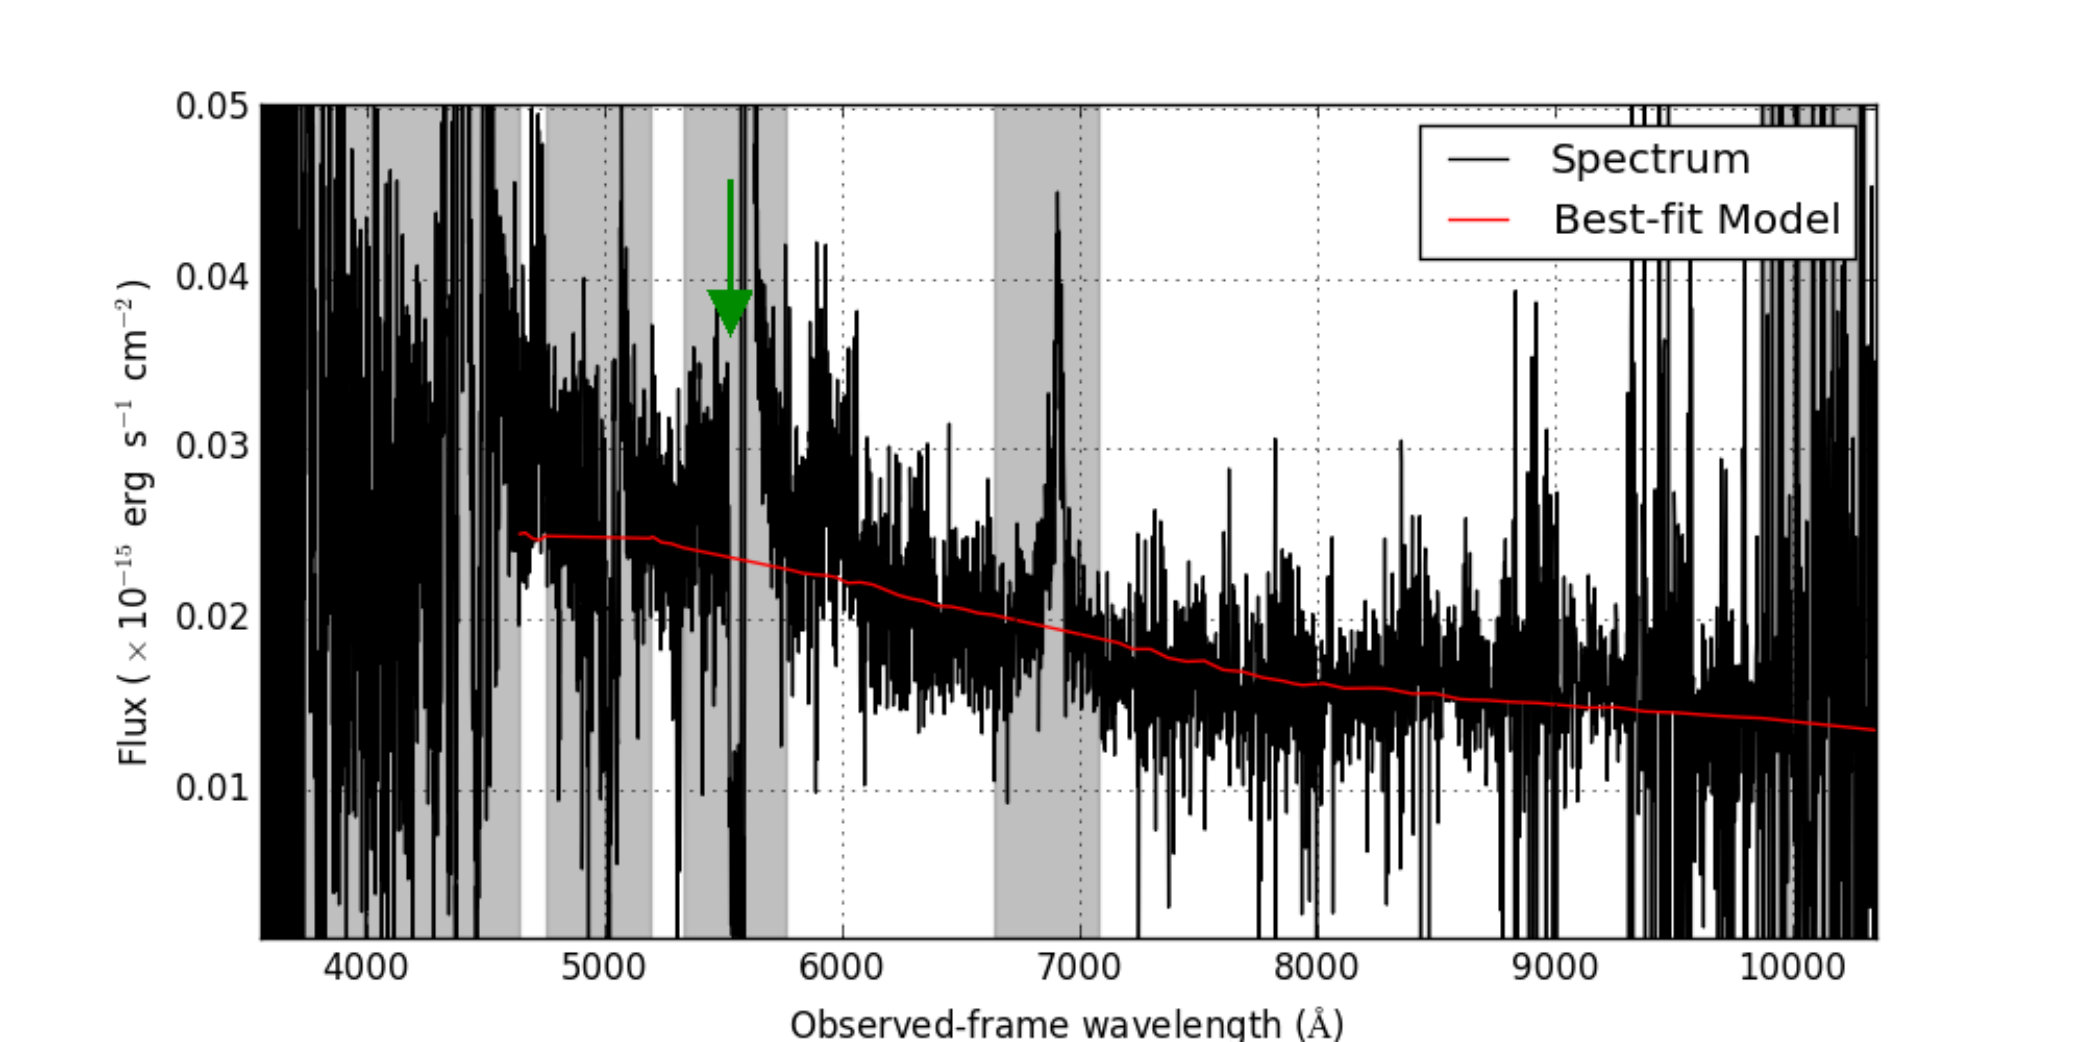 Figure 2
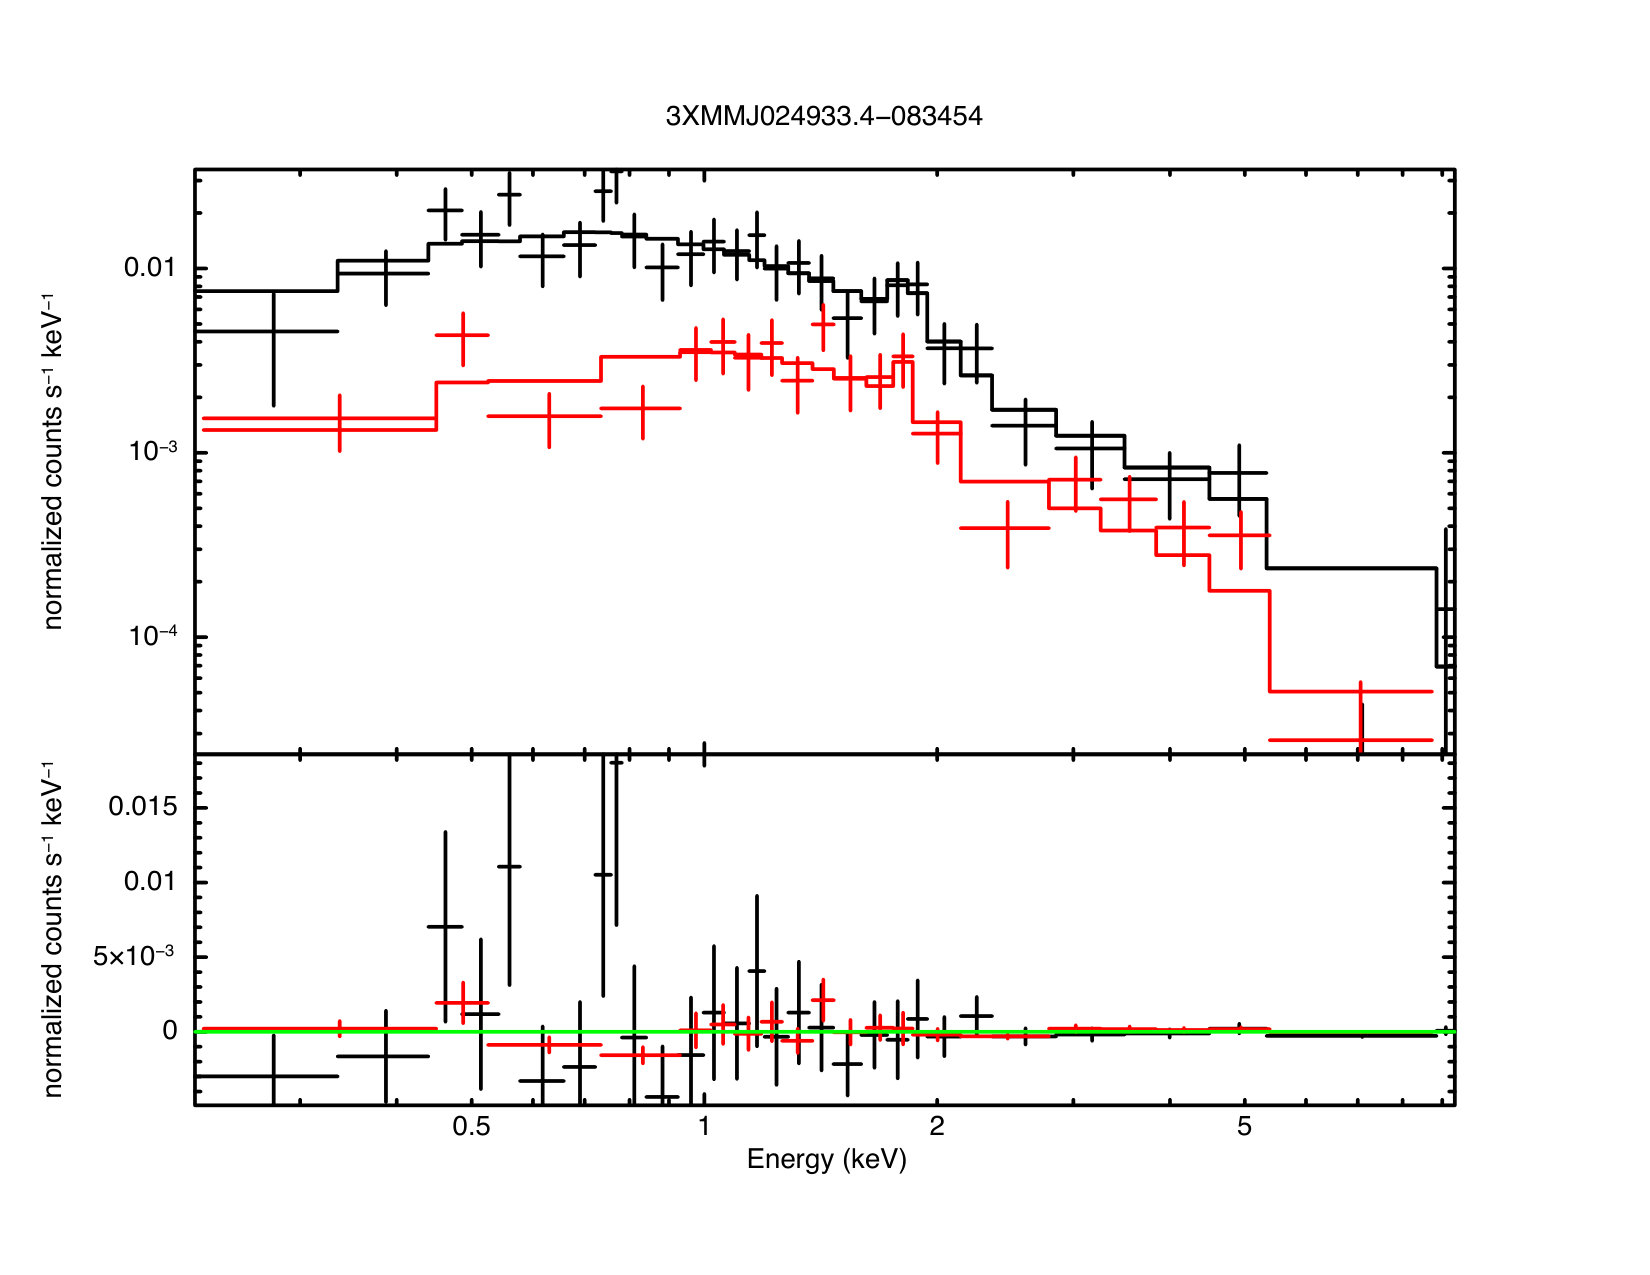 Figure 3
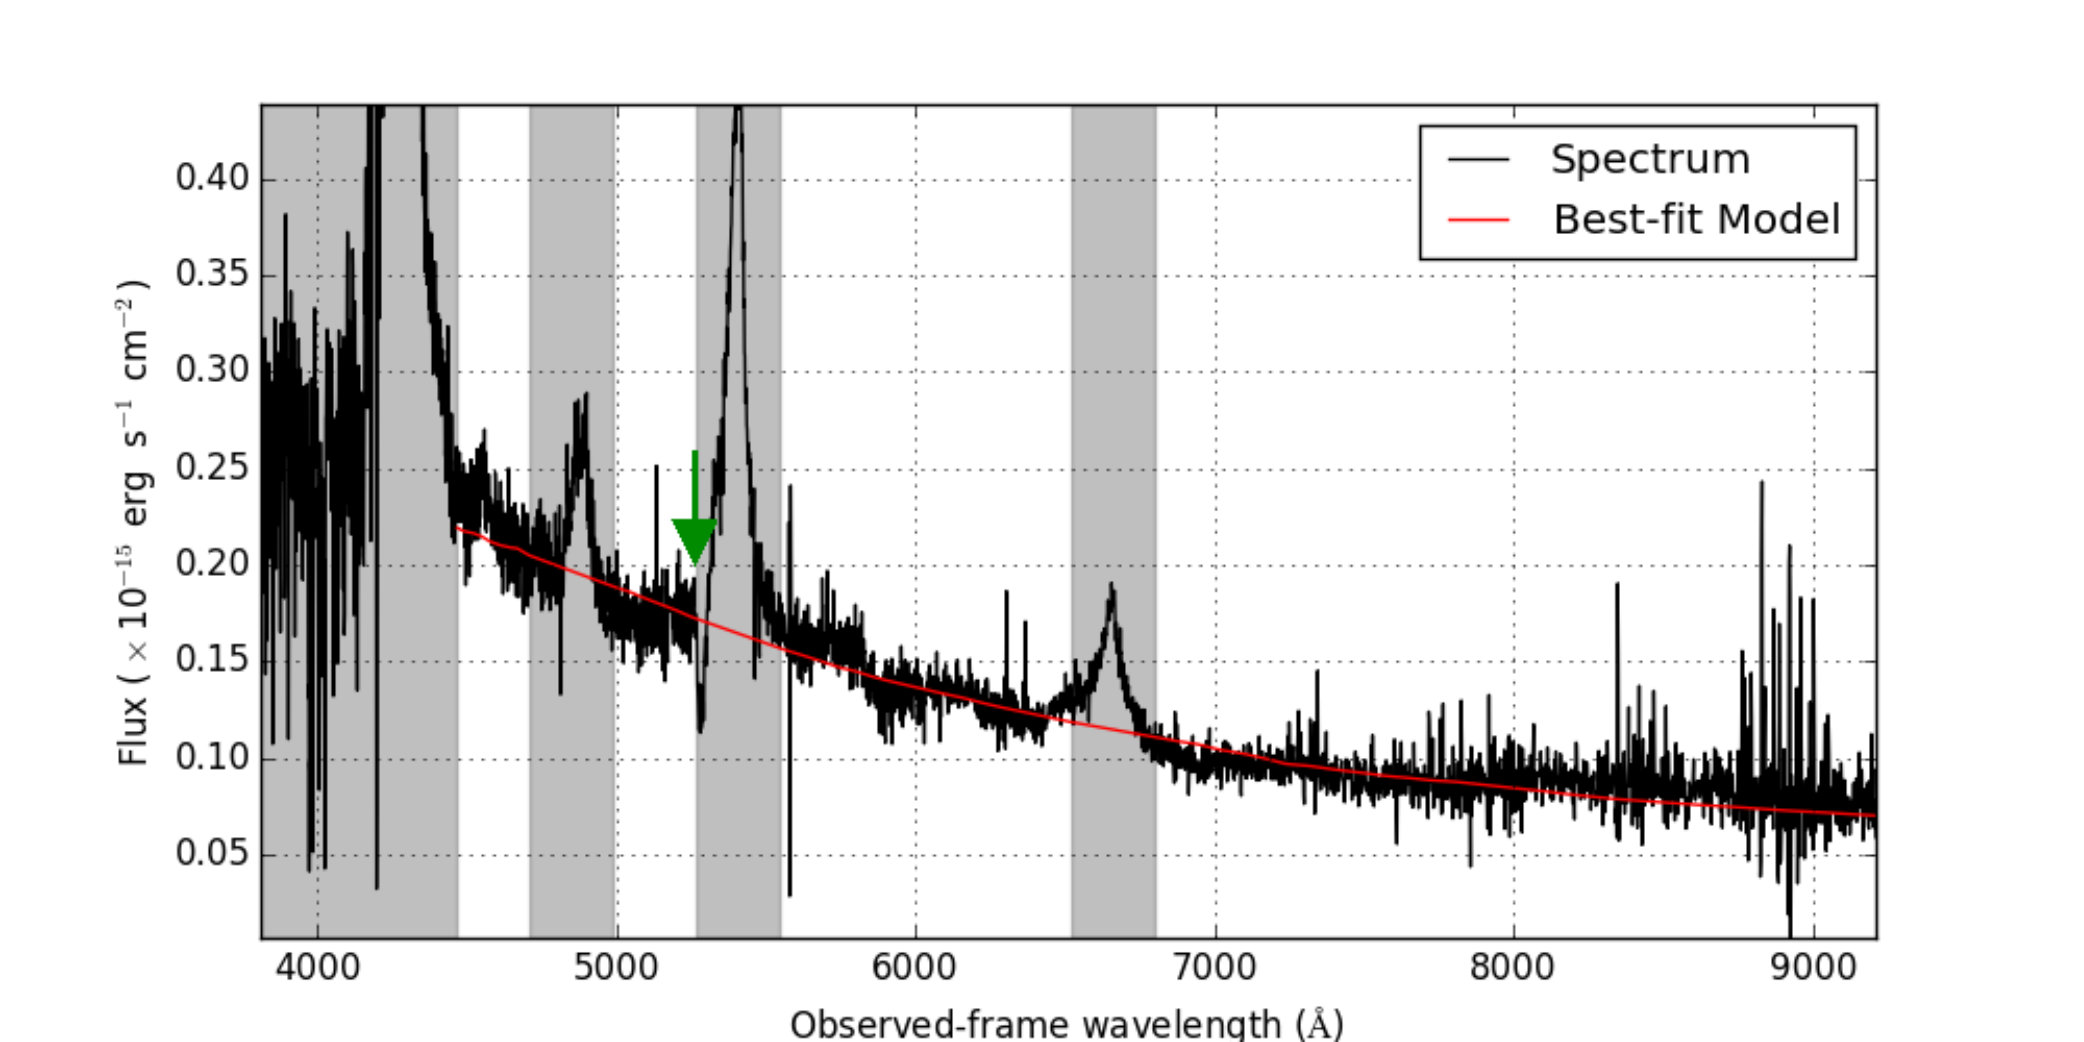 Figure 4
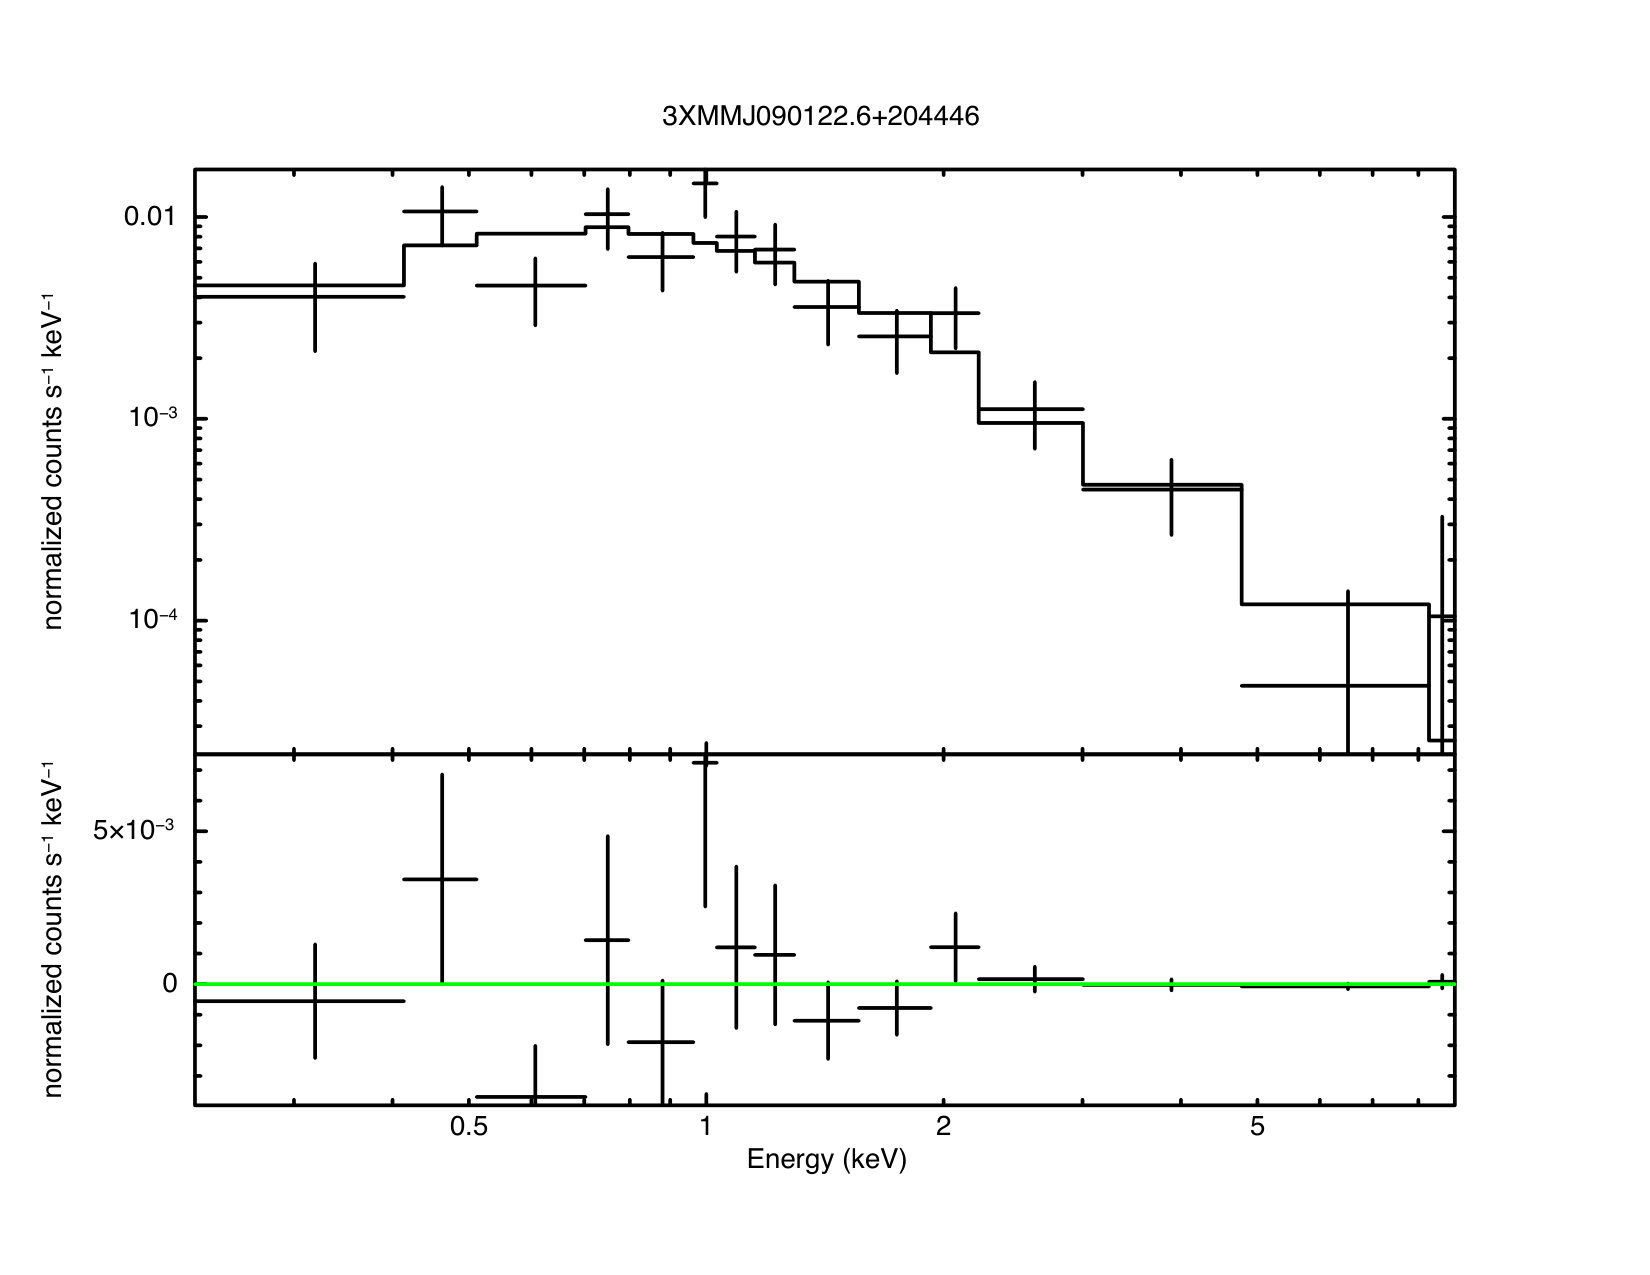 Figure 5
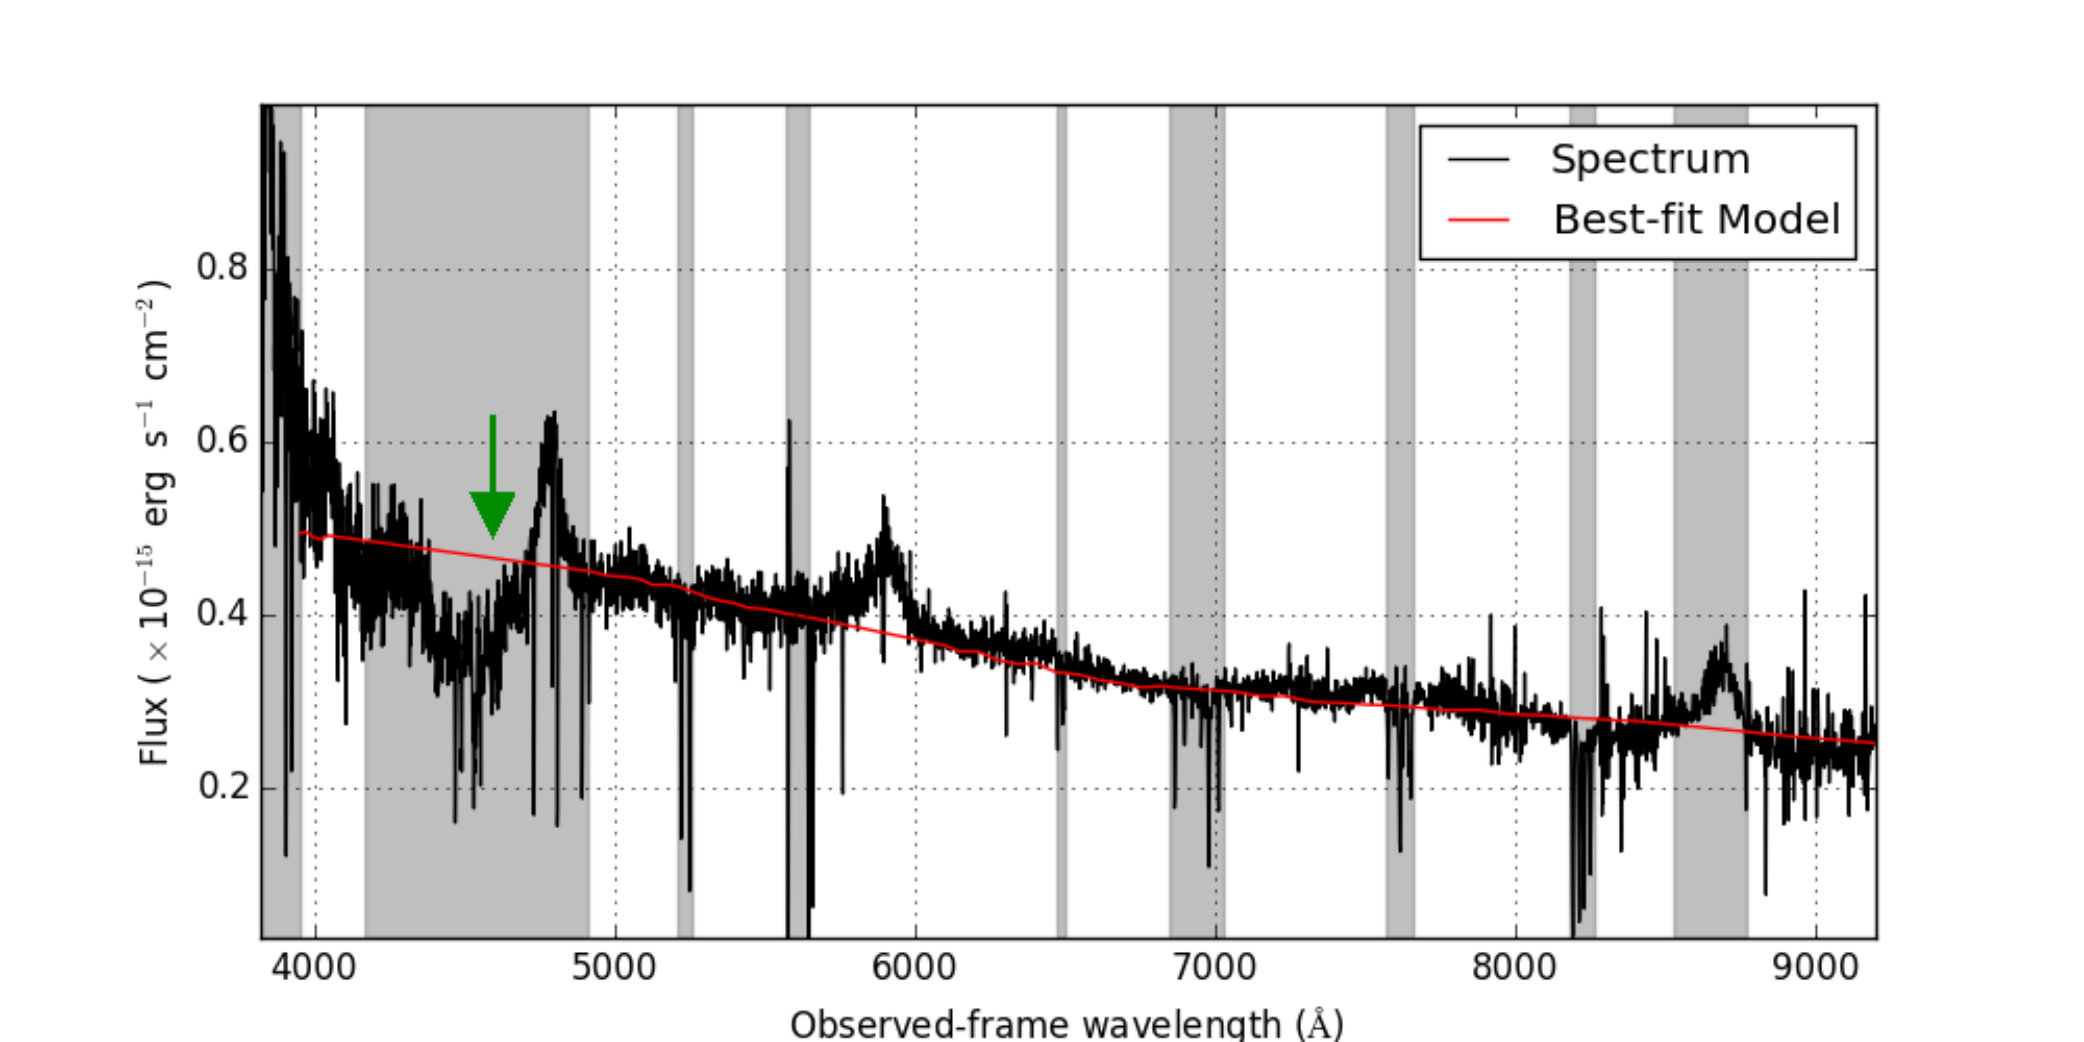 Figure 6
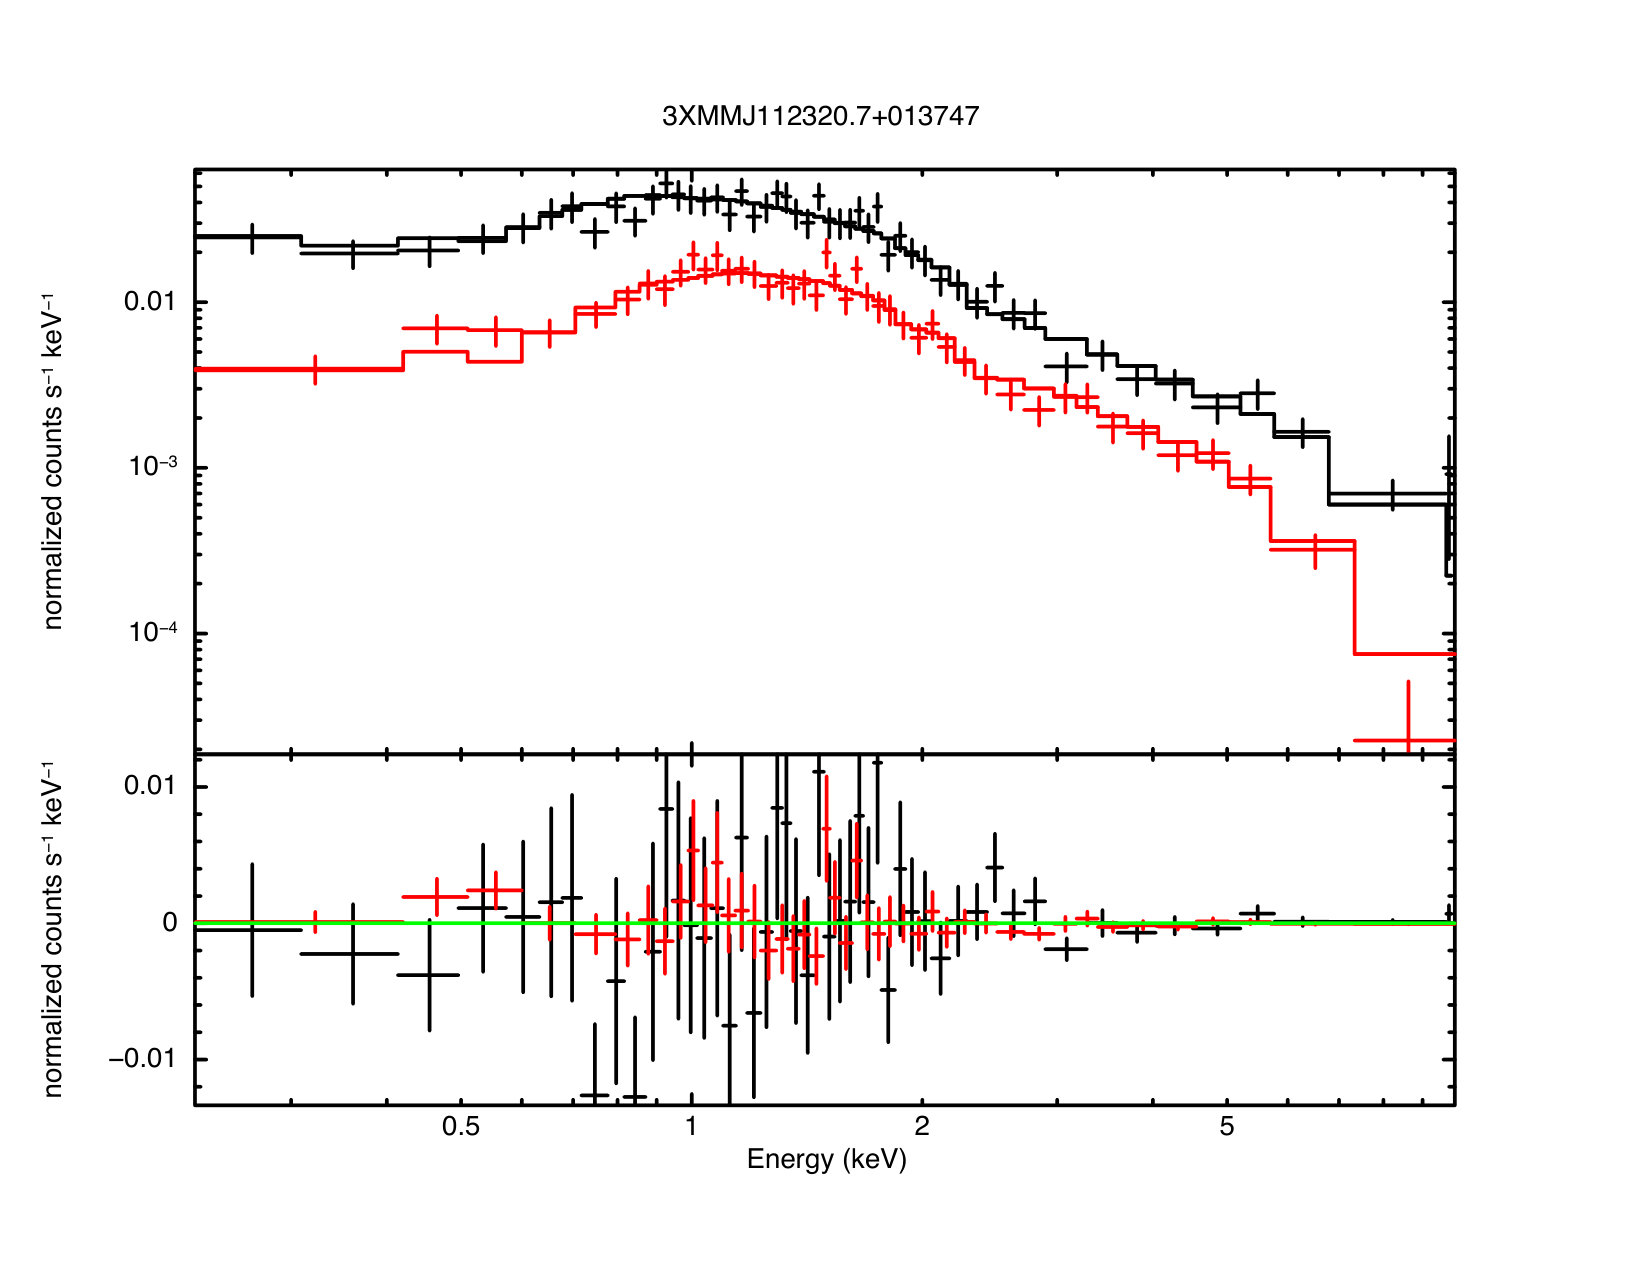 Figure 7
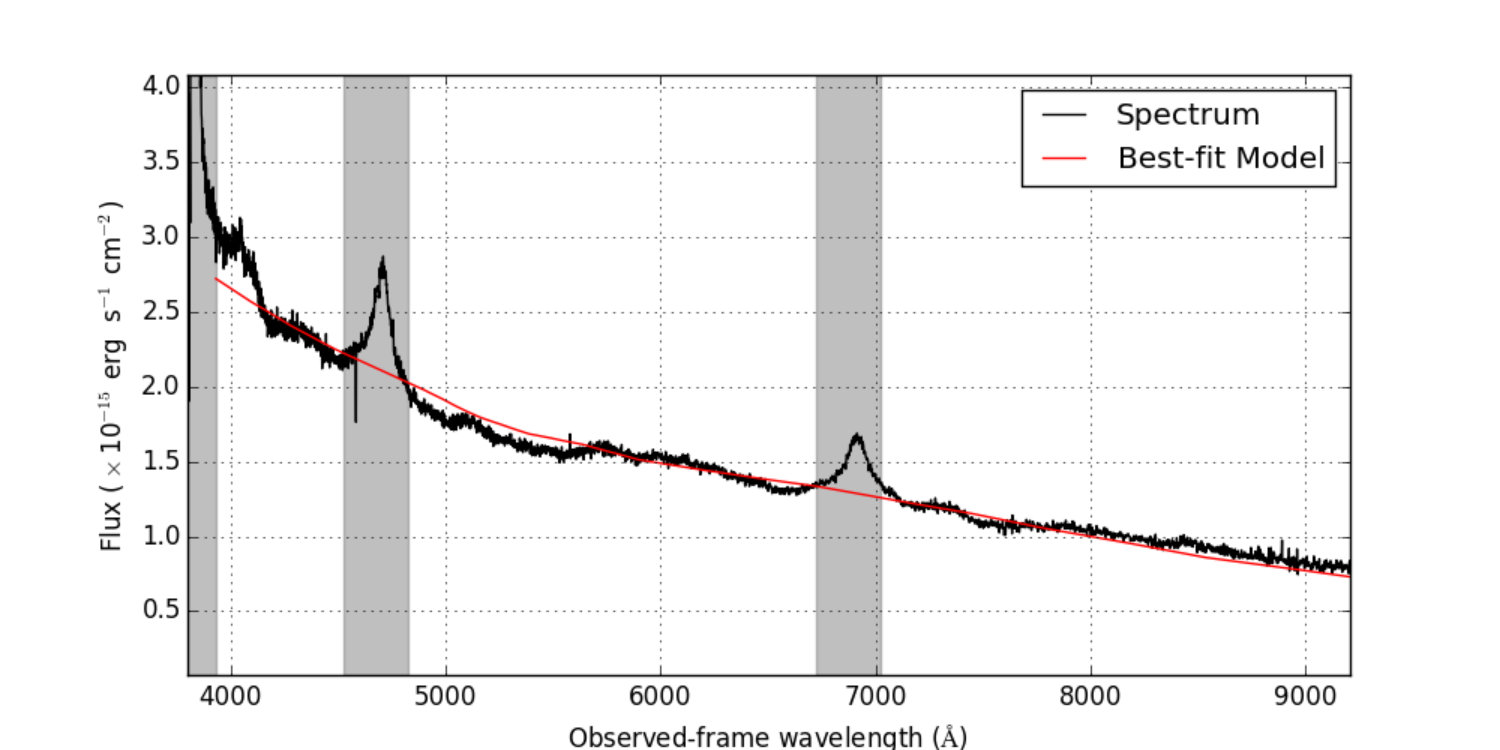 Figure 8
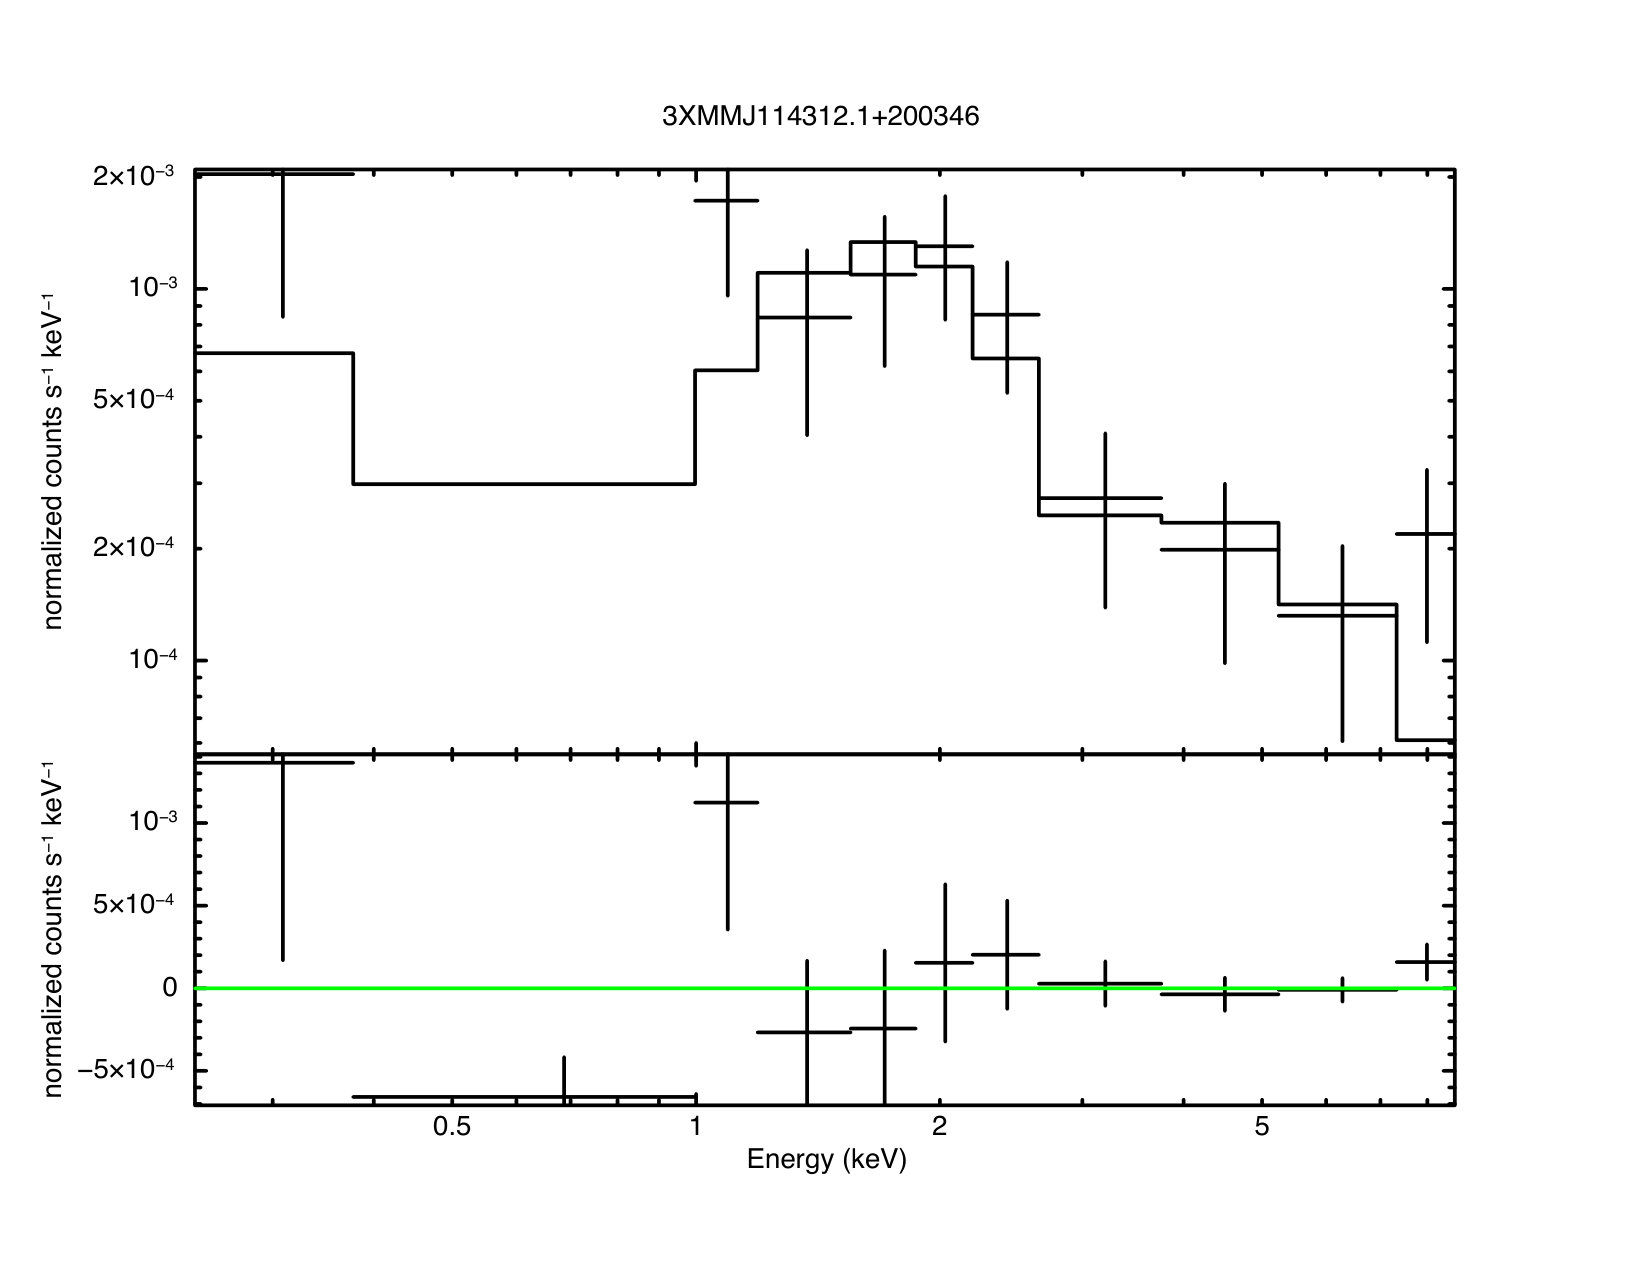 Figure 9
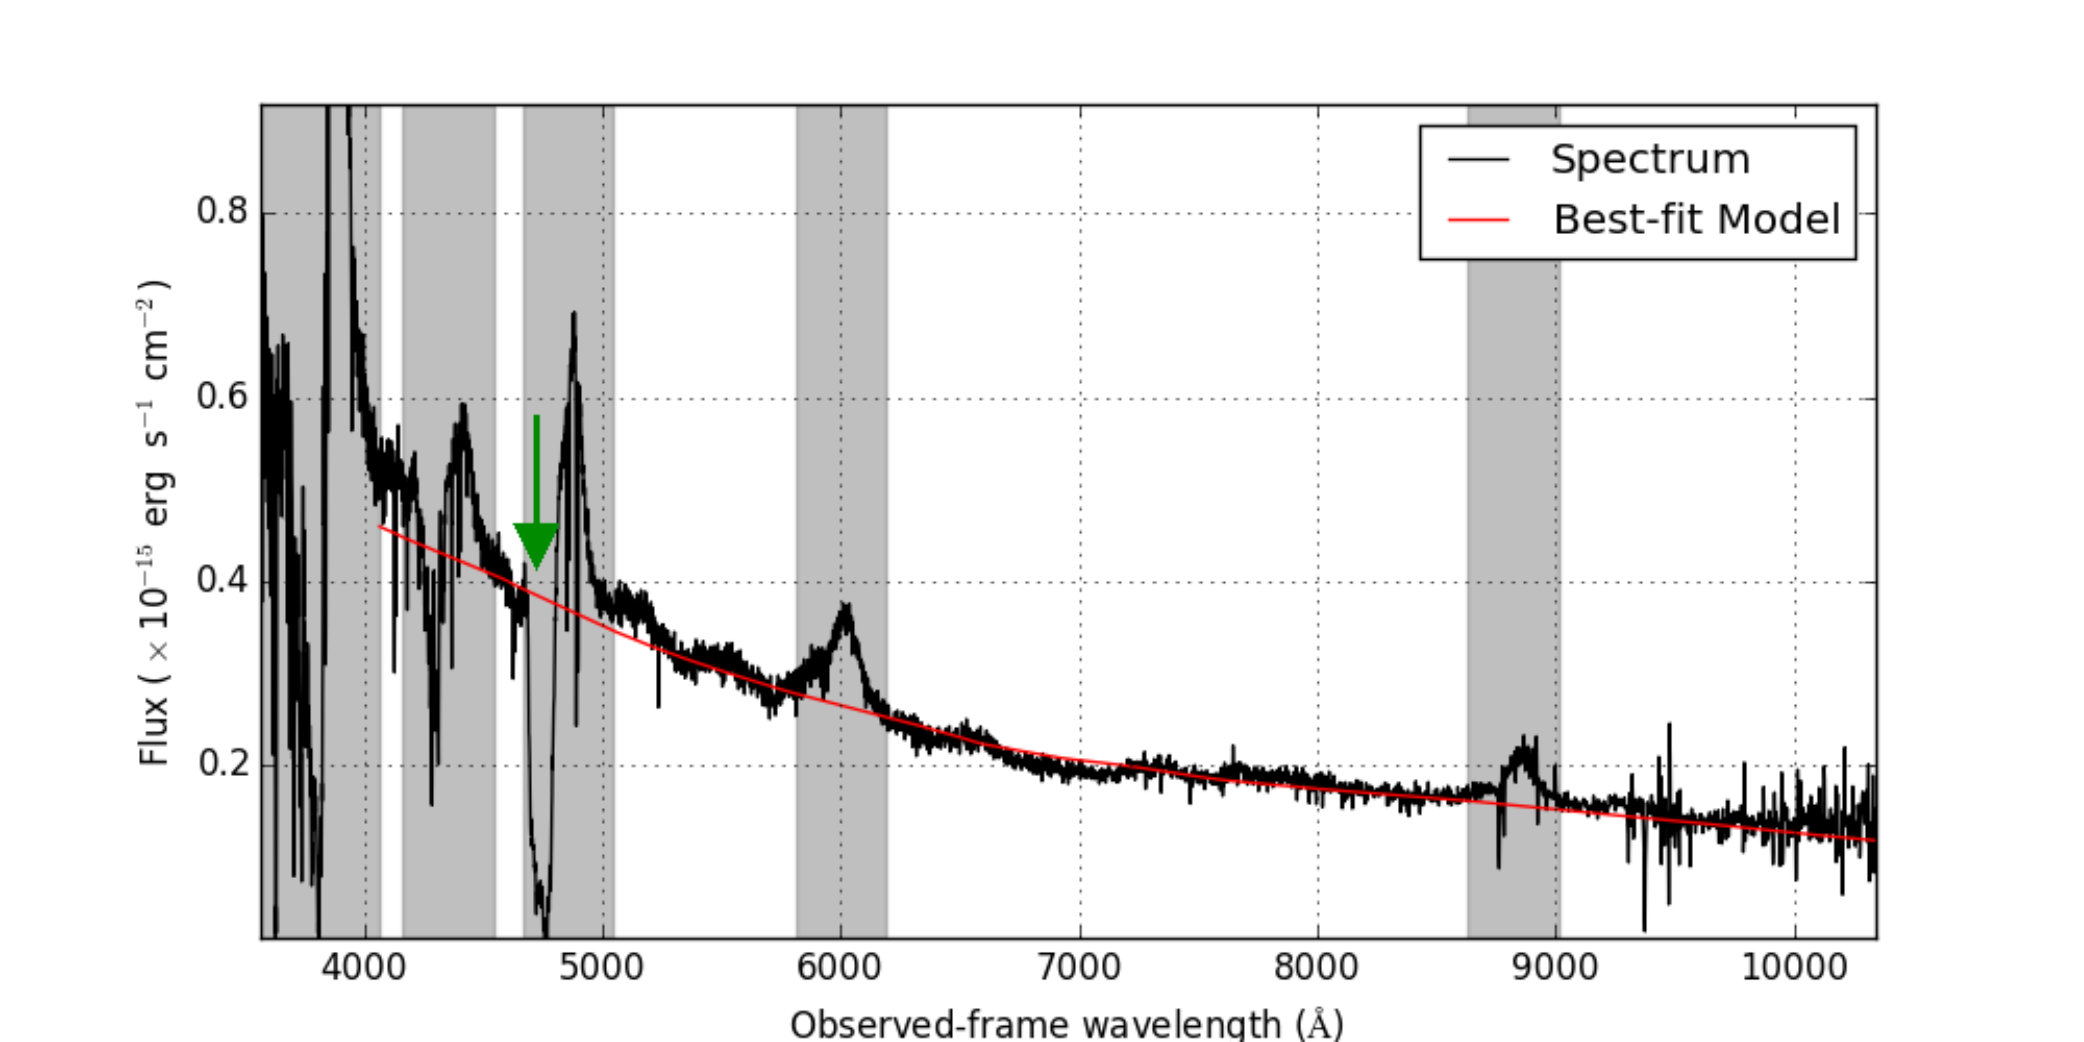 Figure 10
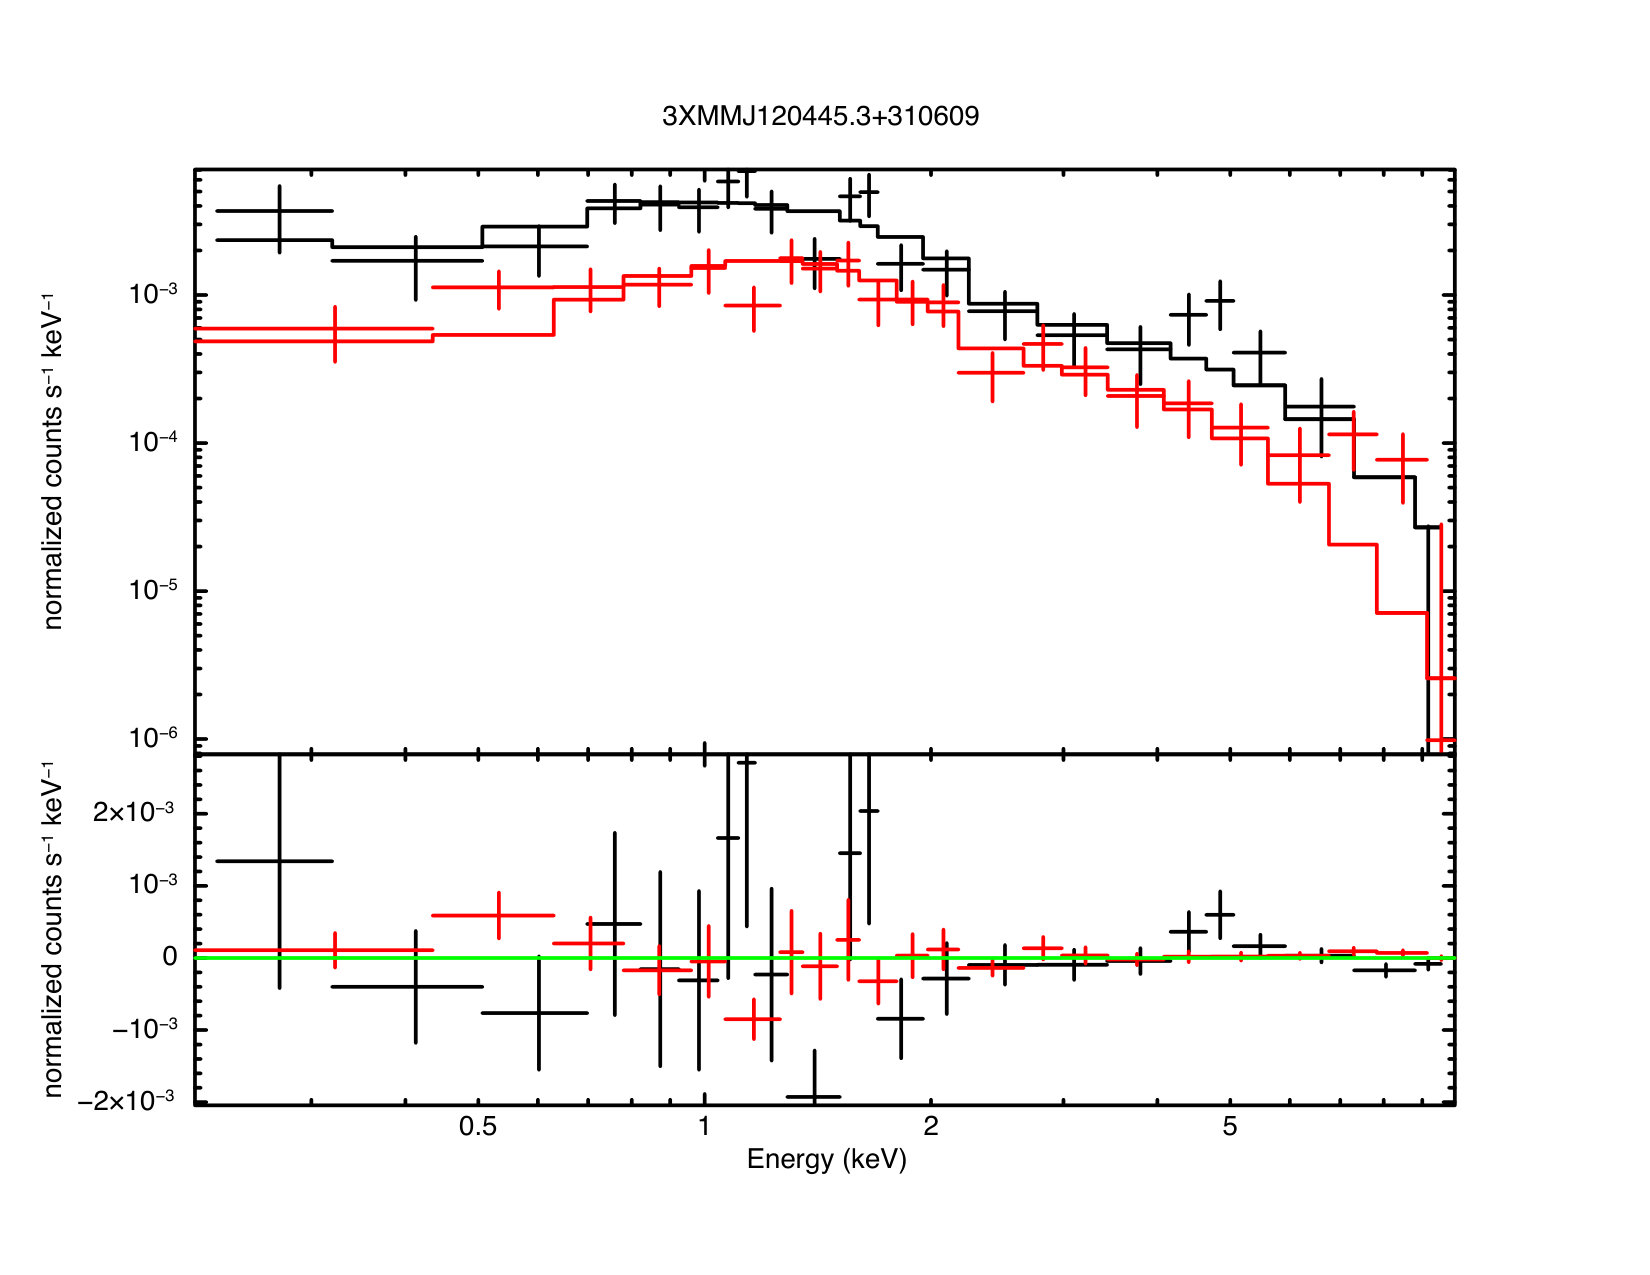 Figure 11
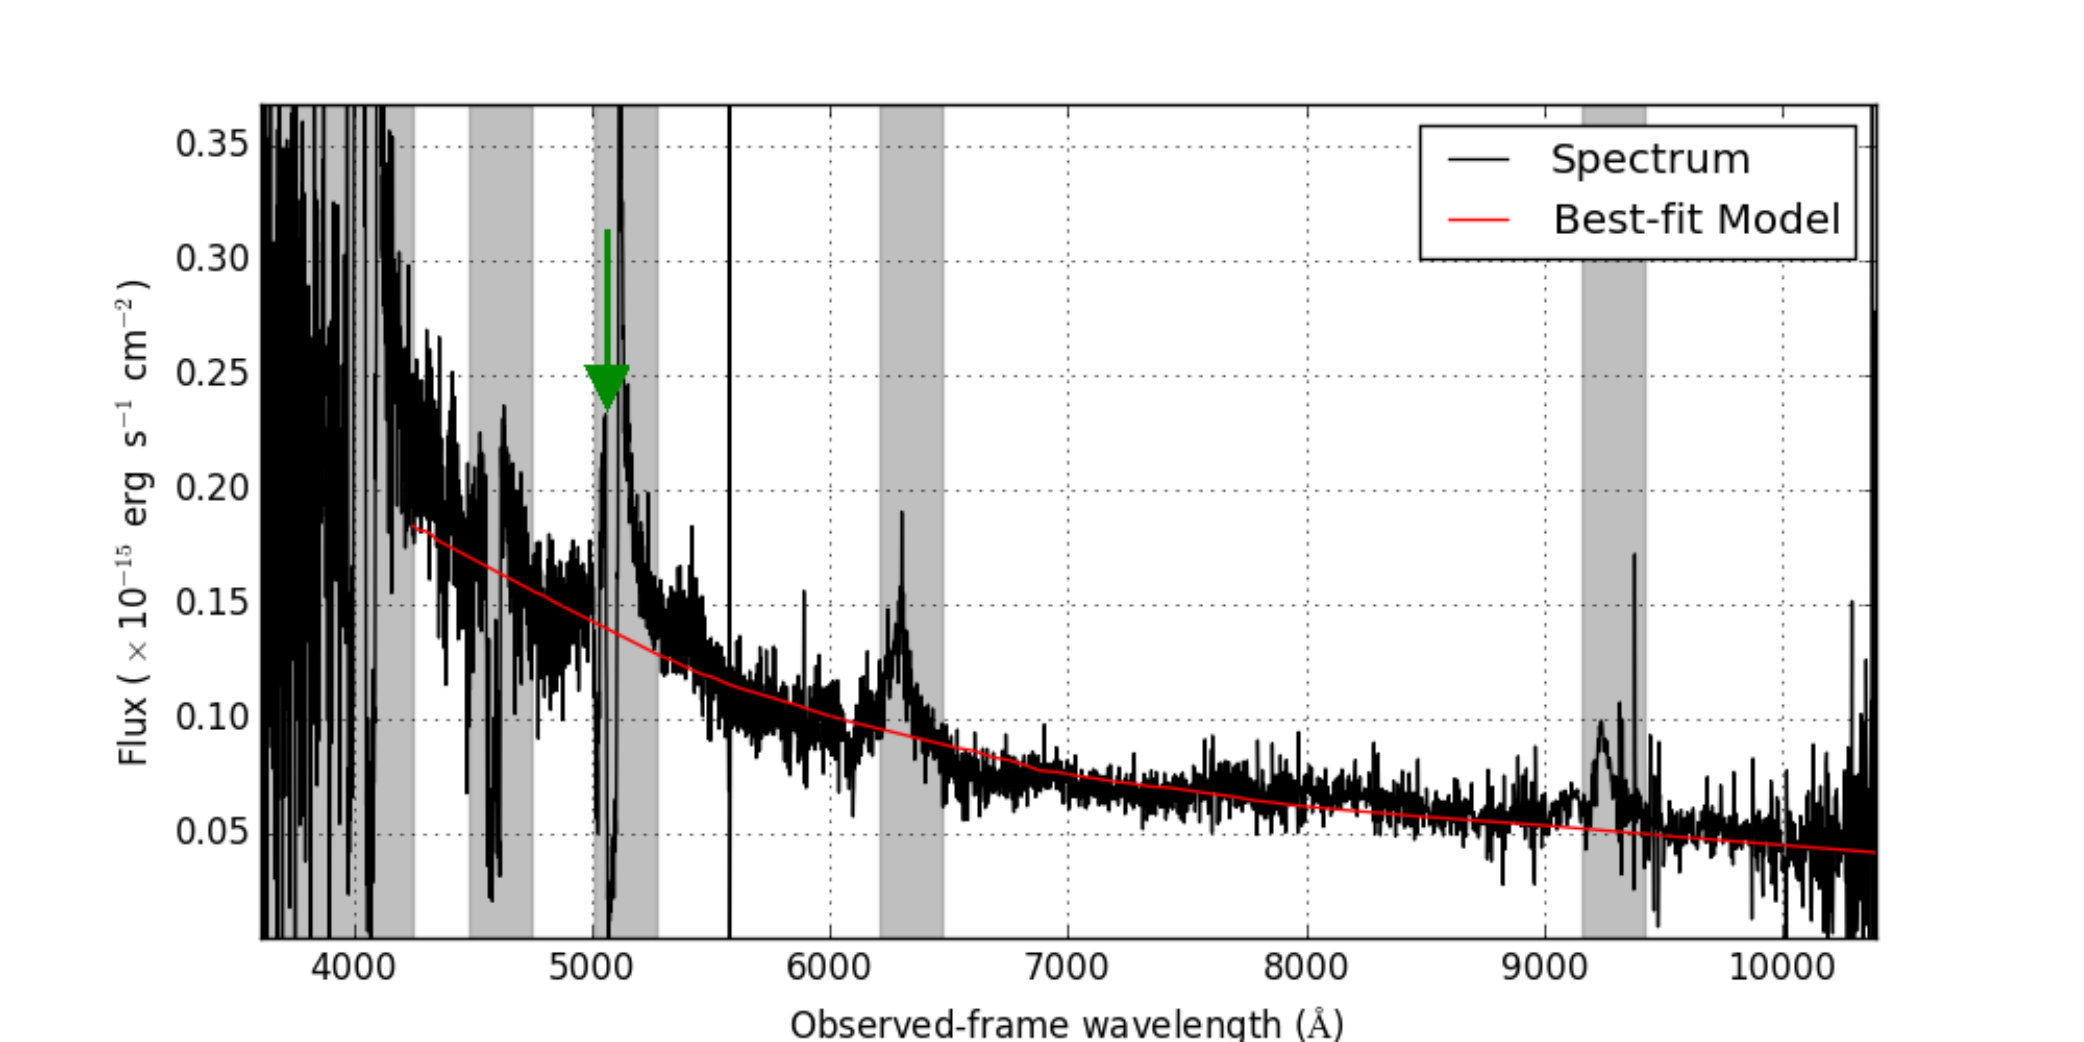 Figure 12
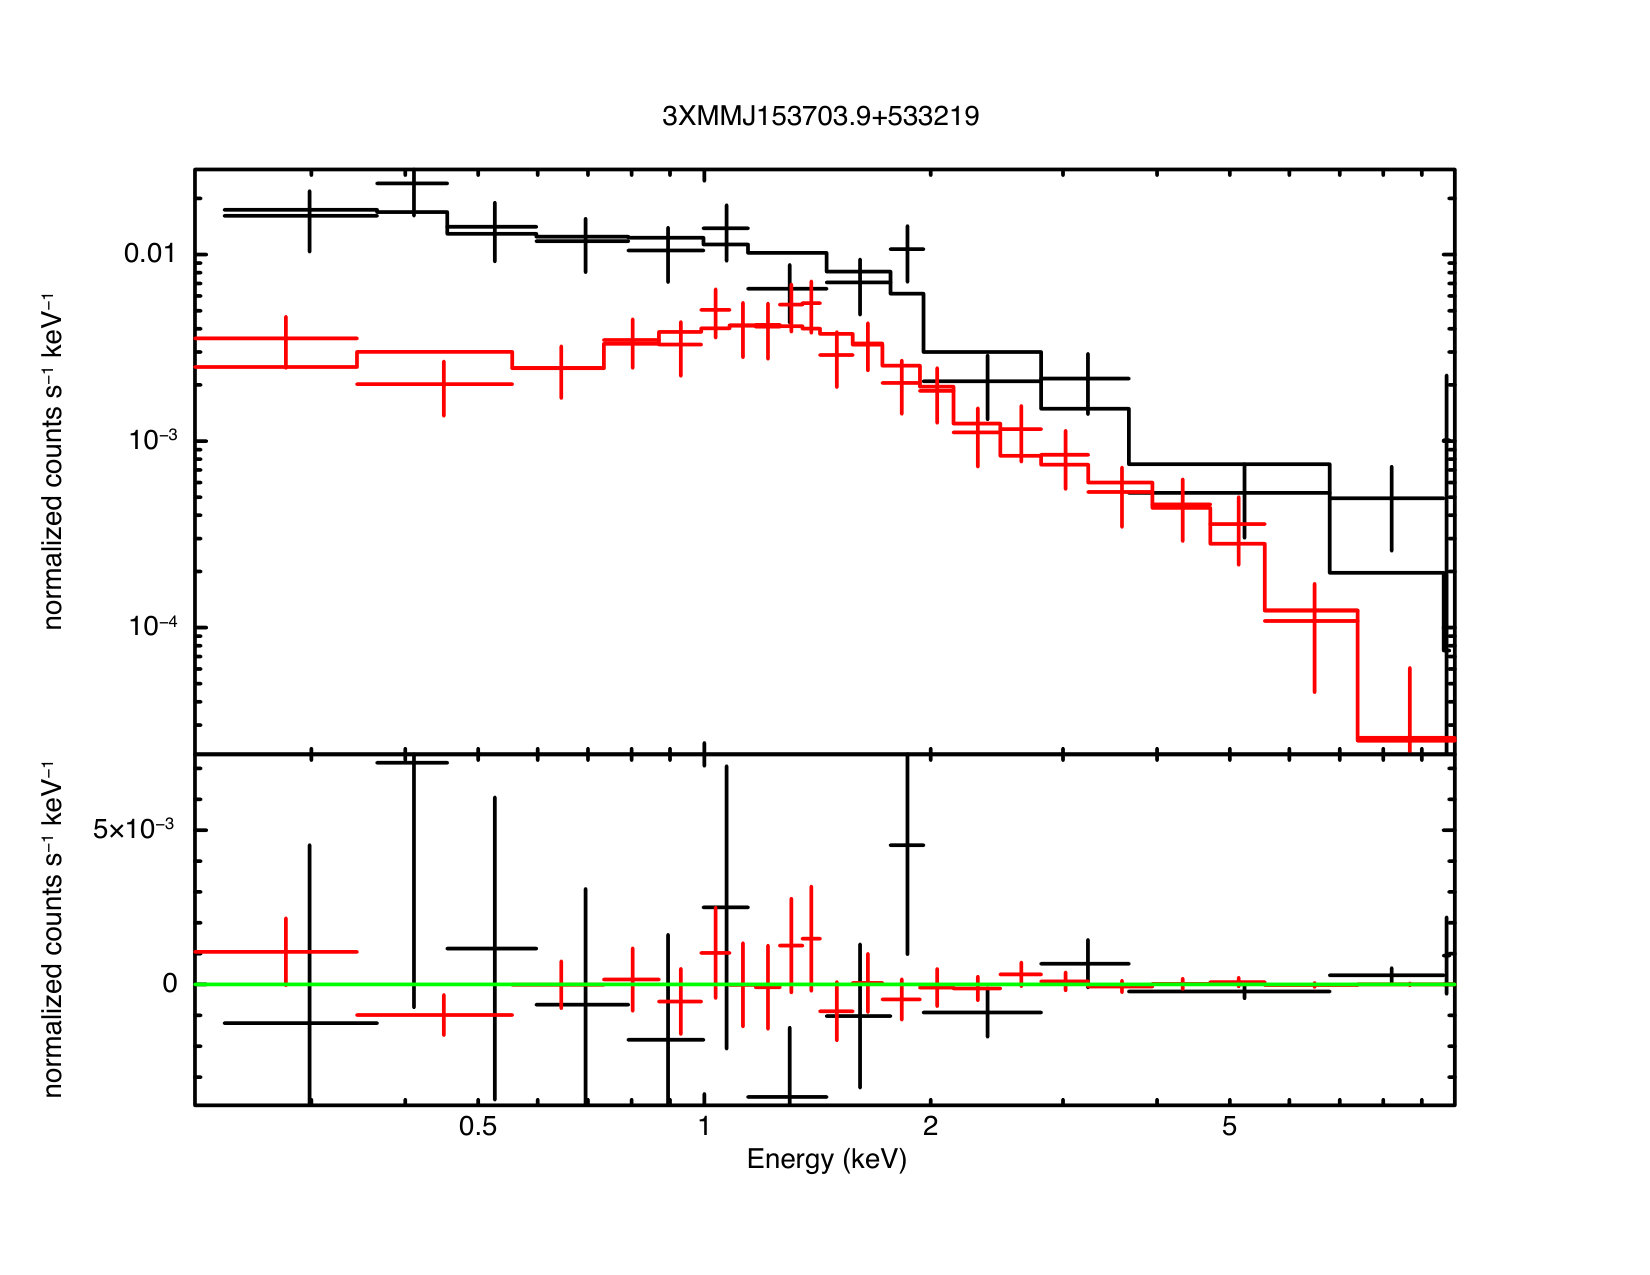 Figure 13
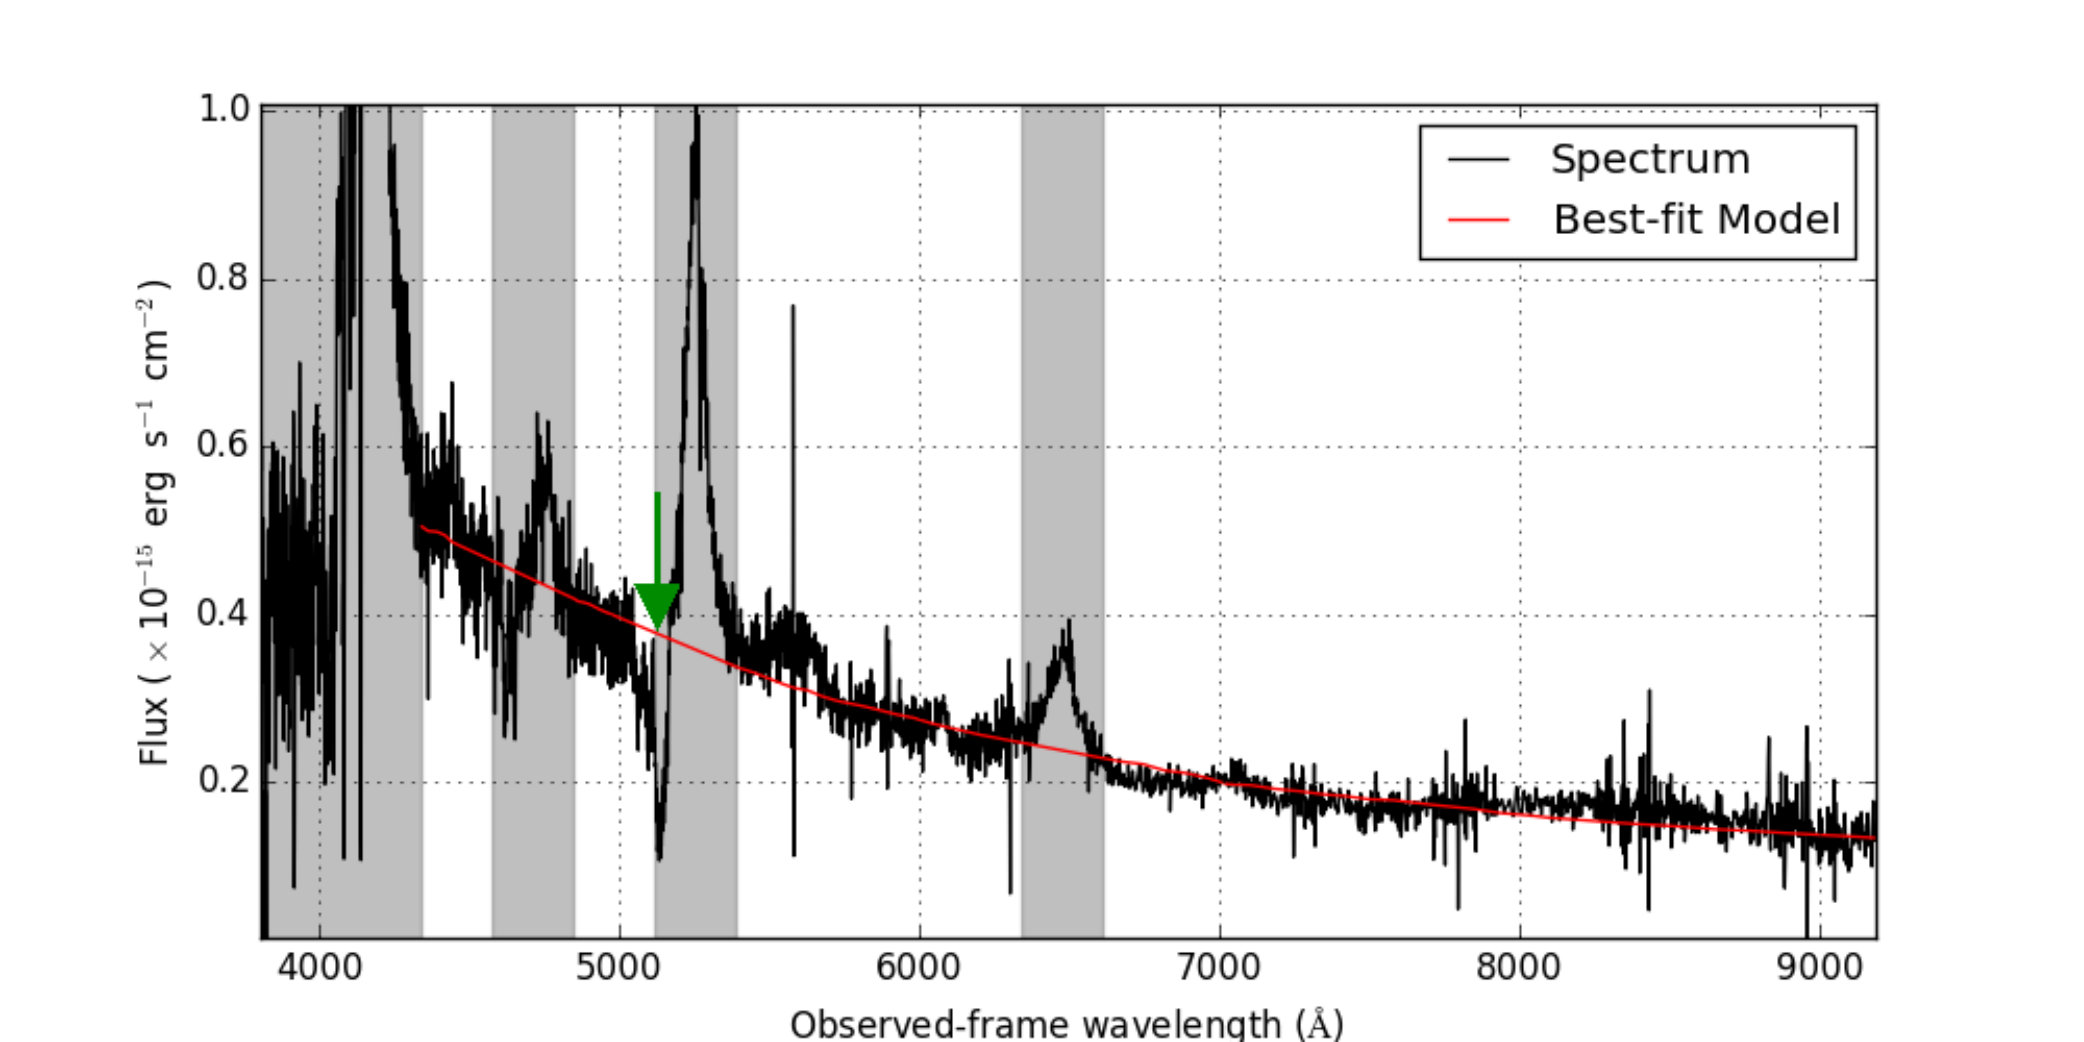 Figure 14
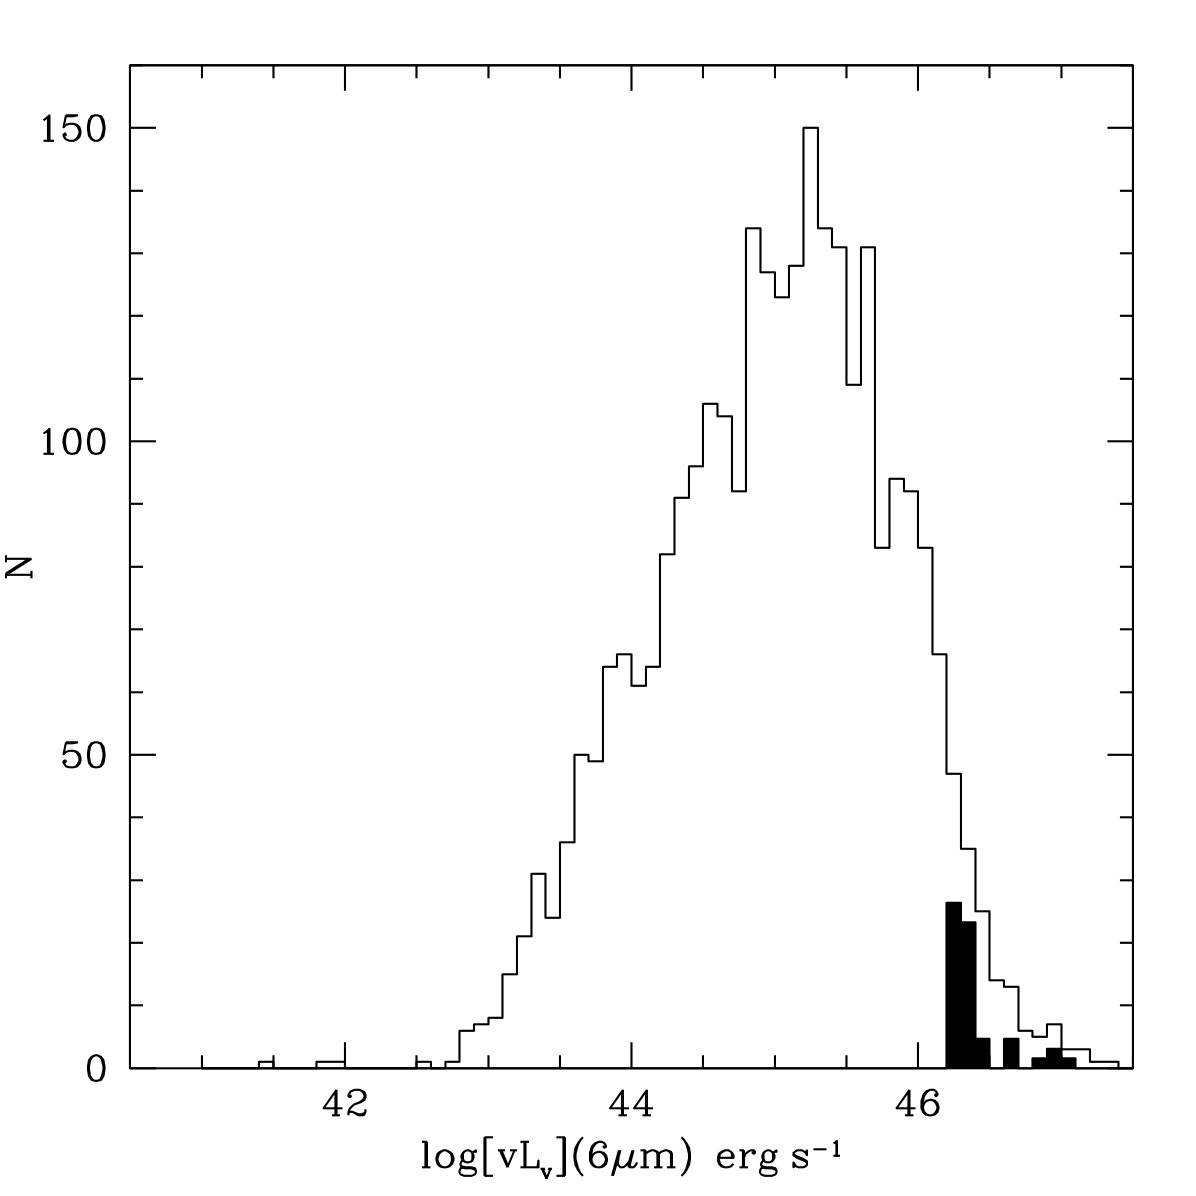 Figure 15
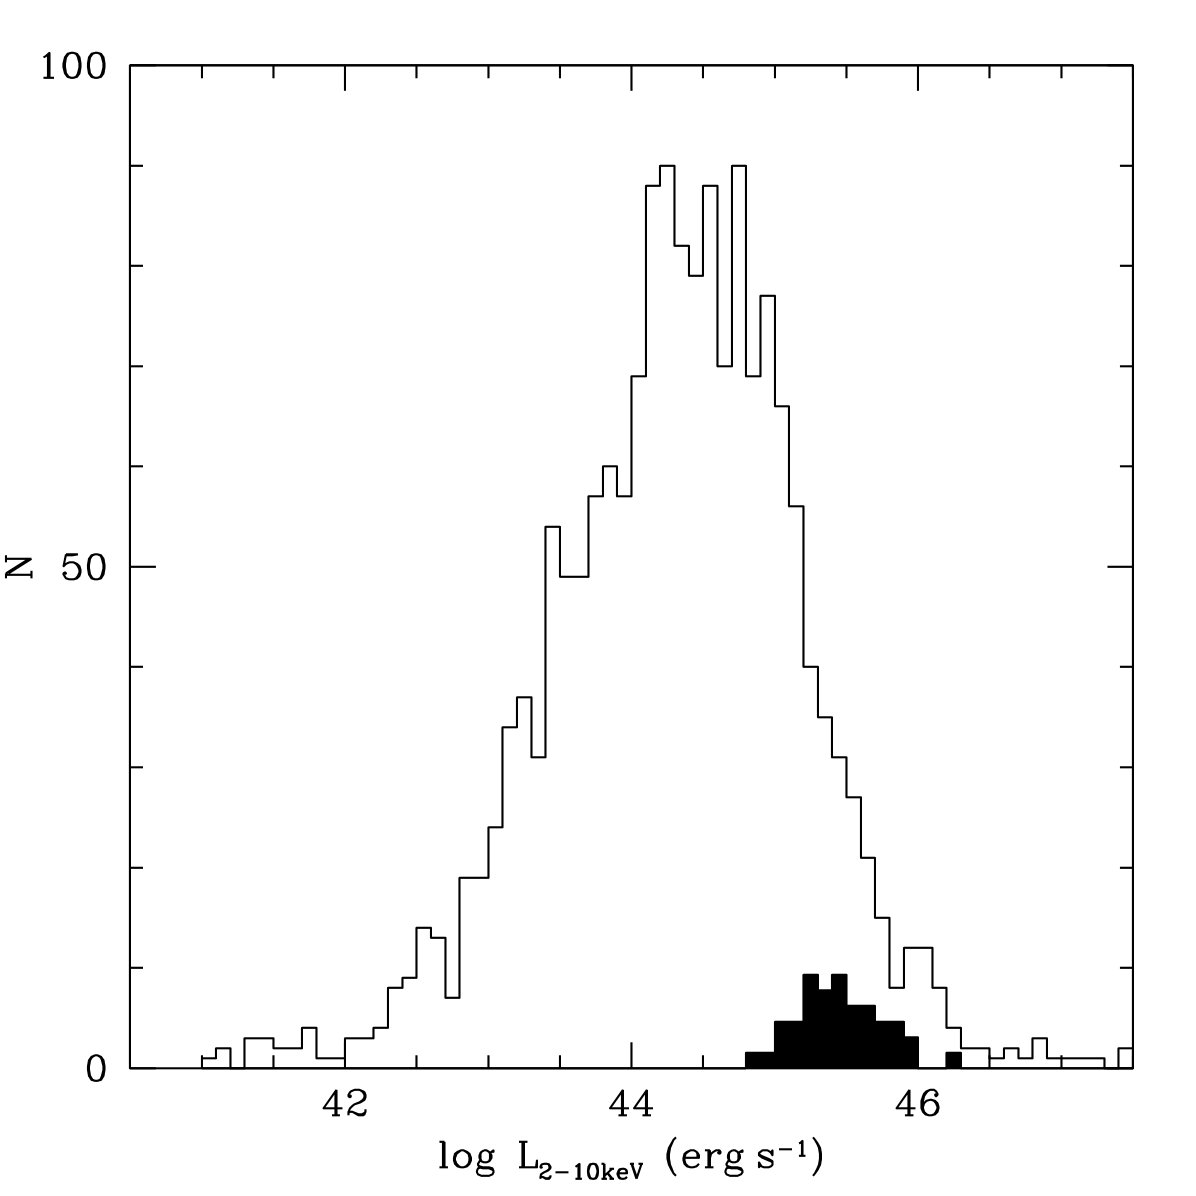 Figure 16
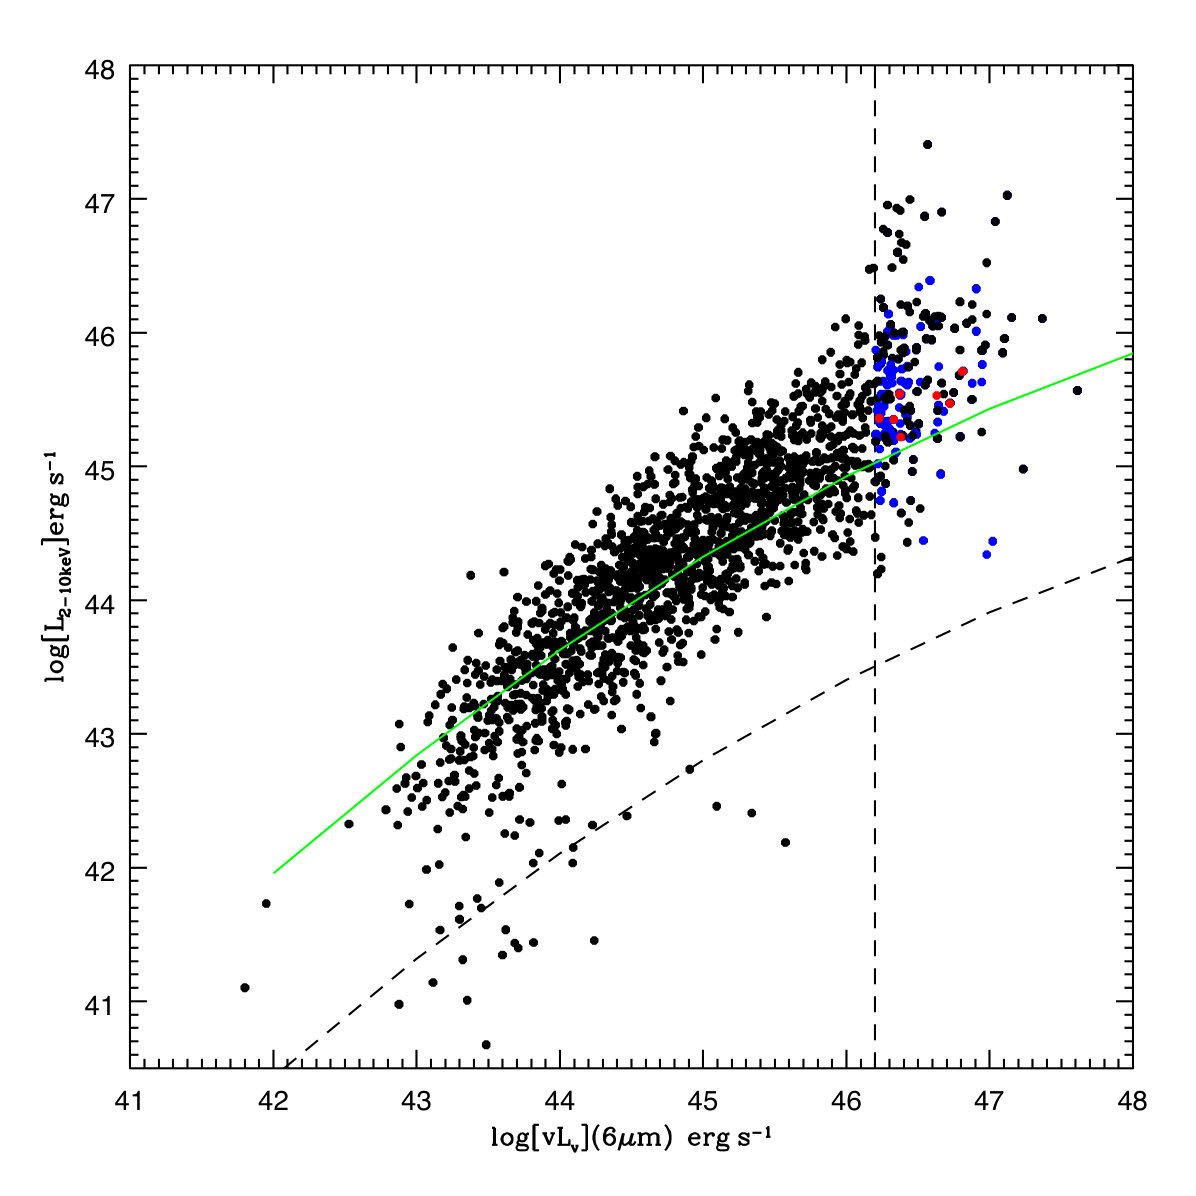 Figure 17
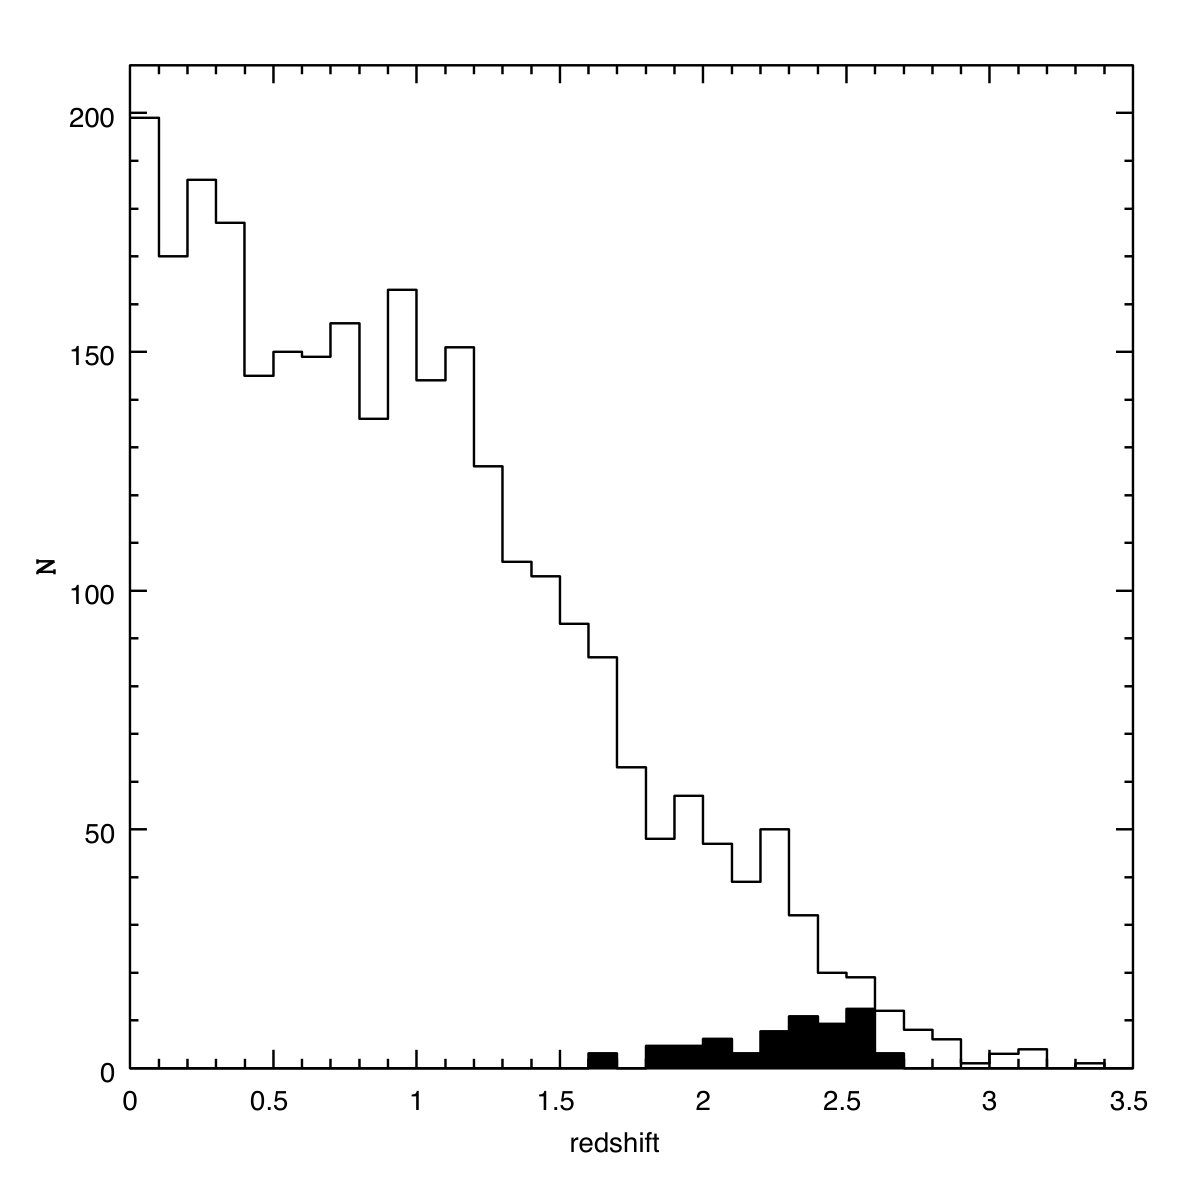 Figure 18
| 3XMM ID | L | CF() | EW | C-stat/d.o.f. | cstat/dof | l.r.t. | |||||||
|---|---|---|---|---|---|---|---|---|---|---|---|---|---|
| () | () | ( cm-2) | (eV) | ( cm-2) | |||||||||
| Neutral absorption | Ionized absorption | ||||||||||||
| (1) | (2) | (3) | (4) | (5) | (6) | (7) | (8) | (9) | (10) | (11) | (12) | (13) | (14) |
| (a) 3XMMJ001232.0+052658 | 2.63 | 46.81 | 45.65 | 200 | 372/398 | 1600 | 374/398 | 0.24 | |||||
| (b) 3XMMJ153703.9+533219 | 2.40 | 46.37 | 45.46 | 300 | 245/294 | 246/294 | 0.77 | ||||||
| (c) 3XMMJ090122.6+204446 | 2.09 | 46.63 | 45.55 | 600 | 104/135 | 950 | 104/134 | 0.13 | |||||
| (d) 3XMMJ120445.3+310609 | 2.32 | 46.23 | 45.06 | 375/395 | 365/394 | 1.0 | |||||||
| (e) 3XMMJ114312.1+200346 | 2.18 | 46.38 | 44.92 | 700 | 100/107 | 97/106 | 0.97 | ||||||
| (f) 3XMMJ024933.4-083454 | 2.49 | 46.33 | 45.37 | 348/388 | 300 | 345/387 | 0.72 | ||||||
| (g) 3XMMJ112320.7+013747 | 1.48 | 46.72 | 45.40 | 140 | 901/1050 | 907/1050 | 1.0 | ||||||
| 3XMM ID | AV | ||
|---|---|---|---|
| 3XMMJ001232.0+052658 | 4.78 | 6.16 | |
| 3XMMJ153703.9+533219 | 3.15 | 4.34 | |
| 3XMMJ090122.6+204446 | 3.45 | 4.76 | |
| 3XMMJ120445.3+310609 | 3.28 | 4.57 | |
| 3XMMJ114312.1+200346 | 3.38 | 4.96 | |
| 3XMMJ024933.4-083454 | 2.96 | 4.03 | |
| 3XMMJ112320.7+013747 | 3.25 | 5.12 |
| 3XMM ID | BI | AI |
| (Km s-1) | (Km s-1) | |
| 3XMMJ001232.0+052658 | 0.0 | |
| 3XMMJ153703.9+533219 | ||
| 3XMMJ090122.6+204446 | ||
| 3XMMJ120445.3+310609 | 0.0 | |
| 3XMMJ114312.1+200346 |
Peer Reviews
No public reviews on file for this paper yet. If you reviewed it on a platform where reviews are public (OpenReview, ICLR, NeurIPS, ICML), you can paste yours below so the community can read it here.
Videos
No videos yet. Explain this paper in a talk, walkthrough, or lecture? Add one.
Searching for luminous absorbed sources in the WISE AGN catalogue
G. Mountrichas1, I. Georgantopoulos1, N. J. Secrest3, I. Ordovás-Pascual2, A. Corral1, A. Akylas1, Mateos, S2, Carrera, F. J.2, Batziou, E. 4
1National Observatory of Athens, V. Paulou & I. Metaxa, 11532, Greece
2Instituto de F sica de Cantabria (CSIC-UC), Avenida de los Castros, 39005 Santander, Spain
3Department of Physics & Astronomy, George Mason University, MS 3F3, 4400 University Drive, Fairfax, VA 22030, USA
4Faculty of Physics, School of Sciences, Univ. of Athens, Panepistimiopolis, 15771 Ilissia, Greece
Abstract
Mid-IR colour selection techniques have proved to be very efficient in finding AGN. This is because the AGN heats the surrounding dust producing warm mid-IR colours. Using the WISE 3.6, 4.5 and 12 colours, the largest sample of IR selected AGN has already been produced containing 1.4 million AGN over the whole sky. Here, we explore the X-ray properties of this AGN sample by cross-correlating it with the subsample of the 3XMM X-ray catalogue that has available X-ray spectra and at the same time optical spectroscopy from SDSS. Our goal is to find rare luminous obscured AGN. Our final sample contains 65 QSOs with erg s*-1*. This IR luminosity cut corresponds to erg s*-1*, at the median redshift of our sample (), that lies at the bright end of the X-ray luminosity function at . The X-ray spectroscopic analysis reveals seven obscured AGN having a column density . Six of them show evidence for broad [CIV] absorption lines and five are classified as BALQSOs. We fit the optical spectra of our X-ray absorbed sources to estimate the optical reddening. We find that none of these show any obscuration according to the optical continuum. These sources add to the growing evidence for populations of luminous QSOs with evidence for substantial absorption by outflowing ionised material, similar to those expected to be emerging from their absorbing cocoons in the framework of AGN/galaxy co-evolution.
keywords:
galaxies: active, galaxies: haloes, galaxies: Seyfert, quasars: general, black hole physics
1 Introduction
Mid-IR selection techniques provide a very efficient means to detect Active Galactic Nuclei (AGN). These methods are based on the detection of the ’warm’ colours arising from the hot dust surrounding the AGN. This dust, most probably in the form of a clumpy torus (Wada et al., 2011; Nenkova et al., 2008), is heated by the central black hole radiation and is re-emitted in the mid-IR. The mid-IR AGN surveys have been introduced by Lacy et al. (2004); Stern et al. (2005); Alonso-Herrero et al. (2006); Donley et al. (2007) using data from the Spitzer mission (Werner et al., 2004). These colour-selection techniques have been adapted for use in the Wide-field Infrared Survey Explorer (WISE) mission (Wright et al., 2010). WISE performed an all-sky survey in four mid-IR bands 3.4, 4.6, 12 and 22 . In particular, Stern et al. (2012) applied a one colour selection criterion using the 3.4 and 4.6 bands (see also Assef et al., 2013). Mateos et al. (2012) proposed a ’wedge’ selection method based on three WISE colours. All the above methods are particularly efficient in finding the most luminous QSOs. However, they become incomplete at lower luminosities (see e.g Barmby et al., 2006; Georgantopoulos et al., 2008; Cardamone et al., 2008; Donley et al., 2012; Mateos et al., 2012). This is because contamination by the host galaxy renders the mid-IR colours bluer. Recently, Secrest et al. (2015) applied the Mateos et al. (2012) selection criteria in the entire WISE dataset compiling a sample of 1.4 million AGN candidates.
The Secrest et al. (2015) catalogue is useful in finding the most luminous AGN and among them, those that are obscured. Luminous obscured AGN are quite rare. X-ray surveys have demonstrated that the fraction of obscured AGN, defined as those with a column density higher than cm*-2*, drops significantly with increasing luminosity (Ueda et al., 2003; Akylas et al., 2006; Della Ceca et al., 2008; Assef et al., 2013; Ueda et al., 2014). This could naturally occur because the radiation pressure from a powerful AGN blows the torus away (Fabian et al., 2008). According to models of galaxy formation (Hopkins et al., 2008), the most luminous AGN may represent the product of galaxy mergers. Then obscured and luminous AGN represent the phase where the AGN is still growing and has not yet blown away its obscuring screen. Brusa et al. (2015) find a number of luminous obscured AGN in the COSMOS field which show strong evidence for interaction with the host galaxy in their optical spectra. More interestingly, a few wide area surveys found a number of obscured sources among optical type-1, broad-line, AGN. Page et al. (2001a) selected absorbed sources in ROSAT pointed observations. These presented moderate amounts of obscuration (cm*-2*) based on their hardness ratios (HRs). They were associated with type-1 QSOs according to their optical spectral classification. Wilkes et al. (2005) investigated the X-ray properties of 2MASS selected red QSOs using both Chandra and XMM-Newton. These presented moderate amounts of obscuration in their X-ray spectra. Finally, previous studies (e.g., Wolter et al., 2005; Mateos et al., 2005; Merloni et al., 2014) find that an appreciable fraction (20-30%) of optical type-1 AGN present obscuration in X-rays. These sources may contain more gas than dust and could represent the phase where the AGN is blowing away the obscuring cocoon.
In this paper, we expand the above works by studying the X-ray properties of WISE selected AGN. Our main goal is to find rare luminous obscured AGN. Towards this end, we cross-correlate the WISE AGN sample of Secrest et al. (2015) with the 3XMM catalogue (Rosen et al., 2016). The WISE AGN survey, owing to its large cosmological volume provides a unique database for the study of this rare class of AGN. We focus our analysis on the 3XMM-DR5 catalogue sub-sample with available X-ray spectroscopy (Corral et al., 2015) and optical spectra from the Data Release 12 (DR12) of SDSS/BOSS (Alam et al., 2015). The sources found to be absorbed, based on their X-ray spectra, are also investigated for possible absorption features in their optical spectra. Moreover, reddening estimates from the optical spectra as well as from the optical to mid-IR colours are presented.
We adopt H0 = 75 km s*-1* Mpc*-1*, = 0.3 and = 0.7 throughout the paper.
2 Data
The infrared (IR) and X-ray catalogues used in this analysis, as well as our final AGN sample constructed by the cross-matching of the two, are described in the following.
2.1 The infrared sample
The infrared AGN catalogue used in our analysis, was extracted from the WISE data, as described in Secrest et al. (2015). The WISE survey is an all-sky mid-IR survey at four bands, i.e., 3.4, 4.6, 12 and 22 m (W1, W2, W3, W4, respectively Wright et al., 2010). The AllWISE data set, that was used for the AGN extraction, contains positions, apparent motions, magnitudes and PSF-profile fit information for almost 748 million objects.
A large number of AGN mid-IR colour selection criteria exists in the literature. These colour criteria rely on the fact that in mid-IR colour space, AGN separate well from stars and star-forming galaxies. Nevertheless, a number of requirements have to be met, in choosing those colour criteria that can be applied on the WISE sample. The criteria have to be defined directly from the WISE dataset to avoid uncertainties related to the transformation from different magnitude systems. Secrest et al. (2015) used the W1, W2 and W3 bands of WISE, along with equations (3) and (4) from Mateos et al. (2012) to define the WISE AGN sample. The selection of W2 and W3 bands also reduces the bias against heavily absorbed AGN and minimizes the contamination by non-AGN sources, i.e., star-forming galaxies (Mateos et al., 2012). The final sample consists of 1,354,775 mid-IR AGN candidates covering relatively uniformly the full sky. Approximately 1.1 million of these were previously uncatalogued.
2.2 The X-ray sample
The X-ray sample used is the 3XMM-Newton Data Release 5 (Rosen et al., 2016) that contains 565,962 detections, covering 877 deg2. 396,910 of these sources are unique. The detections are drawn from 7781 XMM-Newton EPIC observations, within an energy range from 0.2 keV to 12 keV. 91,679 sources have available spectra. Spectra were considered for extraction for point sources with a count limit of 100 counts in EPIC. A detailed description of the 3XMM catalogue and the spectral extraction is available online 111http://xmm-catalog.irap.omp.eu/docs/spectral-fitting.
2.3 Sample selection
The scope of this work is to find AGN that are luminous based on their rest-frame, infrared luminosity, , and absorbed, based on the values of their column densities, . We chose to use the infrared luminosity because it provides the most unbiased measurement of the bolometric luminosity compared to other wavelengths. 6 is chosen as it is a good proxy of the torus luminosity and this spectral region is free of strong galaxy features (e.g., Mateos et al., 2015). An AGN sample that contains the infrared as well as the X-ray properties of the sources is needed. For that purpose, the two catalogues, described in the previous sections, are cross-correlated. For the cross-match we use TOPCAT, version 4.2-3222 http://www.star.bris.ac.uk/ mbt/topcat/, using a radius of 3 arcsec. The position accuracy for a typical source in the DR5 of the 3XMM catalogue is 1 - 2 arcsec (Rosen et al., 2016), while in the WISE sample the precision is better than 1*′′* (Wright et al., 2010). 5,990 AGN are found to be common in the two catalogues and 2,834 of them also have available redshift. Redshifts come preferentially from LQAC-2 (Souchay et al., 2012), then from DR12 of SDSS and then MILLIQUAS (for more information see Secrest et al., 2015). To check the fraction of expected spurious matches, each 3XMM source is re-positioned within a radius up to 5 arcmin around its original position. 100 random catalogues are created, following this process and then they are cross-matched with the WISE sample. The test reveals that we expect to have about of spurious matches in our sample. The redshift as well as the X-ray (observed) luminosity distributions, in the 210 KeV band, of the 2,834 sources are presented in Figures 1 and 2, respectively.
To select luminous AGN, the L at 6 m is calculated. Contamination from star formation at 6 m is negligible (e.g Symeonidis et al., 2016), especially at the bright luminosities that our final AGN sample spans (see below). First, the VEGA magnitudes of the WISE catalogue are converted to AB, using the following expressions 333http://wise2.ipac.caltech.edu/docs/release/prelim/expsup/,
[TABLE]
[TABLE]
[TABLE]
[TABLE]
The observed wavelength, of each source is then given as:
[TABLE]
where z is the redshift of the source and =6m. Using the estimated value for , we apply an interpolation between the four WISE bands, to estimate the AB magnitude of each source, . We note that our sources are detected in all four WISE bands: 3.4, 4.6, 12 and 22 m. For those sources that lie at very high redshift () and their falls at wavelengths longer than 22 m an extrapolation is applied. The observed flux, , of the AGN is then given by the expression:
[TABLE]
Finally, the infrared luminosity is estimated as,
[TABLE]
where is the luminosity distance. The infrared luminosity distribution of our sample is presented in Fig. 2. The X-ray vs. IR luminosity for the 2,834 AGN, is presented in Fig. 3.
A luminosity cut at erg s*-1*, is applied to select only luminous sources. We choose this IR cut as it corresponds to erg s*-1* (Stern, 2015) at the median redshift of our sample () and lies at the bright end of the X-ray luminosity function at (e.g., Aird et al., 2010; Ueda et al., 2014; Georgakakis et al., 2015). In addition, at these bright luminosities, the contamination from the star emission the AGN hosts to the W1 and W2 bands is negligible (see Fig. 3 in Mateos et al., 2015). Since we shall also check the optical absorption of those sources found to be X-ray absorbed, we also exclude AGN that do not have available optical spectrum from SDSS/BOSS (Alam et al., 2015). Our final sample consists of 65 AGN. Although we do not specifically look for type-1 AGN, our selection criteria bias our luminous sample towards type-1 sources. In particular, at high redshifts, SDSS selects, based on colours, Type-1 sources, i.e., QSOs.
3 Analysis
3.1 X-ray absorption
We fitted the X-ray spectra of our 65 sources by using Xspec v12.8 (Arnaud, 1996). We used Cash statistics (implemented as C-stat in Xspec Cash, 1979) to the spectra binned to 1 count/bin, which has been proven to recover the actual spectral parameters in the most accurate way even for very low count spectra (see for example Krumpe et al., 2010). All the spectral models applied include photoeletric absorption fixed at the Galactic value at the source coordinates given by Leiden/Argentine/Bonn (LAB) Survey of Galactic HI (Kalberla et al., 2005). We first fitted a power-law model absorbed by neutral material totally or partially covering the central source (zwabs and zpc in Xspec notation, respectively). A partial-covering absorbed modelled this way can also represent a soft-scattered second power-law component. We also checked for the presence of the Fe K emission line, the most common emission line observed in X-ray spectra of AGN, by adding a gaussian component with centroid and width fixed at 6.4 keV and 100 eV rest-frame, respectively.
A source is considered as absorbed when the measured best-fit intrinsic column density is higher than cm*-2* and the statistical lower limit (confidence limit 90%) is N cm*-2*. By applying the neutral absorption models, our spectral fitting analysis reveals seven absorbed sources. The resulting parameters for these seven sources are presented in Table LABEL:table_xspec_lum. Upper limits for the Fe K EW correspond to this component not being required in the spectral fit. In the cases of sources d) and e), we were forced to fix the photon index to 1.9 (a typical value for luminous AGN; Corral et al., 2011). The X-ray spectrum of source e) is of too low quality to be able to constrain both the column density and the photon index. In the case of source d), leaving it free results in an unphysical value 1.3. Given this flat spectrum, we also tried a power-law plus neutral reflection model, but the resulting spectral parameters were unconstrained, probably due to the limited spectral quality.
Significant X-ray absorption in type 1 AGN can be reconciled with AGN unified models if this absorption comes from partially dust-free and ionized material, which would have little effect on the optical reddening. Ionized absorption from outflowing material has been detected in the optical spectra of some AGN (Broad Absorption Line QSOs; BALQSOs). The optical spectra for six out of our seven sources, shown in Fig. 5 present evidence for broad [CIV] absorption lines suggesting they could be classified as BALQSOs.
Page et al. (2011) presented a sample of five X-ray absorbed, broad line QSOs, at , from ROSAT (Page et al., 2001b). Some of them show evidence of [CIV] absorption lines in their ultraviolet spectra. Based on their analysis, the X-ray spectra can be modelled successfully with ionized absorbers, or with cold absorbers if they possess unusually flat X-ray continuum shapes and unusual optical to X-ray spectral energy distribution. They conclude that this population of sources, represents the transition phase between obscured accretion and the luminous QSO phase in the evolution of massive galaxies.
To check whether the measured X-ray absorption for our seven sources could come from ionized material, we also applied an ionized absorption model (absori in Xpsec) to our luminous and absorbed sources. The variable parameters of our ionized absorption model were the column density and the ionization parameter . represents the ionization state of the asorbing material as: ; where L is the illuminating luminosity, n is the gas density, and r is the distance from the illuminating source to the reprocessing gas. The results are presented in Table LABEL:table_xspec_lum. The improvement with respect to the neutral absorption model was estimated by using the likelihood ratio test (l.r.t. in Table LABEL:table_xspec_lum), with values close to 1 meaning that the neutral model is rejected in favor of the ionized one with high significance. The l.r.t. test reveals that in five cases the ionized model provides a better fit than the neutral model at the 1 confidence level (l.r.t. 0.7), so we consider the ionized absorption model as the best-fit model in these cases. In all cases the NH values derived from the ionized model are equal or larger than those derived from the neutral model. The spectral fits corresponding to the best-fit model for the seven luminous absorbed sources are shown in Fig. 4. Finally, none of the remaining of our 65 luminous sources satisfies our obscuration criteria using the ionized absorption model.
3.2 Optical absorption
In this Section, we test whether the seven X-ray absorbed sources revealed by our XSPEC analysis show evidence of absorption based on their optical spectra or optical/near-IR colours.
For that purpose we use optical spectra obtained from the DR12 of the SDSS/BOSS and analyze the nuclear continuum of the selected AGN. All the spectra are corrected from Galactic extinction using the values from Leiden/Argentine/Bonn (LAB) Survey of Galactic HI (Kalberla et al., 2005). Since our objects are very bright no host galaxy subtraction is conducted. We fit the spectrum to a model of AGN emission, using the Richards QSO template (Richards et al., 2006), obscured using the Small Magellanic Cloud (SMC) extinction model from (Gordon et al., 2003). We use this model as it gives better results for modelling the extinction in AGN (Hopkins et al., 2004). The fits are performed using the CIAO’s SHERPA fitting tool (Freeman et al., 2001). We allow the fits to end with A0 as some AGN are bluer than the Richards AGN template. The broad AGN emission lines are also masked out (as well as the absorption in the case of the Broad Absorption Line QSOs, BALQSOs; see next Section) as the extinction is measured using only the nuclear continuum. The optical spectra and the corresponding fits are presented in Fig. 5. The AV values from the fits are shown in Table LABEL:table_xray_opt_absorption. The measured AV magnitude is far below AV=2, used in previous studies to separate obscured and unobscured sources (Caccianiga et al., 2008). We caution however that our sources have an AGN dominated spectrum that peaks towards bluer colours. This AV value, using a Galactic dust-to-gas ratio, corresponds to NH=41021 cm*-2*. Previous studies find that AGN do not follow the Galactic dust-to-gas ratio (Maiolino et al., 2001). In this case, assuming R the corresponding NH value increases by about an order of magnitude.
Prompted by previous studies that find a correlation between the X-ray obscuration and the optical colour (e.g., Civano et al., 2012) we apply the optical colour criteria of LaMassa et al. (2016) to our luminous sample of 65 AGN to select red sources. Using equations (1) and (2) in LaMassa et al. (2016) we estimate the values in the R bandpass. Our analysis reveals that five of our luminous sources are optically red (R-W1). One of them is also absorbed based on our X-ray spectra fitting, i.e., 3XMMJ001232.0+052658. Yan et al. (2013) showed that, at z, type-2 AGN candidates can be identified using the following optical colour criteria: WISE combined with (Vega). Applying these criteria on our luminous sample we identify 5 sources. One of these sources is also X-ray absorbed, based on our XSPEC analysis. Table LABEL:table_xray_opt_absorption compares the X-ray absorption with the optical obscured criteria for our X-ray absorbed AGN.
4 Summary and Discussion
We studied the X-ray properties of luminous IR-selected AGN by cross-matching the 3XMM catalogue with WISE selected AGN. Our analysis revealed 65 AGN with spectroscopic redshift that are luminous ( erg s*-1*) and seven of them are also absorbed (log N 22 cm*-2*, N cm*-2*), based on our X-ray spectra fitting using XSPEC. Our analysis suggests that , i.e., seven out of 65 sources, of Type 1 AGN are obscured in X-rays.
We then tested whether our X-ray absorbed sources show obscuration in their optical spectra. Fitting the available SDSS/BOSS optical spectra we find no optical obscuration, based on their optical continuum. However, five out of the seven sources are classified as Broad Absorption Line (BAL) quasars in the DR12 SDSS catalogue 444https://data.sdss.org/datamodel/files/BOSS$\_$QSO/DR12Q/DR12Q$\_$BAL.html. Source (f) is the only one not classified as BALQSO while source (g) does not have the necessary wavelength coverage as the [CIV] line falls just bellow the 4000 Angstroms. Existence of absorption lines while there is no absorption in the optical continuum has been previously observed in the case of BAL quasars. These systems show no or little dust extinction in the optical/UV, but with broad, blueshifted absorption lines (Barger et al., 2002). They are thought to be intrinsically normal quasars, covered by a high column density of dust-free gas that is responsible for absorption in the X-rays and absorption lines in the optical/UV (Brandt et al., 2000). Table LABEL:table_balnicity presents the balnicity index (BI; Weymann et al., 1991) as well as the alternative, less stringent criterion to classify an object as BALQSO, the absorption index (AI; Hall et al., 2002; Trump et al., 2006) for our five BALQSOs. Both indices measure the strength of the C IV and Mg II absorption lines to separate the non-BALQSOs from the BALQSOs. A positive BI or AI indicates the source is a BALQSO. The BI index () measures the equivalent width of the continuous troughs of absorption but, for example, ignores absorption 3000 km s*-1*. The AI index () includes the contribution of absorption troughs with outflow velocities below 3000 km s*-1* and requires a minimum absorption trough width of only 1000 km s*-1* to yield a positive AI (Page et al., 2016). For both indices, f(V) is the normalized flux as a function of velocity displacement from the line center and C is set to zero. It is set to 1.0 whenever the quantity in brackets has been continuously positive over an interval of 2000 km s*-1* (for more information see Appendix in Weymann et al., 1991; Hall et al., 2002). In the remaining 58 sources of our luminous sample of 65 AGN, we find one more source that is classified as BAL, by SDSS. The column density of this source (3XMMJ154359.4+535902) falls marginally below our criterion to be characterized as absorbed (log N 21.9cm*-2*). An ionized model, though, provides a better fit to its spectrum. In this case the column density is log N 22.7cm*-2*.
Recently, Page et al. (2016) studied a sample of six X-ray selected BALQSOs from the XMM-Newton Wide Angle Survey and found evidence for absorption in the X-ray spectra of all six objects. Streblyanska et al. (2010) studied a sample of 39 BALQSOs. 36% of their sample presents low levels of obscuration when fitted using a neutral absorption model. However, when they apply a ionized absorption model, 90% of their objects are absorbed. Ionized X-ray absorption may not be a better fit to the X-ray spectra, but it allows a simpler explanation to the optical/UV/X-ray spectrum without invoking special characteristics.
Previous studies have found that red AGN tend to be associated with higher levels of X-ray obscuration, based on their HRs (e.g., Brusa et al., 2005; Fiore et al., 2009; Civano et al., 2012). Applying optical to mid-IR colour criteria, i.e., RW1, to select red sources in our luminous sample, revealed that five out of 65 sources are optically red, but only one of them was also absorbed in X-rays. LaMassa et al. (2016) used X-ray sources in the Stripe 82X, observed with the XMM-Newton and Chandra missions. Their sample consists mostly of broad-line AGN at . They find that their reddened AGN (RW14) do not have higher HRs than the bluer AGN. Their percentage of X-ray obscured AGN among their red sources is in agreement with our estimations. However, our sample as well as that of Stripe 82X (LaMassa et al., 2016) consist of broad-line AGN in contrast to the narrow-line sources used in Brusa et al. (2005), Fiore et al. (2009) and Civano et al. (2012).
Moderate absorption in Type-1 AGN has also been reported in previous works. Wilkes et al. (2005) used Chandra and XMM-Newton observations to study a sample of five red, 2MASS AGN (). They find that substantial absorbing material ( cm*-2*) is present in three of these sources . According to their analysis, these sources are X-ray hard most probably because of absorption. They suggest that the intermediate level of obscuration they find is indicative of outflowing winds above a disk/torus. This conclusion is in agreement with that of Brusa et al. (2015). In that work they presented X-shooter@VLT observations of a sample of 10, luminous, albeit Type-2, X-ray obscured QSOs at z1.5 from the XMM-COSMOS survey. They conclude that the existence of strong outflows, in these sources, has an AGN origin. These objects are expected to be caught in the transitioning phase from starburst to AGN dominated systems. Banerji et al. (2013) used and observations to study the broad-line Type 1 QSO, named ULASJ1234+0907. This is the reddest broad-line Type 1 quasar known, with (i-K). The QSO lies at high redshift () and has a hard X-ray luminosity of L erg s*-1*. They measure a column density of N cm*-2*, that is in accordance with the obscuration level found in our luminous and obscured sources. They conclude that their QSO is at the peak epoch of galaxy formation, transitioning from a starburst to optical quasar via a dusty quasar phase. Bischetti et al. (2017) used a sample of WISE/SDSS selected hyper-luminous ( erg s*-1*) broad-line quasars at . Five of their sources show prominent [OIII] emission lines, revealing the presence of powerful ionised outflows. Their results suggest that at high luminosities AGN are very efficient in pushing outwards large amounts of ionized gas.
In this paper, in accordance with previous works we find that of luminous, high redshift AGN with broad emission lines present moderate levels of X-ray absorption, i.e., NH cm*-2*. Recent works using different selection criteria have found several samples of luminous AGN with evidence for absorbing and outflowing material, to which we have added our own sample of X-ray absorbed MIR-luminous sources. Those are the characteristics expected for the putative population of QSOs emerging from the obscured phase and blowing away the surrounding material in a galaxy-AGN co-evolution scenario.
5 acknowledgmenets
We thank the anonymous referee for helpful comments and Prof. M. Brusa for useful discussions. The research leading to these results has received funding from the European Union’s Horizon 2020 Programme under the AHEAD project (grant agreement n. 654215). GM acknowledges financial support from the AHEAD project that is funded by the European Union as Research and Innovation Action under Grant No: 654215. FJC and IO-P acknowledge financial support through grant AYA2015-64346-C2-1-P (MINECO/FEDER). SM acknowledges financial support by the Spanish Ministry of Economy and Competitiveness through grant AYA2016-76730-P. This research has made use of data obtained from the 3XMM XMM-Newton serendipitous source catalogue compiled by the 10 institutes of the XMM-Newton Survey Science Centre selected by ESA. Funding for SDSS-III has been provided by the Alfred P. Sloan Foundation, the Participating Institutions, the National Science Foundation, and the U.S. Department of Energy Office of Science. The SDSS-III web site is http://www.sdss3.org/. SDSS-III is managed by the Astrophysical Research Consortium for the Participating Institutions of the SDSS-III Collaboration including the University of Arizona, the Brazilian Participation Group, Brookhaven National Laboratory, Carnegie Mellon University, University of Florida, the French Participation Group, the German Participation Group, Harvard University, the Instituto de Astrofisica de Canarias, the Michigan State/Notre Dame/JINA Participation Group, Johns Hopkins University, Lawrence Berkeley National Laboratory, Max Planck Institute for Astrophysics, Max Planck Institute for Extraterrestrial Physics, New Mexico State University, New York University, Ohio State University, Pennsylvania State University, University of Portsmouth, Princeton University, the Spanish Participation Group, University of Tokyo, University of Utah, Vanderbilt University, University of Virginia, University of Washington, and Yale University.
The reference list from the paper itself. Each links out to its DOI / PubMed record.
- 1Aird et al. (2010) Aird J., et al., 2010, MNRAS, 401, 2531
- 2Akylas et al. (2006) Akylas A., Georgantopoulos I., Georgakakis A., Kitsionas S., Hatziminaoglou E., 2006, A&A, 459, 693
- 3Alam et al. (2015) Alam S., et al., 2015, APJS, 219, 12
- 4Alonso-Herrero et al. (2006) Alonso-Herrero A., et al., 2006, Ap J, 640, 167
- 5Arnaud (1996) Arnaud K. A., 1996, ASPC, 101, 17
- 6Assef et al. (2013) Assef R. J., et al., 2013, Ap J, 772, 26
- 7Barger et al. (2002) Barger A. J., Cowie L. L., Brandt W. N., Capak P., Garmire G. P., Hornschemeier A. E., Steffen A. T., Wehner E. H., 2002, AJ, 124, 1839
- 8Barmby et al. (2006) Barmby P., Alonso-Herrero A., Donley J. L., Egami E., Fazio G. G., Georgakakis A., Huang J.-S., Laird E. S., Miyazaki S., Nandra K., Park S. Q., Pérez-González P. G., Rieke G. H., Rigby J. R., Willner S. P., 2006, Ap J, 642, 126