The Frequency and Stellar-Mass Dependence of Boxy/Peanut-Shaped Bulges in Barred Galaxies
Peter Erwin (1), Victor P. Debattista (2) ((1) Max-Planck-Institut, fuer extraterrestrische Physik, Garching, Germany, (2) Jeremiah Horrocks, Institute, University of Central Lancashire, Preston PR1 2HE, UK)

TL;DR
This study reveals that the occurrence of boxy/peanut-shaped bulges in barred galaxies strongly depends on stellar mass, with higher mass galaxies exhibiting a significantly greater frequency of these bulges, independent of gas content.
Contribution
It provides the first comprehensive analysis of the stellar-mass dependence of B/P bulges in a local galaxy sample, clarifying their relation to galaxy parameters and bar properties.
Findings
79% of high-mass galaxies have B/P bulges
Only 12% of low-mass galaxies have B/P bulges
No significant effect of atomic gas mass ratio on B/P bulge presence
Abstract
From a sample of 84 local barred, moderately inclined disc galaxies, we determine the fraction which host boxy or peanut-shaped (B/P) bulges (the vertically thickened inner parts of bars). We find that the frequency of B/P bulges in barred galaxies is a very strong function of stellar mass: 79% of the bars in galaxies with log (M_{star}/M_{sun}) >~ 10.4 have B/P bulges, while only 12% of those in lower-mass galaxies do. (We find a similar dependence in data published by Yoshino & Yamauchi 2015 for edge-on galaxies.) There are also strong trends with other galaxy parameters -- e.g., Hubble type: 77% of S0-Sbc bars, but only 15% of Sc-Sd bars, have B/P bulges -- but these appear to be side effects of the correlations of these parameters with stellar mass. In particular, despite indications from models that a high gas content can suppress bar buckling, we find no evidence that the (atomic)…
Click any figure to enlarge with its caption.
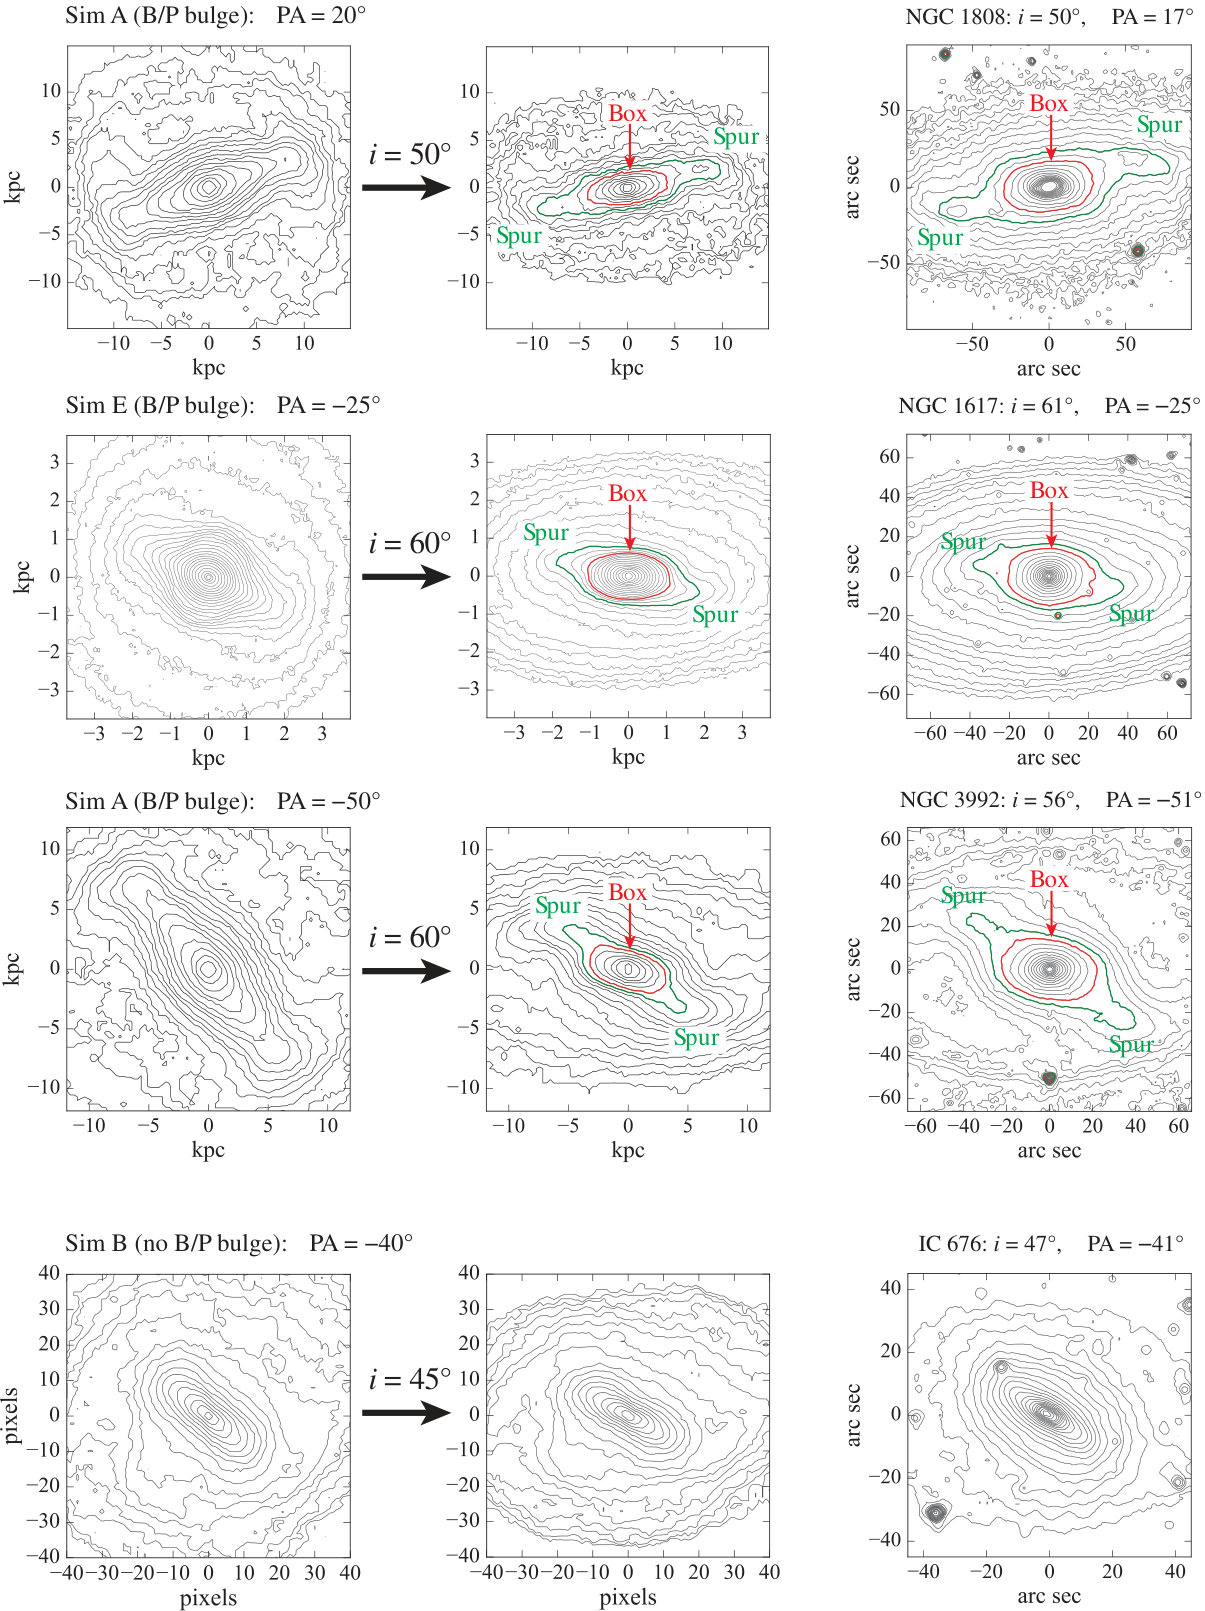 Figure 1
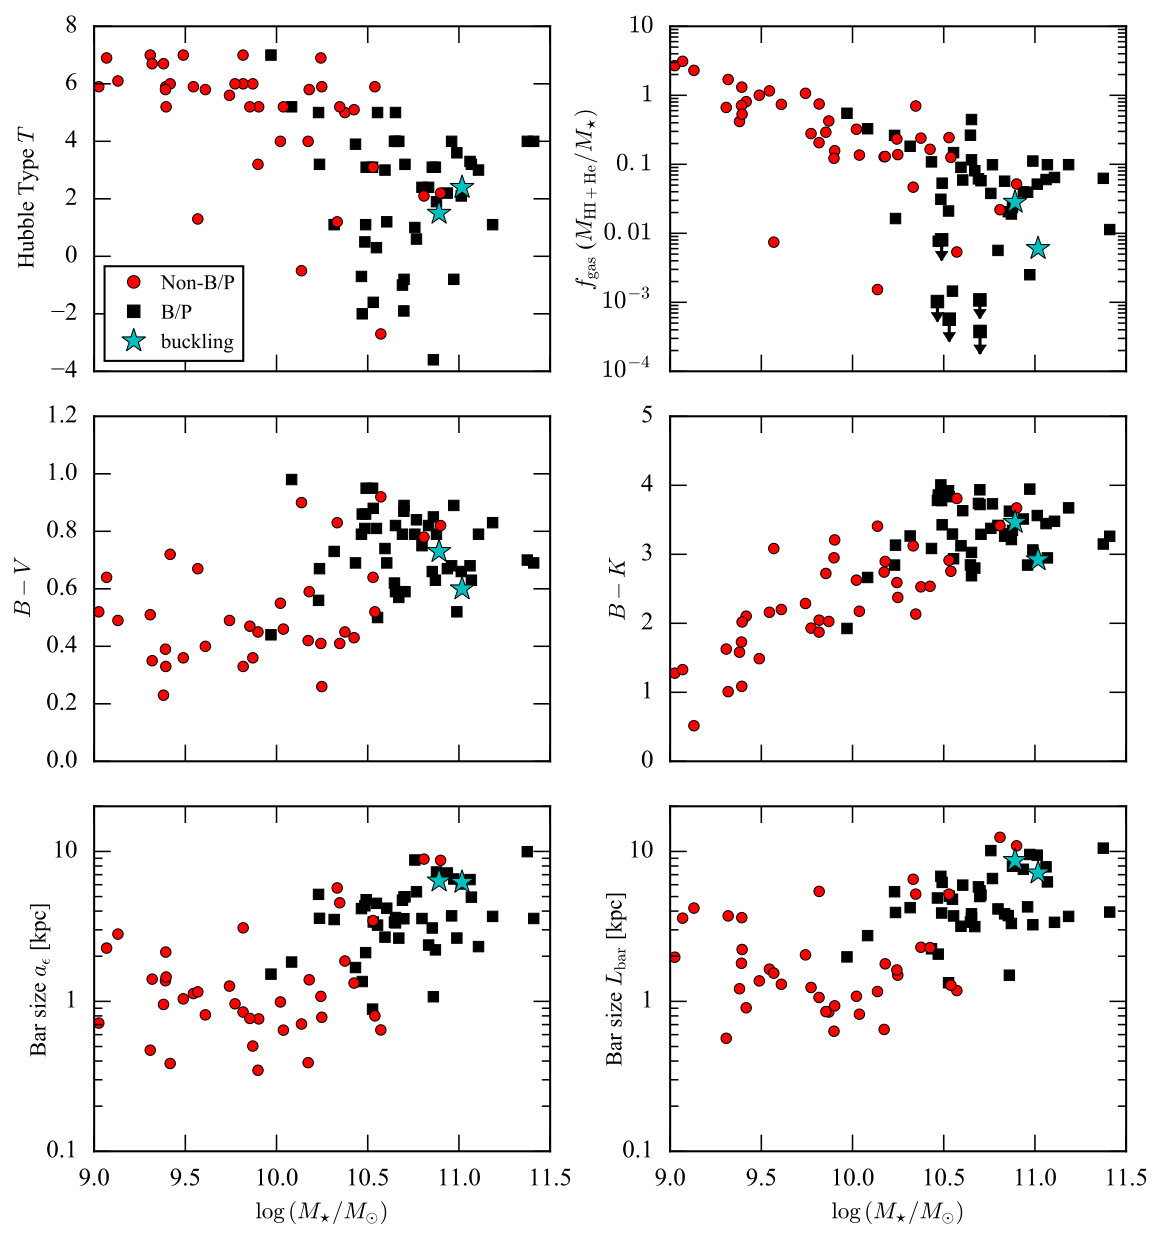 Figure 10
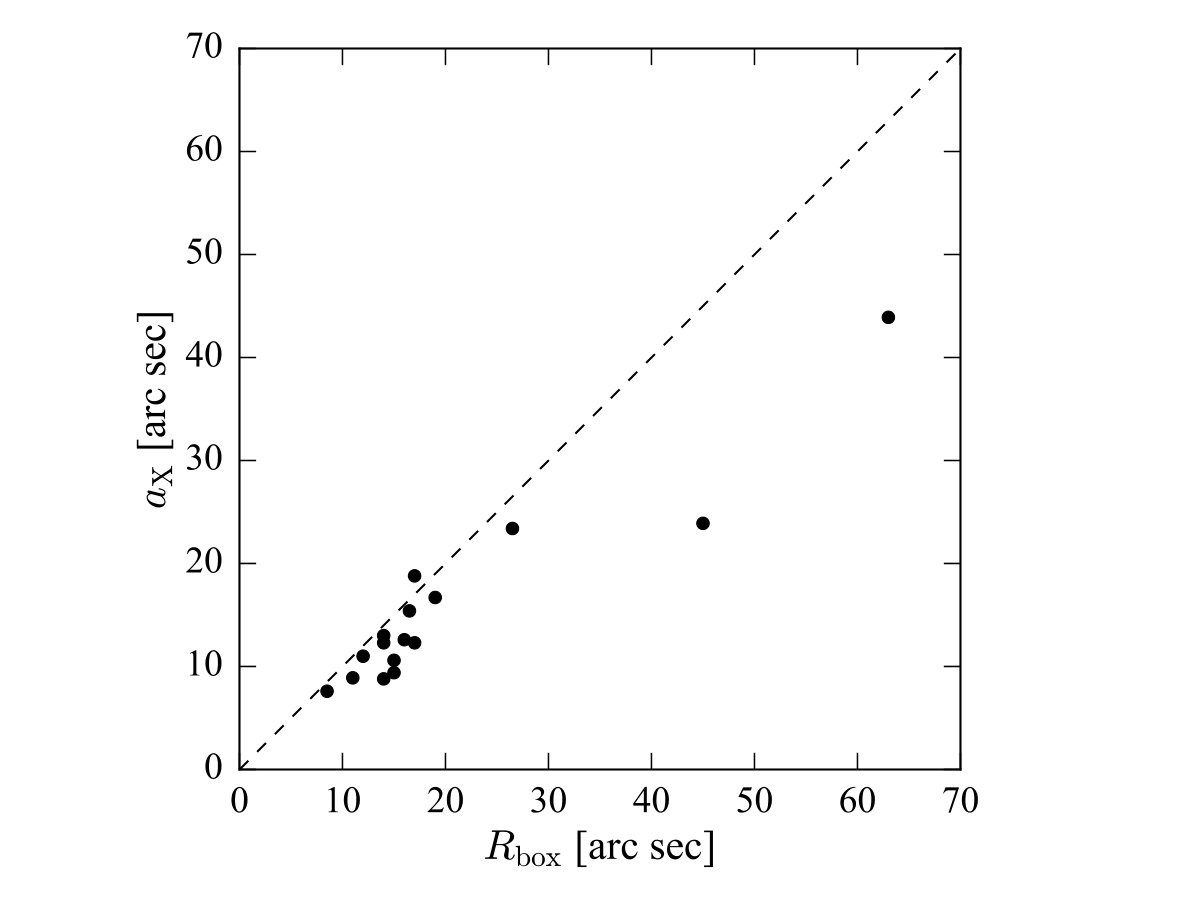 Figure 11
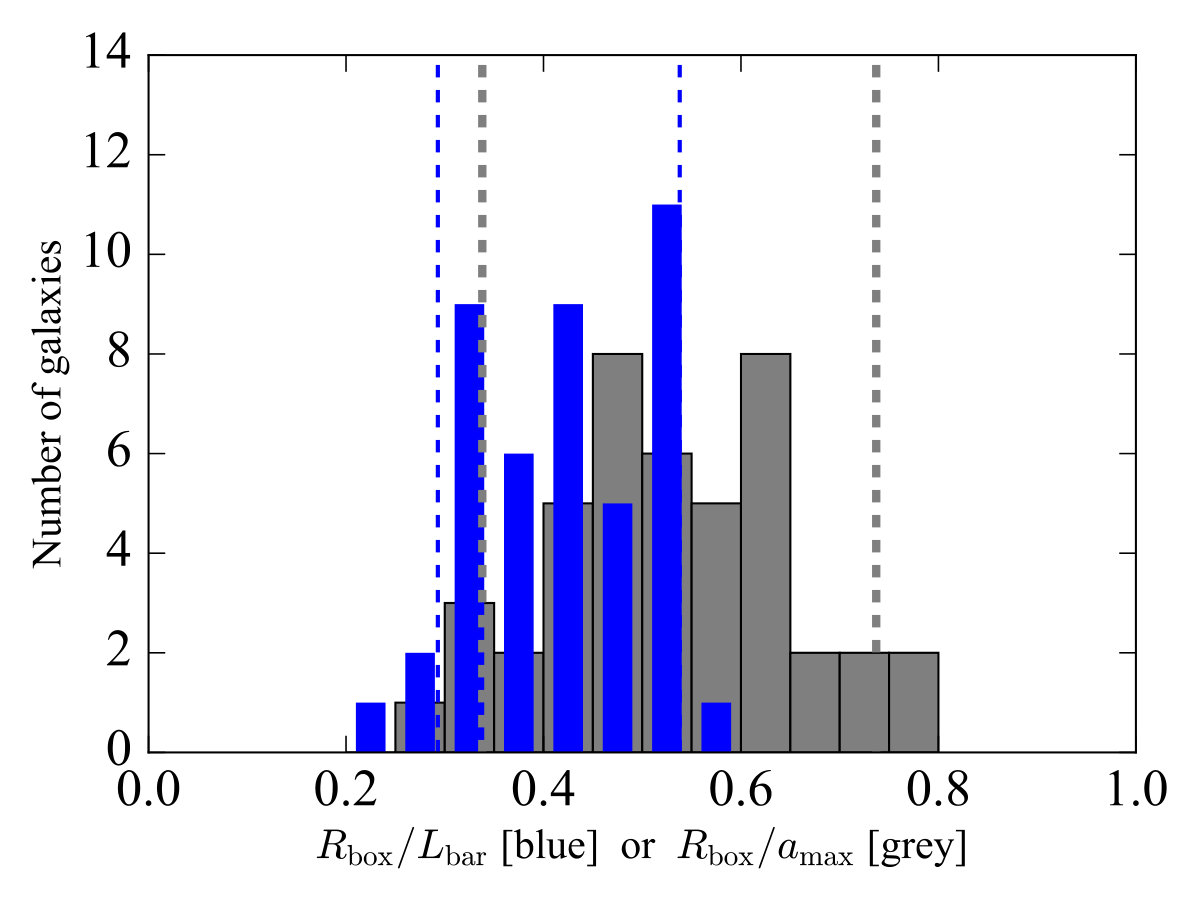 Figure 12
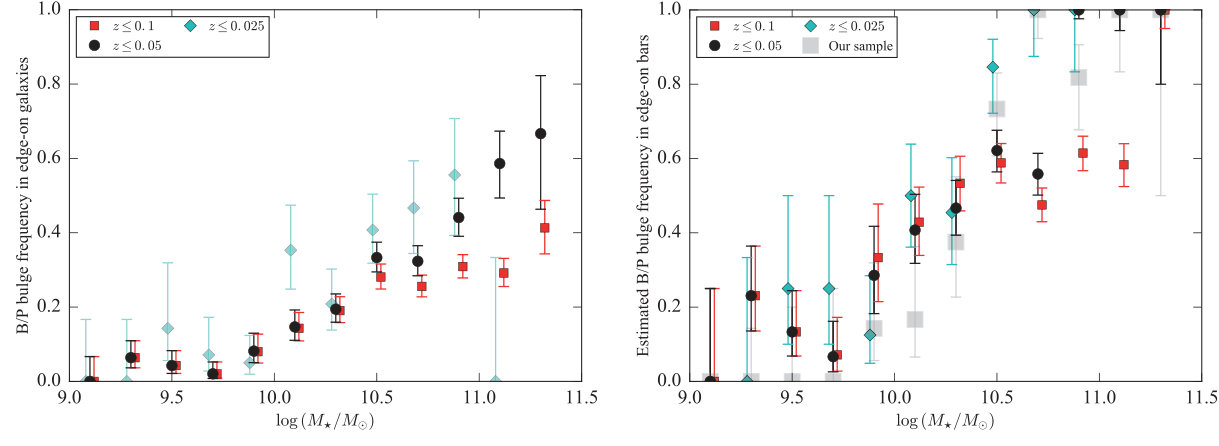 Figure 13
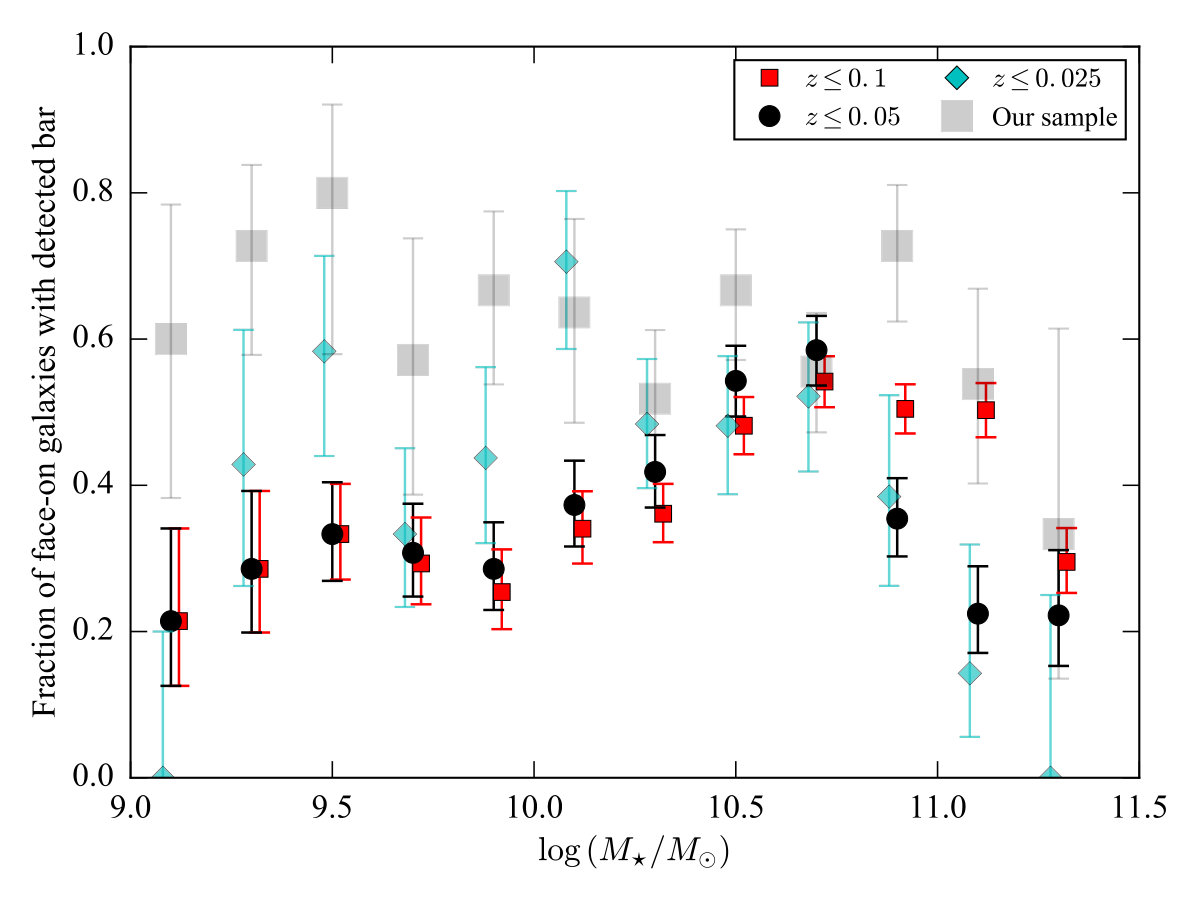 Figure 14
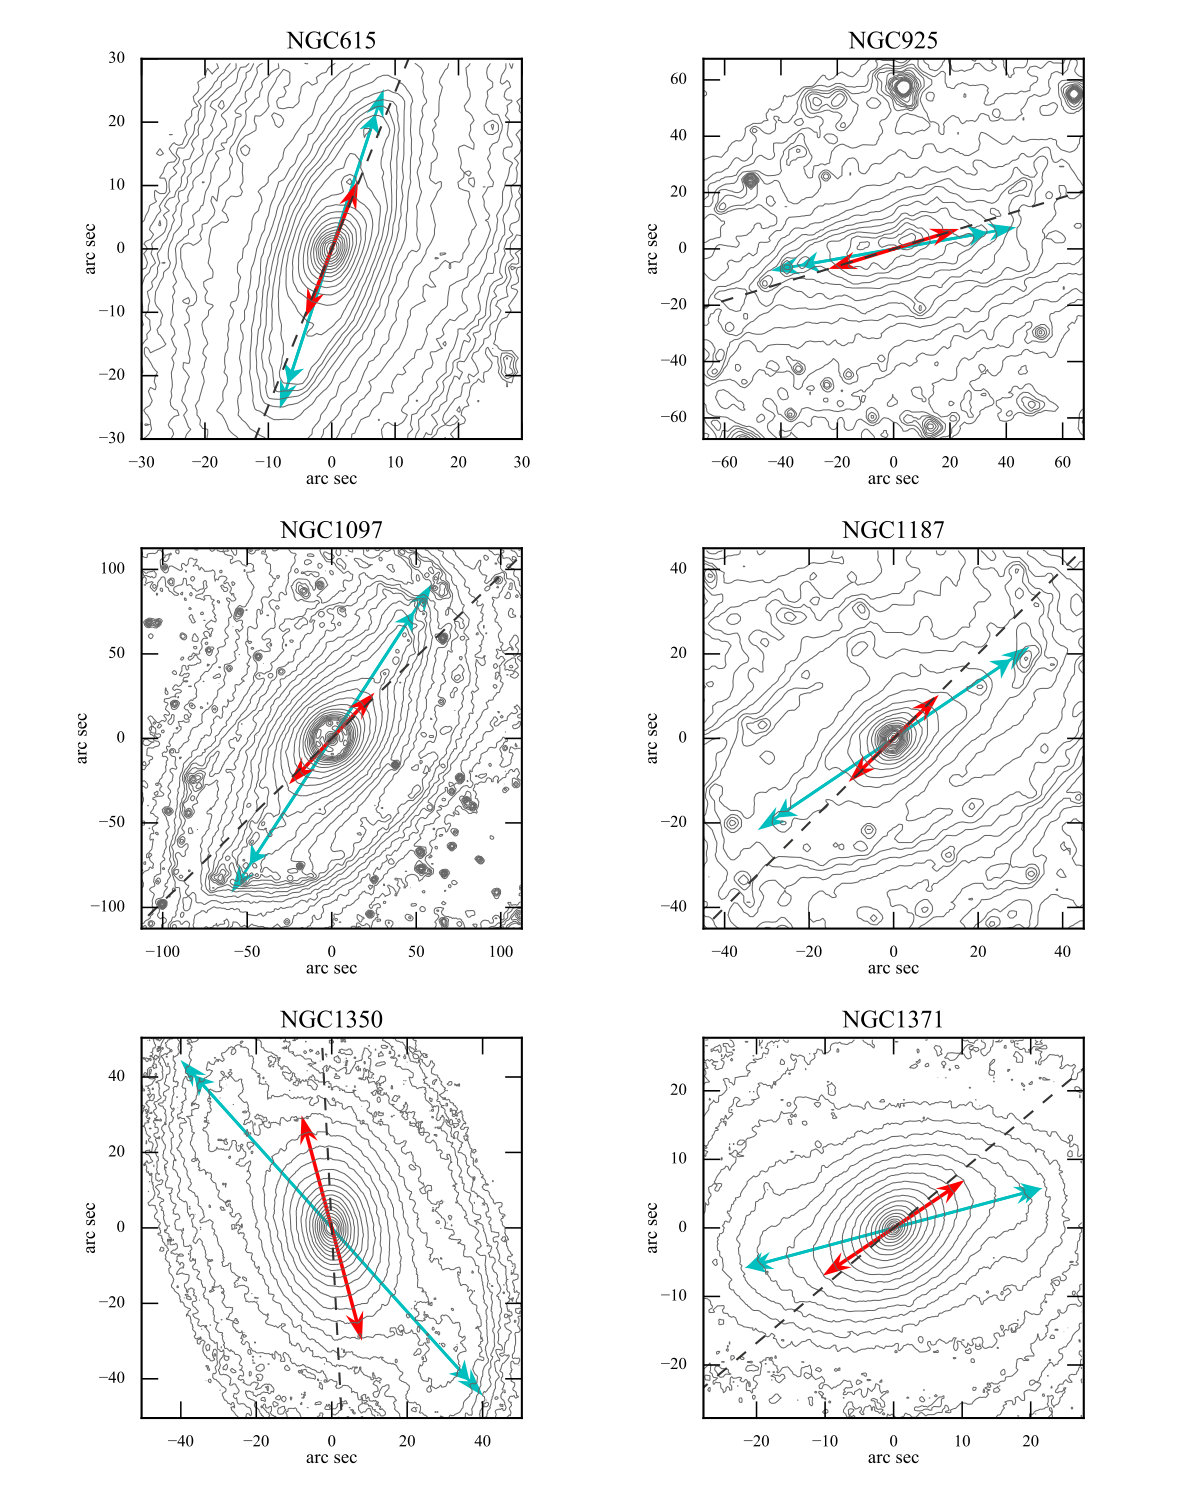 Figure 15
 Figure 15
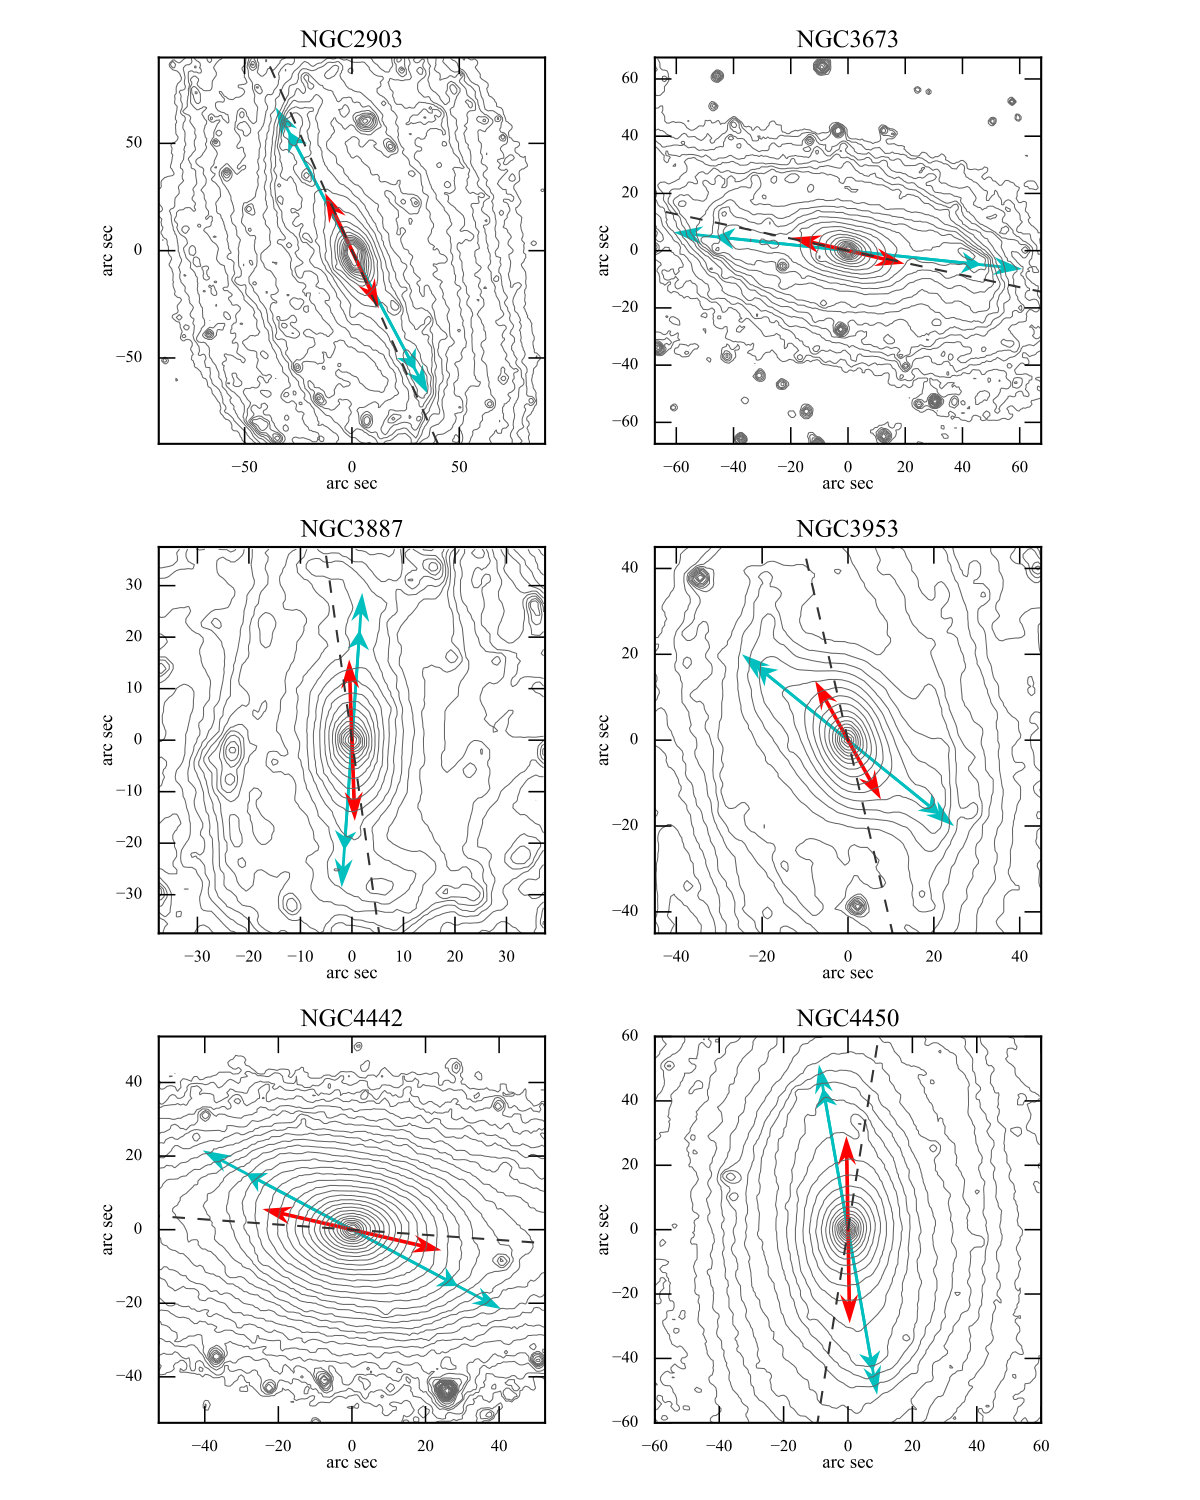 Figure 15
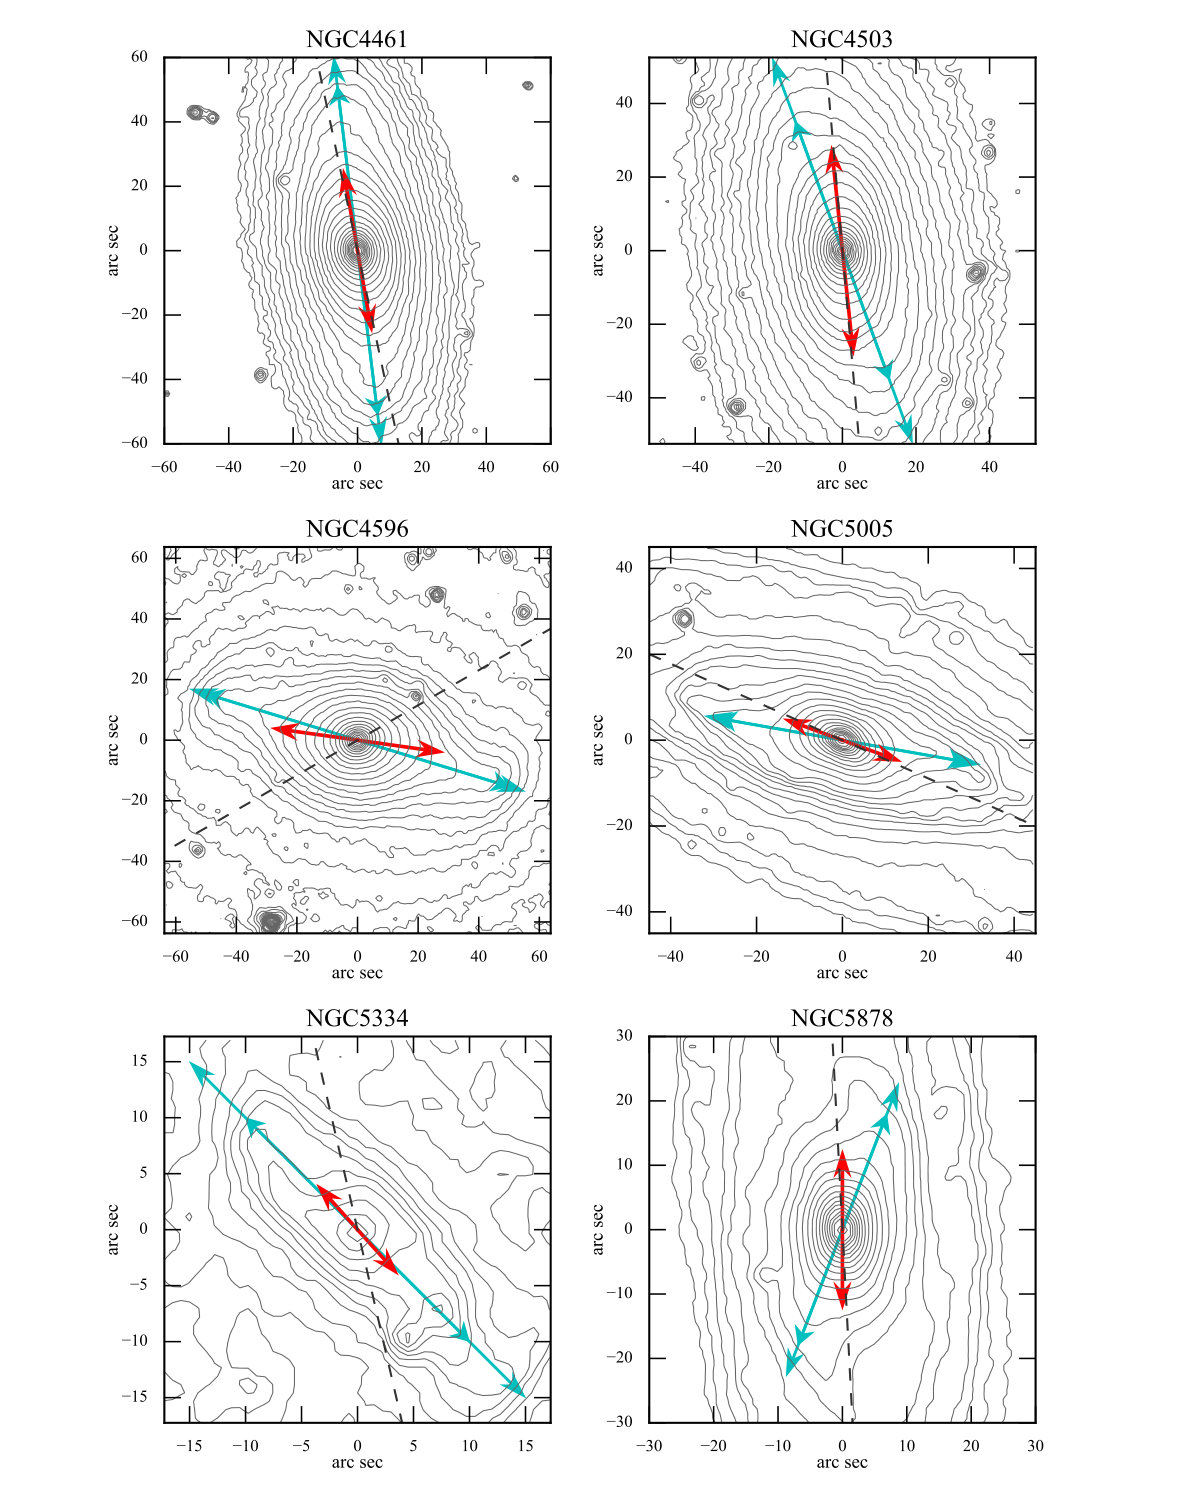 Figure 15
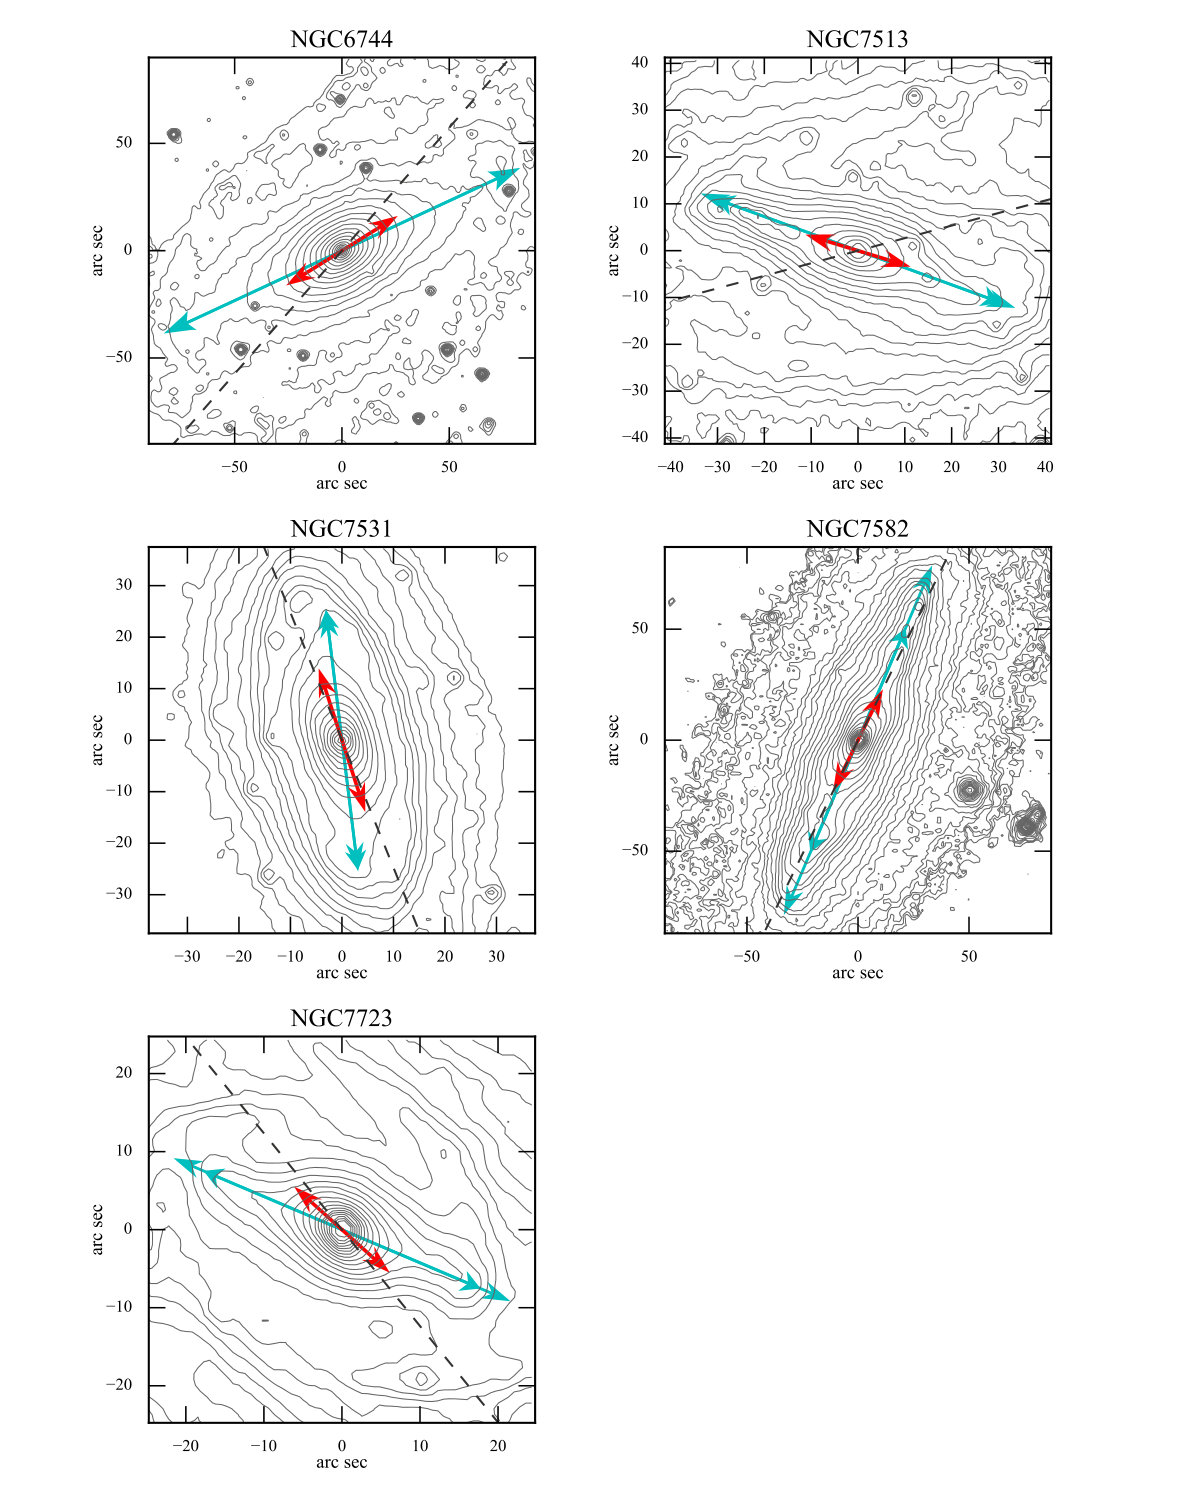 Figure 15
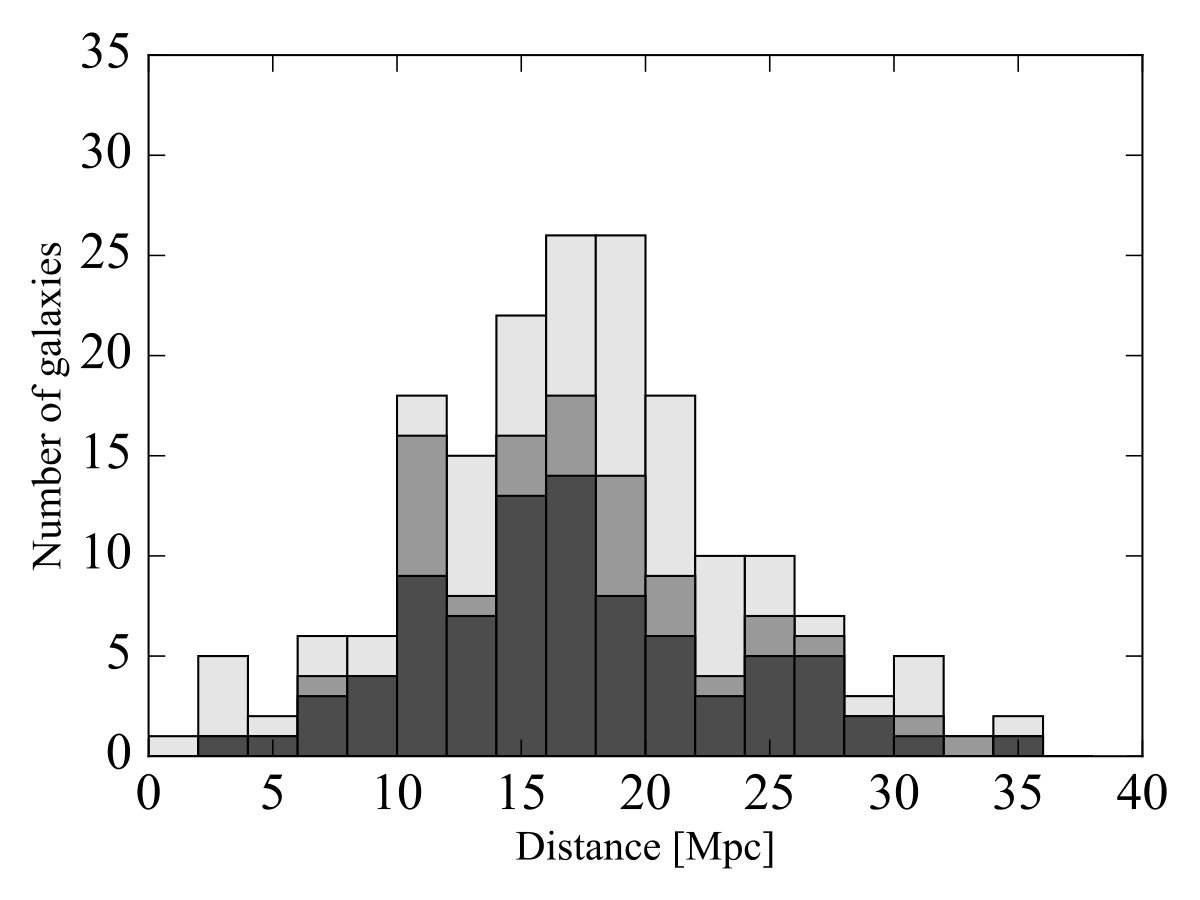 Figure 2
 Figure 3
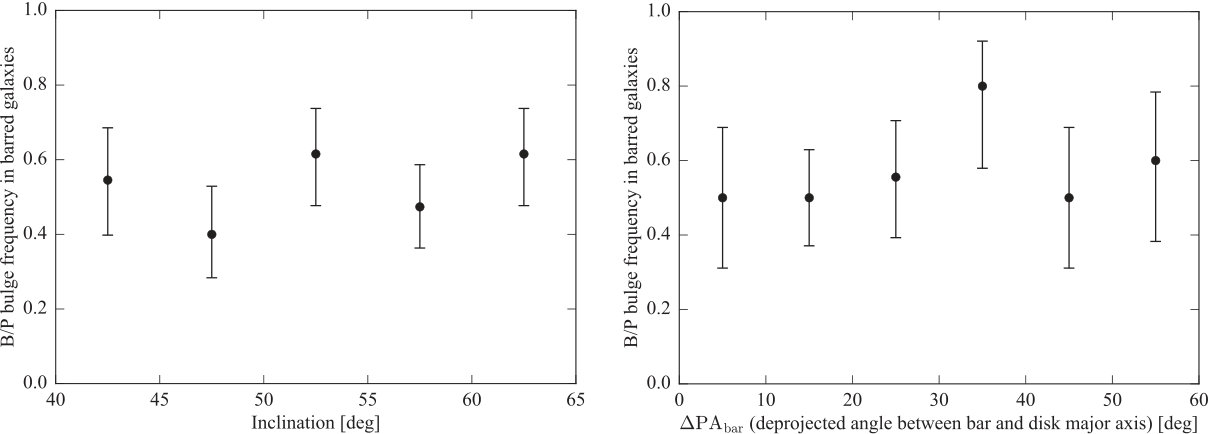 Figure 4
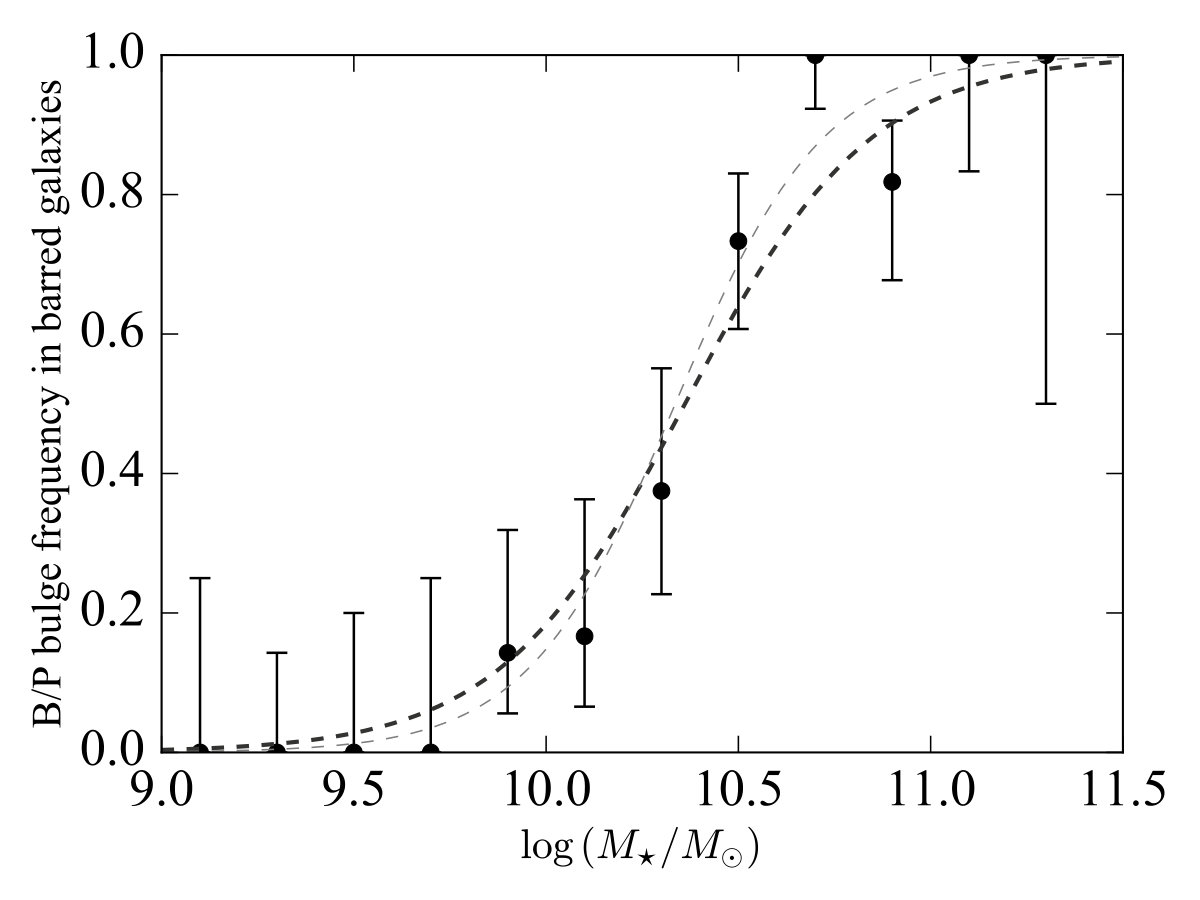 Figure 5
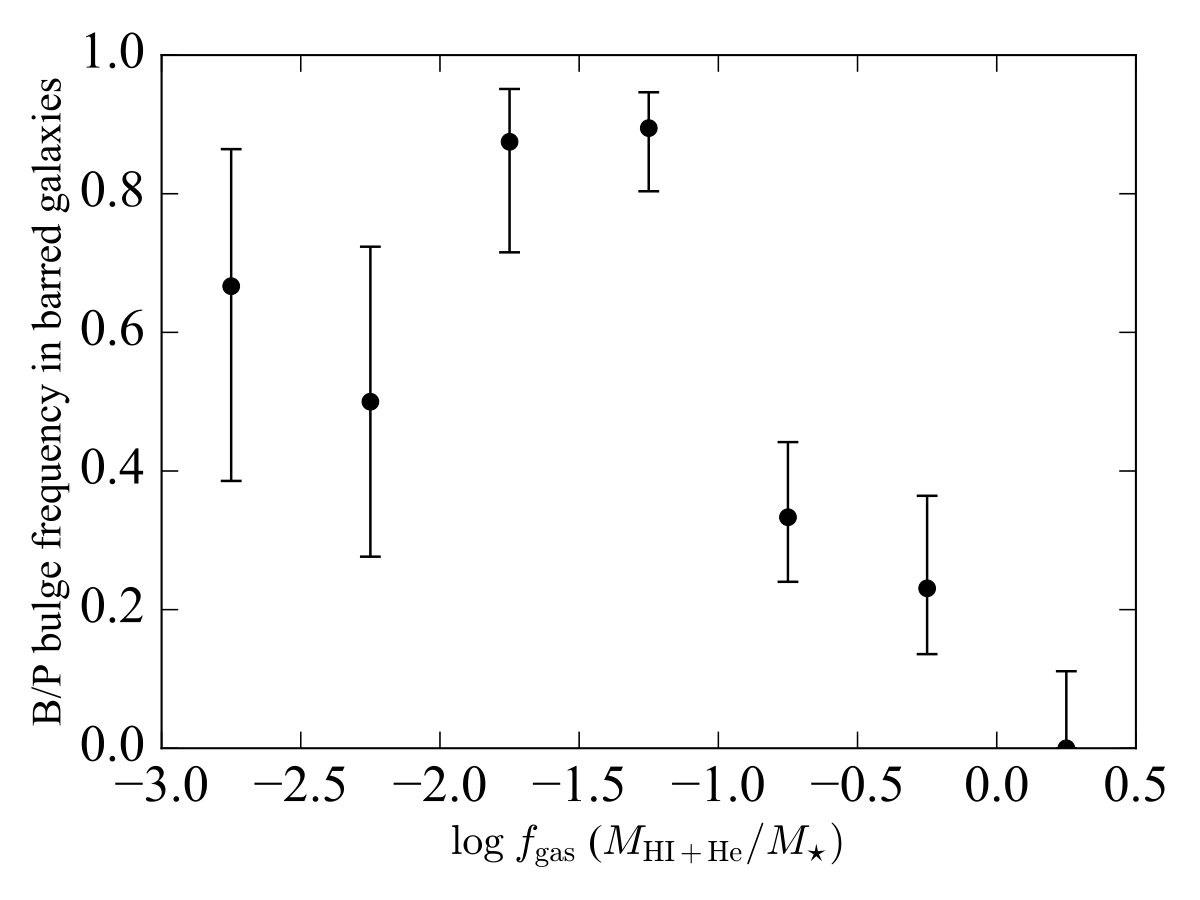 Figure 6
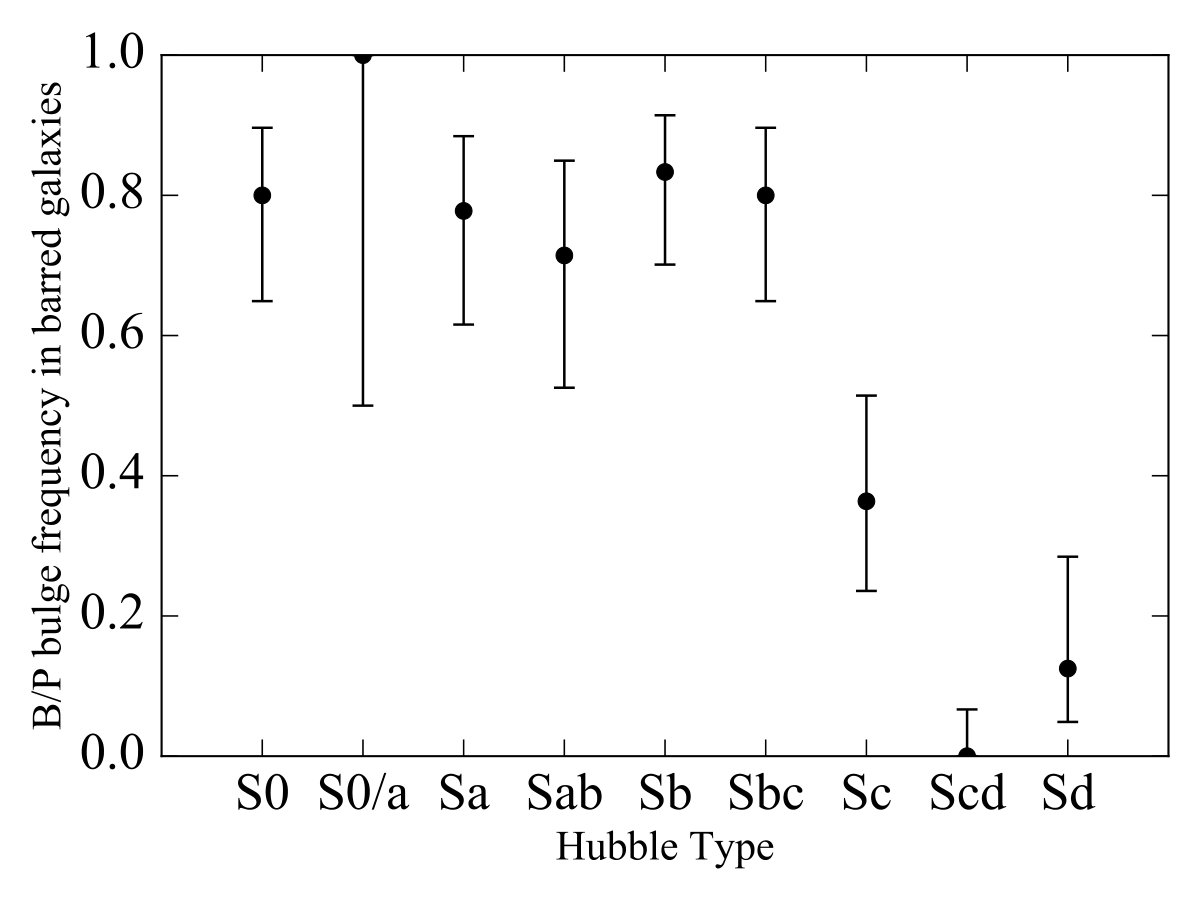 Figure 7
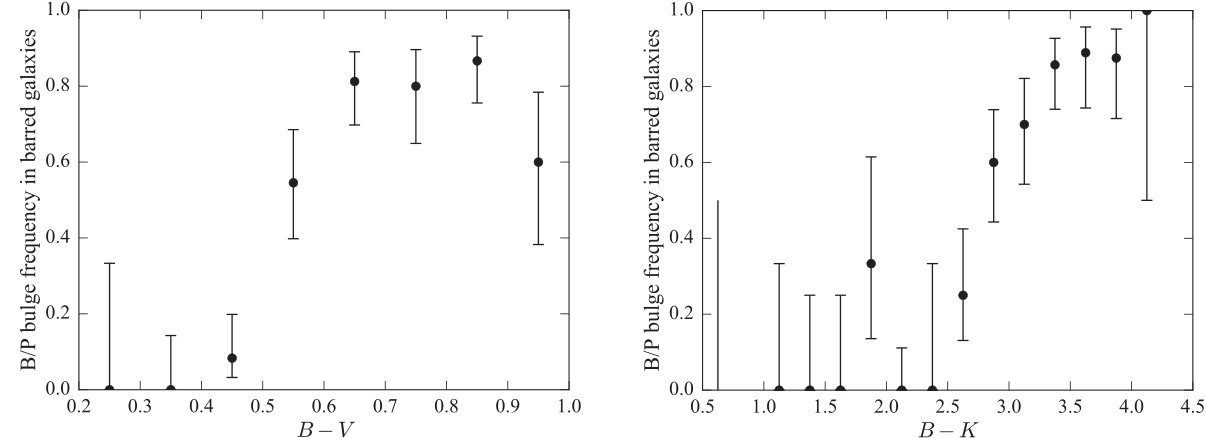 Figure 8
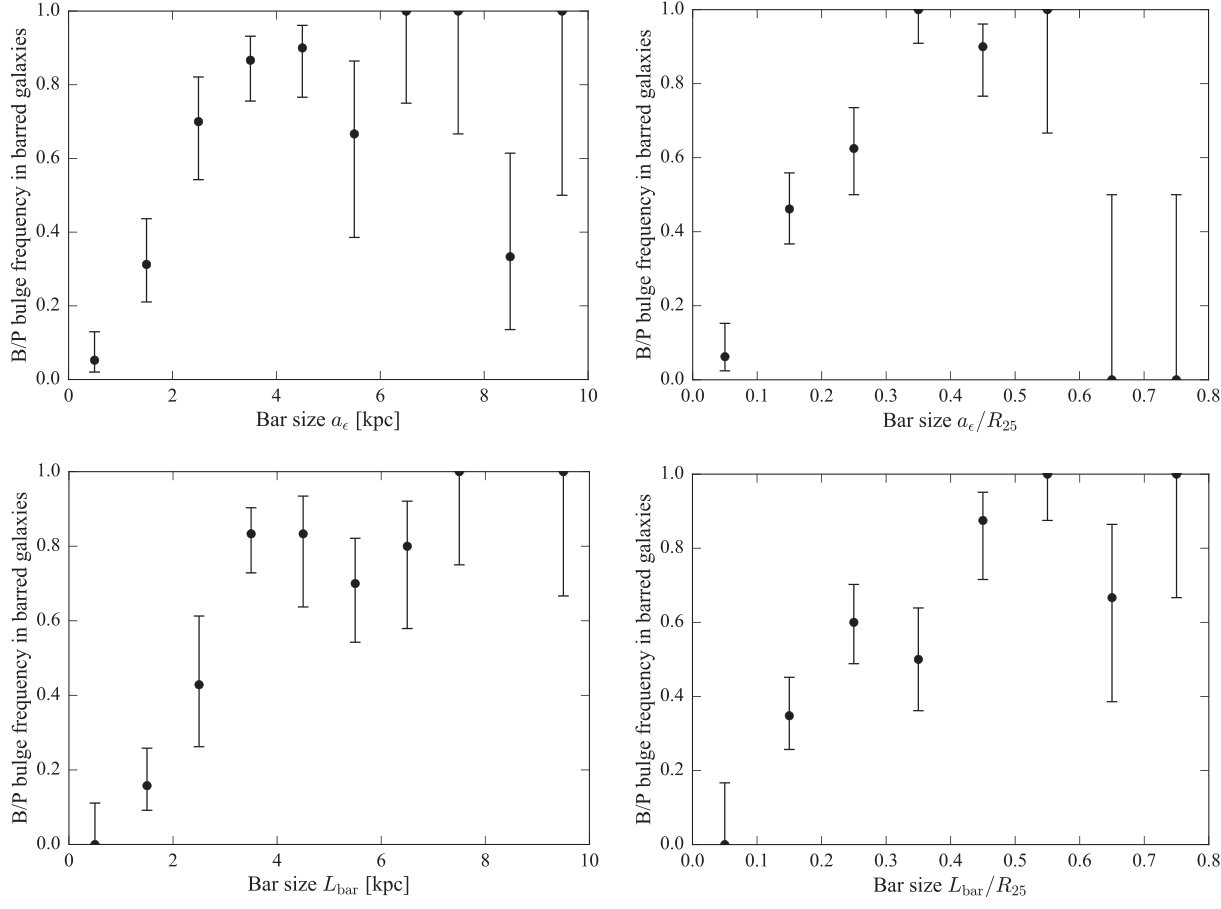 Figure 9
| Name | Bar PA | [dp] | [dp] | [dp] | |||||||
| (°) | (°) | (″) | (kpc) | (″) | (kpc) | (°) | (″) | (kpc) | |||
| (1) | (2) | (3) | (4) | (5) | (6) | (7) | (8) | (9) | (10) | (11) | (12) |
| NGC210 | 19 | 173 | 32.0 | 3.46 | 48.0 | 5.19 | … | … | … | … | … |
| NGC450 | 51 | 42 | 13.0 | 1.37 | 17.0 | 1.80 | … | … | … | … | … |
| NGC578 | 31 | 85 | 17.0 | 1.86 | 21.0 | 2.30 | … | … | … | … | … |
| NGC615 | 11 | 162 | 22.0 | 2.68 | 26.0 | 3.17 | 159 | 11.0 | 1.34 | 0.50 | 0.42 |
| NGC918 | 46 | 6 | 6.5 | 0.64 | 8.3 | 0.82 | … | … | … | … | … |
| Variable | AIC | |||
|---|---|---|---|---|
| (1) | (2) | (3) | (4) | (5) |
| Hubble type | ||||
| [kpc] | ||||
| [kpc] | ||||
| Subsample: galaxies with H i detections | ||||
| Subsample: galaxies with values | ||||
| Subsample: galaxies with values | ||||
| Variable | AIC | |||
|---|---|---|---|---|
| (1) | (2) | (3) | (4) | (5) |
| Hubble type | ||||
| [kpc] | ||||
| [kpc] | ||||
| Subsample: galaxies with H i detections | ||||
| Subsample: galaxies with values | ||||
| Subsample: galaxies with values | ||||
| Comparison | |||
|---|---|---|---|
| (1) | (2) | (3) | (4) |
| Hubble type | |||
| [kpc] | |||
| [kpc] | |||
| [kpc] |
| Name | Type (RC3) | Bar | Distance | Source | PA | Source | Source | ||||
|---|---|---|---|---|---|---|---|---|---|---|---|
| (Mpc) | (°) | (°) | () | () | |||||||
| (1) | (2) | (3) | (4) | (5) | (6) | (7) | (8) | (9) | (10) | (11) | (12) |
| NGC150 | SB(rs)b | Y | 19.70 | 1 | 62 | 117 | 10.39 | 1 | 9.43 | 1 | |
| NGC157 | SAB(rs)bc | N | 12.90 | 2 | 48 | 50 | 10.34 | 1 | 9.25 | 1 | |
| NGC210 | SAB(s)b | Y | 21.60 | 2 | 49 | 160 | 10.53 | 1 | 9.77 | 1 | |
| NGC300 | SA(s)d | N | 2.00 | 3 | 50 | 20 | 9.25 | 1 | 9.29 | 1 | |
| NGC450 | SAB(s)cd | Y | 16.60 | 4 | 56 | 77 | 9.39 | 1 | 9.10 | 1 |
Peer Reviews
No public reviews on file for this paper yet. If you reviewed it on a platform where reviews are public (OpenReview, ICLR, NeurIPS, ICML), you can paste yours below so the community can read it here.
Videos
No videos yet. Explain this paper in a talk, walkthrough, or lecture? Add one.
The Frequency and
Stellar-Mass Dependence of Boxy/Peanut-Shaped Bulges in Barred Galaxies
Peter Erwin1,2 and Victor P. Debattista3
1Max-Planck-Insitut für extraterrestrische Physik, Giessenbachstrasse, 85748 Garching, Germany
2Universitäts-Sternwarte München, Scheinerstrasse 1, D-81679 München, Germany
3Jeremiah Horrocks Institute, University of Central Lancashire, Preston PR1 2HE, UK E-mail: [email protected]
(Accepted XXX. Received YYY; in original form ZZZ)
Abstract
From a sample of 84 local barred, moderately inclined disc galaxies, we determine the fraction which host boxy or peanut-shaped (B/P) bulges (the vertically thickened inner parts of bars). We find that the frequency of B/P bulges in barred galaxies is a very strong function of stellar mass: 79% of the bars in galaxies with have B/P bulges, while only 12% of those in lower-mass galaxies do. (We find a similar dependence in data published by Yoshino & Yamauchi 2015 for edge-on galaxies.) There are also strong trends with other galaxy parameters – e.g., Hubble type: 77% of S0–Sbc bars, but only 15% of Sc–Sd bars, have B/P bulges – but these appear to be side effects of the correlations of these parameters with stellar mass. In particular, despite indications from models that a high gas content can suppress bar buckling, we find no evidence that the (atomic) gas mass ratio affects the presence of B/P bulges, once the stellar-mass dependence is controlled for.
The semi-major axes of B/P bulges range from one-quarter to three-quarters of the full bar size, with a mean of and (where is the size of the B/P bulge and and are lower and upper limits on the size of the bar).
keywords:
galaxies: structure – galaxies: elliptical and lenticular, cD – galaxies: bulges – galaxies: spiral
††pubyear: 2017††pagerange: The Frequency and Stellar-Mass Dependence of Boxy/Peanut-Shaped Bulges in Barred Galaxies–H
1 Introduction
Over the past three decades, various lines of evidence have converged to demonstrate that many bulges in edge-on galaxies are at least partly the vertically thickened inner parts of galactic bars (e.g., Laurikainen & Salo 2016 and Athanassoula 2016, and references therein). This phenomenon appears in the form of bulges with “boxy”, “peanut-shaped”, or “X-shaped” morphologies; we will refer to these generically as boxy/peanut-shaped (B/P) bulges. Most if not all of the Milky Way’s own bulge is now understood to be just such a structure (e.g., Nataf et al., 2010; Shen et al., 2010; Saito et al., 2011; Ness et al., 2012; Wegg & Gerhard, 2013; Wegg et al., 2015; Zoccali & Valenti, 2016; Shen & Li, 2016; Debattista et al., 2017, and references therein).
The formation of bars in -body simulations of galaxy discs is often followed, usually within a Gyr or so, by a violent vertical buckling instability which then settles down into a B/P bulge (e.g., Raha et al., 1991; Merritt & Sellwood, 1994; Debattista et al., 2004; Martinez-Valpuesta & Shlosman, 2004; Martinez-Valpuesta et al., 2006; Debattista et al., 2006; Saha et al., 2013). Direct detection of ongoing buckling in two nearby barred spirals was recently made by Erwin & Debattista (2016). Alternatively, bars may experience slower and more symmetric vertical thickening, via the trapping of disc stars at vertical resonances, again leading to a B/P bulge (e.g., Combes & Sanders, 1981; Combes et al., 1990; Quillen, 2002; Debattista et al., 2006; Quillen et al., 2014). In either case, the result is a bar with a vertically thin outer structure and a vertically thick inner structure; this inner structure is supported by a variety of off-plane orbits, mostly thought to derive from the planar orbits which support bars, though other orbit families may also contribute (e.g., Pfenniger, 1984, 1985; Pfenniger & Friedli, 1991; Patsis et al., 2002b; Portail et al., 2015; Valluri et al., 2016; Abbott et al., 2016). When seen close to end-on (down the long axis of the bar), this structure appears round and is not easily distinguishable from a classical (spheroidal) bulge, but when seen side-on, it appears as a boxy or even peanut-shaped stellar structure; in particularly strong cases the latter can have an X-shape (e.g., Combes et al., 1990; Pfenniger & Friedli, 1991; Lütticke et al., 2000b; Athanassoula & Misiriotis, 2002). At intermediate orientations, the B/P bulge can still form a boxy shape in projection, which is the reason for the shape of our Galaxy’s bulge.
Attempts have been made to connect populations of B/P bulges to populations of bars using edge-on galaxies (Jarvis, 1986; de Souza & Dos Anjos, 1987; Shaw, 1987; Dettmar & Barteldrees, 1990; Lütticke et al., 2000a; Yoshino & Yamauchi, 2015). However, these attempts suffer from the key problem that it is very difficult to determine whether an edge-on galaxy has a (planar) bar. The presence of a B/P bulge can (in most cases, at least) be taken as indicating the presence of a bar; but the absence of a visible B/P bulge may be due to the orientation of the bar, or to a bar lacking a B/P bulge, or to the absence of a bar altogether. Clearly, it would be advantageous to be able to reliably identify B/P bulges in non-edge-on galaxies, where the separate question of whether a planar bar is present can much more easily be answered.
Although the link between bars and B/P bulges was first made with edge-on galaxies, recent studies have shown that B/P bulges can be detected in moderately inclined and even face-on galaxies. Ways of doing this include stellar-kinematic signatures in face-on galaxies (Debattista et al., 2005; Méndez-Abreu et al., 2008) and specific bar morphologies in galaxies with intermediate inclinations (–80°). The advantage of face-on or moderately inclined galaxies is that the B/P bulge can be related to the structure of the bar as a whole, as well as to other structures in the disc.
Early evidence for morphological signatures of B/P bulges in galaxies with inclinations of –80° was presented by Bettoni & Galletta (1994) for NGC 4442 () and Quillen et al. (1997) for NGC 7582 (). Athanassoula & Beaton (2006) compared near-IR images of M31 () with projected -body simulations to argue that much of the (boxy) bulge in that galaxy was due to a bar.
By analyzing -body simulations that formed B/P-bulge-hosting bars, Erwin & Debattista (2013) showed that the projections of bars with B/P bulges created a characteristic morphology in the isophotes of galaxies with –70°. This morphology consists of a thick, often “box”-shaped region, due to the B/P bulge itself, and thinner, offset “spurs” at larger radii due to the outer (vertically thin) part of the bar (as had already been argued by Athanassoula & Beaton 2006 for the case of M31). We also showed how it was possible to relate measurements of the box-shaped region to the linear extent of the B/P bulge along the bar’s major axis, making it possible to estimate the fraction of the bar length which was taken up by the B/P bulge. Finally, we presented two examples of galaxies with both strong bars and ideal orientations for detecting B/P bulges which did not show the signatures of B/P bulges, but instead strongly resembled simulations with flat, unbuckled bars. This last result shows how it is possible to identify bars without B/P bulges.
Detection of B/P bulges in face-on galaxies (e.g., ) is also feasible using stellar-kinematic signatures (Debattista et al., 2005; Méndez-Abreu et al., 2008; Iannuzzi & Athanassoula, 2015), though this does require expensive spectroscopic observations. Laurikainen et al. (2014) and Athanassoula et al. (2015) have shown that it is also possible to identify B/P bulges in face-on galaxies using the “barlens” morphological feature (Laurikainen et al., 2011).
It is thus now possible to survey galaxies with low or moderate inclinations to determine whether they have B/P bulges or not, to measure the sizes of B/P bulges, and to relate B/P bulges to their parent bars and host galaxies. This makes it possible to address a number of questions: How important are B/P bulges in the larger scheme of galaxy morphology? What fraction of bars produce B/P bulges? (Do all bars have B/P bulges?) If some bars have them and some do not, what if anything about the galaxy determines this? Is it unusual for a galaxy like our own to have a B/P bulge, or is our galaxy typical in this respect? In addition, by having an unbiased set of measurements of B/P bulge sizes relative to their parent bars, we can potentially place constraints on both their structure – which sets of 3D orbits actually support B/P bulges – and their formation mechanisms.
2 Sample Definition
Our sample selection is dictated partly on our preferred approach for identifying and measuring B/P bulges (see Appendix A), which requires galaxies with moderate inclinations: neither edge-on nor too close to face-on. We defined an initial sample by selecting all galaxies from the RC3 catalog (de Vaucouleurs et al., 1993) which met the following criteria: Galactic latitude , km s*-1*, Hubble types S0–Sd (), diameters , and estimated inclinations (based initially on 25th-magnitude axis ratios) of 40°–70°. We also included galaxies with Virgo Cluster Catalog (Binggeli et al., 1985) entries with km s*-1*, since the high velocity dispersion of the Virgo Cluster makes a redshift cutoff less meaningful. The purpose of these criteria was to select galaxies with large, well resolved bars which had favourable orientations for identifying B/P bulges (Erwin & Debattista, 2013). We excluded a total of 53 galaxies for a variety of reasons: having inclinations clearly outside the required range, despite their RC3 axis ratios (based on, e.g., ellipse fits to publicly available images, velocity-field studies from the literature, etc.); being strongly distorted due to ongoing interactions or mergers; misclassifications; absence of useful imaging or photometric data; etc. (See Appendix F.) The final parent sample (“Parent”) included 186 galaxies; these are listed in Table 5.
These 186 galaxies were visually inspected, using near-IR images whenever possible, for the presence of bars. We identified 118 galaxies with bars, for a total barred fraction of % (binomial 68% confidence intervals); this constitutes our “Barred” subsample. (Three galaxies with small “nuclear bars” but no large-scale bars – NGC 1201, NGC 1553, and NGC 5194 – were rejected; see Appendix E.)
Finally, we identified a subset of the barred galaxies where the bar orientation (measured using a combination of ellipse fits and visual inspection) was most favourable for identifying projected B/P structures. Specifically, this meant galaxies where the in-plane (deprojected) position angle of the bar was away from the galaxy major axis (). This is critical for maximizing our ability to detect B/P bulges, since projected B/P bulges are difficult to identify when the bar is oriented near the minor axis (Erwin & Debattista, 2013). This produced a final “good-position-angle” (GoodPA) sample of 84 galaxies, which was the basis for our search for B/P bulges.
2.1 Sample Characteristics
In Figures 2–3 we show distributions of sample properties for the Parent sample and the two subsamples (Barred and GoodPA). Most of the galaxies are found at distances Mpc (median distance = 16.9 Mpc). The sample is weighted towards relatively massive galaxies (median ).
The figures indicate that the two subsamples are not meaningfully biased relative to their parent samples: that is, the barred galaxies do not differ significantly from the parent sample, and neither do the barred galaxies with favourable bar position angles. Kolmogorov-Smirnov and Anderson-Darling two-sample tests find no evidence for differences in stellar mass between the barred and unbarred galaxies, or between the barred galaxies with good bar position angles and the other barred galaxies for either stellar mass or distance ( values ranging from 0.11 to 0.95).
2.2 Data Sources
The data used for this project are of two types: optical or near-IR images, which we use for detecting and measuring bars and B/P bulges, and general physical parameters for the galaxies – distances, stellar masses, and colors, gas mass fractions (), and bar sizes – which we use for investigating how the presence or absence of B/P bulges might depend on galaxy properties. Further details on the data sources and derived quantities are given in Appendix B.
3 The Identification and Measurement of B/P Bulges
Our basic approach for identifying B/P bulges inside bars is that originally outlined in Erwin & Debattista (2013) and in the last part of Appendix A. This approach is based on the fact that a bar which is vertically thin in its outer regions and vertically thick in its interior produces a characteristic pattern in the isophotes when viewed at intermediate inclinations: the B/P bulge projects to form relatively thick, oval or box-shaped isophotes (the “box”), while the outer part of the bar projects to form thinner, offset isophotes (the “spurs”). Because of this offset, the position angle of the spurs is always further away from the galaxy major axis than that of the box/oval. When the bar does not have a vertically thick interior, it projects instead to aligned, elliptical isophotes without the box + spurs morphology.
Figure 1 presents examples of the box + spurs morpholgy in the upper three rows and examples of bars without B/P bulges in the bottom row; more examples can be found in Erwin & Debattista (2013). For most of our analysis, we classify the two galaxies with currently buckling bars (NGC 3227 and NGC 4569; Erwin & Debattista, 2016) as not having B/P bulges, though we identify them as a separate category in some of our figures.
3.1 Efficiency and Completeness Estimates (Are We Missing Many B/P Bulges?)
As we showed in Erwin & Debattista (2013), the detectability of B/P bulges depends strongly on the inclination of a galaxy. Galaxies too close to face-on lack the projected difference between the vertically thick B/P bulge and the vertically thin outer bar. When galaxies are too highly inclined, it becomes difficult to discern the bar as a whole (particularly the outer part) and to distinguish it from projected rings, spiral arms, etc.
For galaxies with favourable inclinations, the position angle of the bar with respect to the line of nodes – that is, the observed major axis of the galaxy disc – is also important. Figures 5 and 6 of Erwin & Debattista (2013) show that as the position angle of the bar approaches the galaxy minor axis, the projection of the B/P bulge and its contrast with the projected outer bar (the spurs) becomes steadily weaker and more ambiguous. An additional problem is that extra axisymmetric structures inside the bar (classical bulges, disky pseudobulges/nuclear discs, nuclear rings) may overlap with the projected B/P bulge when the bar is close to the minor axis (see, e.g., Figs. 15–17 in Cole et al., 2014). A lesser ambiguity may arise if the bar is very close to ( from) the major axis, because then the spurs are no longer visibly offset from the axis of the inner bar or the disc major axis.
In this study, we adopted an inclination range of 40–70° and a relative bar-disc position-angle limit of . Was this too generous? In other words: is there evidence that we are missing B/P bulges at inclinations near the lower or upper ends of the inclination range, or at particularly large (or small) values of bar? To check this possibility, we plot in the left panel of Figure 4 the fraction of barred galaxies with detected B/P bulges as a function of galaxy inclination. There are no apparent trends in this figure, which suggests that we are not missing significant numbers of B/P bulges at either end of our inclination range. The right panel of Figure 4 indicates that our limits are probably not biasing our results, either – in particular, our upper limit of does not seem to have been too high.
3.2 Measuring B/P Bulge Sizes
To estimate the sizes of B/P bulges, we follow the same approach used in Erwin & Debattista (2013): measuring the linear extent of the box/oval along its major axis (), along with its position angle (). In that paper, we showed that such measurements did a reasonably good job of capturing the radial extent of the B/P bulge, as measured from edge-on projections of -body simulations (see Section 3.2 and Fig. 8 of Erwin & Debattista 2013).
Bar and B/P measurements are collected for all galaxies in the GoodPA subsample in Table 1. Visual indications of both and for galaxies with new B/P detections (and galaxies previously identified but not previously measured) are shown in Figure 15. In Section 5, we compare our measurements with other measurements of B/P bulge sizes from the literature for the same galaxies and find generally good agreement.
4 How Common Are B/P Bulges, and Which Galaxies Have Them?
In our GoodPA sample (84 barred galaxies), we find a total of 44 B/P bulges, for an overall B/P fraction of . We also find two galaxies with bars currently in the buckling stage (Erwin & Debattista, 2016), for a buckling fraction of . This leaves us with a “thin-bar” fraction of .
However, our sample is clearly biased (by our diameter limit, if nothing else) towards rather large, massive galaxies, so it is by no means clear that this B/P fraction of % applies to all barred galaxies. In the rest of this section, we investigate to what extent the presence or absence of B/P bulges in bars depends on different galaxy parameters. We are particularly interested in the gas mass fraction, since at least some simulations have suggested that a high gas fraction in the disc should suppress buckling (see references in Section 2.2).
4.1 Trends with Galaxy Parameters: Logistic Regression
How the B/P fraction depends on different parameters can be seen in Figures 5–9, where we plot B/P fraction against galaxy stellar mass, gas mass fraction, Hubble type, and colours, and bar size. We can see what appear to be strong trends with all the plotted parameters. Figure 5 shows that more massive galaxies are more likely to have B/P bulges, with a strong transition at around . Figure 6 shows a somewhat weaker trend with gas mass fraction, in that galaxies with high gas fractions are less likely to have B/P bulges – or at least B/P bulges are clearly less likely to be seen in galaxies with and are not seen at all in galaxies with . Figure 7 suggests that the B/P fraction is roughly constant at around % for Hubble types S0–Sbc, and then drops abruptly to very low values for types later than Sc. Figure 8 shows strong trends with galaxy colour, in the sense that redder galaxies are more likely to host B/P bulges. Finally, Figure 9 shows that galaxies with small bars are less likely to have B/P bulges, although the case for very large bars is ambiguous.
To quantify the apparent trends – and measure their statistical significance – we turn to logistic regression, which involves modeling data with a function for the probability for a binomial property (in our case, presence or absence of a B/P bulge):
[TABLE]
where is the probability for a galaxy to have the particular property and is the independent variable. The function ranges between 0 and 1, as appropriate for modeling a probability. We use the standard maximum-likelihood-based implementation in R111www.r-project.org to determine the best-fitting parameters. (Note that logistic regression involves fitting all the individual data points; it is not a fit to binned values, such as those plotted in Figures 5–9, and thus is not biased by any details of a particular binning scheme.)
The R program also calculates the Akaike Information Criterion (AIC; Akaike, 1974):
[TABLE]
where is the likelihood of the model and is the number of data points. The AIC value has no meaning in and of itself, but values from fits of different models to the same data can be used in a model-comparison fashion, with lower values of AIC indicating better relative agreement between model and data. In practice, differences of are ignored, differences of 2–6 are weak evidence in favour of the model with lower AIC, and differences are considered strong evidence in favour of the model with lower AIC.
Table 2 shows the result of our logistic fits for – i.e., the fraction of barred galaxies with B/P bulges – as a function of , gas mass fraction , Hubble type , and colours, and both relative and absolute bar size (bar size as a fraction of and bar size in kpc). The value is the probability of obtaining a trend as strong as the observed one under the null hypothesis of , and can be used as guide in determining whether the trend is statistically significant or not. We break the comparisons into different subsamples, depending on whether the appropriate data is available for individual galaxies: all galaxies (, , bar sizes), and subsamples for galaxies with detected H i and measured colours. (Because the fit is by far the best for the full sample, we also show fits for the limited-data subsamples, since AIC values can only be compared for fits to the same data sets.)
What Table 2 demonstrates is that the probability of hosting a B/P bulge can be modeled with some success as a function of each of the galaxy parameters we tested. Given the visual trends in Figures 5–9, this is not surprising, though the small values of ( in all cases) are evidence that these trends are probably not statistical flukes. The AIC values suggest that best individual model, by a clear margin, is the dependence on stellar mass; this model is plotted in Figure 5. (We also show what the fit looks like if we temporarily count the two buckling-bar galaxies – NGC 3227 and NGC 4569 – as actually having B/P bulges.) We can use this to define a “transition mass”: the stellar mass for which the B/P fraction is 50%. This happens for .
4.2 Multiple Variables and the Primacy of Stellar Mass
As noted above, we find evidence for trends in B/P-bulge frequency with all the galaxy parameters we examined; the strongest such case is for stellar mass. Since the other independent variables in Table 2 are generally known to be strongly correlated with (e.g., Catinella et al., 2010, 2013, for and ; see also Figure 10), it is worth exploring whether the presence of B/P bulges depends on any of these properties independently of the correlation. For example, if we hold stellar mass fixed, does varying Hubble type or affect the B/P fraction?
We explore these questions in three ways:
Logistic regression with multiple parameters; 2. 2.
Matched-pair analysis; 3. 3.
Comparative plots.
4.2.1 Multiple Logistic Regression
The logistic equation for multiple independent variables is a generalization of the standard logistic equation:
[TABLE]
where the are the different variables (e.g., stellar mass, colour, Hubble type, etc.).
The results of our two-variable logistic regression analysis are displayed in Table 3. These show that in every single case, stellar mass is the most – or indeed only – significant variable. The second variable has a marginally statistically significant effect only in case of colour ( or ). One can also see that in every case, the AIC values for the multivariable fits are either indistinguishable from or higher than the AIC values for the single-variable fits (using the same subsamples) which use just (Table 2). In particular, the fit using just is favoured over fits using both and colour (either or ), with for the two-variable fits using colour.
We conclude that while there is perhaps tentative evidence for a dependence on galaxy colour (i.e., at the same stellar mass, redder galaxies are more likely to have B/P bulges), the main result is the clear dominance of stellar mass: whether a barred galaxy has a B/P bulge or not is determined primarily – indeed, almost entirely – by its stellar mass.
4.2.2 Matched-Pair Analysis
The limitation of logistic-regression analysis is that it assumes a sigmoid relation between the probability of the binary variable and the independent variable – that is, is either monotonically increasing or monotonically decreasing with . A more complicated relation will not be well fit by the logistic function. Although Figure 5–9 indicate that most of the relations between B/P-bulge presence and variables such as , , colour, and Hubble type are approximately monotonic, it is worth exploring alternate, less model-dependent approaches to finding evidence for secondary correlations.
A more model-independent way of testing for secondary correlations is with a matched-pair analysis. This involves dividing a sample into two subsamples based on the characteristic of interest (e.g., whether or not the galaxy has a B/P bulge). Then each galaxy in the first subsample (e.g., B/P-present) is paired with a random galaxy from the other subsample (e.g., B/P-absent) which matches the first galaxy on some particular parameter (e.g., stellar mass) within some tolerance. This is repeated until all the galaxies in the first subsample have matches, or until no more possible matches are left in the second subsample. (If a randomly selected galaxy from the second subsample does not match within the specified tolerance, another galaxy is selected. If this fails after 2000 attempts, the galaxy from the first subsample is discarded.) The result is an approximation of matched test and control samples, with similar distributions in the matching parameter. We can then compare values of a second, “comparison” parameter (e.g., ) between the two subsample. We do this using the Kolmogorov-Smirnov and Anderson-Darling two-sample tests. Because selecting random matching pairs can introduce statistical fluctuations and thus produce potentially misleading results, we repeat each analysis 200 times and record the median values from the statistical tests (and also the median values for the inter-pair differences in the comparison parameter.)
Since our primary interest is in looking for possible trends apart from the clear (and strongest) one with stellar mass, we ran the matched-pair analysis by matching galaxies by stellar mass, with a tolerance of 0.1 dex in the log. The results of this analysis are summarized in Table 4. Although many of the comparison parameters are correlated with each other and thus not independent (e.g., and colours are strongly correlated, as are bar sizes), we should still be wary of the multiple-comparisons trap: the fact that running multiple tests using different parameters increases the odds of generating a “statistically significant” result purely by chance. Accordingly, we suggest that the only genuinely significant results from this analysis may be those for Hubble type and (absolute) bar size.
Specifically, we find that for barred galaxies with similar masses, B/P hosts tend to be about one Hubble stage earlier. Since Hubble type is based partly on the degree of central concentration in a galaxy, and since B/P bulges tend to be centrally concentrated structures (e.g., Debattista et al., 2004; Athanassoula et al., 2015), it is possible that this secondary Hubble-type correlation (earlier Hubble types are more likely to host B/P bulges) is a side effect of B/P bulge formation: that is, the presence of a B/P bulge biases the Hubble type classification to earlier types. There may also be secondary correlations with absolute bar length, in the sense that for galaxies of similar mass, the B/P-bulge hosts will tend to have longer bars (in the median, the difference is slightly less than a kpc in both and ).
4.2.3 Comparison Plots
In Figure 10 we plot different galaxy parameters versus stellar mass for the GoodPA sample. We code the galaxies by whether they have bars with B/P bulges (black squares) or whether they have bars without them (red circles); we also show the two buckling bars (Erwin & Debattista, 2016) using cyan stars. Although hints of weak trends between the presence of B/P bulges and other parameters can sometimes be seen – e.g., for –10.5, galaxies with B/P bulges tend to be redder than galaxies without – it is clear that the strong dependence of B/P presence on stellar mass dominates in all plots.
4.2.4 Summary
The clearest lesson from the various statistical (and graphical) analyses in this section is that B/P bulge presence in barred galaxies depends strongly – indeed, almost entirely – on the stellar mass of the galaxy: more massive galaxies are more likely to have B/P bulges. As we have seen, there are also clear trends with, e.g., Hubble type, colour ( and ), and bar size; but these can mostly if not entirely be explained as side effects of the correlations of those parameters with stellar mass. There is only weak evidence for additional, independent correlations of B/P presence with Hubble type (earlier Hubble types are more likely to have B/P bulges) and possibly with bar size (longer bars are more likely to have B/P bulges). Larger samples with more galaxies in the stellar mass range of –10.5 are probably necessary in order to determine if these secondary correlations are real.
5 How Large Are B/P Bulges?
We measure the approximate sizes of B/P bulges as we did in Erwin & Debattista (2013): the half-length of the boxy region, measured along its apparent major axis. (In practical terms, we measure the full visible extent of the main boxy region on logarithmically scaled images.) By performing measurements on projections of -body simulations with orientations similar to those of real galaxies, we were able to show in that paper that was a reasonable estimate for the radial extent of the B/P bulge as measured from edge-on views of the same simulations (see Fig. 8 of Erwin & Debattista 2013). The measurements of and (the observed position angle of the B/P major axis) are listed in Table 1; we also list the deprojected values of in kpc. Appendix C shows isophote contours of individual galaxies with and indicated.
By combining the sample in this paper with the measurements presented in Erwin & Debattista (2013), we find a total of nine galaxies which also have “barlens” sizes reported in Laurikainen et al. (2011); as shown by Laurikainen et al. (2014) and Athanassoula et al. (2015), the barlens feature is another way of talking about the projected B/P bulge. The mean size ratio of our measurements and theirs for the galaxies in common is , where is the radial size reported by Laurikainen et al. (2011). This is encouraging evidence that the two different approaches are identifying and measuring the same structures, and that the different measurements of B/P bulge size are not systematically biased (although the large scatter indicates that measurements for individual galaxies may not agree well).
On the other hand, a similar comparison for thirteen galaxies with barlens measurements in Herrera-Endoqui et al. (2015) yields . It seems that the Herrera-Endoqui et al. sizes are systematically larger than other measurements: for 23 galaxies in common between Herrera-Endoqui et al. (2015) and Laurikainen et al. (2011), the Laurikainen et al. barlens sizes are generally smaller (mean size ratio ).
Our sizes are generally larger than the “X-shape” sizes reported by Laurikainen & Salo (2017) for sixteen galaxies which are in our sample or in Erwin & Debattista (2013), as shown in Figure 11. The mean ratio is , where is the measurement of the X-shape. We note that their X-shape sizes are also systematically smaller than their barlens sizes (e.g., their Fig. 8). Although they argue for a slight difference in Hubble types between galaxies with barlenses and those with X-shapes, the difference between our measurements and theirs for the same galaxies suggests that the X-shape is on average systematically smaller than the full B/P bulge size, consistent with the idea that the X-shape represents substructure within the overall B/P bulge rather than an alternative to it.
In linear terms, in our sample ranges from pc to 4.6 kpc, with a mean of kpc (median = 2.0 kpc). But a more interesting question is probably: how large are B/P bulges relative to the bars they live in (and formed out of)? This is important for understanding the structure and underlying orbital skeletons of B/P bulges, since different 3D orbit families can extend to different fractions of the bar length (e.g., Patsis et al., 2002b; Patsis & Xilouris, 2006; Portail et al., 2015).
Columns 11 and 12 of Table 1 list the (deprojected) relative sizes of the B/P bulges, using both of our bar measurements ( and ). Figure 12 shows histograms of B/P size relative to their host bars. The first histogram (grey bars) uses the lower-limit measurement of bar size; the second (blue bars) uses the upper limit measurement, and is the same as we used for a smaller sample of B/P bars in Erwin & Debattista (2013). The mean sizes are (median = 0.54) and (median = 0.43), respectively. This compares with mean (median = 0.37) noted by Erwin & Debattista (2013) for their full sample of 24 galaxies; their subset of 15 galaxies with and had (median = 0.43), which is essentially identical to our findings here. The larger sample afforded by this paper222Note that the samples are not entirely independent: six of the B/P-host galaxies in this paper’s sample are in the earlier sample of Erwin & Debattista (2013). does allow us to see a broader spread in , which can be as small as 0.25 and as large as 0.76 (versus a maximum of 0.58 seen by Erwin & Debattista 2013).
As we pointed out in Erwin & Debattista (2013), roughly equivalent measurements based on near-IR imaging were reported for six edge-on galaxies by Lütticke et al. (2000b). The inversion of their “BAL/BPL” measurements yields , assuming that their bar-length measurements are actually of bars and not, e.g., rings or lenses. This is entirely compatible with our relative sizes, especially when the upper-limit bar size is used.
Athanassoula et al. (2015) reported mean relative B/P bulge sizes for 28 moderately inclined galaxies from Laurikainen et al. (2011), where the B/P bulges were identified from the “barlens” morphology. Their Fig. 6 shows a histogram of relative sizes ( divided by bar length), with an apparent median of ; this is consistent with our measurements.333Athanassoula et al. (2015) do not mention which of the three bar-size measurements reported for each galaxy in Laurikainen et al. (2011) were used in determining the relative sizes.
Do the relative sizes of B/P bulges correlate with any galaxy parameters? We have checked for possible correlations with the global galaxy properties , , Hubble type , and colour, as well as possible correlations with absolute and relative bar size (bar size in kpc or as a fraction of ). We find no evidence for clear correlations with any of these properties, though occasional individual correlations appear. For example, we find Spearman and for versus – but since this becomes and for , we do not consider this good evidence for a correlation between relative B/P size and galaxy colour. We note that Herrera-Endoqui et al. (2015) looked at the relative sizes of barlenses in their S4G-based sample and found no significant correlation with stellar mass either.
The only hint of a possible correlation is with Hubble type, in the sense that S0s appear to have slightly smaller relative B/P sizes than spirals, with from the Anderson-Darling two-sample test (but only for the K-S test). However, this correlation is only significant when is used; the difference mostly vanishes when when is used instead (mean for S0 versus 0.42 for Sa–Sbc; Anderson-Darling ). Since we have tested nine different possible correlations for each of and , finding a marginally significant correlation purely by chance is a serious possibility. Furthermore, Fig. 10 of Herrera-Endoqui et al. (2015) shows a slight increase in relative size for barlenses in S0s, which is additional evidence against there being a significant decrease in relative B/P sizes for S0s. Our conclusion is that there is no real evidence for a correlation between relative B/P size and any of the galaxy properties we have considered.
6 Discussion
6.1 Comparisons with Edge-on Studies
Previous attempts to estimate the frequency of B/P bulges have focused on edge-on galaxies, and have generally used photographic-plate data. The earliest such attempt was probably that of Jarvis (1986), who estimated an overall frequency of only 1.2% for all disc galaxies. However, as Shaw (1987) pointed out, the majority of the sample was small in angular size, and resolution effects probably imposed strong limitations on the detectability of B/P bulges.
Shaw (1987), using a sample of 117 visually edge-on galaxies with diameters , found that % of the galaxies had evidence for B/P bulges; he noted that this was almost certainly a lower limit, since some additional galaxies in the sample had B/P structures which showed up in, e.g., unsharp masking but not in the main analysis. He also found that B/P bulges were more common in early and intermediate Hubble types (S0–Sbc). Using a larger (but not diameter-limited) sample of 555 galaxies with axis ratios of (), de Souza & Dos Anjos (1987) reported a B/P fraction of 13%; they found that the frequency was highest in S0 galaxies (33%) and lowest for Sc galaxies (3%).
If we naively assume that our sample is similar (e.g., in stellar-mass distribution) to the samples of Shaw (1987) and de Souza & Dos Anjos (1987), then we would predict a maximum edge-on fraction of % (using our bar fraction of 63% and the total B/P fraction of 52%). Given that some fraction of edge-on B/P bulges will escape detection when the bars are close to end-on, the results of Shaw (1987) are plausibly consistent with ours. Those of de Souza & Dos Anjos (1987) are not, but the fact that they included many galaxies with intermediate inclinations and small diameters may explain the lower frequency they found. In both cases, the evidence for higher fractions for earlier Hubble types is consistent with our findings (e.g., Figure 7).
The largest photographic-plate analysis is that of Lütticke et al. (2000a, hereafter L00), who classified images of 1224 mostly edge-on S0–Sd galaxies. For 734 galaxies they were able to classify the bulges into four general types: “peanut-shaped” (type 1), “box-shaped” (type 2), “close to box-shaped” (type 3), and “elliptical” (type 4); most of the unclassified bulges were cases of galaxies not close enough to edge-on or else contaminated by bright stars. For the classified bulges, they found that 45% were types 1–3, which they considered signatures of B/P bulges. Since some of their type 4 bulges would presumably include B/P bulges in end-on bars, the real frequency would be higher. (Similar results were found for a much smaller sample by Dettmar & Barteldrees 1990.)
The B/P fraction reported by L00 is clearly higher than what we find. The most dramatic difference is in the later Hubble types: L00 reported B/P bulges at a roughly constant frequency as a function of Hubble type, including 40% for their Sd galaxies. This disagrees strongly with our finding (and those of earlier studies) that B/P bulge frequency drops sharply for late-type spirals: only % of the barred Sd galaxies in our GoodPA subsample have B/P bulges, which implies a B/P frequency of % for all Sd galaxies (given a bar fraction of % for all Sd galaxies in our parent sample). This discrepancy is difficult to explain, unless the L00 sample is somehow biased toward high stellar masses, or else if there are systematic differences between the edge-on and face-on Hubble-type classifications for later-type spirals. Another possibility is that their high B/P fraction is evidence for B/P-like structures in unbarred galaxies, as suggested by Patsis et al. (2002a).
The most recent attempt to estimate B/P-bulge fractions in edge-on galaxies is that of Yoshino & Yamauchi (2015), who identified B/P bulges by performing 2D Sérsic + exponential image decompositions of edge-on galaxies using SDSS DR7444Sloan Digital Sky Survey Data Release 7 (Abazajian et al., 2009). images and then examined the residuals for patterns characteristic of a boxy or peanut-shaped bulge. (They carried out a somewhat similar analysis on a separate sample of face-on galaxies in order to estimate the overall bar fraction.) They found a B/P-bulge fraction of % for edge-on galaxies in the -band. This is almost identical to the Shaw (1987) result, and is plausibly consistent with our results, but disagrees with the high fraction of L00. Yoshino & Yamauchi also concluded that about half of bars have B/P bulges, which is in fact what we find for our sample.
6.2 Evidence for the B/P Bulge– Correlation in
Data from Other Studies
We have found a strong correlation between the presence of B/P bulges in barred galaxies and the stellar mass of the galaxy (Section 4). Is there any evidence for this correlation in edge-on galaxies? We explore this question by looking at the largest and most recent edge-on study, that of Yoshino & Yamauchi (2015), which has the advantage of having reasonably accurate stellar masses available for almost all their galaxies.
We started with their -band edge-on subsample and restricted it to galaxies with redshifts between 0.01 and 0.1 (we chose the -band because, as Yoshino & Yamauchi note, it minizes dust obscuration, which is especially important for edge-on galaxies); this yielded a sample of 1244 edge-on galaxies. We then matched these with the photometry-based stellar masses for the same galaxies from the MPA-JHU DR7 database555http://wwwmpa.mpa-garching.mpg.de/SDSS/DR7/. These masses are based on SED fits to DR7 photometry following the approach of Salim et al. (2007); we used the “median” stellar-mass values for each galaxy.
The left-hand panel of Figure 13 shows the frequency of B/P bulges in edge-on galaxies in Yoshino & Yamauchi (2015) as a function of stellar mass. Since more distant galaxies will, on average, have structures smaller in angular size and thus more difficult to detect, we plot the results using three different upper limits on redshift (, 0.05, and 0.025) to see what effect changing the effective resolution has (the resulting subsample sizes are 1244, 800, and 150, respectively). In all three cases, we see a strong trend: B/P bulges are more common in higher-mass galaxies, just as we have seen for our local sample. Restricting the subsamples to lower redshifts increases the detected frequencies, as we might expect, but does not change the basic trend.
We cannot compare these B/P frequencies with ours directly because ours are fractions for barred galaxies , while those for the Yoshino & Yamauchi (2015) data are for all (edge-on) galaxies. However, we can make a crude estimate of what would be for the Yoshino & Yamauchi data by using their -band face-on sample to determine the bar fraction as a function of stellar mass (using the same MPA-JHU source above), and then using these fractions to estimate the total number of bars in each stellar-mass bin of the edge-on sample. The result is shown in the right-hand panel of Figure 13; we include the direct measurements of from our data for comparison.666Since we do not know which individual galaxies in the Yoshino & Yamauchi edge-on sample are barred-but-not-B/P, we cannot perform a logistic regression analysis as we did for our sample. The general trend is similar to that for our data, and is rather close in some places (especially for the subsample); the transitional stellar mass, where %, is –10.4 in all cases.
As we have noted previously, the B/P fraction measured for edge-on galaxies is expected to be lower than what we find for our GoodPA sample, due to the fact that some bars in edge-on systems will be oriented close to end-on and thus have B/P bulges that appear round like classical bulges, rather than boxy or peanut-shaped. But for several mass bins in the right-hand panel of Figure 13, the estimated B/P fractions for the Yoshino & Yamauchi (2015) edge-on sample is higher than our fractions.
One possible reason for this discrepancy is that the face-on bar fraction in the Yoshino & Yamauchi (2015) data – which is the denominator for calculating from their data – could be underestimated. This possibility stems from the fact that the SDSS images have only moderate resolution (FWHM typically ) and, more importantly, the fact that most of the galaxies are relatively far away, which limits the effective spatial resolution. For example, the median redshifts for the three subsamples of their data that we use are 0.021, 0.033, and 0.042, for the , , and subsamples, respectively. For a typical SDSS seeing of , this translates to spatial resolution limits of –850 pc; the practical limit for bar semi-major axes will probably be several times larger. In contrast, for the median distance of our sample (16.9 Mpc), the Spitzer 3.6µm FWHM of translates to 130 pc. An additional factor is the fact that our bar and B/P-bulge detections use near-IR images (mostly 3.6µm), which enhances the ability to detect bars compared to the optical SDSS image (e.g., Eskridge et al., 2000).
Figure 14 shows the detected bar fractions for the Yoshino & Yamauchi (2015) face-on sample as a function of stellar mass (with the same three redshift cutoffs), along with the bar fraction for our complete Parent sample. As expected, our detected fractions are consistently higher. This supports our suspicion that the values of that we have estimated for the Yoshino & Yamauchi (2015) sample are probably too high, because the face-on barred fractions are probably too low.
Finally, we note that the study of S4G galaxies by Herrera-Endoqui et al. (2015) – based on the classifications of Buta et al. (2015) – found barlenses (analogous to the box/oval zone we identify with B/P bulges) almost exclusively in galaxies with stellar masses (see their Fig. 10), which is consistent with our trend. (They also identify barlenses only in galaxies with Hubble types of Sbc and earlier, which matches our finding as well; Figure 7).
The data of Yoshino & Yamauchi (2015) and, to a lesser extent, of Herrera-Endoqui et al. (2015) thus provide independent confirmations of our basic finding: B/P bulge frequency is a strong function of stellar mass.
6.3 The Dependence – or Lack Thereof – of B/P Fraction on Galaxy Properties: Gas Fraction
and Stellar Mass
Simulations have suggested that a significant gas mass fraction in the disc can weaken, delay, or suppress the buckling of bars (Berentzen et al., 1998; Debattista et al., 2006; Berentzen et al., 2007; Wozniak & Michel-Dansac, 2009). The actual relative mass fraction – that is, – can be rather low. For example, Berentzen et al. (2007) found suppression of buckling for (constant) values of , and buckling was suppressed in the simulation of Wozniak & Michel-Dansac (2009), during which declined from 0.11 to 0.047 due to the transformation of gas into stars. In our data we find no evidence for a correlation between (atomic) gas mass fraction and B/P presence or absence – once the correlation between gas content and stellar mass is controlled for, that is. Moreover, Figures 6 and 10 show that B/P bulges remain fairly common for values of as high as –0.3 – well above the level explored in most of the simulations. (Recall that our does not include contributions from molecular gas, so our values are really lower limits.)
At first glance, our results appear to contradict the theoretical work. However, there are two reasons why we might not actually expect a strong correlation between B/P presence and gas content.
The first point is that we are using measurements of the current gas-mass fraction in our sample. If most (or all) of the B/P bulges in our sample arose from buckling events, most of these events would likely have occurred several Gyr ago, when the gas mass ratios were probably different. Unfortunately, this is not something that we can measure for our galaxies. (It is more likely that these galaxies had, on average, higher gas fractions in the past, which would make the problem worse.) A more comprehensive test of whether gas mass fraction affects the formation of B/P bulges by buckling will probably have to come from detailed observations at higher redshifts, when the buckling frequency would have been at its peak (Erwin & Debattista, 2016).
The second point is that the same gas-rich simulations which showed suppression of buckling generally also showed symmetric B/P growth, so that the bars often ended up with strong B/P bulges anyway. Thus, despite our recent demonstration that buckling does indeed take place in at least some real galaxies (Erwin & Debattista, 2016), the presence of B/P bulges in galaxies with could be an indication that most B/P bulges actually result from symmetric, non-buckling growth.
On the other hand, as our analysis in Section 4.1 and Figure 10 shows, gas mass fraction is much less important than stellar mass in determining whether a barred galaxy has a B/P bulge. So while it could be that the gas content helps determine how a B/P bulge forms – via buckling or via symmetric growth – whether a B/P bulge forms at all seem rather independent of the (current) gas mass fraction.
The strong dependence of B/P fraction on galaxy stellar mass is somewhat surprising, since we are aware of no theoretical predictions that would warrant such a trend. As noted above (Section 4.2), variables which might have been thought to affect B/P presence – gas mass fraction, or perhaps colour as a proxy for mean stellar age – do not show much evidence for secondary correlations with B/P fraction, and their correlation with B/P fraction can be explained as a side-effect of their own correlations with stellar mass. One could speculate for a possible correlation between current stellar mass and gas mass fraction at the time when the bar formed, but is difficult to see how to model this, let alone how to test this.
One possible connection might be with the (indirect) evidence for relatively higher vertical velocity dispersions in lower-mass galaxies. For example, comparisons of vertical and radial disc scale lengths indicate that lower-mass galaxies tend to have relatively thicker discs (e.g., Fig. 1 in Bershady et al., 2010); this implies that the ratio of vertical to radial stellar velocity dispersion is likely higher in lower-mass galaxies. This is relevant to the question of when and whether bars buckle, because the buckling instability is thought to happen when drops below some critical threshold, due to the increase in that follows bar formation (e.g., Toomre, 1966; Raha et al., 1991; Merritt & Sellwood, 1994; Martinez-Valpuesta et al., 2006). If is higher to begin with, then it could be harder for buckling to happen in lower-mass galaxies. Unfortunately, direct measurements of both and in disc galaxies are rare, so it is difficult to test this idea.
6.4 Current Buckling in Bars
In Erwin & Debattista (2016), we presented evidence indicating that the bars in NGC 3227 and NGC 4569 – both of which are in our GoodPA sample – are currently buckling. Given the large size of both the bar and the buckling region in NGC 3227 ( kpc deprojected, ), it might be possible that it is undergoing a secondary buckling event (Martinez-Valpuesta et al., 2006), but this seems very implausible for NGC 4569, where the buckling is confined to the inner part of the bar ().
Both galaxies are quite massive ( and 11.02 for NGC 3227 and NGC 4569, respectively); Figure 5 shows that this is in the regime where % of barred galaxies already have B/P bulges. This suggests two interesting questions: why have these galaxies not buckled previously (a question which of course applies to the other massive barred galaxies without B/P bulges), and why are they buckling now? One possibility is that the bars have only formed relatively recently in each galaxy.
6.5 The B/P Bulge of the Milky Way in Context
As noted in the Introduction, our own Galaxy has a bar with a B/P bulge. Is this unusual, or is it something to be expected given other attributes of the Galaxy? Since most estimates for its stellar mass lie in the range 5– (e.g., Flynn et al., 2006; McMillan, 2011; Licquia & Newman, 2015; McMillan, 2016), the logistic fit of Section 4.1 for as a function of the stellar mass would predict probabilities of 0.79–0.86 for the Galaxy’s bar to host a B/P bulge; the observed frequency for that mass range is 0.88. This suggests that our galaxy is quite typical in having a B/P bulge.
Wegg et al. (2015) projected their model of the central Galaxy as if it were seen with and an inclination of 60°, and then used the approach of Erwin & Debattista (2013) to derive a relative B/P size of . In Section 5, we noted that for the galaxies in our sample, with a range of 0.25 to 0.76. The Galaxy’s B/P is thus very near the lower end of the range of observed relative B/P sizes, though not outside it.
Given the mass of the Galaxy and its barred nature, we can say that it would if anything be unusual for the Galaxy to not have a B/P bulge. The relatively small size of the B/P bulge compared to the full, in-plane length of the bar is, however, somewhat unusual.
7 Summary
From a parent sample of 186 local disc galaxies with inclinations between 40° and 70°, we have carefully defined a subset of 84 barred galaxies with orientations (bar position angle away from the disc major axis) ideal for determining the presence or absence of boxy/peanut-shaped (B/P) bulges inside the bars. Within this subsample, we find a total of 44 barred galaxies with B/P bulges, plus two more that are currently in the vertical buckling stage and will likely transform into hosts of B/P bulges in the next Gyr or so. The remainder show no evidence for B/P bulges and most likely have vertically thin bars.
Extensive statistical tests, including multiple logistic regression and matched-pair analysis, show that the dominant correlation for B/P bulge frequency is with stellar mass, in the sense that more massive galaxies are more likely to have B/P bulges inside their bars. Only % of barred galaxies with stellar masses have B/P bulges, while % of those with higher masses do. Correlations also exist between B/P bulge frequency and Hubble type, gas mass ratio, galaxy colour, and bar size, in the sense that B/P hosts are earlier in Hubble type, lower in gas fraction, redder, and have larger bars. However, these are mostly if not entirely side effects of the underlying correlations of these parameters with stellar mass; they largely vanish if we control for stellar mass. A logistic fit to the B/P bulge fraction as a function of stellar mass suggests a transition mass of , at which point 50% of barred galaxies have B/P bulges.
We tested the validity of our B/P bulge–stellar mass correlation by combining the dataset of Yoshino & Yamauchi (2015), who identified B/P bulges in a large sample of SDSS images of edge-on galaxies, with stellar-mass estimates from the MPA-JHU DR7 database. This showed the same trend: the B/P bulge fraction (in all edge-on galaxies) increases with stellar mass, even after accounting for resolution effects. We also attempted to determine the B/P bulge fraction in barred galaxies for their sample by using their analysis of face-on galaxies to estimate the bar fraction as a function of stellar mass, and then applying this to the edge-on galaxies. The result was a broadly similar trend, with evidence that the B/P bulge fraction in barred galaxies reaches 50% at –10.4, very similar to the value from our sample.
Although a number of simulations have suggested that gas mass fractions in galaxy discs can suppress the vertical buckling of bars (which gives rise to B/P bulges), we find no evidence for a correlation between gas mass ratio (the ratio of neutral atomic gas to stellar mass) and the presence or absence of B/P bulges, once the correlation with stellar mass is accounted for. B/P bulges are present in barred galaxies with frequencies as high as % for as large as 0.1. This may be an indication that many B/P bulges form via symmetric growth mechanisms (which are less affected by high ), rather than by the buckling instability.
The sizes of B/P bulges (half-length measured along the major axis) can be described in terms of linear size – ranging from 450 pc to 4.6 kpc, with a mean of kpc – and as a fraction of the whole bar’s length. Since bar lengths are somewhat uncertain and difficult to define, we measured two lengths: and . The relative sizes and are and , respectively. These are consistent with previous measurements. We find no real evidence for correlations between relative B/P bulge size and host galaxy properties.
Finally, we note that given the Milky Way’s stellar mass and the presence of a bar, the existence of a B/P bulge is entirely expected (% of local barred galaxies with similar masses have B/P bulges), though the relative size of Galaxy’s B/P bulge is very near the lower end of observed values.
Acknowledgments
We are happy to thank Preben Grosbøl for providing -band images of galaxies from Grosbøl et al. (2004). We also thank Dave Wilman for helpful comments and advice, and Jerry Sellwood and Françoise Combes for comments on earlier versions; we also thank the anonymous referee for several suggestions that improved the readability and flow of the paper. P.E. apologizes to V.P.D. for removing the word “hwæt” from our previous paper. V.P.D. was supported by STFC Consolidated grant # ST/M000877/1. VPD acknowledges being a part of the network supported by the COST Action TD1403 “Big Data Era in Sky and Earth Observation.”
This research is based on observations made with the NASA/ESA Hubble Space Telescope, obtained from the data archive at the Space Telescope Institute. STScI is operated by the association of Universities for Research in Astronomy, Inc. under the NASA contract NAS 5-26555. This research also made use of both the NASA/IPAC Extragalactic Database (NED) which is operated by the Jet Propulsion Laboratory, California Institute of Technology, under contract with the National Aeronautics and Space Administration, and the Lyon-Meudon Extragalactic Database (LEDA; http://leda.univ-lyon1.fr).
This work is based in part on observations made with the Spitzer Space Telescope, obtained from the NASA/IPAC Infrared Science Archive, both of which are operated by the Jet Propulsion Laboratory, California Institute of Technology under a contract with the National Aeronautics and Space Administration. This paper also makes use of data obtained from the Isaac Newton Group Archive which is maintained as part of the CASU Astronomical Data Centre at the Institute of Astronomy, Cambridge.
Funding for the creation and distribution of the SDSS Archive has been provided by the Alfred P. Sloan Foundation, the Participating Institutions, the National Aeronautics and Space Administration, the National Science Foundation, the U.S. Department of Energy, the Japanese Monbukagakusho, and the Max Planck Society. The SDSS Web site is http://www.sdss.org/.
The SDSS is managed by the Astrophysical Research Consortium (ARC) for the Participating Institutions. The Participating Institutions are The University of Chicago, Fermilab, the Institute for Advanced Study, the Japan Participation Group, The Johns Hopkins University, the Korean Scientist Group, Los Alamos National Laboratory, the Max-Planck-Institute for Astronomy (MPIA), the Max-Planck-Institute for Astrophysics (MPA), New Mexico State University, University of Pittsburgh, University of Portsmouth, Princeton University, the United States Naval Observatory, and the University of Washington.
Appendix A Choosing the Best Method for Finding B/P Bulges
Four basic methods have been used in the literature to find B/P bulges in disc galaxies. In this section we discuss the advantages and disadvantages of each in order to motivate our use of the “box+spurs morphology” approach (fourth in the list).
Edge-on detection of B/P bulges (e.g., Jarvis, 1986; Shaw, 1987; de Souza & Dos Anjos, 1987; Dettmar & Barteldrees, 1990; Lütticke et al., 2000a; Yoshino & Yamauchi, 2015): Inspection of images of edge-on galaxies is, of course, how B/P bulges were first identified, and this method has the advantage of being direct – B/P bulges do protrude out of the disc plane and are thus identifiable when seen at the right orientation – but is fundamentally limited by a number of problems.
The most serious problem, for our purposes, is that it can only be used for positive identifications. Observing a boxy or peanut-shaped bulge in an edge-on galaxy tells us that there is a B/P bulge present, but observing an elliptical bulge may mean we are seeing a B/P bulge in a bar oriented nearly end-on, or just a classical bulge, or even both at once.
The second serious problem with using edge-on galaxies is the difficulty in finding and measuring in-plane bars. This is important for two reasons. First, we want to know what fraction of bars lack B/P bulges, but this requires being able to identify planar bars in edge-on galaxies whether or not they have B/P bulges. The second reason is that in galaxies that do have B/P bulges, we want to be able to measure the in-plane bar sizes, so we can estimate what fraction of the bar is vertically thickened. While it is at least sometimes possible to identify in-plane bars and measure their sizes for edge-on galaxies using the edges of plateaus and local bumps in surface-brightness profiles (e.g., Wakamatsu & Hamabe, 1984; Hamabe & Wakamatsu, 1989; Lütticke et al., 2000b; Kormendy & Kennicutt, 2004; Bureau & Athanassoula, 2005), it remains unclear how to separate edge-on planar bars from edge-on lenses surrounding bars (or lenses without bars at all) or from edge-on spirals and rings (see, for example, the discussions of NGC 4762 in Wakamatsu & Hamabe 1984 and Athanassoula 2005).
The bar-orientation problem also makes it more difficult to determine the sizes of B/P bulges themselves, since a boxier and less peanut-shaped structure seen side-on may not be clearly distinguishable from a more peanut-shaped bulge seen at an intermediate angle. Put simply, since we cannot accurately determine the orientations of bars in edge-on galaxies, we can only measure lower limits on B/P sizes.
We note that it is possible to identify the presence of an in-plane bar with gas or stellar kinematics. However, gas-kinematic diagnostics (Kuijken & Merrifield, 1995; Bureau & Athanassoula, 1999; Athanassoula & Bureau, 1999) are only valid if there is sufficient coplanar, corotating gas within the (potential) bar region. Stellar-kinematic diagnostics (Chung & Bureau, 2004; Bureau & Athanassoula, 2005; Iannuzzi & Athanassoula, 2015), on the other hand, are more widely applicable, but they require more expensive allocations of telescope time. It is also not clear how well one can constrain the size and orientation of the bar from such approaches (as noted by Iannuzzi & Athanassoula, 2015), or how to relate these measurements to the usual bar-size measurements made for more face-on galaxies. 2. 2.
Face-on stellar kinematics (Debattista et al., 2005; Méndez-Abreu et al., 2008; Iannuzzi & Athanassoula, 2015): This method has the advantage of working for face-on galaxies, where identifying and measuring bars (with or without B/P bulges) is simple and straightforward. The primary disadvantage is that it requires expensive spectroscopic observations (e.g., several hours on an 8m-class telescope per galaxy; Méndez-Abreu et al., 2008). A lesser disadvantage is that it works best for galaxies close to face-on (i.e., inclinations ), which limits the number of galaxies that can be analyzed. 3. 3.
“Barlens” identification (Laurikainen et al., 2014; Athanassoula et al., 2015): This technique relies on the identification of barlenses – rounder, “lens-like” components inside bars (Laurikainen et al., 2011, 2013; Herrera-Endoqui et al., 2015) – as the face-on or moderately inclined projections of B/P bulges. It is in principle applicable to both face-on and moderately inclined galaxies, allowing bar detection and measurement and also overcoming the limited-sample-size disadvantages of the face-on stellar-kinematics technique. Although this is a promising approach, there are some uncertainties. First, it is not clear to us how to reliably identify barlenses, in part because the definition of “lens” is somewhat ambiguous.777Classically, lenses have been defined as shallow or even flat brightness profiles with steeper declines outside (e.g., Kormendy, 1979). But many barlenses have steep quasi-exponential profiles with shallower profiles outside (e.g., Laurikainen et al., 2014). Second, it is not clear if barlens-like morphologies are always due to B/P structure. Both spheroidal classical bulges and disky pseudobulges can be found inside bars (e.g., Erwin et al., 2015); these could potentially be identified as barlenses. For example, some of the barred-galaxy models with classical bulges in Saha et al. (2013) show very similar face-on morphologies both before and after the B/P bulge has formed (e.g., their model RHG097). We also note the case of NGC 3945: this barred S0 was classified as having barlens by Laurikainen et al. (2011), but that feature is clearly due to a large inner or nuclear disc, with an embedded nuclear ring and secondary bar (e.g., Erwin & Sparke, 1999; Erwin et al., 2003; Cole et al., 2014; Erwin et al., 2015).888We suspect that NGC 3945, as a massive barred galaxy, probably does have a B/P bulge, but distinguishing it from the projected outer bar and inner/nuclear disc would be difficult given the bar’s orientation along the galaxy minor axis. 4. 4.
Box+spurs morphology in moderately inclined galaxies (Erwin & Debattista, 2013): Finally, there is our preferred method, which is the examination of isophote shapes in moderately inclined galaxies where the bar is oriented away from the galaxy minor axis, looking for a particular pattern we refer to as “box+spurs”.
In Erwin & Debattista (2013), we showed, using -body simulations of barred galaxies, that the projections at intermediate inclinations of a vertically thin, unbuckled bar and of a bar with a B/P bulge differ in recognizable ways (Figure 1). The projection of a thin bar produces fully symmetric, elliptical isophotes, while a bar with a B/P bulge produces thicker, elliptical or boxy isophotes (the “box”, which is the B/P bulge itself) and thinner, usually offset isophotes outside (the “spurs”, due to the vertically thin outer part of the bar). This is an example of a general phenomenon noted by, e.g., Stark (1977): projections of concentric, aligned 3D ellipsoids with varying axis ratios produce isophotes with varying position angles (isophote twists). Since the vertical axis ratio of the B/P bulge is different from that of the outer bar, any projection in which the galaxy is not oriented face-on (or edge-on) and where the bar is not precisely along either the major or minor axis of the projected disc will produce twisted isophotes inside the bar. As demonstrated in Erwin & Debattista (2013), this twist has a characteristic pattern: the inner, fatter isophotes of the box999The isophotes of the box are often quite rectangular, but can also be more elliptical. (from the projection of the B/P bulge) are closer to the disc major axis than the outer, more elongated isophotes of the spurs (from the projection of the outer bar). But since vertically thin bars have, to first order, axis ratios which do not change with radius, their projected isophotes do not show systematic twists (see bottom row of panels in Figure 1).
Erwin & Debattista (2013) found that projected B/P bulges in -body models could be detected for inclinations and relative angles between the bar and the disc major axis of . There is no practical upper limit on the inclination – indeed, we have known for some time that we can detect B/P bulges in edge-on galaxies! – except that for inclinations it becomes harder to reliably identify and measure the bar as a whole, and then we are back to the problems of the edge-on approach.
The fundamental advantage of using moderately inclined galaxies is that the box+spurs morphology is a direct consequence of the different vertical thicknesses of the B/P structure and the outer bar. That is, when we see the box+spurs morphology, we are assured that the “box” region is vertically thicker than the spurs, and that we have a genuine B/P structure within the bar. (The fundamental disadvantage is that this only works if the bar is not too close to the minor axis, and so this cannot be used for all moderately inclined barred galaxies.)
Appendix B Data Sources and Derived Quantities
For the majority of our galaxies, we used Spitzer IRAC1 (3.6m) images, primarily from the Spitzer Survey of Stellar Structure in Galaxies (S4G; Sheth et al., 2010) but also from the Spitzer Infrared Nearby Galaxies Survey (SINGS; Kennicutt et al., 2003) and other surveys (e.g., Dale et al., 2009). We preferred the 3.6m channel over the 4.5m channel because it offers slightly higher spatial resolution. When they were available, we also used higher-resolution -band images from Knapen et al. (2003), Grosbøl et al. (2004) and the Near-infrared Atlas of S0-Sa Galaxies (NIRS0S; Laurikainen et al., 2011), as well as Hubble Space Telescope NICMOS2 and NICMOS3 near-IR images (usually in the F160W filter) from the HST archive.
Accurate galaxy distances are important for absolute size measurements and for determining stellar masses. We preferred using direct distance measurements – typically surface-brightness-fluctuation, Cepheid, or TRGB measurements – wherever possible, falling back first to Tully-Fisher estimates when direct distances did not exist, and then using Hubble-flow distances when T-F distances were not possible. Sources for individual galaxies are listed in Table 5. For Tully-Fisher distances, we have chosen to standardize on the 3.6µm relation and distances of Sorce et al. (2014), which we use for 56 of our galaxies. Distances for other galaxies without primary measurements but which had 3.6µm magnitudes and H i velocity widths were estimated using Eqn. 1 of Sorce et al. (2014). Finally, for the remaining galaxies we determined distances using the HyperLeda redshifts (corrected for Virgo-centric infall) and a Hubble constant of km s*-1* Mpc*-1*.
For most of our galaxies, we determined the stellar mass using 2MASS total -band absolute magnitudes and stellar ratios estimated from HyperLeda total corrected colours via the relations in Bell et al. (2003). Total colours were not available for some galaxies, so we use HyperLeda colours (measured within the effective radius) instead. Six galaxies had no values in HyperLeda at all, but did have SDSS colours, which we converted to using the Lupton (2005) relations.101010http://classic.sdss.org/dr7/algorithms/sdssUBVRITransform.html Finally, there were a total of ten galaxies for which suitable optical colours (or, in the case of two galaxies, total -band magnitudes) could not be found; for these, we used stellar-mass estimates based on Spitzer 3.6µm and 4.5µm data from Zaritsky et al. (2014) or Cook et al. (2014), after correcting for any differences in the assumed distances. (We investigated using the Zaritsky et al. masses for more galaxies, since they would provide mass estimates independent of the -band magnitudes and optical-colour-based ratios, but found that only 29 out of 84 galaxies in our GoodPA subsample galaxies were in that study.) All colours and magnitudes were corrected for Galactic extinction using the extinction coefficients of Schlafly & Finkbeiner (2011), as tabulated in NED.
Because the gas mass fraction of the galaxy disc has been shown to weaken or suppress buckling in some simulations (Berentzen et al., 1998; Debattista et al., 2006; Berentzen et al., 2007; Wozniak & Michel-Dansac, 2009), we also gathered data on the abundance of gas in our galaxies. For this we used the HyperLeda corrected H i magnitudes . We converted this to gas mass in solar masses using the following relation from Giovanelli & Haynes (1988):
[TABLE]
where is the distance in Mpc. We found HyperLeda H i measurements for 168 of the 186 galaxies in our parent sample. To supplement this, we searched for H i data in NED and the literature for those galaxies lacking this data in HyperLeda; we found one additional detection (NGC 3945; Serra et al., 2012) and 16 additional upper limits, and one galaxy (NGC 1537) for which we could find no H i observations at all. We multiply the H i masses by 1.4 to account for presence of He; we defined the gas mass fraction to be the ratio of atomic (H + He) gas to stellar mass. Ideally, we should also include molecular gas, but CO measurements are generally still too rare to be useful for a sample of our size, so we limited ourselves to atomic gas masses.
For most of our analysis, we treated the upper limits on H i as actual measurements; however, we also computed statistical tests for alternate subsamples that exclude the upper-limit galaxies entirely.
As noted above, we have colours for almost all our sample. We also computed colours by combining HyperLeda and 2MASS magnitudes.
For barred galaxies, we measured bar position angles and sizes using a combination of ellipse fits to isophotes (using the standard ellipse task in iraf) and direct visual inspection. We recorded two radial bar-size measurements based on the approach of Erwin (2005). The first is , the semi-major axis where the fitted ellipses reach maximum ellipticity – or, in some cases, the semi-major axis where the position angle reaches a local extremum. The second is , which is the minimum of three measurements: , the semi-major axis where fitted ellipses deviate from the bar’s position angle by ; , the local minimum in ellipticity outside ; and the distance from the galaxy centre to spiral arms or rings which visibly cross the ends of the bar. These two measurements function as lower and upper limits on the bar size.
Appendix C New B/P Galaxies
In Figure 15 we show isophote plots for 27 galaxies with newly identified B/P bulges, along with six galaxies which were mentioned as B/P hosts in Erwin & Debattista (2013) but for which no figures were presented (two of these – NGC 4442 and NGC 7582 – were originally identified as B/P hosts by Bettoni & Galletta 1994 and Quillen et al. 1997). The plots show logarithmically scaled near-IR images, with red arrows indicating the position angle and linear extent () of the B/P bulge. Cyan arrows indicate the position angle of the outer part of the bar; the inner arrowheads indicate our lower-limit estimate of the bar size (), while the outer, more elongated arrowheads indicate our upper-limit estimate (). Finally, dashed black lines show the line of nodes for the galaxy disc.
Unless otherwise specified, data are Spitzer IRAC1 (3.6µm) images from S4G; in the majority of cases, images have been smoothed using median filters with widths of 3–9 pixels. Sources for non-S4G data: NGC 925 and NGC 1097: IRAC1 images from Kennicutt et al. 2003; NGC 1350, NGC 1512, NGC 1537 and NGC 2781: -band images from Laurikainen et al. 2011; NGC 1371: -band image from Grosbøl et al. 2004; NGC 2903: IRAC1 image from Dale et al. 2009; NGC 6744: IRAC1 image from Spitzer archive [PI David Fisher, Program ID 30496]; NGC 7582: -band image from Eskridge et al. 2002.
Appendix D Parent Sample
The final parent sample for our analysis (Parent; see Section 2) is listed in Table 5. Galaxies which were rejected during the construction of this sample are listed in Appendix F, along with the reasons for rejection.
Appendix E Galaxies with Nuclear Bars But No Large-Scale Bars
Three early- or intermediate-type galaxies in our sample – NGC 1201 (S0), NGC 1553 (S0), and NGC 5194 (Sbc) – do not have large-scale bars, but do have very small “nuclear” bars. Although the term “nuclear bar” is poorly defined, the bars in these galaxies have deprojected sizes ( 0.047, 0.039, and 0.042 for NGC 1201, NGC 1553, and NGC 5194, respectively). This places them below the range spanned by S0–Sb galaxy bars in Erwin (2005), and below the range of S0–Sc bars in the study of Menéndez-Delmestre et al. (2007), with the exception of NGC 5194 itself. The next smallest bar in the S0–Sc galaxies of Menéndez-Delmestre et al is in NGC 1068, with , which is in fact the inner bar of a double-bar system (Erwin, 2004, and references therein). On this basis, we classify these three galaxies as “unbarred” for the purposes of our study.
Appendix F Rejected Galaxies
The following galaxies met our initial RC3-based criteria (Section 2), but were excluded from the final Parent Sample. In the majority of cases, we determined that the galaxies had inclinations lower or higher than our limits (–70°), in spite of having 25th-magnitude axis ratios in RC3 which suggested otherwise. These include cases of edge-on galaxies with luminous bulges or halos (leading to low RC3 axis ratios) as well as near-face-on galaxies with large, luminous bars, lenses, and/or elliptical inner rings, where the RC3 axis ratio is due to the bar/lens/ring.
NGC 289: Ellipse fits to the outer disc (Sptizer IRAC1 image) indicate an inclination of 38°.
NGC 613: Various kinematic analyses in the literature suggest an inclination of .
NGC 986: Analysis of a Spitzer IRAC1 image by Muñoz-Mateos et al. (2013) found .
NGC 988: Removed due to the presence of an extremely bright star within the galaxy.
NGC 1042: Removed due to low inclination ( from outer-disc ellipse fits, Pohlen & Trujillo, 2006).
NGC 1300: The analysis of H i data in Lindblad et al. (1997) indicates an inclination of 35°.
NGC 1316: Although this galaxy is classified as S0 in RC3, it is a well-known merger remnant (e.g. Goudfrooij et al., 2001a, b).
NGC 1543: The outer isophotes of this galaxy indicate an inclination of (Erwin et al., 2015), well below our lower limit; the RC3 axis ratio is due to the outer bar and lens.
NGC 2146: We rejected this galaxy due to its status as a clear merger remnant.
NGC 2685: This is a well-known polar-ring galaxy.
NGC 2775: Removed due to low inclination ( from outer-disc ellipse fits, Gutiérrez et al., 2011).
NGC 2805: The analysis of Fabry-Perot H data in Epinat et al. (2008) indicates an inclination of .
NGC 3027: The analysis of Fabry-Perot H data in Epinat et al. (2008) indicates an inclination of .
NGC 3310: Removed for being a probable merger remnant (e.g., Kregel & Sancisi, 2001; Wehner & Gallagher, 2005).
NGC 3403: Ellipse fits to the S4G 3.6µm image indicate an inclination of , slightly outside our limits.
NGC 3414: Ellipse fits to the S4G 3.6µm image indicate an inclination of .
NGC 3607: Analysis of -band isophotes indicates an inclination of (Gutiérrez et al., 2011).
NGC 3630: The morphology of this galaxy clearly suggests an edge-on S0, despite the RC3 axis ratio.
NGC 3718: This is a complex galaxy almost certainly the result of a relatively recent interaction, and possibly related to polar-ring galaxies. Without a well-defined disc, we cannot include it.
NGC 3733: Ellipse fits to the S4G IRAC1 image suggest an inclination of .
NGC 3755: The analysis of Fabry-Perot H data in Epinat et al. (2008) indicates an inclination of . (Ellipse fits to SDSS images suggest an inclination of .)
NGC 3981: Ellipse fits to the S4G IRAC1 image suggest an inclination of .
NGC 4036: The morphology of this galaxy clearly suggests an edge-on S0, despite the RC3 axis ratio.
NGC 4051: Analysis of H i data by Liszt & Dickey (1995) suggests an inclination of 37°.
NGC 4151: The inclination of this galaxy is only (e.g., Erwin, 2005); the RC3 axis ratio is due to the large bar + lens.
NGC 4251: The morphology of this galaxy clearly suggests an edge-on S0, despite the RC3 axis ratio.
NGC 4258: H i velocity-field analysis suggests an inclination of 72° for this galaxy (van Albada, 1980).
NGC 4350: The morphology of this galaxy clearly suggests an edge-on S0, despite the RC3 axis ratio.
NGC 4382: This galaxy lacks a clearly defined outer disc, and is probably a merger remnant (e.g., Gutiérrez et al., 2011, and references therein).
NGC 4417: The morphology of this galaxy clearly suggests an edge-on S0, despite the RC3 axis ratio.
NGC 4424: Removed due to being a likely merger remnant (e.g., Kenney et al., 1996).
NGC 4441: Removed for being a clear merger remnant (e.g., Manthey et al., 2008; Jütte et al., 2010).
NGC 4459: Removed due to low inclination ( from outer-disc ellipse fits, Gutiérrez et al., 2011).
NGC 4488: This galaxy has a genuinely peculiar morphology, with a box-shaped interior, two elongated (tidal?) spiral arms, and no clear outer disc. Since we cannot determine a reliable orientation, for this galaxy, we exclude it.
NGC 4490: This galaxy is strongly interacting with its neighbor NGC 4485, making determination of its orientation too difficult.
NGC 4539: Ellipse fits to the S4G IRAC1 image suggest an inclination of .
NGC 4594: This is the Sombrero Galaxy, an almost edge-on Sa with a luminous bulge which produces the relatively round RC3 axis ratio.
NGC 4643: Removed due to low inclination ( from outer-disc ellipse fits, Erwin et al., 2008).
NGC 4699: Analysis of the outer-disc isophotes from SDSS images yields an inclination of (Erwin et al., 2015).
NGC 4731: This galaxy consists of a strong, very narrow bar and two strong, open spiral arms, forming an integral-sign shape. We excluded it because we were unable to measure a reliable outer disc orientation.
NGC 5248: Publicly available images of this galaxy are not deep enough for us to reliably determine the outer disc orientation (the analysis of Jogee et al. 2002 suggests an inclination of , meaning we cannot be sure it is inclined enough to meet our inclination criteria).
NGC 5866: The morphology of this galaxy clearly suggests an edge-on S0, despite the RC3 axis ratio.
NGC 6255: Ellipse fits to SDSS images indicate an inclination of .
NGC 7041: The morphology of this galaxy clearly suggests an edge-on S0, despite the RC3 axis ratio.
NGC 7412: Ellipse fits to the S4G IRAC1 image of this galaxy suggest an inclination of .
NGC 7727: Rejected for being a clear merger remnant.
NGC 7814: This is an edge-on early-type spiral with a large bulge, similar to the Sombrero Galaxy (NGC 4594).
IC 4212: No useful, publicly available imaging data for this galaxy exists.
UGC 6930: The optical and H i analysis of this galaxy in Verheijen & Sancisi (2001) indicate an inclination of .
ESO 499-37: We were unable to determine a plausible stellar mass for this galaxy. The combination of the LEDA value and the available 2MASS photometry yields , suggesting the magnitude is much too faint.
Appendix G Notes on Individual Galaxies
NGC 2273: We were unable to find IRAC1 total-magnitude measurements for this galaxy, so we used the mean of the Tully-Fisher measurements from Theureau et al. (2007) for the distance.
NGC 3227: We use the SBF distance of this galaxy’s interacting neighbor NGC 3226 (Tonry et al., 2001).
NGC 4596: This was classified as not having a B/P bulge in Erwin & Debattista (2013). Based on the slight offset of the spurs relative to the rounder interior of the bar (a very oval “box” region), we now count this as having a B/P bulge. This is consistent with the identification of a barlens in this galaxy by Laurikainen et al. (2011).
NGC 4772: Attempts to use the Sorce et al. (2014) Tully-Fisher relation for this galaxy yield distances of –70 Mpc, depending on the inclination; published Tully-Fisher distances in NED range from 25 to 41 Mpc. Since the Virgocentric-infall-corrected recession velocity is only 1083 and since most studies tend to associate it with the Virgo Cluster, we use our default Virgo Cluster distance (16.5 Mpc) for this galaxy.
Appendix H Galaxy Simulations
In Figure 1 we show projections of three different galaxy simulations at different orientations as a way of demonstrating the effects of having (or not having) a B/P bulge on the observed isodensity or isophote contours of a barred galaxy. Since two of these simulations were previously used in Erwin & Debattista (2013) and Erwin & Debattista (2016), we continue the naming scheme used in those papers. Simulations A and B are pure -body simulations which were previously discussed in Erwin & Debattista (2013); they use 300,000–500,000 stellar disc particles with softening lengths of 60 pc (Simulation A) or 0.05 natural units (Simulation B). (More details of Simulation B can be found in Sellwood & Debattista 2009.) Both simulations formed bars which subsequently buckled; we show Simulation A at a time after the buckling of the bar and the formation of the B/P bulge, while Simulation B is shown after the bar has formed but before buckling, so the bar is still vertically thin.
Simulation E111111Simulations C and D do not in appear in this paper, but were used in Erwin & Debattista (2016). is an -bodySPH simulation first presented in Ness et al. (2014) and Cole et al. (2014); a complete description can be found in Debattista et al. (2017). The stars in this simulation form entirely out of gas cooling from a spherical corona, triggering continuous star formation. This simulation, which was evolved with Gasoline (Wadsley et al., 2004), the smooth particle hydrodynamics version of Pkdgrav, has high force resolution (50 pc) and stellar mass resolution (). The model forms a strong bar between 2 Gyr and 4 Gyr (Cole et al., 2014), while a B/P bulge forms by 10 Gyr.
As pointed out by the referee, the unbuckled bar in Simulation B (bottom left and bottom middle panels in Figure 1) shows some pinching of the isophotes near the center of the bar. This is a feature that shows up in at least some of our simulations of bars prior to the buckling phase. We suspect this is a side effect of initial conditions involving overly cold disks in the simulations, with bar formation causing in-plane contraction in all directions, but more strongly along the minor axis; in a real galaxy, this would probably be weakened by more efficient vertical heating of the nuclear region of the disk. (We see no evidence of such pinching in the observations, although this would be difficult to see for two reasons. First, galaxies in our sample have inclinations of 40–70°, while the pinching in the simulations is best seen for face-on orientations. Second, many of the observed unbuckled bars have regions of star formation within the bars; the excess light has the effect of making the combined, observed isophotes rounder in the bar region, and could thus wash out any weak pinching in the bar.)
The reference list from the paper itself. Each links out to its DOI / PubMed record.
- 1Abazajian et al. (2009) Abazajian K. N., et al., 2009, Ap JS, 182, 543
- 2Abbott et al. (2016) Abbott C., Valluri M., Shen J., Debattista V. P., 2016, MNRAS, submitted
- 3Akaike (1974) Akaike H., 1974, IEEE T. Automat. Contr., 19, 716
- 4Athanassoula (2005) Athanassoula E., 2005, MNRAS, 358, 1477
- 5Athanassoula (2016) Athanassoula E., 2016, Galactic Bulges, 418, 391
- 6Athanassoula & Beaton (2006) Athanassoula E., Beaton R. L., 2006, MNRAS, 370, 1499
- 7Athanassoula & Bureau (1999) Athanassoula E., Bureau M., 1999, Ap J, 522, 699
- 8Athanassoula & Misiriotis (2002) Athanassoula E., Misiriotis A., 2002, MNRAS, 330, 35