Pressure induced half-collapsed-tetragonal phase in CaKFe$_4$As$_4$
Udhara S. Kaluarachchi, Valentin Taufour, Aashish Sapkota, Vladislav, Borisov, Tai Kong, William R. Meier, Karunakar Kothapalli, Benjamin G., Ueland, Andreas Kreyssig, Roser Valent\'i, Robert J. McQueeney, Alan I., Goldman, Sergey L. Bud'ko, Paul C. Canfield

TL;DR
This study maps the pressure-temperature phase diagram of CaKFe$_4$As$_4$, revealing a pressure-induced transition to a half-collapsed-tetragonal phase that suppresses superconductivity around 4 GPa.
Contribution
It identifies a novel half-collapsed-tetragonal phase in CaKFe$_4$As$_4$ induced by pressure, combining experimental and theoretical evidence.
Findings
Superconductivity is suppressed and disappears near 4 GPa.
A phase transition to a half-collapsed-tetragonal structure occurs at ~4 GPa.
Band structure calculations confirm As-As bonding across Ca-layer at transition.
Abstract
We report the temperature-pressure phase diagram of CaKFeAs established using high pressure electrical resistivity, magnetization and high energy x-ray diffraction measurements up to 6 GPa. With increasing pressure, both resistivity and magnetization data show that the bulk superconducting transition of CaKFeAs is suppressed and then disappears at 4 GPa. High pressure x-ray data clearly indicate a phase transition to a collapsed tetragonal phase in CaKFeAs under pressure that coincides with the abrupt loss of bulk superconductivity near 4 GPa. The x-ray data, combined with resistivity data, indicate that the collapsed tetragonal transition line is essentially vertical, occuring at 4.0(5) GPa for temperatures below 150 K. Band structure calculations also find a sudden transition to a collapsed tetragonal state near 4 GPa, as As-As bonding takes place…
Click any figure to enlarge with its caption.
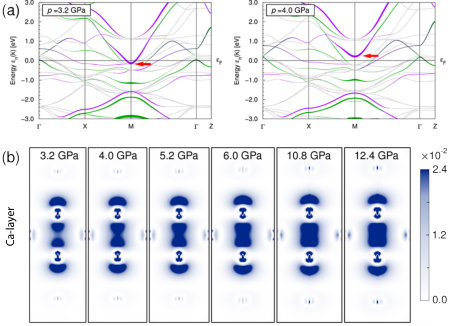 Figure 1
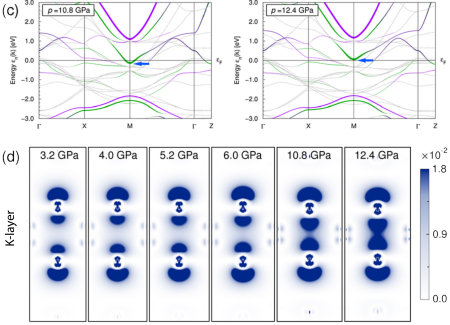 Figure 2
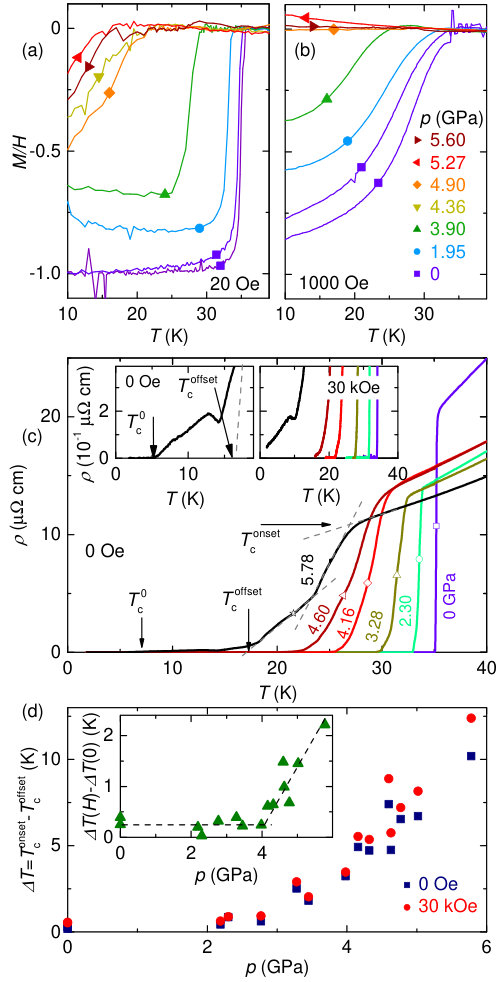 Figure 3
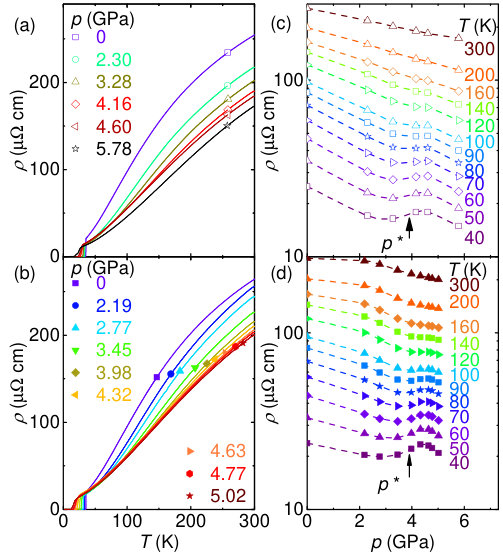 Figure 4
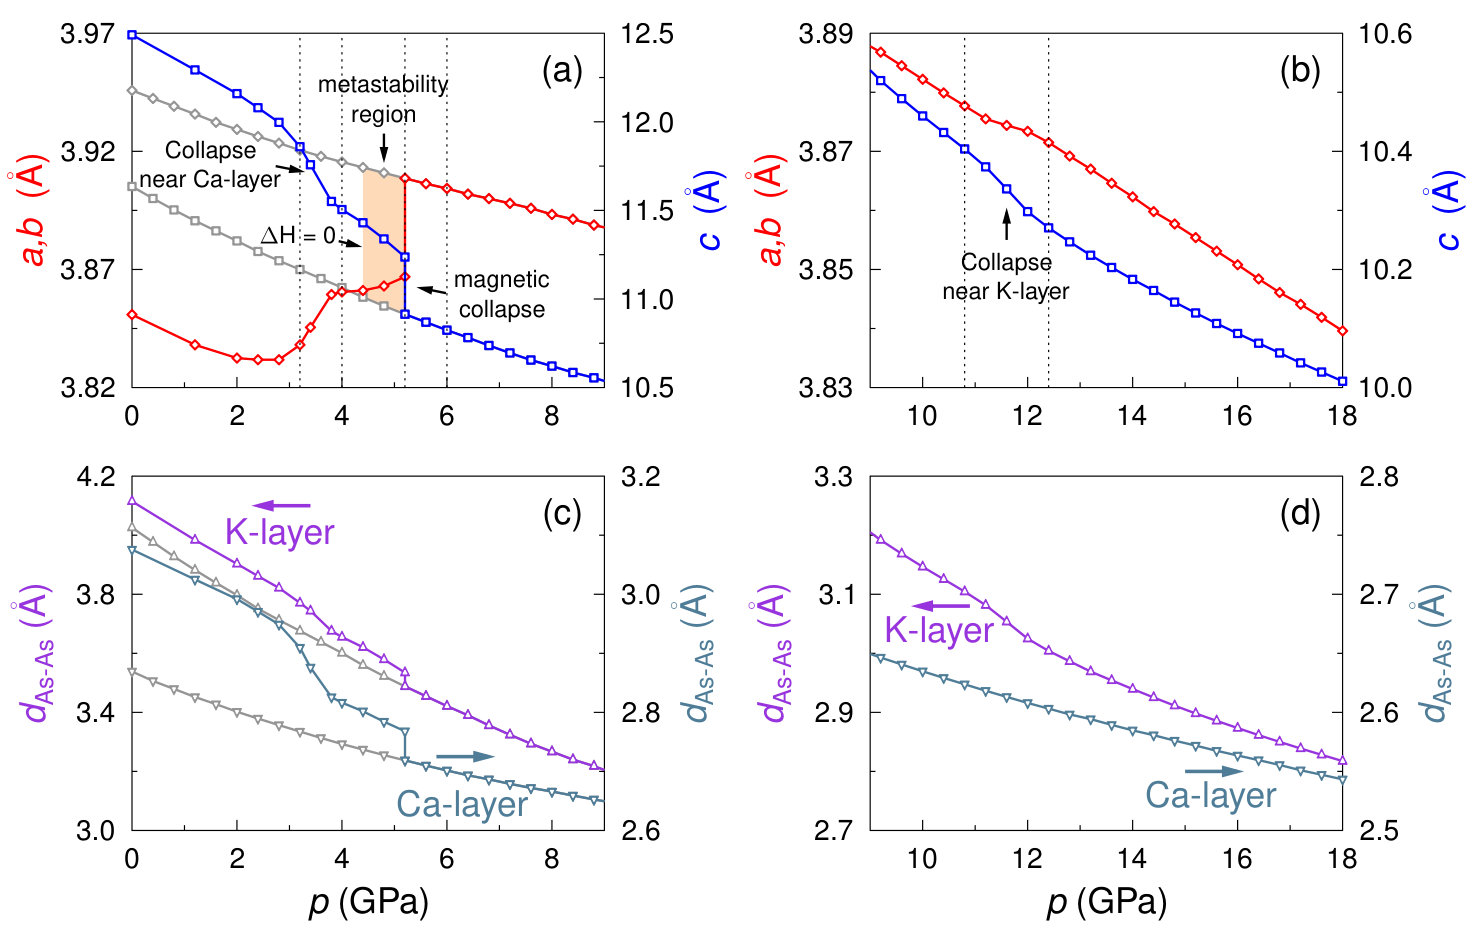 Figure 5
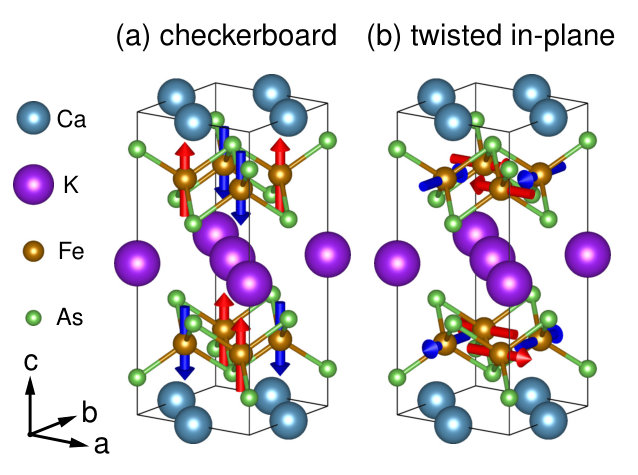 Figure 6
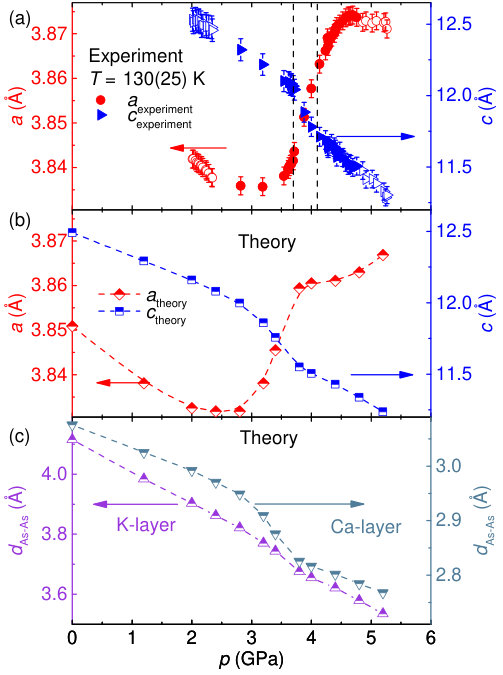 Figure 7
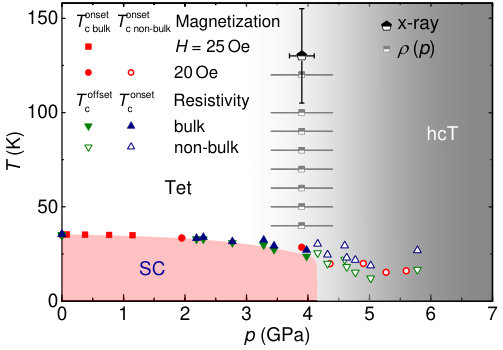 Figure 8
Peer Reviews
No public reviews on file for this paper yet. If you reviewed it on a platform where reviews are public (OpenReview, ICLR, NeurIPS, ICML), you can paste yours below so the community can read it here.
Videos
No videos yet. Explain this paper in a talk, walkthrough, or lecture? Add one.
Pressure induced half-collapsed-tetragonal phase in CaKFe4As4
Udhara S. Kaluarachchi1,2, Valentin Taufour2,∗, Aashish Sapkota1,2, Vladislav Borisov3, Tai Kong1,2,†, William R. Meier1,2, Karunakar Kothapalli2, Benjamin G. Ueland2, Andreas Kreyssig1,2, Roser Valentí3, Robert J. McQueeney1,2, Alan I. Goldman1,2, Sergey L. Bud’ko1,2, Paul C. Canfield1,2
1Department of Physics and Astronomy, Iowa State University, Ames, Iowa 50011, USA
2Ames Laboratory, U.S. DOE, Iowa State University, Ames, Iowa 50011, USA
3Institute of Theoretical Physics, Goethe University Frankfurt am Main, D-60438 Frankfurt am Main, Germany
Abstract
We report the temperature-pressure phase diagram of CaKFe4As4 established using high pressure electrical resistivity, magnetization and high energy x-ray diffraction measurements up to 6 GPa. With increasing pressure, both resistivity and magnetization data show that the bulk superconducting transition of CaKFe4As4 is suppressed and then disappears at 4 GPa. High pressure x-ray data clearly indicate a phase transition to a collapsed tetragonal phase in CaKFe4As4 under pressure that coincides with the abrupt loss of bulk superconductivity near 4 GPa. The x-ray data, combined with resistivity data, indicate that the collapsed tetragonal transition line is essentially vertical, occuring at 4.0(5) GPa for temperatures below 150 K. Band structure calculations also find a sudden transition to a collapsed tetragonal state near 4 GPa, as As-As bonding takes place across the Ca-layer. Bonding across the K-layer only occurs for 12 GPa. These findings demonstrate a new type of collapsed tetragonal phase in CaKFe4As4: a half-collapsed-tetragonal phase.
Discovery of superconductivity in FeAs-based compounds Kamihara et al. (2008); Ren et al. (2008); Rotter et al. (2008a); Takahashi et al. (2008) opened a new chapter in high temperature superconductor research. Among them the Fe2As2 (=alkaline earth), so called 122 systems, gained attention Canfield and Bud’ko (2010); Ni and Bud’ko (2011) due to the ease of growing large, high-quality, single crystals and the relative simplicity of the structure. At ambient pressure, the parent compounds form in the ThCr2Si2-type structure and, in most cases, undergo structural and magnetic transitions upon lowering of the temperature Canfield and Bud’ko (2010); Ni and Bud’ko (2011). Application of pressure or chemical doping generally suppresses the structural/magnetic transitions and reveals superconductivity Canfield and Bud’ko (2010); Ni and Bud’ko (2011); Torikachvili et al. (2008a, b); Alireza et al. (2009); Kimber et al. (2009); Colombier et al. (2009); Sefat (2011). Although chemical substitution is an effective way to alter the lattice parameters and the density of states at the Fermi energy, it also introduces disorder that can effect the physics in uncontrollable ways. Therefore physical pressure is one of the cleaner ways to perturb these systems and understand their intertwined and competing phase transitions.
The Ca2+ ionic radius in Ca122 Canfield and Bud’ko (2010); Ni et al. (2008); Ronning et al. (2008) is the smallest of the 122 family and Ca122 is exceptionally sensitive to pressure Canfield and Bud’ko (2010); Torikachvili et al. (2008a); Kreyssig et al. (2008); Yu et al. (2009). Application of less than 0.5 GPa pressure suppresses the first order structural/magnetic transition and reveals a transition to a non-magnetic, collapsed-tetragonal phase Canfield and Bud’ko (2010); Torikachvili et al. (2008a); Kreyssig et al. (2008); Yu et al. (2009). In contrast, at ambient pressure K122 shows superconductivity with a relatively low Rotter et al. (2008b); Sasmal et al. (2008); Chen et al. (2009) without any structural/magnetic transition. The effect of pressure on K122 has attracted attention due to the unusual ”V-shaped” Tafti et al. (2013); Terashima et al. (2014); Taufour et al. (2014) pressure dependence of with a minimum in near 1.8 GPa. At higher pressures, a collapsed-tetragonal phase was observed for 16 GPa at room temperature Nakajima et al. (2015); Ying et al. (2015); Wang et al. (2016); Guterding et al. (2015).
Recently a new superconductor with a related, structure, CaFe4As4 (=K,Rb,Cs), was discovered by Iyo Iyo et al. (2016). Unlike a (Ca1-xKx)122 Wang et al. (2013) solid solution, which has the I4/ body-centered-tetragonal space group, CaKFe4As4 Iyo et al. (2016); Meier et al. (2016) has separate, unique crystallographic sites for the alkaline and alkaline-earth metals, and possesses in the primitive tetragonal P4/ space group. At ambient pressure, CaKFe4As4 shows bulk superconductivity below T_{\text{c}}$$\sim 35 K in zero applied field or below 700 kOe 900 kOe at low temperatures Meier et al. (2016). Initial pressure work up to 4 GPa Meier et al. (2016) has shown that is suppressed to 28.5 K by 3.9 GPa. To further determine and understand the - phase diagram of this system, higher-pressure studies are needed.
In this Letter we present resistivity, magnetization and structural measurements of CaKFe4As4 under pressures up to 6 GPa and find a half-collapsed-tetragonal (hcT) phase stabilized for 4 GPa. Above this pressure there is an 2.6 decrease in the -axis lattice parameter and an 0.4 increase in the -lattice parameter. This half-collapsed tetragonal phase transition coincides with the abrupt loss of bulk superconductivity in the magnetization and the resistance measurements. Band structure calculations show that, for 4 GPa, As-As bonding takes place across the Ca-layer with much higher pressures needed to cause such bonding to span the larger K-layer. Taken together CaKFe4As4 undergoes a simultaneous structural collapse and loss of superconductivity with As-As bond formation across the Ca- but not K- layers.
CaFe4As4 single crystals were grown using high-temperature solution growth technique described in Ref Meier et al., 2016. Temperature dependent magnetization and resistance were carried out using a Quantum Design(QD) Magnetic Property Measurement System(MPMS) and a QD Physical Property Measurement System(PPMS) respectively. The ac resistivity was measured by the standard four-probe method with the current in the plane. Four Pt wires, with diameters of 25 m, were soldered to the sample using a Sn:Pb-60:40 alloy. For the resistivity measurements, pressure was applied at a room temperature using a modified Bridgman cell Colombier and Braithwaite (2007) with a 1:1 mixture of -pentane:iso-pentane as a pressure medium Piermarini et al. (1973). The pressure was determined at low temperature by monitoring the superconducting transition temperature of Pb Bireckoven and Wittig (1988); Eiling and Schilling (1981). High pressure magnetization measurements were carried out using a moissanite anvil cell Alireza et al. (2007) with Daphne 7474 as a pressure medium Murata et al. (2008). The pressure was applied at a room temperature and the ruby fluorescence technique Piermarini et al. (1975) at 77 K was used to determine the pressure. See Supplemental Material Sup for further details.
High-energy x-ray diffraction measurements were performed on a six-circle diffractometer at end station 6-ID-D at the Advanced Photon Source, using an x-ray energy of = 100.33 keV and a beam size of 100100 m2. Single-crystal samples were loaded into a double-membrane-driven Sinogeikin et al. (2015) copper-beryllium diamond-anvil cell (DAC). Helium was used as the pressure-transmitting medium and loaded to a pressure of 0.7 GPa at 300 K. Ruby spheres and silver foil were also mounted in the DAC for pressure determination. The DAC was attached to the cold finger of a He closed-cycle refrigerator. Diffraction patterns were recorded using a MAR345 image plate detector positioned at 1.494 m from the sample position. The distance was determined from measurement of powder patterns of a CeO2 standard from the National Institute of Standards and Technology. The detector was operated with a pixel size of 100100 m2, and patterns were recorded while rocking the sample through two independent angles up to 3.6 about the axes perpendicular to the incident beam. The measurement was performed in the (H, K, H) scattering plane Sup .
In order to investigate the electronic and structural properties of CaKFe4As4, we performed density functional theory (DFT) relativistic calculations using the Vienna Ab initio Simulation Package (VASP) Kresse and Hafner (1993); Kresse and Furthmüller (1996a, b) with the projector-augmented wave (PAW) basis Blöchl (1994); Kresse and Joubert (1999) in the generalized-gradient approximation (GGA). In order to take into account, in the first approximation, the paramagnetic fluctuations that preserve the tetragonal symmetry of the lattice (), we consider a model with a “frozen”, twisted, long-range magnetic order which is one of the lowest-energy configurations with this symmetry. Pressure-dependent structures were obtained by fixing the components of the stress tensor to the given value (equal to the external pressure) and fully relaxing the lattice parameters and the internal atomic positions with the conjugate-gradient method Tomić et al. (2012, 2013); Dhaka et al. (2014). The integration over the irreducible Brillouin zone was realized on the -centered k-mesh Sup .
Figures 1 (a) - (b) show the zero-field-cooled (ZFC) magnetization data, , on single crystaline samples of CaKFe4As4 under pressure below 40 K. These data have been normalized to the ZFC data of a larger sample at ambient pressure Meier et al. (2016). The low field data in Fig. 1 (a) show a clear diamagnetic signal below . monotonically decreases with the pressure up to 3.9 GPa. Upon further increase of pressure, there is a broader and reduced diamagnetic anomaly below 20 K. The appearance of a small diamagnetic signal above 3.9 GPa can be related to non-bulk/filamentary superconductivity and can often be easily eliminated by the application of a small (1000 Oe ) Meier et al. (2016) magnetic field (Fig. 1 (b)) where the observation of a clear diamagnetic signal can be found only up to 3.9 GPa. This suggests non-bulk superconductivity for pressures above 3.9 GPa.
A similar decrease in the superconducting transition temperature is observed in the resistivity measurements under pressure (Fig. 1 (c)). The sharp superconducting transition found at low pressures becomes broadened at higher pressures. The superconducting transition temperature is parameterized by three different criteria, , and as shown by arrows in Fig. 1 (c) and its insets. In contrast to the loss of superconducting signature in , shows zero resistivity up to 5.78 GPa. This is due to the fact that resistivity measurements are known to be more susceptible to filamentary superconductivity, thus, application of a magnetic field helps to separate it from bulk superconductivity. The left and right insets of Fig 1 (c) show the temperature dependent resistivity under pressure for 0 Oe and 30 kOe fields. The clear observation of non-zero resistivity at 5.78 GPa at 30 kOe again confirms the non-bulk nature of the higher pressure superconductivity.
In order to determine the transition from bulk to non-bulk superconductivity in the electrical resistivity data we focus on the transition widths. The superconducting transition width, = , is broadened with the increase of pressure as illustrated by Fig. 1 (d), but this can be, in part, due to pressure inhomogeneities in the pressure medium, rather than represent any sort of phase transition. In order to search for a possible transition we compare zero field and moderate, but finite field ( = 30 kOe ) resistive transition width data. Any broadening due to inhomogeneous pressure should be equally present in the = 0 Oe and = 30 kOe data. To determine the field contribution of the transition width, we calculated the difference of the transition widths, (inset of Fig. 1 (d)). remains constant until near 4 GPa and then starts to increase significantly for pressures above that. This critical pressure is consistent with the pressure at which the magnetization data shows a loss of bulk superconductivity. Although broadening of the superconducting transition in field can be also due to the thermal fluctuation of the vortex system, the observation, in magnetization data, of a loss of diamagnetic signal at 1000 Oe eliminates this possibility.
The data in Fig. 1 can be summarized in a pressure dependence of phase diagram as shown in Fig. 2. The solid and open symbols represent the bulk and non-bulk superconductivity. Bulk superconductivity persists up to a critical pressure of 4 GPa. The faint signatures of superconductivity appearing above 4 GPa in this phase diagram are due to strain-induced, filamentary superconductivity. The sudden and discontinuous disappearance of superconductivity for 4 GPa is very suggestive of what is found for Ca(Fe1-xCox)2As2 both as a function of Ran et al. (2012) and as a function of Gati et al. (2012), i.e. superconductivity suddenly and discontinuously disappears when a collapsed tetragonal, non-magnetic phase is stabilized
To further pursue these findings, we examined the pressure dependence of the lattice parameters from the diffraction study for temperatures near 130 K (Fig. 3 (a)). We observed an abrupt enhancement of the -lattice parameter simultaneous to a significant reduction of the -lattice parameter near 4 GPa without any crystallographic symmetry change. This indicates a pressure induced phase transition from a tetragonal to a collapsed tetragonal phase, similar to the observation in other 122 systems Kreyssig et al. (2008); Goldman et al. (2009); Nakajima et al. (2015); Ying et al. (2015); Uhoya et al. (2010a); Mittal et al. (2011); Yu et al. (2014); Uhoya et al. (2010b, 2011a, 2011b). The change of the -lattice parameter is about 0.016Å () while the -lattice parameter decreases by 0.31Å ().
Band structure calculations manifest a very similar expansion in of 0.015Å () while drops by 0.17Å () at the critical pressure of 4 GPa as shown in Fig. 3 (b). As can be seen in Fig. 2, this collapsed-tetragonal transition point is positioned directly above the disappearance of bulk superconductivity at lower temperatures.
Analysis of the orbital-resolved band structures at different pressures near this transition confirms its collapsed nature Sup . The As antibonding molecular orbitals shift above the Fermi energy upon crossing 4 GPa (Figs. S3 in the Supplemental Material Sup ). This is in accordance with a jump-like reduction of the As-As bond length across the Ca layer by (Fig. 3(c)) and an increase in the As- electron density between the two As ions (Fig. S3 in the Supplemental Material Sup ). A second collapse associated with As-As bonding across the K-layer is found for 12 GPa Sup . The transition at 4 GPa then is associated with a half-collapsed-tetragonal (hcT) phase.
Whereas our scattering data point is for = 130(25) K, the band structure calculations are formally for = 0 K and our data is for 30 K. This begs the question of whether a half-collapsed-tetragonal phase line can be detected for 4 GPa below 150 K. Figures 4 (a) - (b) show temperature dependent resistivity, under various pressures, data sets measured from 300 K to 1.8 K. At ambient pressure CaKFe4As4 shows metallic behavior and becomes superconducting below 35 K. With increase of pressure, the resistivity at room temperature monotonically decrease up to 5.6 GPa. However, the resistivity data at lower temperature, in the normal state ( 40 K), show a non-monotonic pressure evolution. No clear anomaly is visible in the temperature dependent resistivity, suggesting that any phase transition line will be near vertical. To see this transition line more clearly, we plotted resistivity vs pressure at fixed temperatures (Figs. 4 (c) - (d)). At higher temperatures, the resistivity monotonically decreases with pressure. However, below 160 K we see a jump in resistivity developing near 4 GPa. This can be related to the collapsed tetragonal phase transition as seen in high pressure x-ray measurement. Similar features in the resistivity have been observed in K122 Wang et al. (2016) with no clear features in data, but V-shape minimum in ().
The composite phase diagram of CaKFe4As4 is shown in the Fig. 2. The () data inferred from the Figs. 4 (c) - (d) ( being mid point of rise in () data and error bars being width of rise) clearly links the higher-temperature x-ray data to the lower temperature loss of superconductivity and the = 0 band structure results. Figure 2 shows that the transition of Tet hcT is nearly vertical.
To summarize, the bulk superconducting transition temperature of tetragonal CaKFe4As4 is gradually suppressed under pressure up to 4 GPa and then discontinuously disappears. High pressure x-ray measurements combined with band structure calculations identify the phase transition from a tetragonal to a half-collapsed tetragonal phase near 4 GPa. From the diffraction study at 130 K, we find an abrupt enhancement in a-lattice parameter () and a reduction in c-lattice parameter () near 4 GPa. Band structure calculations show that the first collapse occurs on across the Ca-layer near 4 GPa followed by a second collapse, on across the K-layer, at higher pressures. Both transitions are accompanied by the typical enhancement of the corresponding As-As bonding. Although only half of the As-As bonding is collapsing at 4 GPa, when the superconducting state is fully suppressed.
We would like to acknowledge discussions with Peter Hirschfeld, Rafael Fernandes, Milan Tomić, Wageesha Jayasekara and thank Daniel Guterding for providing a code Guterding (2013) to generate the As- electron density maps from the Wannier function analysis and D. S. Robinson for support during the x-ray experiments. Experimental work was supported by the U.S. Department of Energy (DOE), Office of Science, Basic Energy Sciences, Materials Science and Engineering Division and was performed at the Ames Laboratory, which is operated for the U.S. DOE by Iowa State University under contract No. DE-AC02-07CH11358. W. M. were supported by the Gordon and Betty Moore Foundations EPiQS Initiative through Grant GBMF4411. V. T. is supported by Ames Laboratory’s laboratory-directed research and development (LDRD) funding for magnetization measurements under pressure. This research used resources of the Advanced Photon Source, a U.S. Department of Energy (DOE) Office of Science User Facility operated for the DOE Office of Science by Argonne National Laboratory under Contract No. DE-AC02-06CH11357. The theoretical work was financially supported by the German Research Foundation (Deutsche Forschungsgemeinschaft) through grant SFB/TR49. The computer time was allotted by the center for supercomputing (CSC) in Frankfurt.
Current affiliation: Department of Physics, University of California, Davis, California 95616, USA.
Current affiliation: Department of Chemistry, Princeton University, Princeton, NJ 08544, USA.
I Supplementary Material
II Experimental Methods
Single crystals were synthesized by the high-temperature solution growth technique described in Ref Meier et al., 2016. The experiments under pressure were performed on two samples (samples 1 and 2) in magnetization cells and on another two samples (samples 3 and 4) in resistivity cells. Temperature dependent magnetization and resistivity were carried out using a Quantum Design(QD) Magnetic Property Measurement System(MPMS) and a QD Physical Property Measurement System(PPMS) respectively.
The ac resistivity ( = 17 Hz) was measured by the standard four-probe method with the current ( = 1 mA) in the plane. The samples used for the resistivity measurement typically had dimension of 50010020 m3 (l$$\times$$w$$\times$$t). Four Pt wires, with diameters of 25 m, were soldered to the sample using a Sn:Pb-60:40 alloy. A modified Bridgman cell Colombier and Braithwaite (2007) was used to generate pressure for the resistivity measurements. A 1:1 mixture of -pentane:iso-pentane was used as a pressure medium Piermarini et al. (1973); the solidification of this medium occurs around 6-7 GPa at room temperature Piermarini et al. (1973); Klotz et al. (2009); Tateiwa and Haga (2009); Kim et al. (2011); Torikachvili et al. (2015). The pressure was determined at low temperature by monitoring the superconducting transition temperature of Pb Bireckoven and Wittig (1988); Eiling and Schilling (1981).
High pressure magnetization measurements were carried out using a moissanite anvil cell Alireza et al. (2007). Samples with dimensions of 10010020 m3 were loaded into the cell and Daphne 7474 was used as a pressure medium Murata et al. (2008); the solidification of this medium occurs around 3.7 GPa at room temperature Murata et al. (2008). The pressure was determined by the ruby fluorescence technique Piermarini et al. (1975) at 77 K. We first collected the raw SQUID voltage of a hand-tight pressure cell with the gasket, pressure medium and ruby chip. This background was measured between 10 to 40 K in steps of 0.5 K at 20 Oe and 1000 Oe with a demagnetization prior each change of magnetic field. A similar set of measurements were performed with a sample pressurized in the cell. For all sets of measurements, 3 scans (each 32 points over 4 cm) were recorded and the average was calculated. A point-by-point subtraction of the raw SQUID voltage background was done with the help of a computer program that allows for the rejection of non-reproducible scans. A thermalization time of one to two minutes was necessary to obtain reproducible scans due to the rather large mass of the pressure cell. A fit of the resulting signal was used to extract the magnetization Quantum Design . To correct for a small shift in position between the various sets of measurements (various pressures and background), a shift smaller than 1 mm was used. The shift was determined so as to give the best fit of the sample signal at the lowest temperature (for the largest superconducting signal from the sample). The position of the sample obtained from this scan was then kept as a fixed parameter for the measurements at various temperature and magnetic field values.
High-energy x-ray diffraction measurements were performed on a six-circle diffractometer at end station 6-ID-D at the Advanced Photon Source, using an x-ray energy of = 100.33 keV and a beam size of 100100 m2. Single-crystal samples with dimensions of 404025 m3 were loaded into a double-membrane-driven Sinogeikin et al. (2015) copper-beryllium diamond-anvil cell (DAC). Helium was used as the pressure-transmitting medium and loaded to a pressure of 0.7 GPa at 300 K. Ruby spheres and silver foil were also mounted in the DAC for pressure determination. The DAC was attached to the cold finger of a He closed-cycle refrigerator, and measurements for various values of for = 130(25) K. At this temperature the He pressure medium solidifies near 3.5 GPa Maury and Besson (1979); Datchi et al. (2000). As a result there can be some broadening of structural phase transitions for higher pressures than this. Diffraction patterns were recorded using a MAR345 image plate detector positioned at 1.494 m from the sample position. The distance was determined from measurement of powder patterns of a CeO2 standard from the National Institute of Standards and Technology. The detector was operated with a pixel size of 100100 m2, and patterns were recorded while rocking the sample through two independent angles up to 3.6 about the axes perpendicular to the incident beam. The measurement was performed in the (H, K, H) scattering plane. It should be noted that, although there was finite temperature drift during measurements under pressure (e.g. = 130(25) K), the observed behavior in lattice parameters (Fig. 3 (a)) is solely due to pressure rather than any possible temperature variation given that the change in both lattice parameters in the above mentioned temperature range at ambient pressure is almost negligible Meier et al. (2016)(temperature dependence of and lattice parameters at 130 K are 410*-5* Å K*-1* and 6.810*-4* Å K*-1* respectively). Moreover, the -lattice parameter should decrease with the decrease in temperature.
III Computational details and results
In order to investigate the electronic and structural properties of CaKFe4As4, we performed density functional theory (DFT) relativistic calculations using the Vienna Ab initio Simulation Package (VASP) Kresse and Hafner (1993); Kresse and Furthmüller (1996a, b) with the projector-augmented wave (PAW) basis Blöchl (1994); Kresse and Joubert (1999) in the generalized-gradient approximation (GGA). In order to take into account, in the first approximation, the paramagnetic fluctuations that preserve the tetragonal symmetry of the lattice (), we consider a model with a “frozen”, twisted, long-range magnetic order which is one of the lowest-energy configurations with this symmetry (see discussion below). Pressure-dependent structures were obtained by fixing the components of the stress tensor to the given value (equal to the external pressure) and fully relaxing the lattice parameters and the internal atomic positions with the conjugate-gradient method Tomić et al. (2012, 2013); Dhaka et al. (2014). The integration over the irreducible Brillouin zone was realized on the -centered k-mesh.
III.1 A) Magnetic configuration
Since the experimentally observed ambient pressure tetragonal CaKFe4As4 manifests no signature of a structural or magnetic transition but does manifest a clear superconducting transition near 35 K, we consider first the influence of pressure on the tetragonal non-magnetic phase. In addition, given that paramagnetic fluctuations generally play a role for the structural features of iron pnictides, we also simulated such fluctuations, to a first approximation, by imposing a “frozen” long-range magnetic order which, on the one hand, assists the structural collapse and, on the other hand, preserves the tetragonal symmetry of the crystal lattice. In this respect, the usual stripe-ordered phase is not suitable for these simulations, as it breaks the tetragonal symmetry. Recent works Fernandes et al. (2016); Scherer et al. (2016) propose a few candidates for the magnetic order in iron pnictides, including spin vortex and charge-spin density wave orders, which have the symmetry opposed to the conventional order often found in the AFe2As2 compounds. In addition to these, we considered a few other magnetic configurations, including the checkerboard arrangement (Fig. S1 (a)), and found that one of the lowest-energy states is a twisted phase with Fe moments lying in-plane within each FeAs layer (Fig. S1 (b)). While the Fe moments in each FeAs layer are twisted around the c crystallographic axis, the nearest Fe neighbors from the adjacent layer are oriented in the opposite direction. Here, the local symmetry of each Fe site is orthorhomic, since the spins are oriented either along the a or along the b axis, while the overall unit cell symmetry is tetragonal. Marginal deviations () from the 90°-tetragonal lattice are observed in our calculations most likely due to the spin-lattice coupling. We note that, if the structure is not restricted to the tetragonal symmetry class, the stripe phase lowers the energy. Nevertheless, in order to agree with the experimentally determined crystal symmetry of CaKFe4As4 Meier et al. (2016), we study in more details the proposed twisted phase (Fig. S1 (b)) as an approximate model of paramagnetic fluctuations.
III.2 B) Magnetic collapse
The long-range magnetic order in our simulations is necessary to reproduce the main features of the experimentally discovered collapse transition around 4 GPa. However, the imposition of an artificial magnetic order in CaKFe4As4, which in reality has a superconducting ground state with no known, long range magnetic order, creates an additional feature at higher pressures which is solely due to the theoretically imposed long-range order and should not be (and is not) observed experimentally. Upon crossing the transition point at 4 GPa, the Fe magnetic moments become gradually suppressed and vanish completely at 5.2 GPa creating a further drop of the c parameter (Fig. S2 (a)). For the magnetic and non-magnetic optimized structures, we calculated the pressure-dependent enthalpies with the same VASP parameters as described in the main text and analyzed the enthalpy difference between the two phases, in order to find a first-order transition point. This enthalpy analysis shows that the magnetic order is, in fact, destabilized already after 4.5 GPa, where the first-order transition between the twisted magnetic and the non-magnetic phase occurs. One can argue that the pressure range between 4.5 GPa and 5.2 GPa is the metastability region for the studied non-collinear magnetic configuration (indicated by the light-shaded region in Fig. S2 (a)).
To emphasize the role of the in-plane Fe spin orientation, we compare this twisted-order model to another configuration preserving the tetragonal symmetry, namely, the collinear checkerboard magnetic arrangement (Fig. S1 (a)) in terms of its evolution under pressure. Our simulations of the collinear state revealed no abrupt changes in the lattice parameters within the same pressure range and show only gradual decrease of Fe magnetic moments upon reaching 5 GPa. The checkerboard model is, therefore, not suitable for describing the structural transitions in the CaKFe4As4 compound.
III.3 C) Half-collapse transitions near Ca and K
For selected pressures, the non-spin polarized band structure was calculated for the optimized lattice parameters and As positions using the all-electron full-potential localized orbitals basis set (FPLO) code Koepernik and Eschrig (1999). Analysis of the As-orbital weight near the Fermi energy allowed the identification of the respective collapse transitions. In particular, upon reaching the pressure of 4 GPa, the antibonding As- molecular orbital near Ca is shifted above the Fermi level (Fig. S3 (a)) and, as a result, the corresponding As-As bonding becomes stronger. To illustrate this effect in the real space, we calculated the electron density maps associated to these orbitals by means of the tricubic interpolation Lekien and Marsden (2005); Guterding (2013) of the Wannier functions obtained using the FPLO code Koepernik and Eschrig (1999). On these maps, clear enhancement of the electron density between the two As ions is observed around 4 GPa (Fig. S3 (b)). As expected, further increase of pressure produces no qualitative changes in the orbital picture for this spatial region.
For As-As bonding across the K layer, on the other hand, the collapse occurs at much higher pressures, around 12 GPa. This fact is evidenced by the band structure plots (Fig. S3 (c)) where the As-derived molecular orbital near K crosses the Fermi level upon increasing pressure. Figure S3 (d) makes it abundantly apparent that there is no qualitative change in As-As bonding across the K-layer anywhere near 4 GPa. Instead, the two As orbitals only clearly overlap across the K layer for 12.4 GPa (Fig. S3 (d)). Thus, our computational results clearly indicate that the 4 GPa transition is associated with a half-collapsed-tetragonal phase being stabilized.
The reference list from the paper itself. Each links out to its DOI / PubMed record.
- 1Kamihara et al. (2008) Y. Kamihara, T. Watanabe, M. Hirano, and H. Hosono, J. Am. Chem. Soc. 130 , 3296 (2008) . · doi ↗
- 2Ren et al. (2008) Z.-A. Ren, G.-C. Che, X.-L. Dong, J. Yang, W. Lu, W. Yi, X.-L. Shen, Z.-C. Li, L.-L. Sun, F. Zhou, and Z.-X. Zhao, EPL 83 , 17002 (2008) .
- 3Rotter et al. (2008 a) M. Rotter, M. Tegel, and D. Johrendt, Phys. Rev. Lett. 101 , 107006 (2008 a) . · doi ↗
- 4Takahashi et al. (2008) H. Takahashi, K. Igawa, K. Arii, Y. Kamihara, M. Hirano, and H. Hosono, Nature 453 , 376 (2008) . · doi ↗
- 5Canfield and Bud’ko (2010) P. C. Canfield and S. L. Bud’ko, Annu. Rev. Condens. Matter Phys. 1 , 27 (2010) . · doi ↗
- 6Ni and Bud’ko (2011) N. Ni and S. L. Bud’ko, MRS Bulletin 36 , 620 (2011) . · doi ↗
- 7Torikachvili et al. (2008 a) M. S. Torikachvili, S. L. Bud’ko, N. Ni, and P. C. Canfield, Phys. Rev. Lett. 101 , 057006 (2008 a) . · doi ↗
- 8Torikachvili et al. (2008 b) M. S. Torikachvili, S. L. Bud’ko, N. Ni, and P. C. Canfield, Phys. Rev. B 78 , 104527 (2008 b) . · doi ↗