The Grism Lens-Amplified Survey from Space (GLASS). XI. Detection of CIV in Multiple Images of $z=6.11$ Ly$\alpha$ Emitter Behind RXCJ2248.7-4431
Kasper B. Schmidt, Kuang-Han Huang, Tommaso Treu, Austin Hoag, Marusa, Bradac, Alaina L. Henry, Tucker A. Jones, Charlotte Mason, Matt Malkan,, Takahiro Morishita, Laura Pentericci, Michele Trenti, Benedetta Vulcani and, Xin Wang

TL;DR
This study reports the first detection of CIV emission in a $z=6.11$ galaxy, providing insights into the ionization state and properties of early galaxies during reionization, using space-based slitless spectroscopy.
Contribution
It presents the first detection of CIV emission in a high-redshift galaxy at $z=6.11$, offering new constraints on galaxy ionization and metallicity during reionization.
Findings
CIV emission detected at 3-5σ in two images of the galaxy.
No significant CIII] emission detected, with EW<20Å.
Galaxy has a young stellar population, high ionization, and low metallicity.
Abstract
The CIII] and CIV rest-frame UV emission lines are powerful probes of the ionizations states of galaxies. They have furthermore been suggested as alternatives for spectroscopic redshift confirmation of objects at the epoch of reionization (), where the most frequently used redshift indicator, Ly, is attenuated by the high fraction of neutral hydrogen in the inter-galactic medium. However, currently only very few confirmations of carbon UV lines at these high redshifts exist, making it challenging to quantify these claims. Here, we present the detection of CIV1548,1551\AA\ in \HST\ slitless grism spectroscopy obtained by GLASS of a Ly emitter at multiply imaged by the massive foreground galaxy cluster RXJ2248. The CIV emission is detected at the 3--5 level in two images of the source, with marginal detection in two other images. We do…
Click any figure to enlarge with its caption.
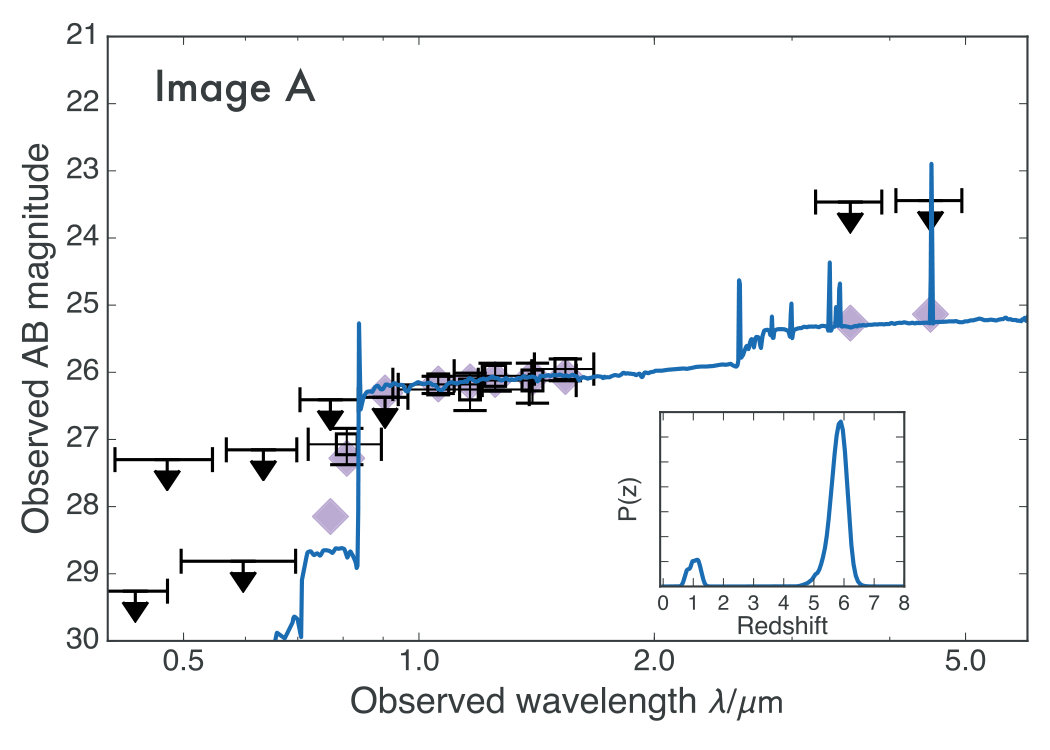 Figure 1
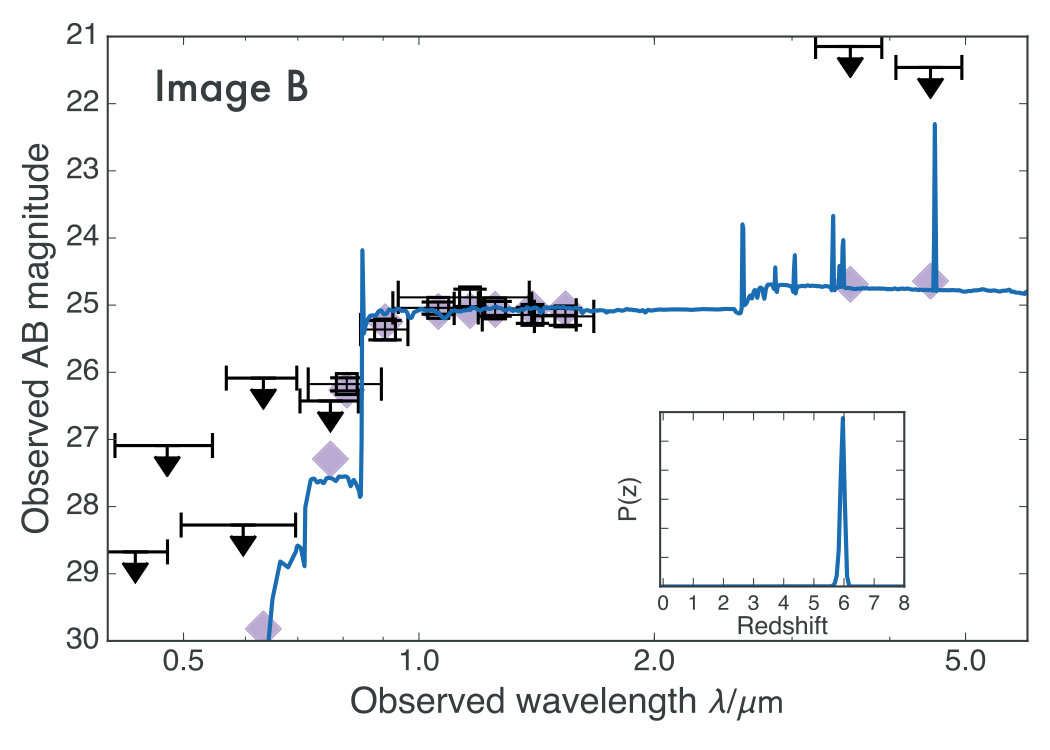 Figure 2
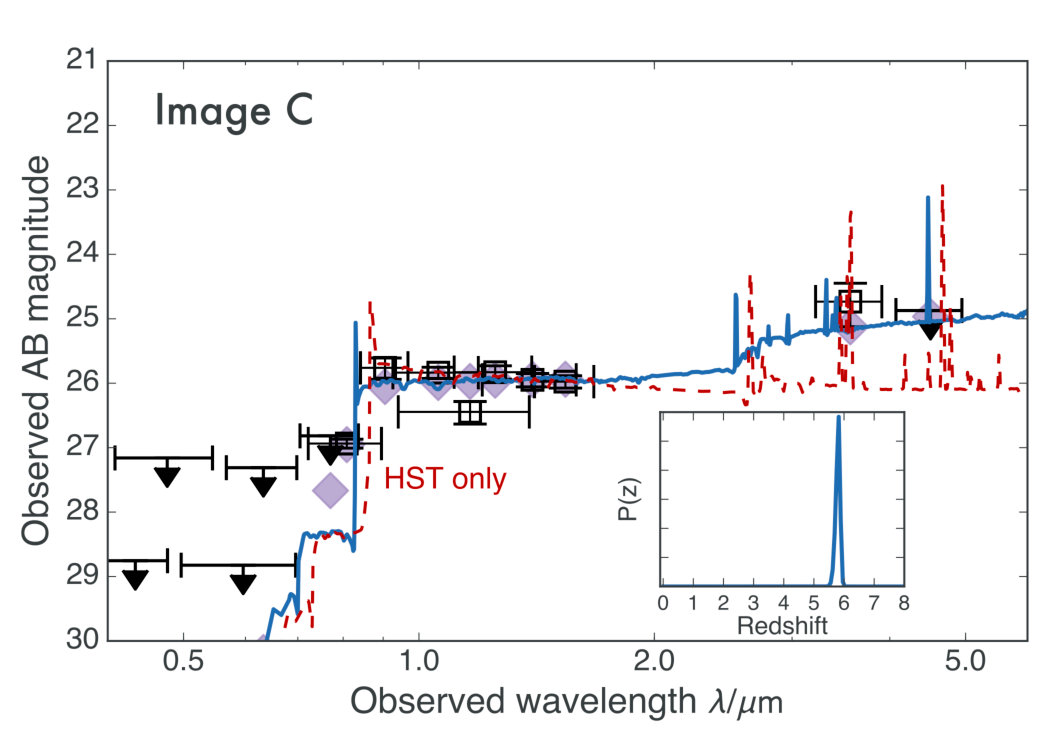 Figure 3
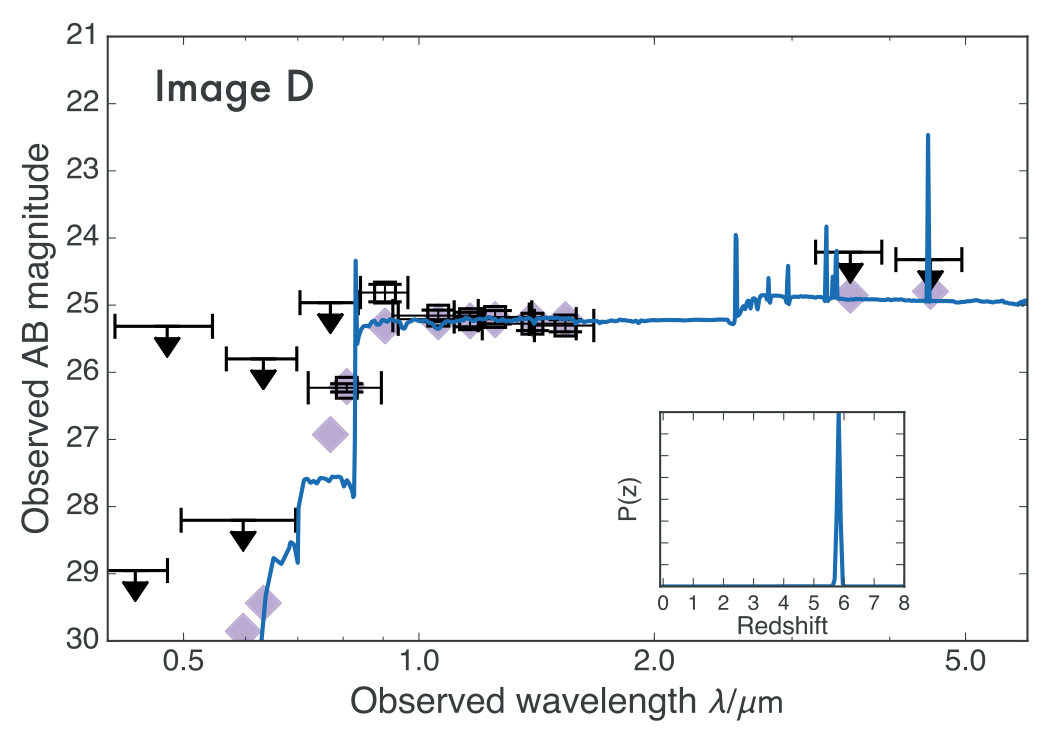 Figure 4
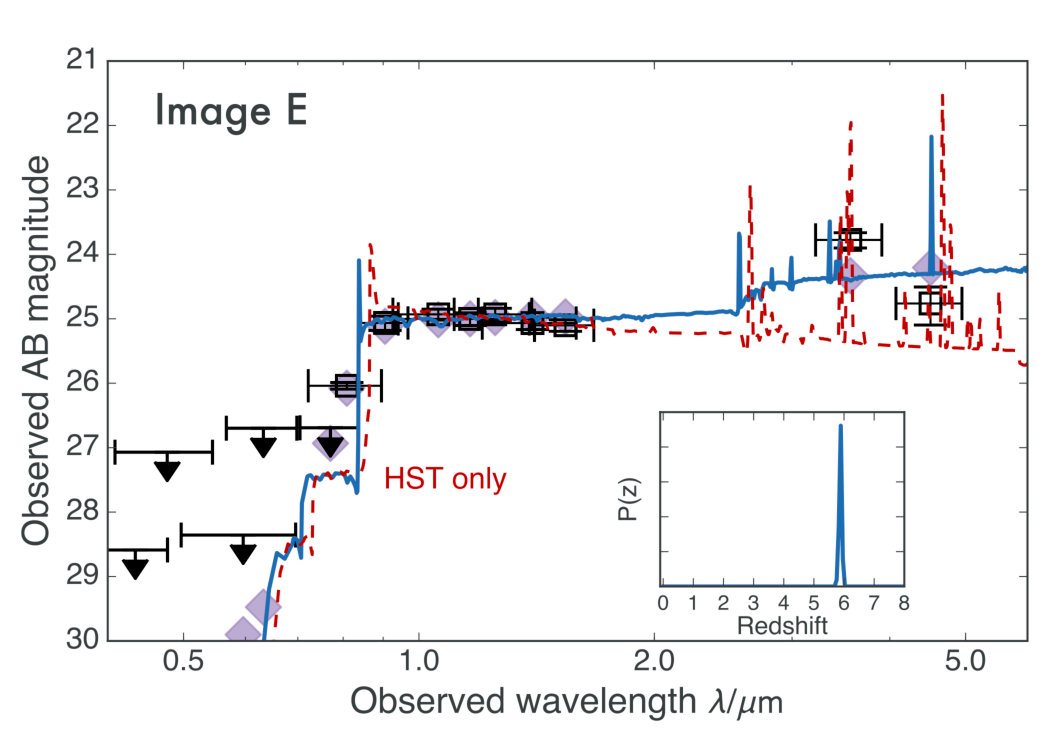 Figure 5
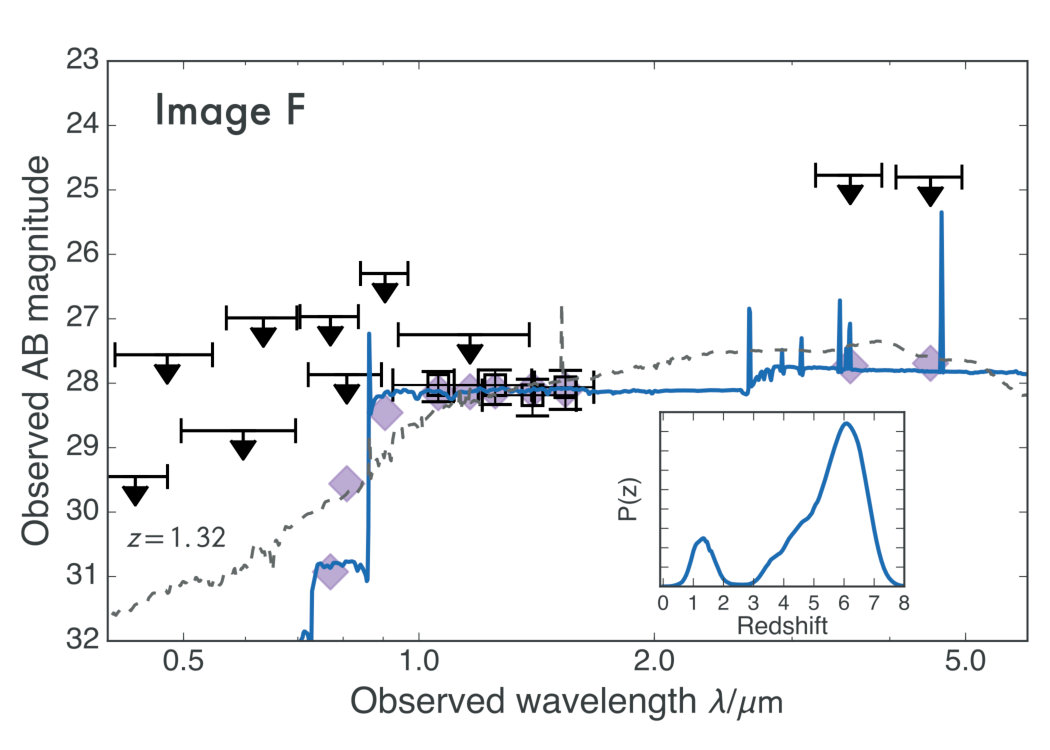 Figure 6
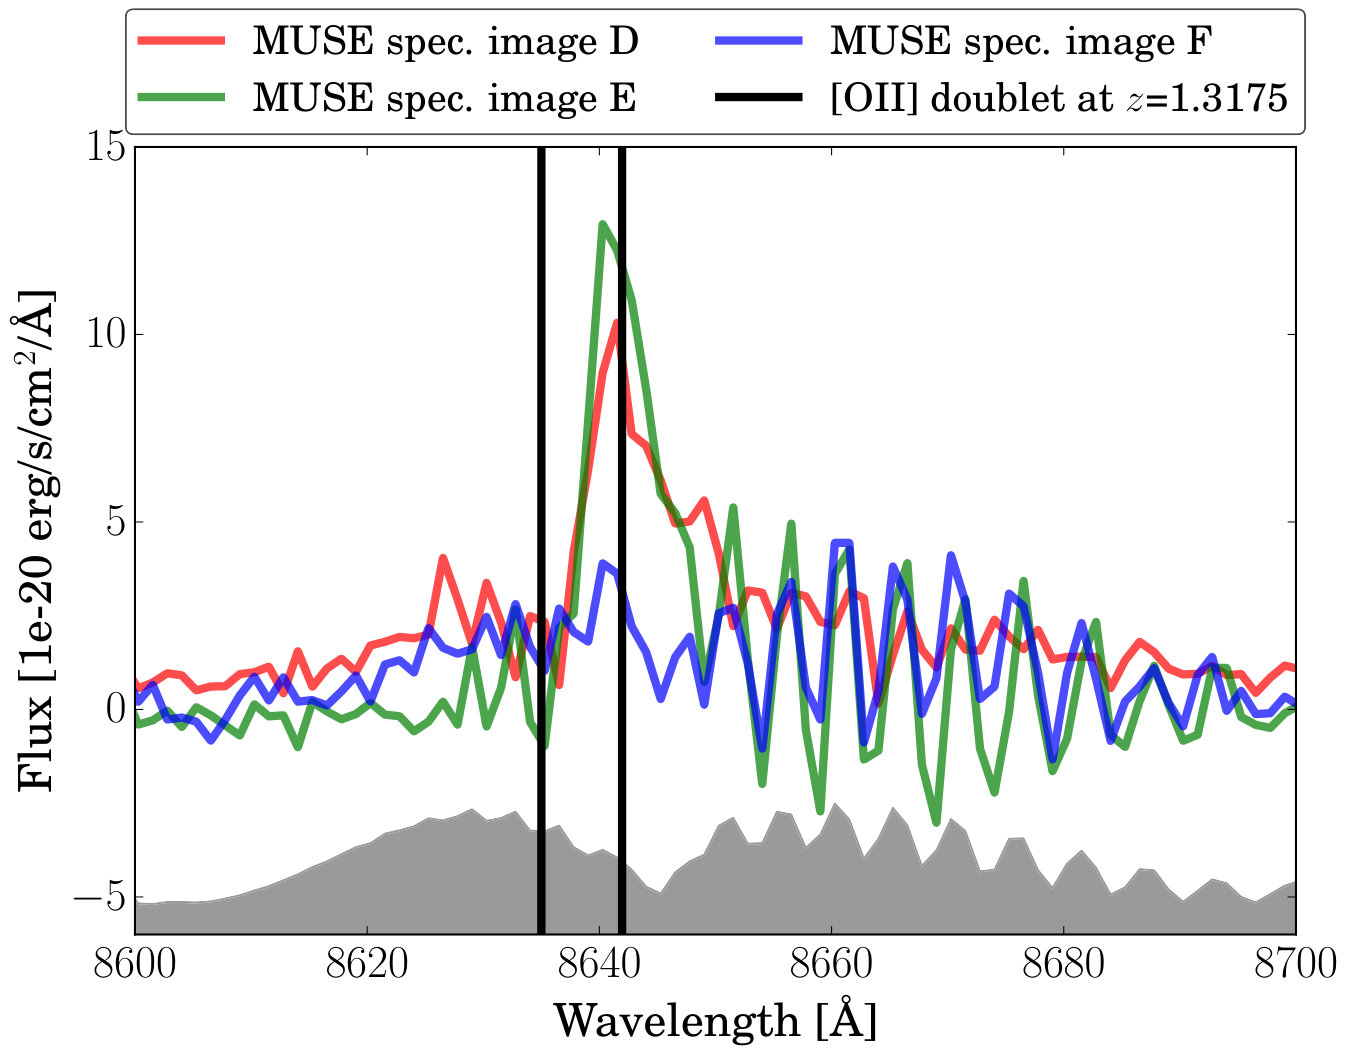 Figure 7
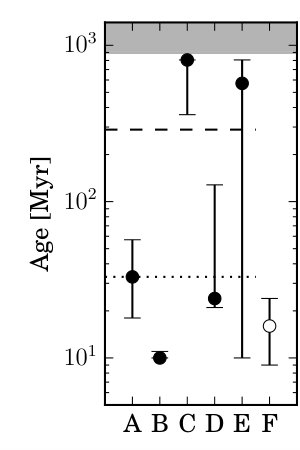 Figure 8
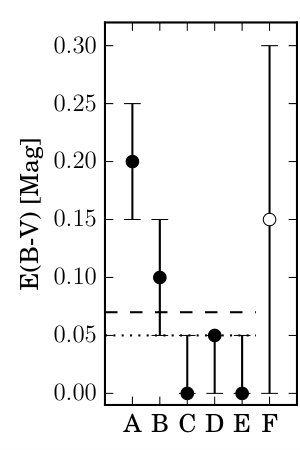 Figure 9
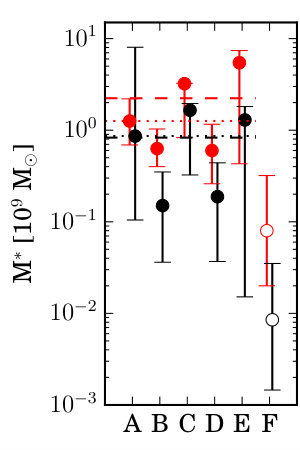 Figure 10
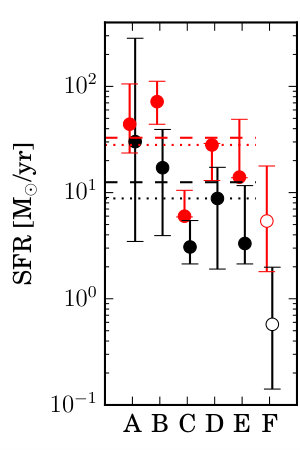 Figure 11
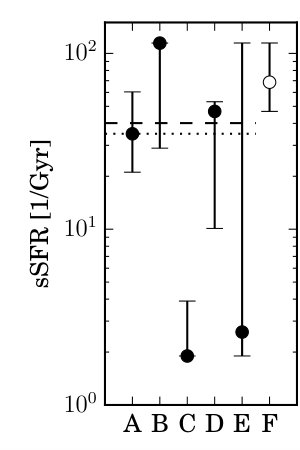 Figure 12
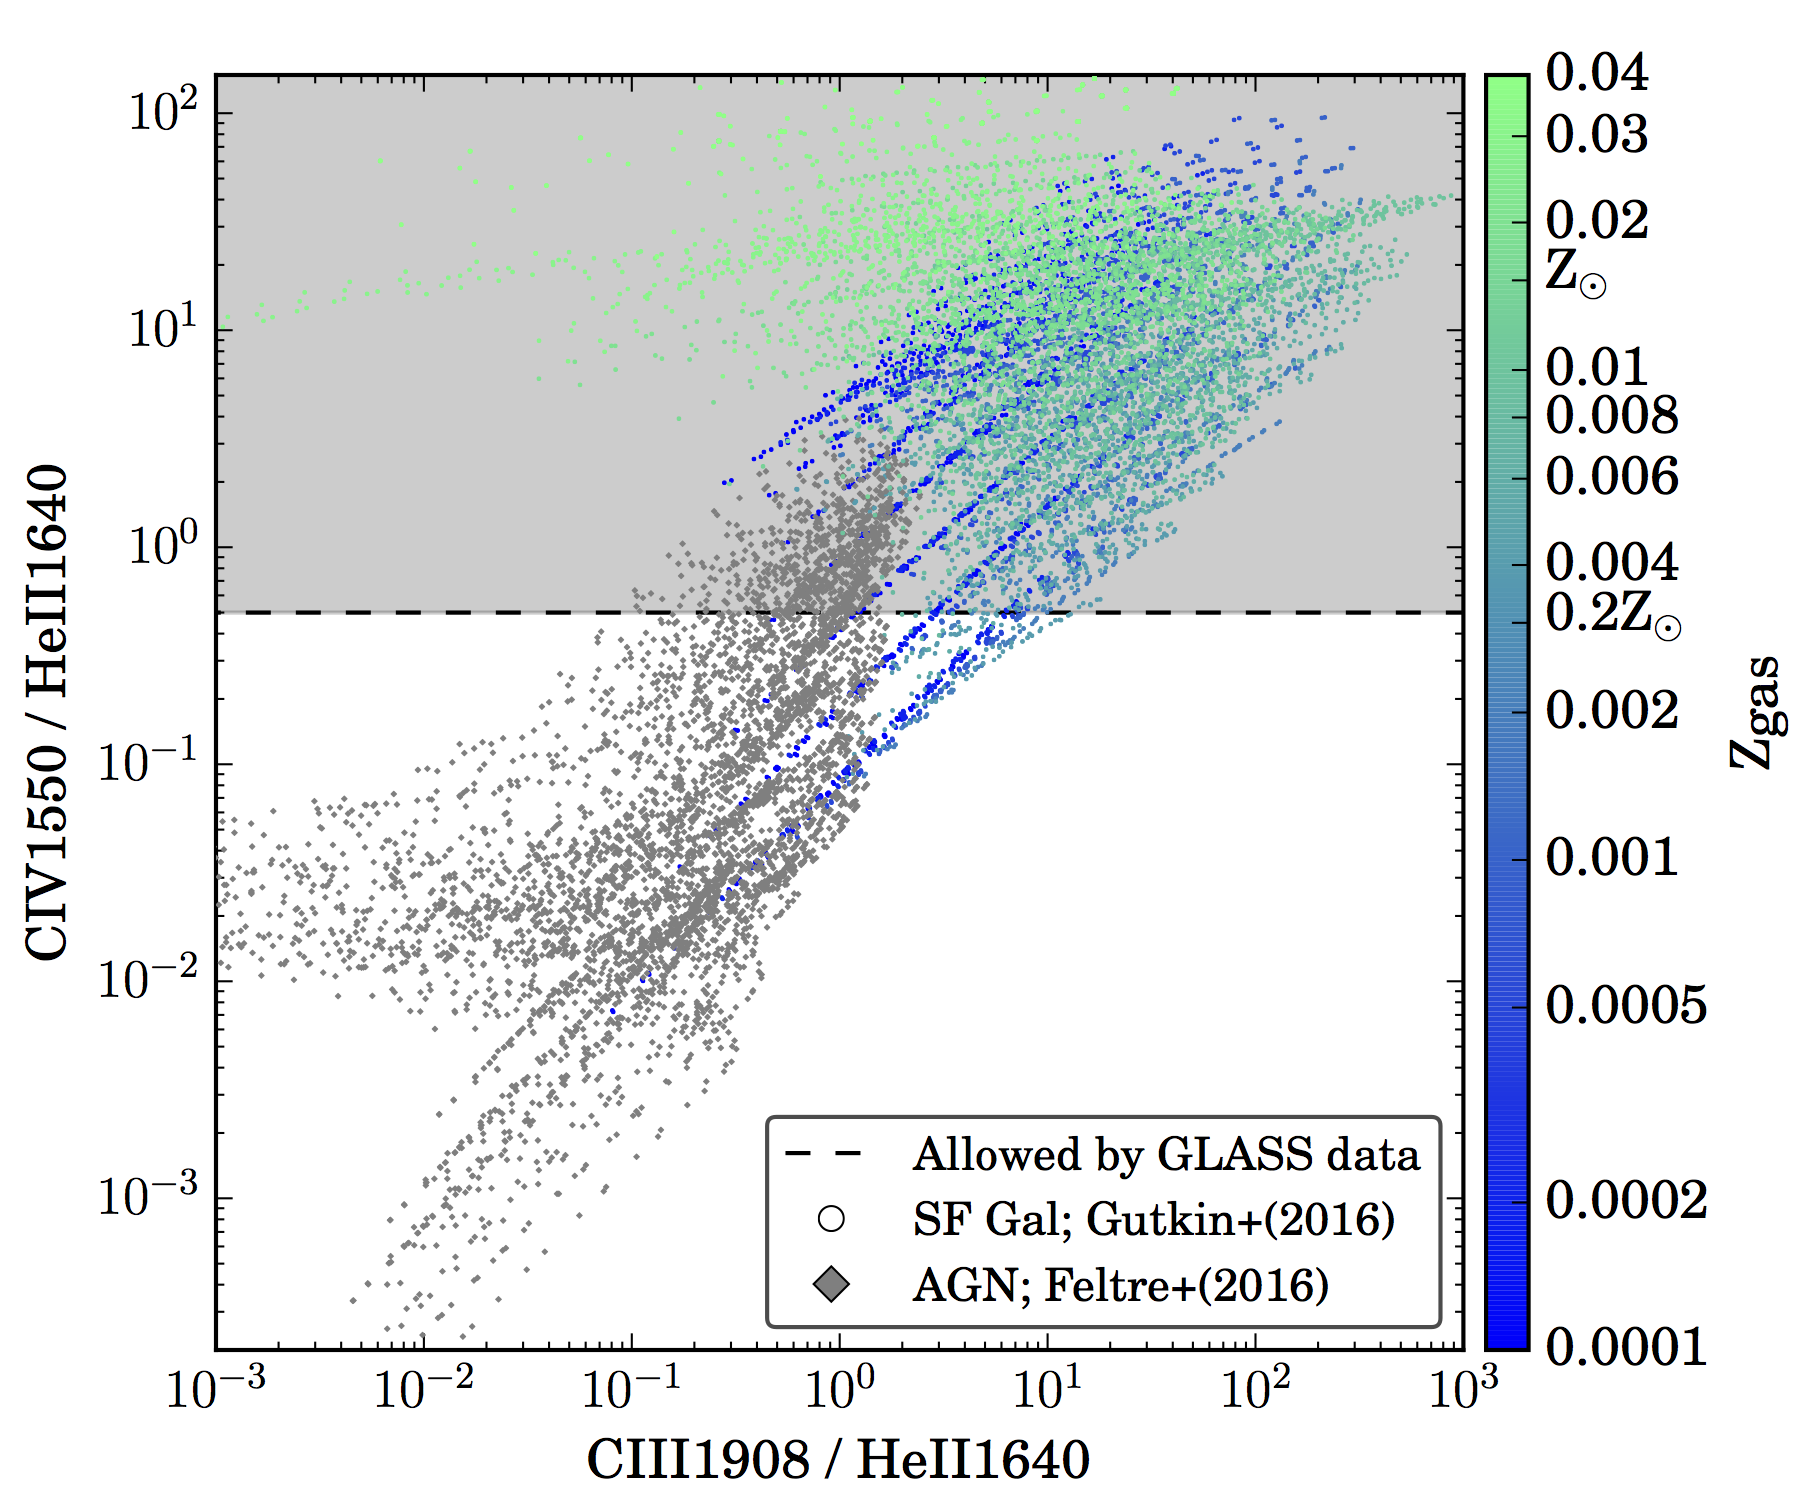 Figure 13
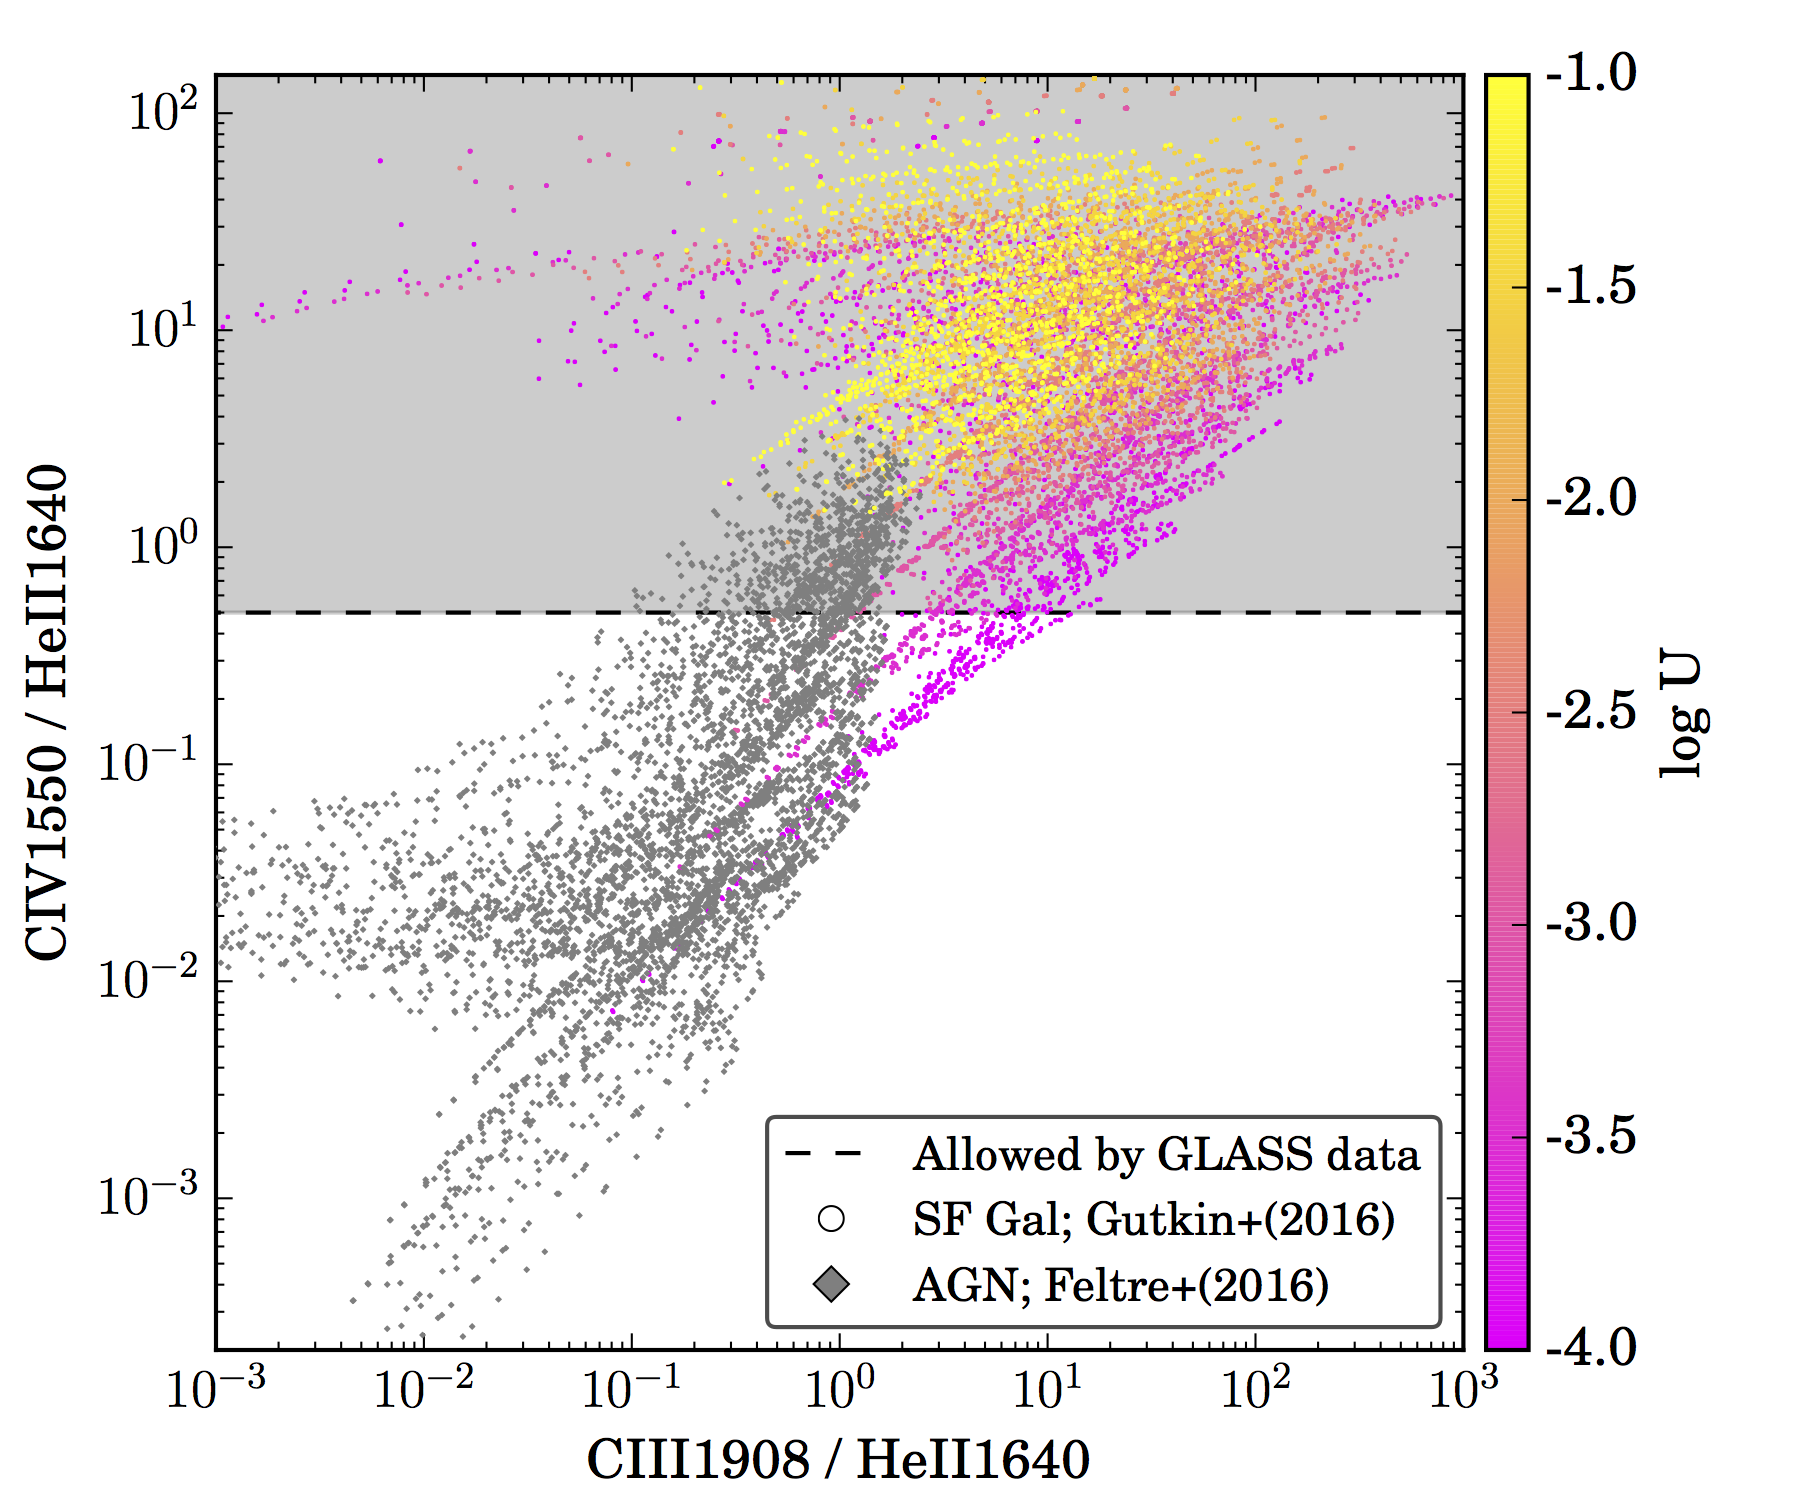 Figure 14
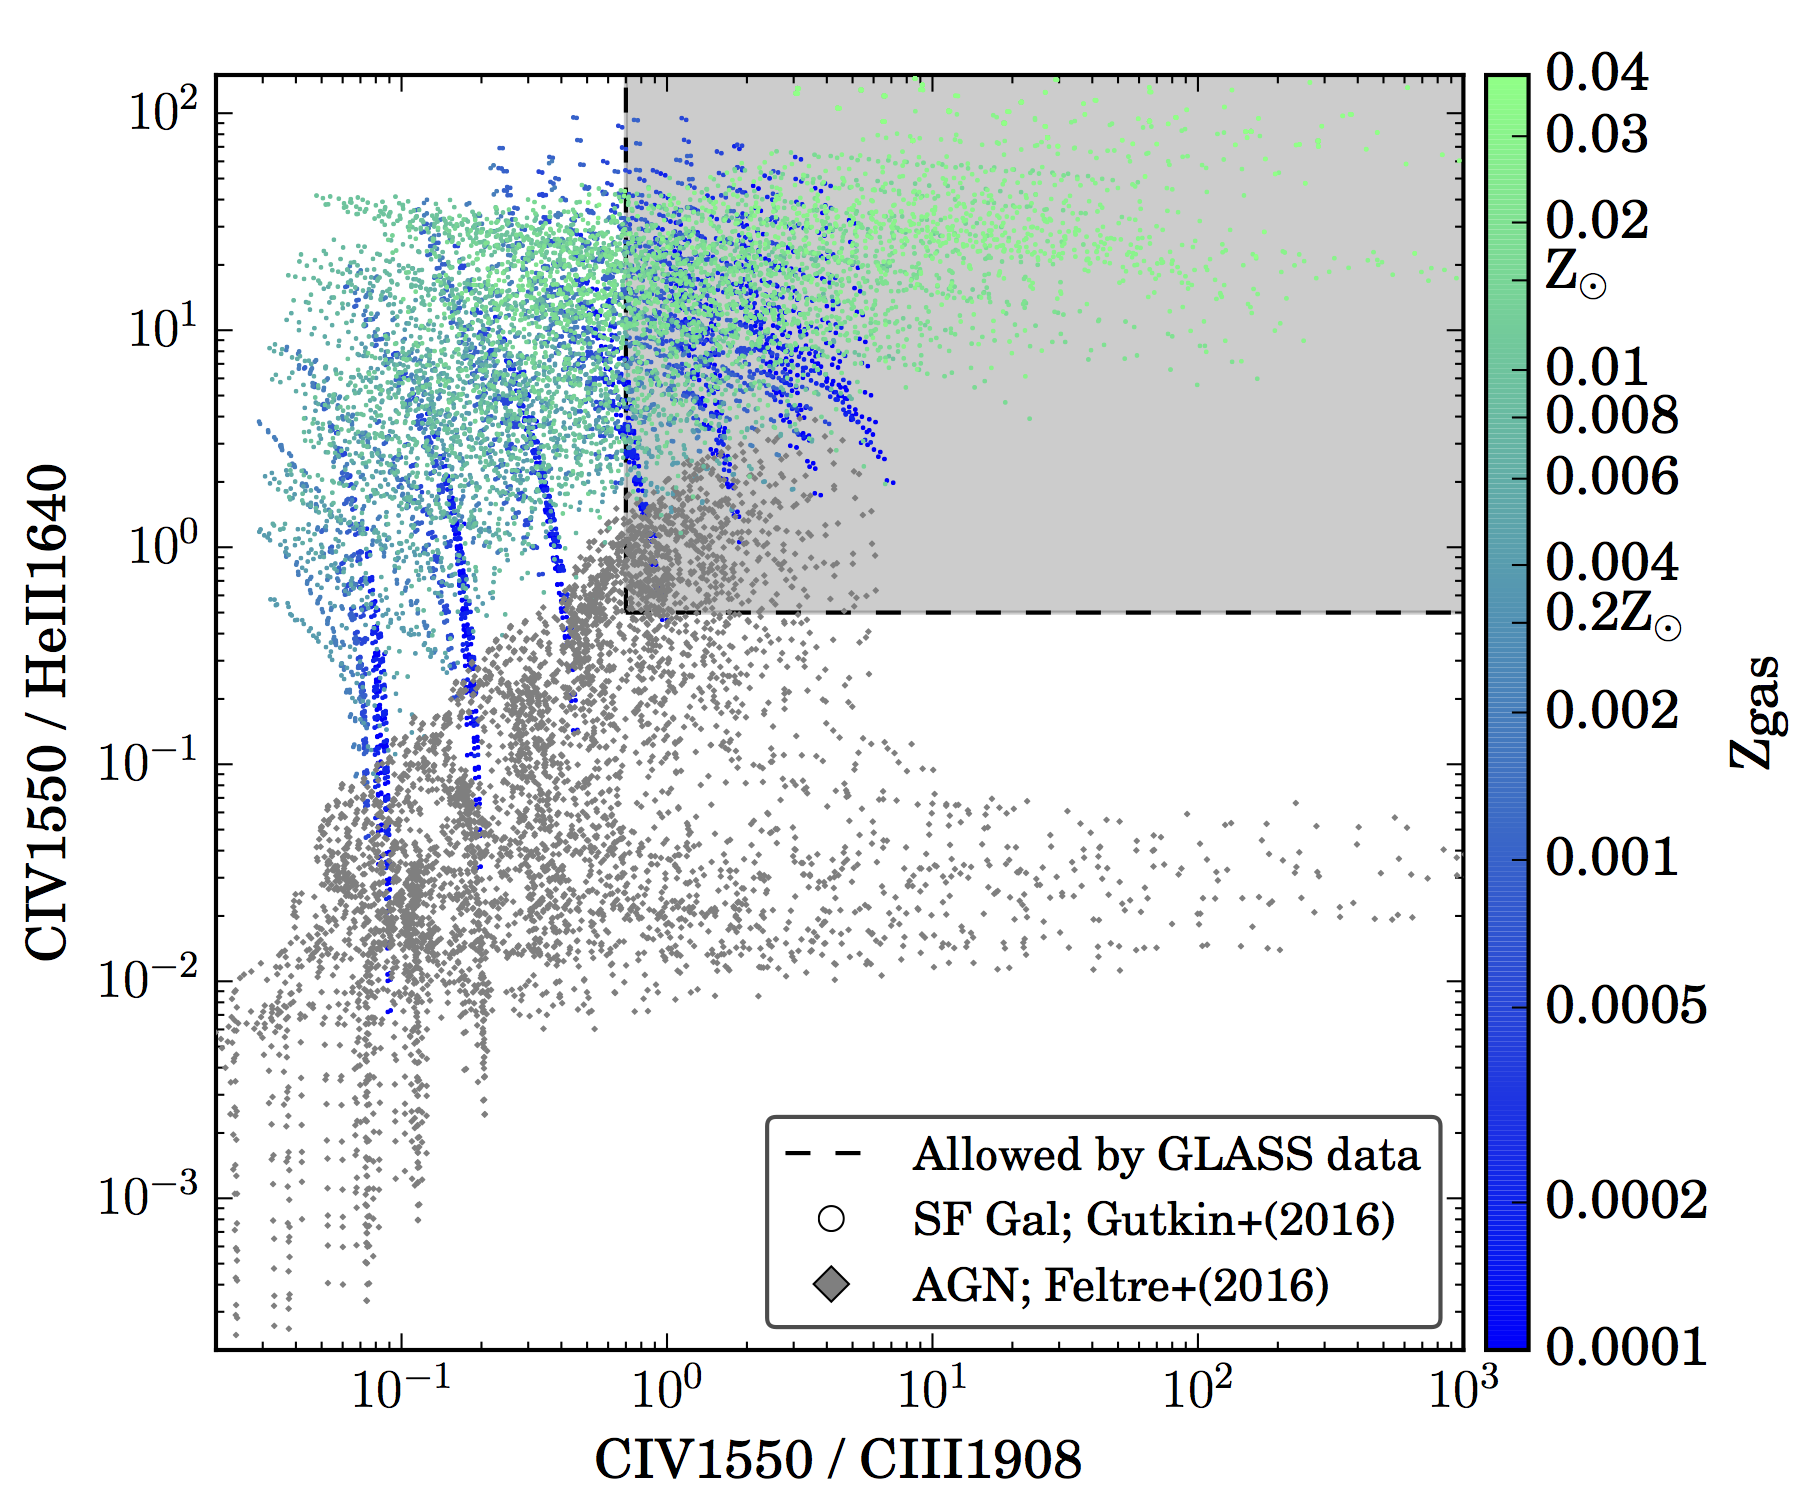 Figure 15
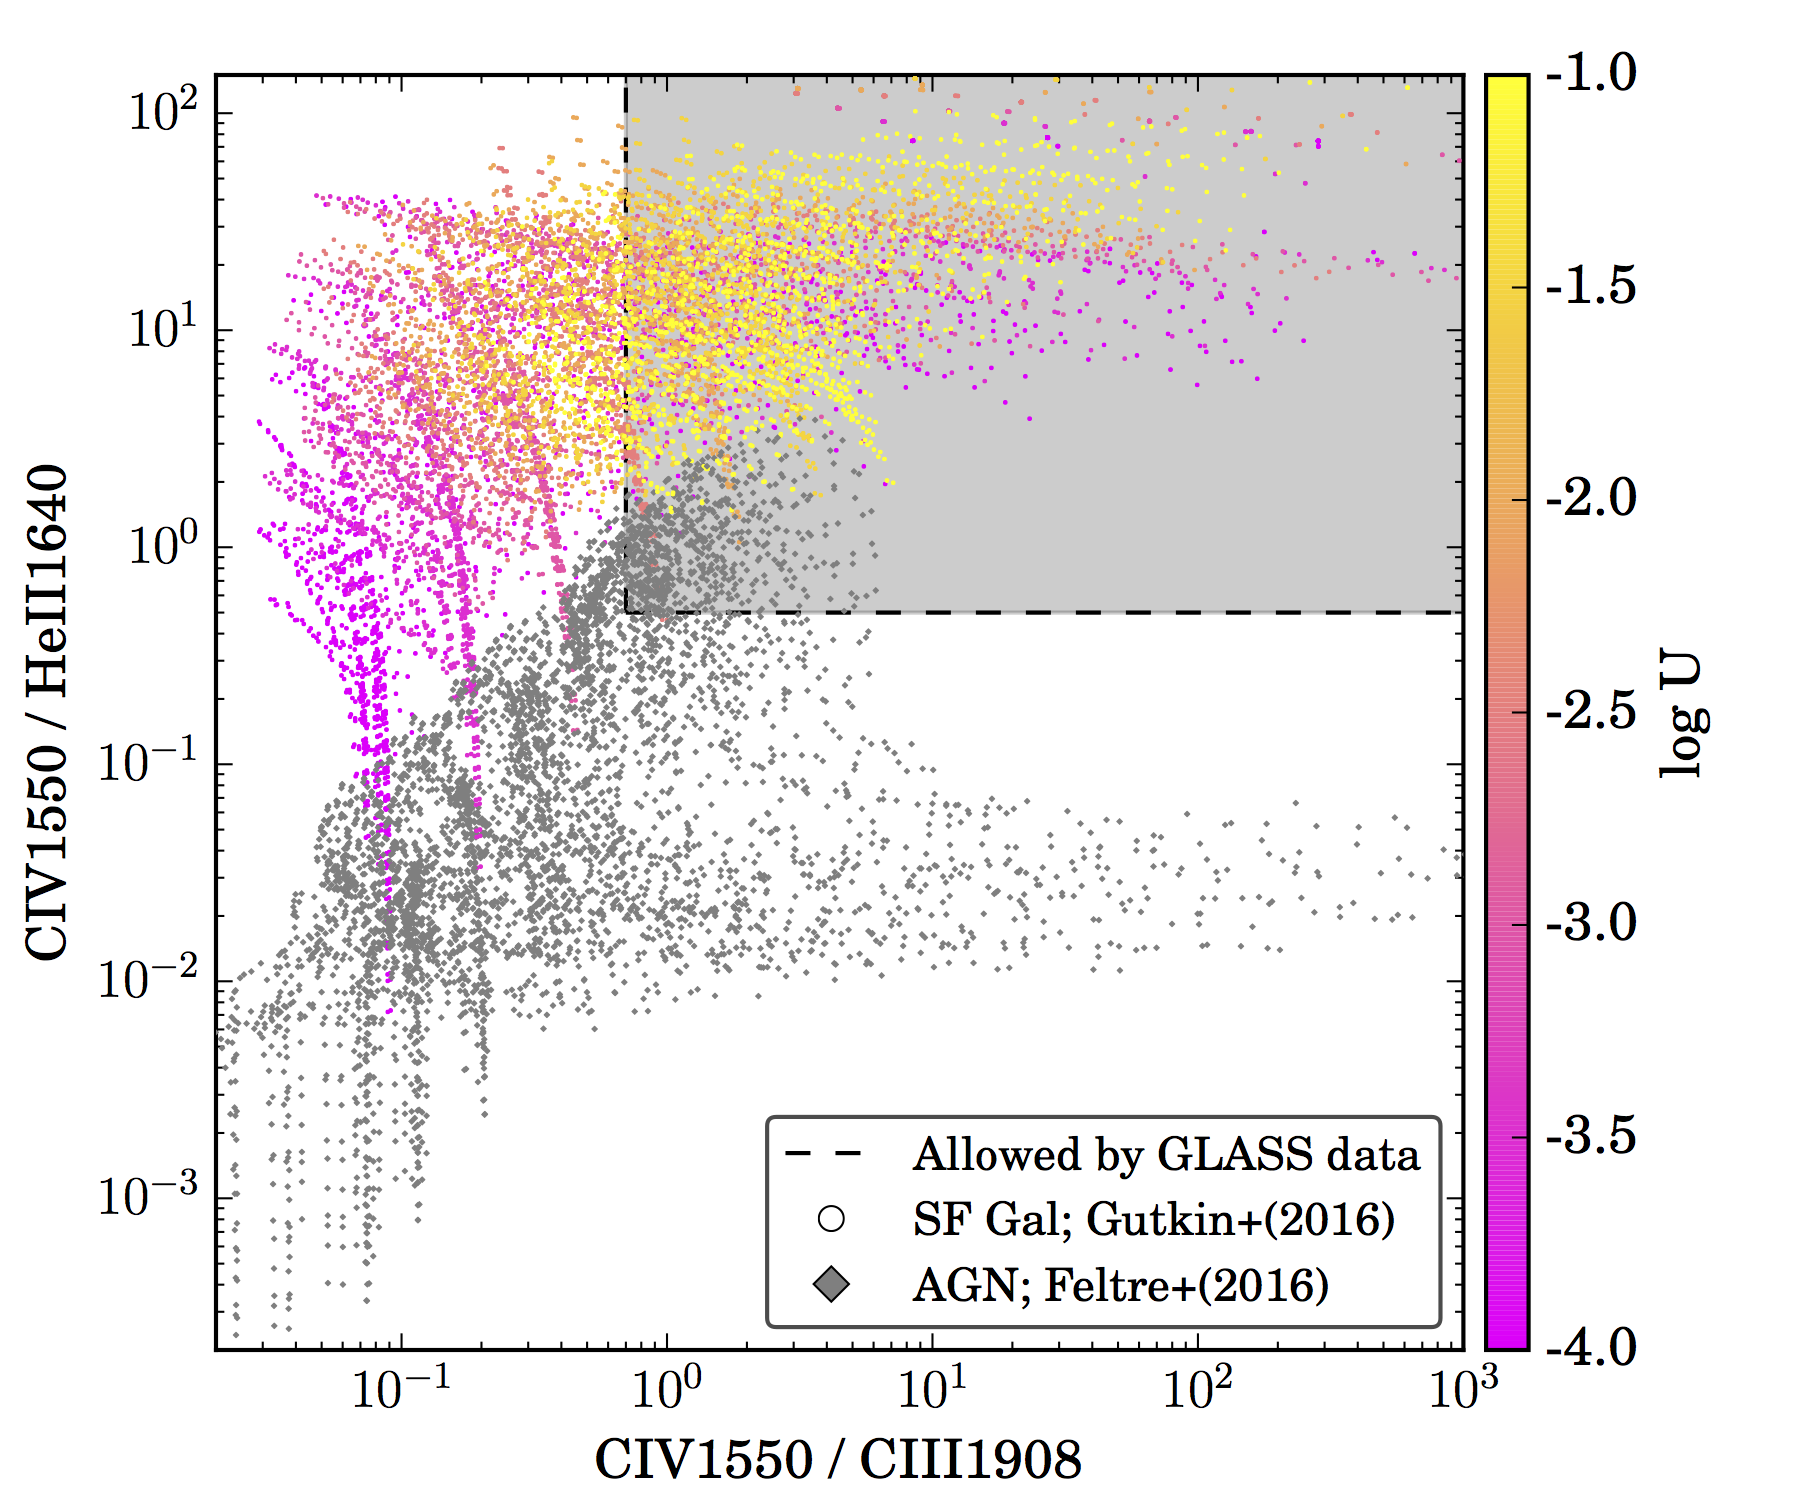 Figure 16
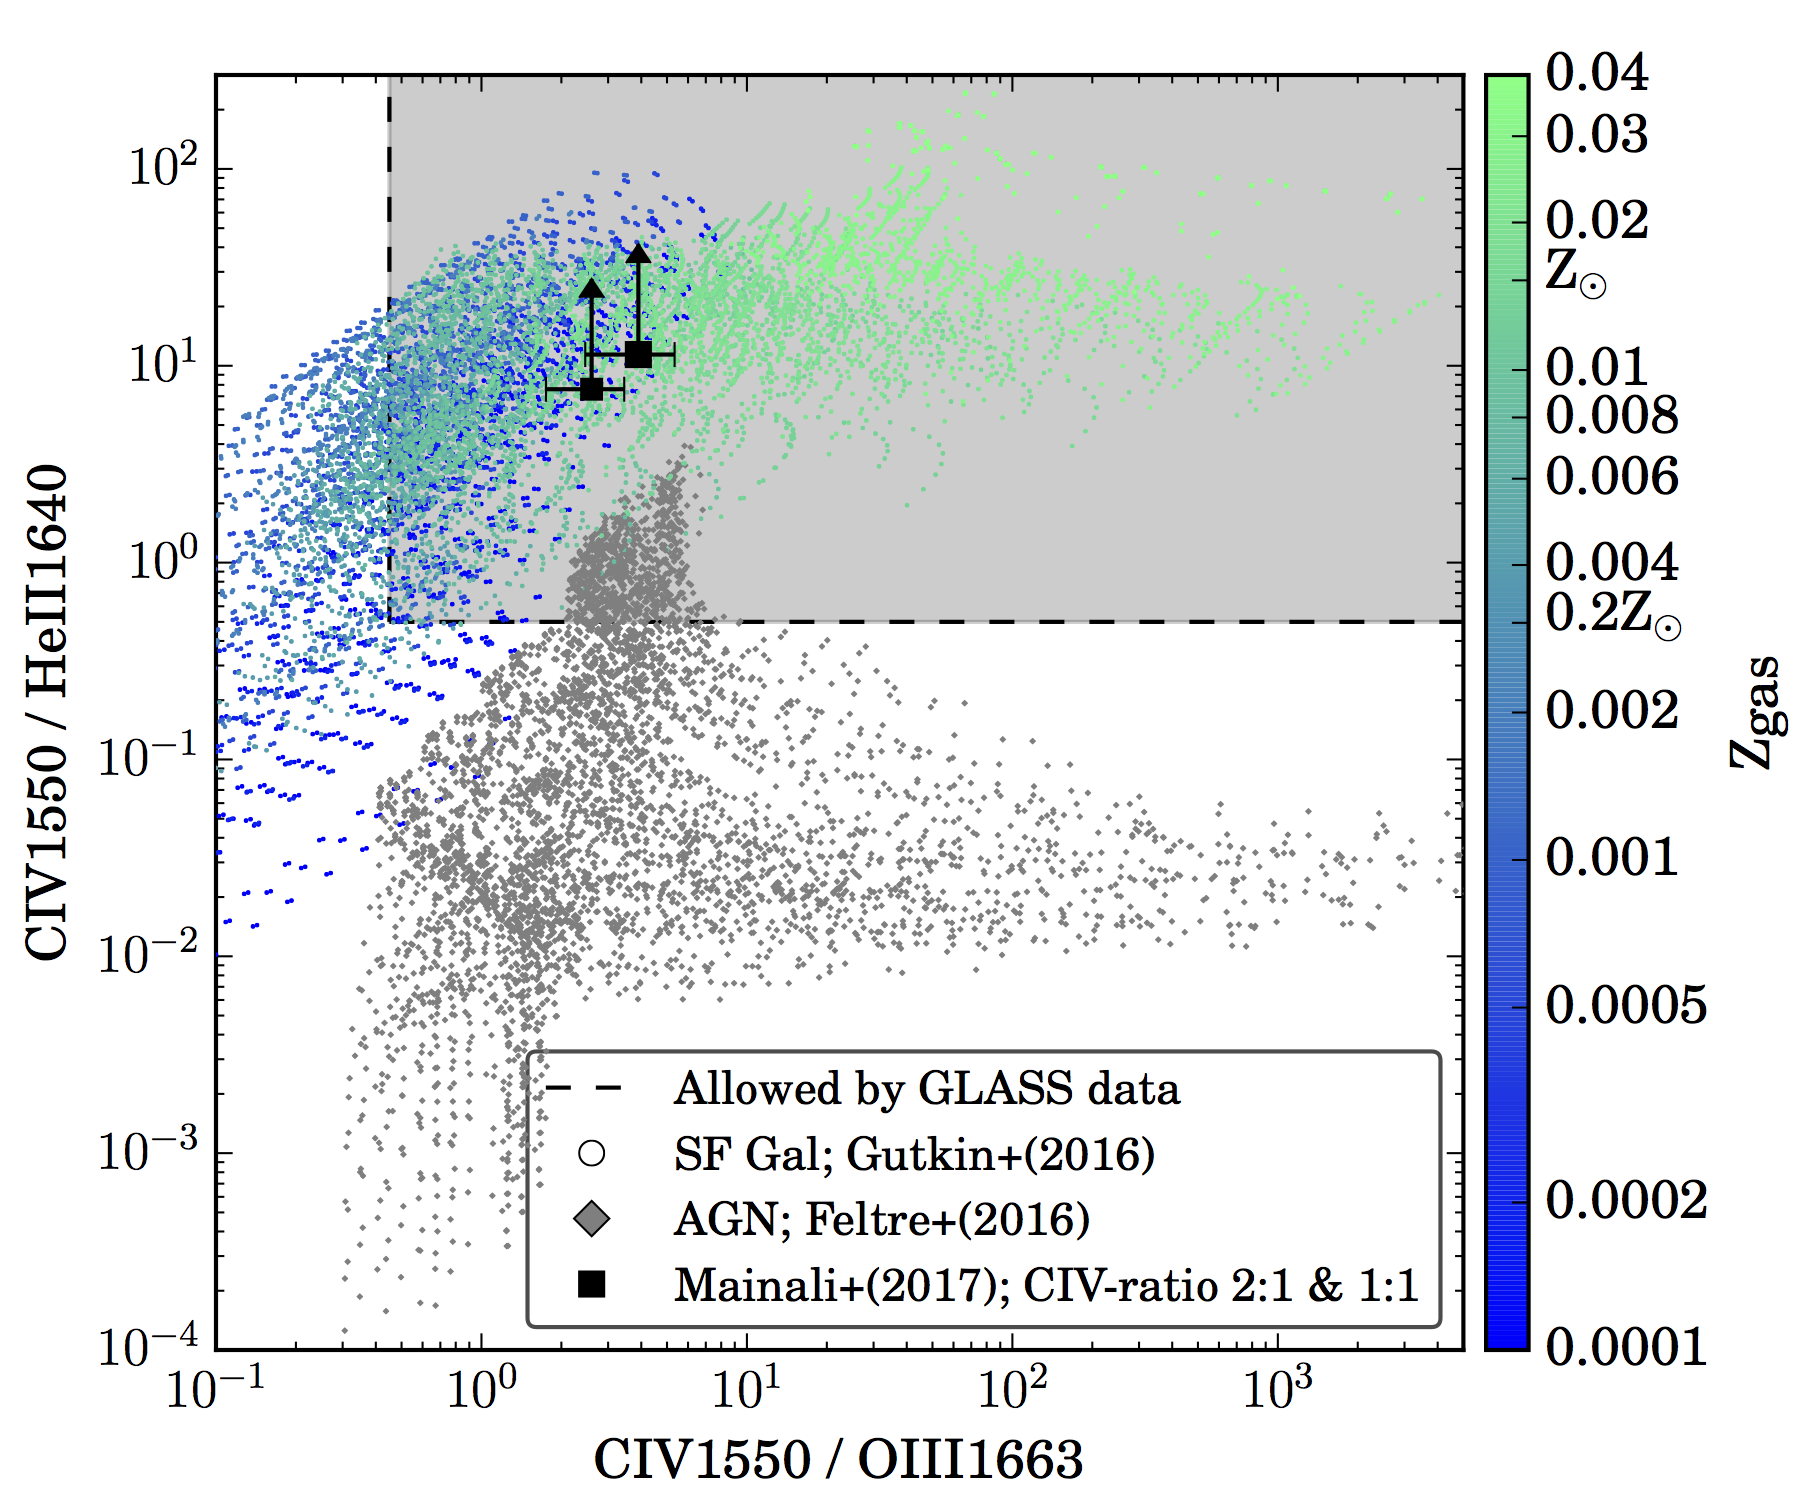 Figure 17
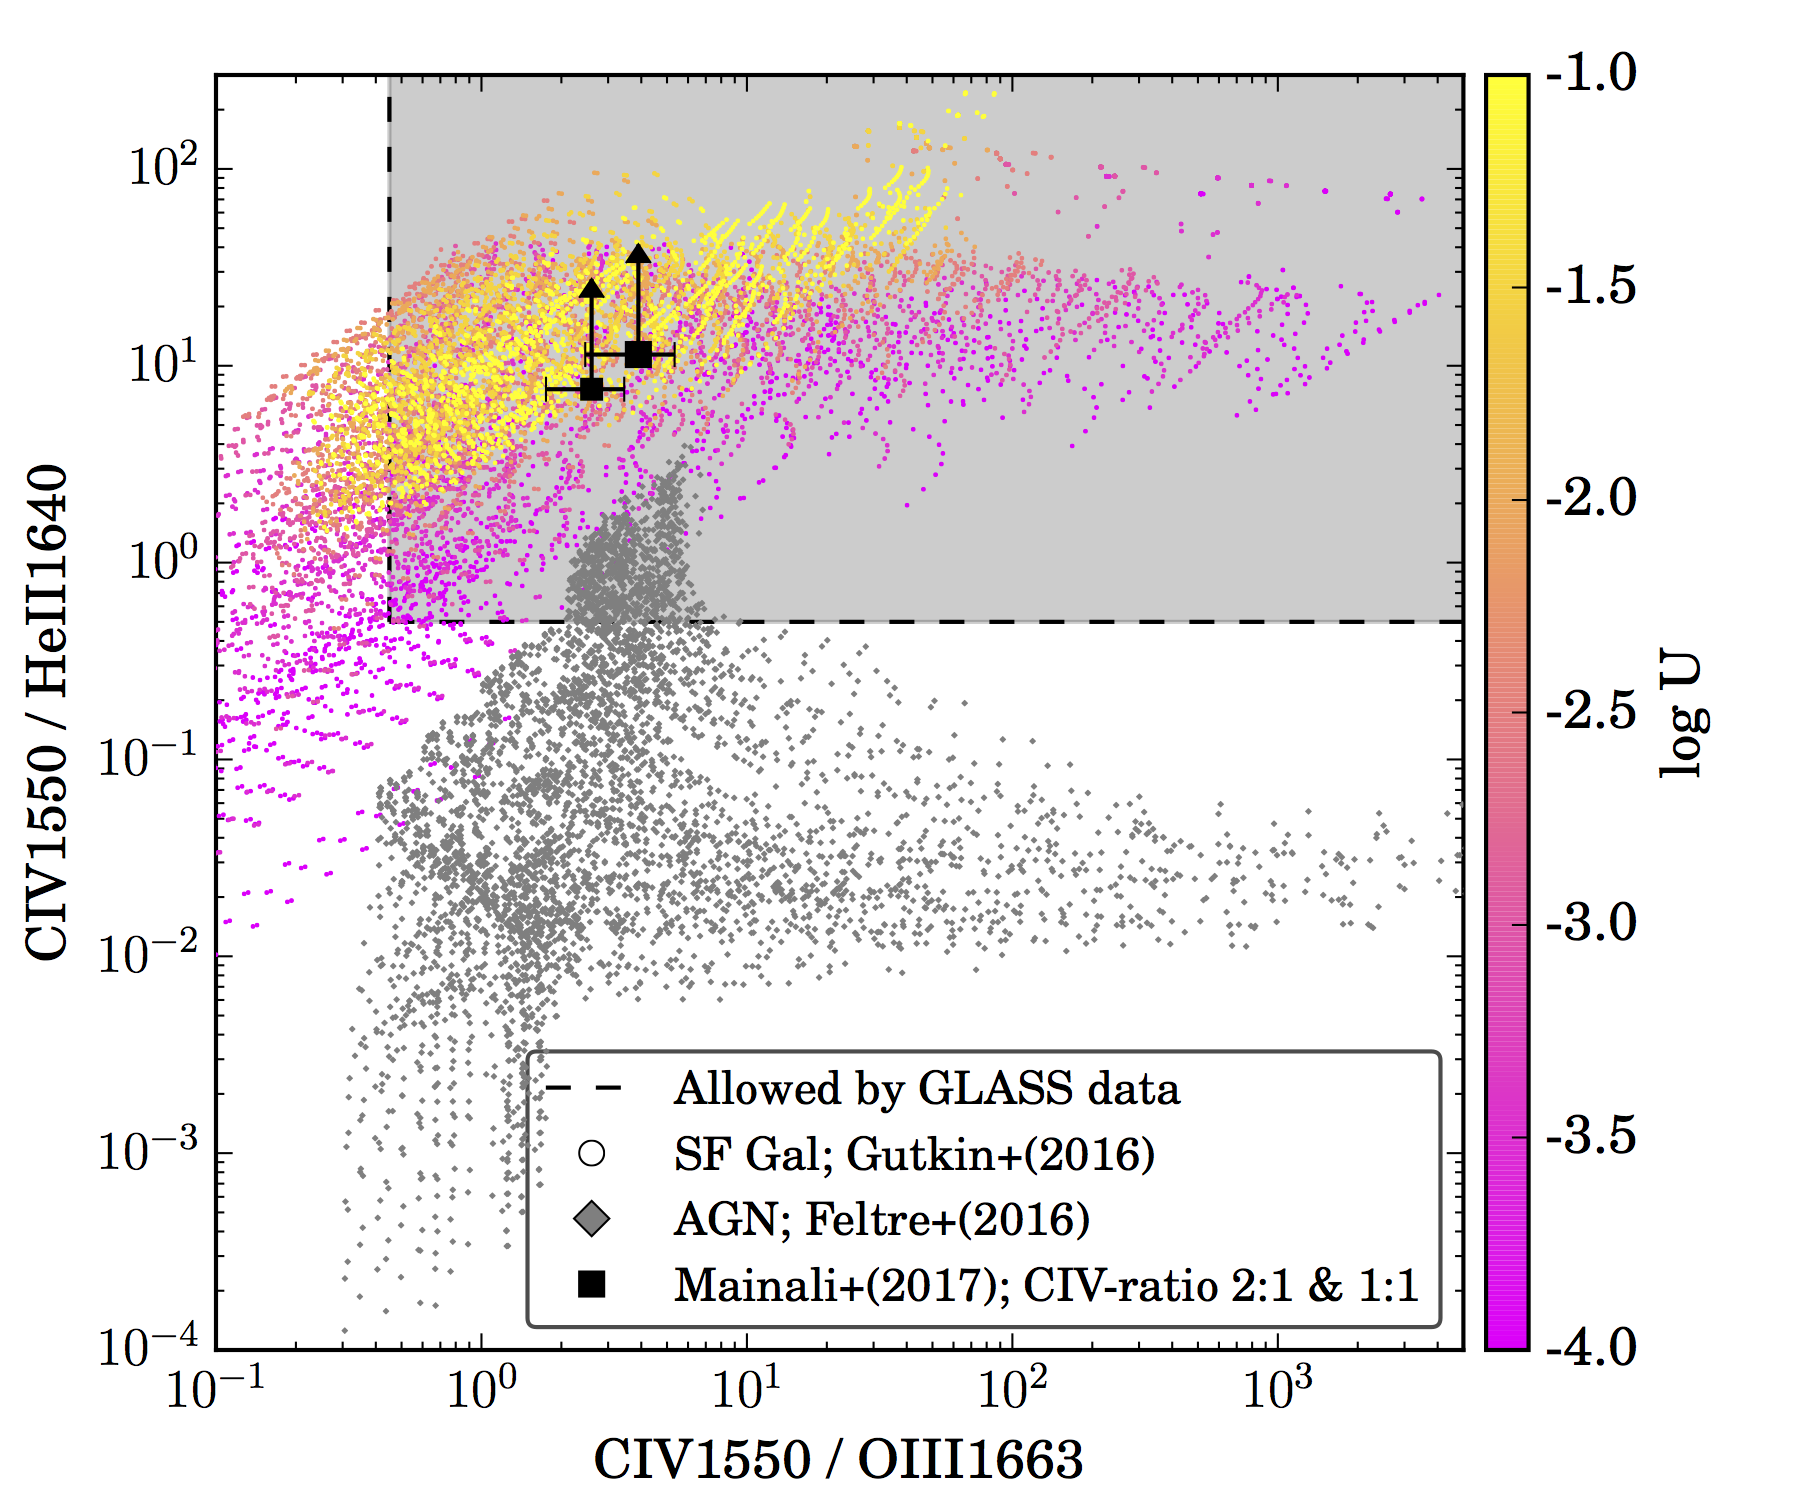 Figure 18
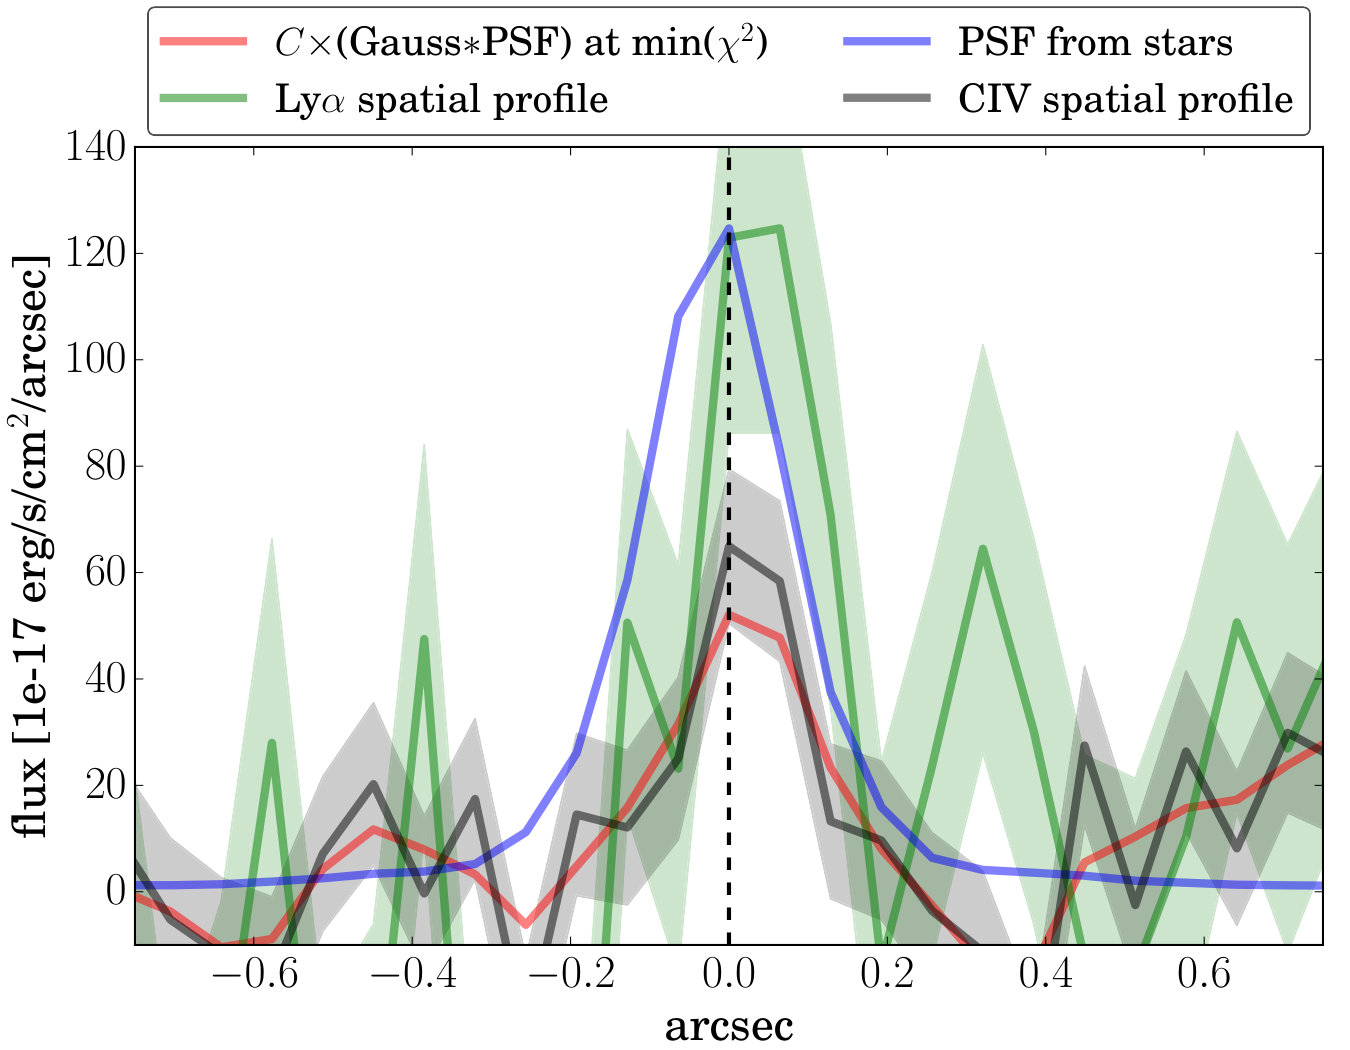 Figure 19
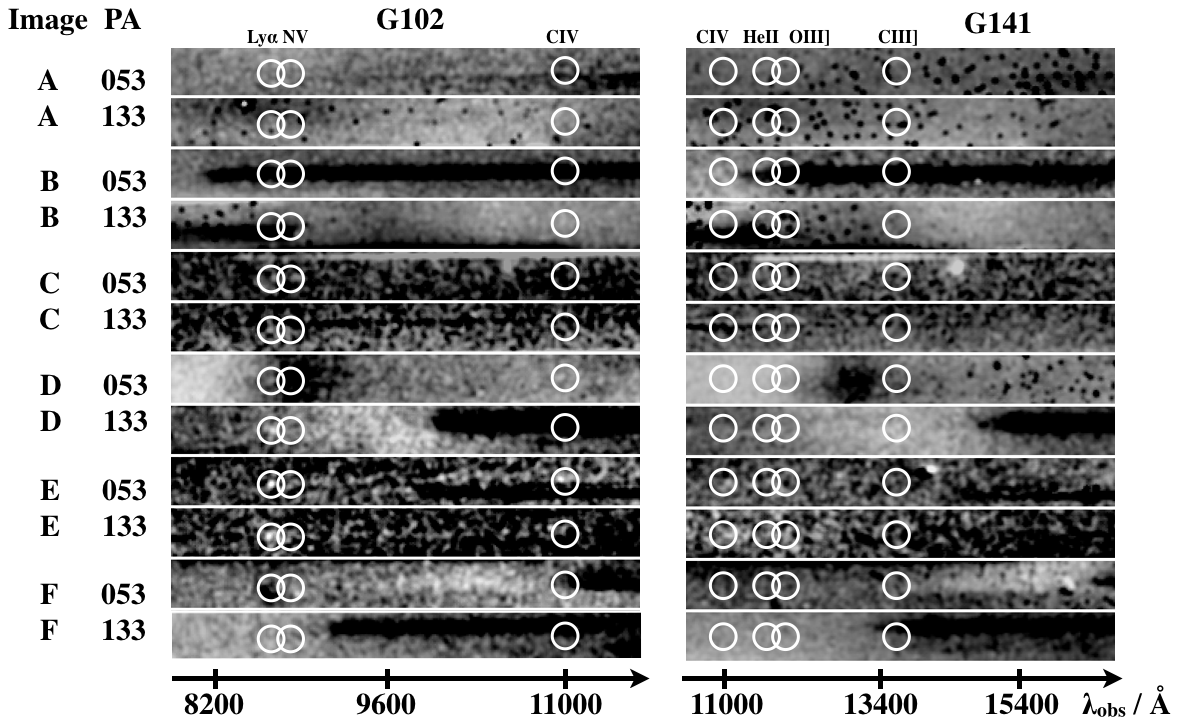 Figure 20
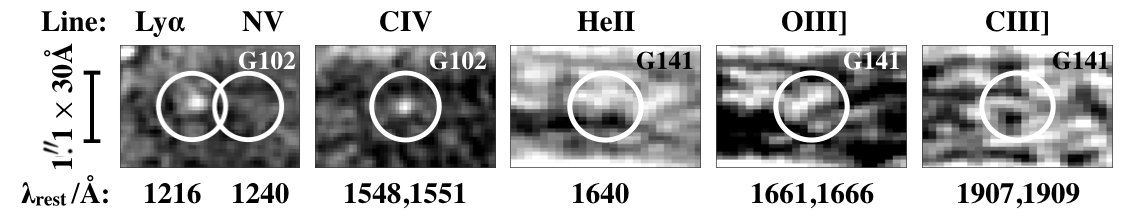 Figure 21
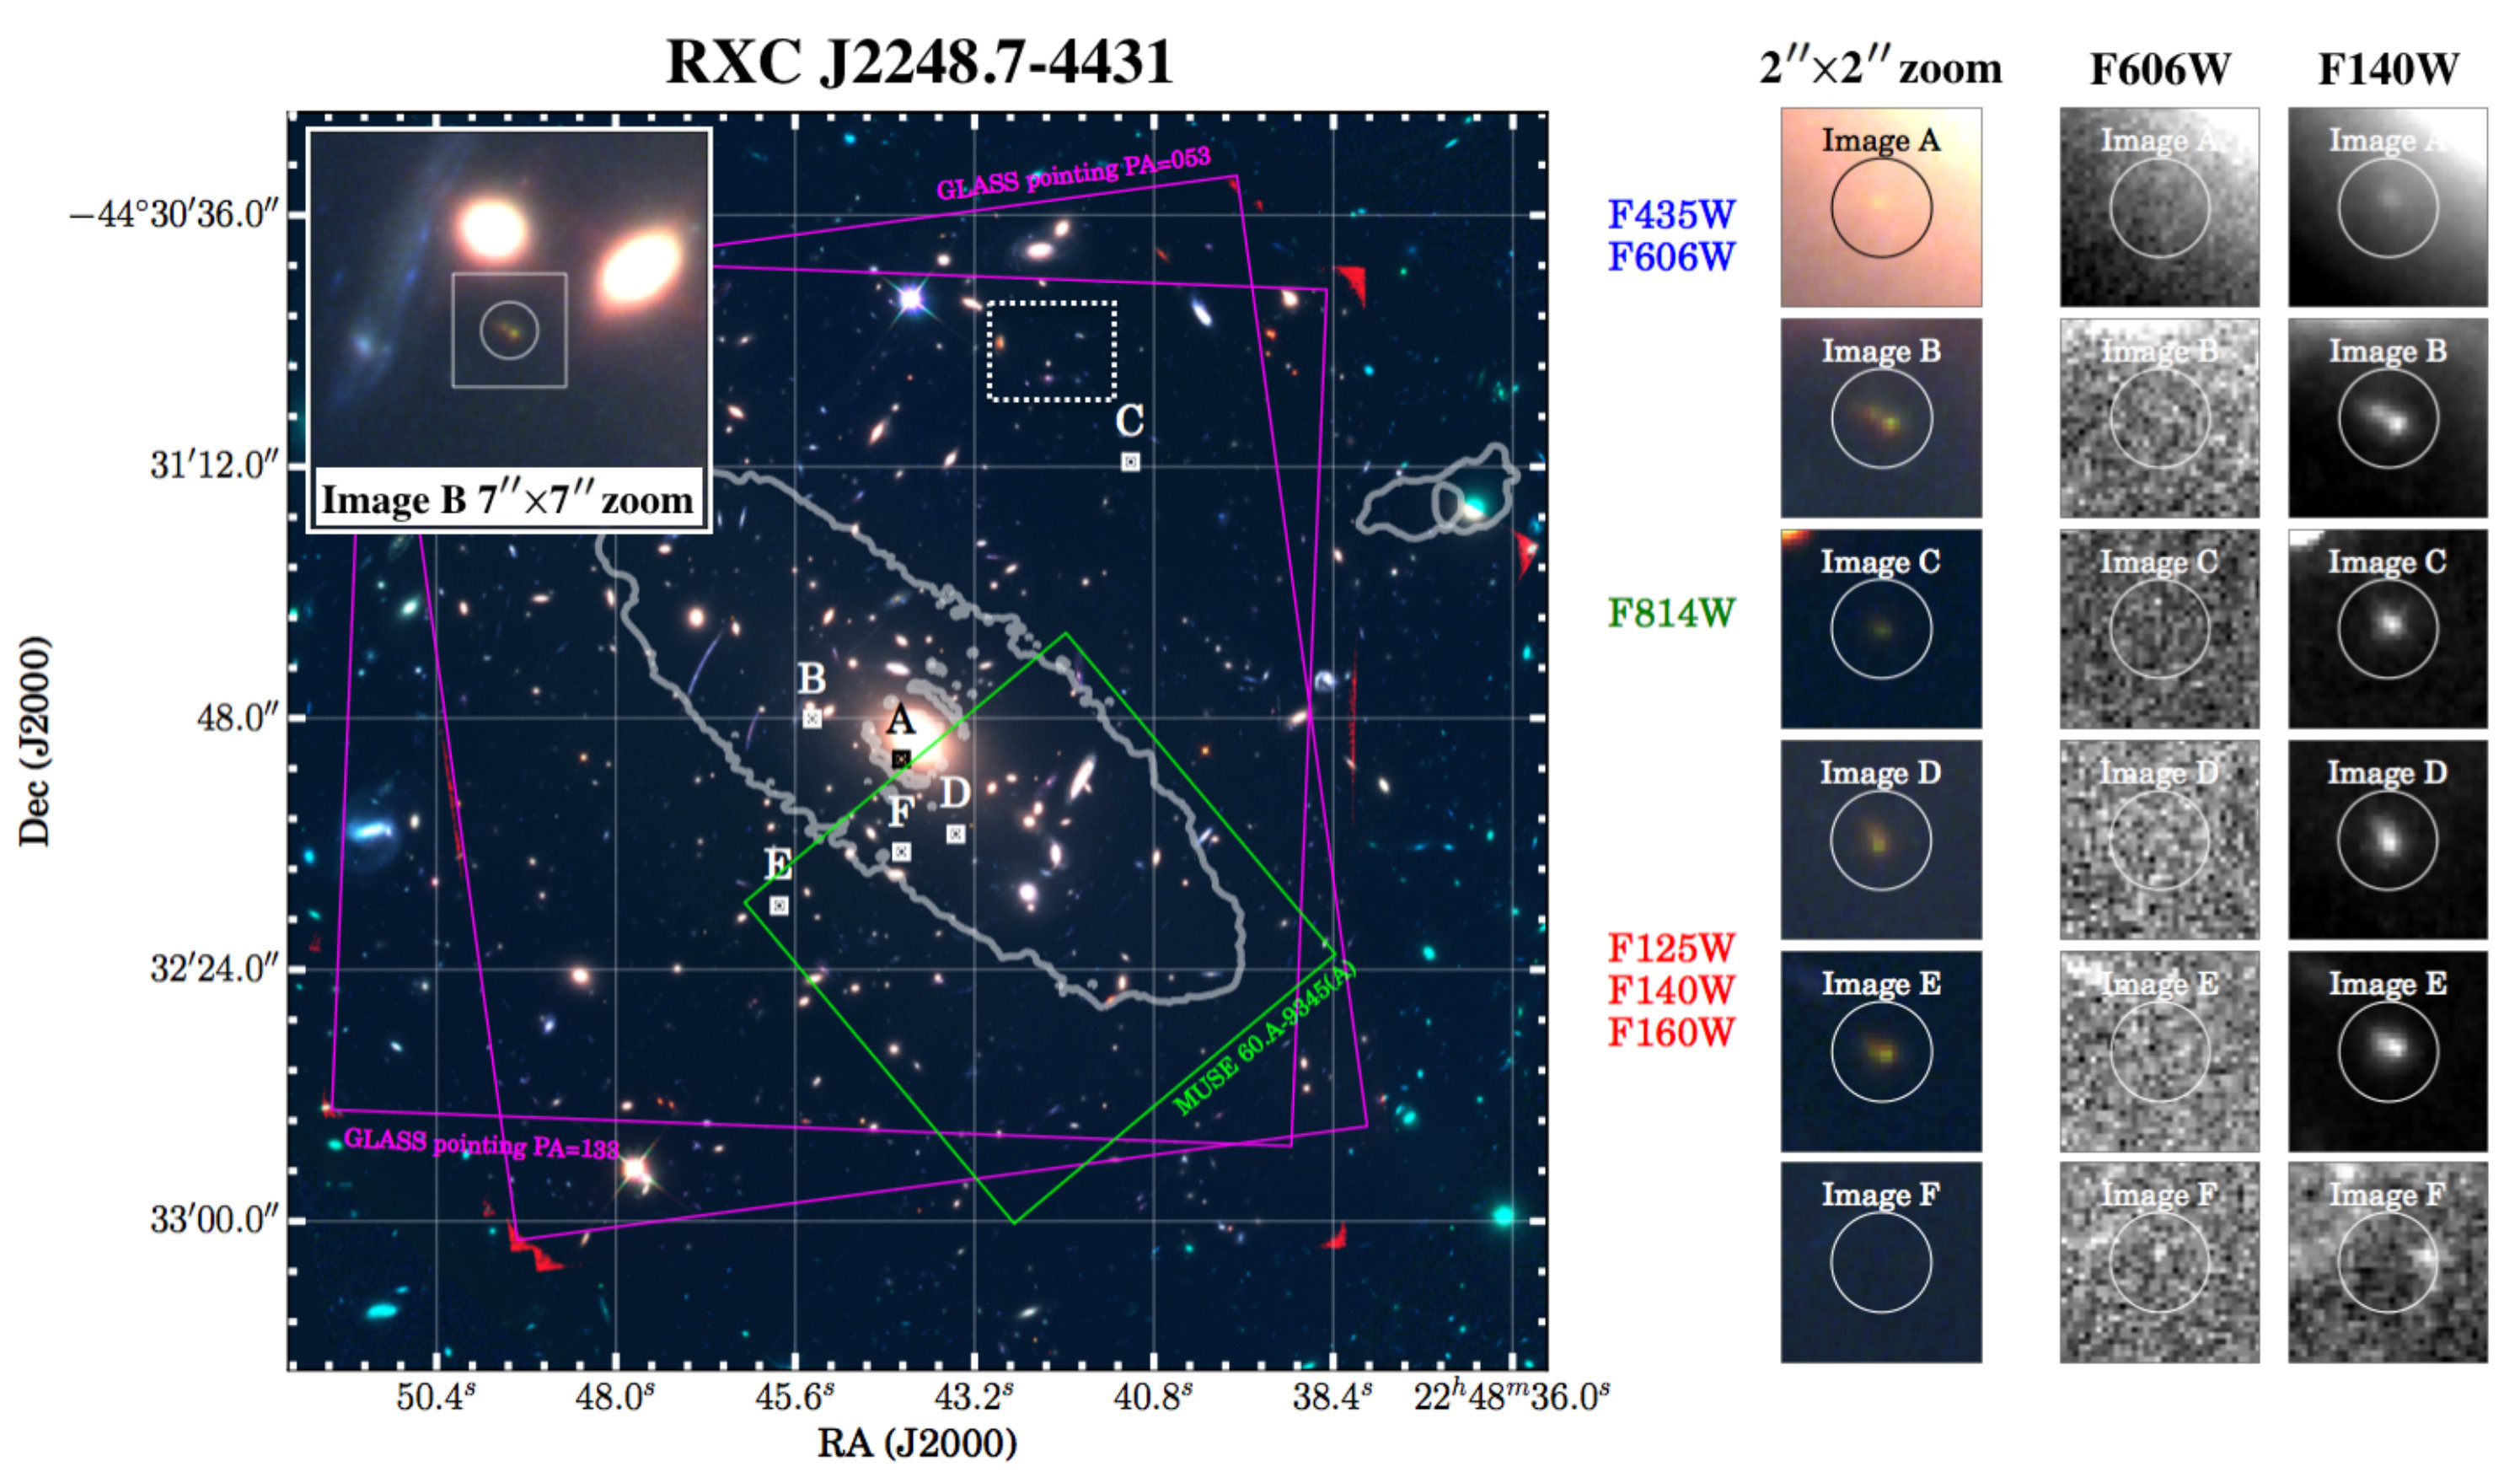 Figure 22
| Image | RA | Dec | ID | ID | ID | ID | ID | ID | ID | ID | ID | ||
|---|---|---|---|---|---|---|---|---|---|---|---|---|---|
| [deg] | [deg] | [hms] | [dms] | Sc16 | CLASH | Ba13 | Bo13 | Mo14 | Ri14 | Jo14 | Ka15 | Ma17 | |
| A | 342.18408 | -44.5316378 | 22:48:44.179 | -44:31:53.90 | ID5 | ID0 | ID0 | ||||||
| B | 342.1890479 | -44.5300249 | 22:48:45.37 | -44:31:48.18 | 01131 | 00847 | ID1 | ID1 | ID1 | 6.1 | 12.1 | ||
| C | 342.171296 | -44.519812 | 22:48:41.11 | -44:31:11.32 | 01752 | 00401 | ID4 | ID4 | ID4 | 6.4 | 12.4 | ||
| D | 342.18104 | -44.53461 | 22:48:43.45 | -44:32:04.63 | 00845 | 01154 | ID2 | ID2 | ID2 | 6.3 | 12.2 | 53a | |
| E | 342.190889 | -44.537461 | 22:48:45.81 | -44:32:14.89 | 00699 | 01291 | ID3 | ID3 | ID3 | 6.2 | 12.3 | 53b | ID3 |
| F∗ | 342.18407 | -44.53532 | 22:48:44.177 | -44:32:07.14 | 53c |
| PA | Image A | Image B | Image C | Image D | Image E | Image F | ||
|---|---|---|---|---|---|---|---|---|
| Boone et al. (2013) | Yes | Yes | Yes | Yes | ||||
| Balestra et al. (2013) | Yes | Yes | Yes | |||||
| Karman et al. (2015) | Yes | Yes | Yes | |||||
| Schmidt et al. (2016) | Yes | Yes | Yes | Yes | ||||
| Mainali et al. (2017) | Yes | |||||||
| ( range) | 1.46 | 4.19 | 1.95 | 3.19 | 4.22 | 9.34 | ||
| ( [68% range]) | 0.25[0.30,0.30] | 0.97[1.17,1.18] | 1.76[1.70,1.79] | 1.15[1.39,1.39] | 3.14[2.60,2.63] | 3.55[6.35,6.77] | ||
| F435W | [AB mag] | 30.45 | 29.87 | 29.95 | 30.15 | 29.78 | 30.64 | |
| F475W | [AB mag] | 28.49 | 28.28 | 28.35 | 26.51 | 28.26 | 28.75 | |
| F606W | [AB mag] | 30.01 | 29.47 | 30.02 | 29.40 | 29.55 | 29.93 | |
| F625W | [AB mag] | 28.35 | 27.28 | 28.50 | 26.99 | 27.89 | 28.18 | |
| F775W | [AB mag] | 27.60 | 27.62 | 28.01 | 26.16 | 27.88 | 28.16 | |
| F814W | [AB mag] | 27.07 0.23 | 26.18 0.08 | 26.94 0.05 | 26.23 0.04 | 26.04 0.03 | 29.06 | |
| F850LP | [AB mag] | 26.75 0.42 | 25.36 0.12 | 25.76 0.14 | 24.81 0.11 | 25.06 0.09 | 27.49 | |
| F105W | [AB mag] | 26.18 0.09 | 25.04 0.04 | 25.84 0.02 | 25.16 0.02 | 24.93 0.01 | 28.03 0.20 | |
| F110W | [AB mag] | 26.26 0.23 | 24.88 0.09 | 26.45 0.14 | 25.21 0.05 | 25.00 0.03 | 28.44 | |
| F125W | [AB mag] | 26.05 0.17 | 25.05 0.05 | 25.83 0.04 | 25.18 0.02 | 24.93 0.02 | 28.03 0.22 | |
| F140W | [AB mag] | 26.12 0.24 | 25.14 0.07 | 25.95 0.04 | 25.28 0.03 | 25.07 0.02 | 28.19 0.23 | |
| F160W | [AB mag] | 25.95 0.13 | 25.17 0.09 | 25.98 0.04 | 25.30 0.03 | 25.10 0.02 | 28.06 0.25 | |
| [AB mag] | 24.66 | 22.34 | 24.730.28 | 25.40 | 23.780.10 | 25.97 | ||
| [AB mag] | 24.64 | 22.65 | 25.240.41 | 25.52 | 24.760.25 | 25.99 | ||
| [AB mag] | - | |||||||
| [1e-17 erg/s/cm2] | 053 | 1.93 1.32 | 1.30 | 3.02 0.98 | 5.31 1.04 | 5.14 1.01 | 1.35 | |
| [1e-17 erg/s/cm2] | 133 | 2.08 1.50 | 1.46 | 1.83 0.91 | 5.58 0.96 | 5.49 0.95 | 3.04 1.05 | |
| [1e-17 erg/s/cm2] | 053 | 1.13 | 1.09 | 2.74 0.80 | 1.09 | 2.29 0.81 | 1.82 0.85 | |
| [1e-17 erg/s/cm2] | 133 | 1.15 | 1.18 | 0.93 | 0.97 | 1.27 0.96 | 0.93 | |
| [1e-17 erg/s/cm2] | 053 | 0.66 0.32 | 0.54 | 0.59 0.48 | 1.56 0.42 | 2.59 0.48 | 0.49 | |
| [1e-17 erg/s/cm2] | 133 | 0.51 | 0.44 | 0.43 | 0.94 | 0.83 0.37 | 0.67 0.43 | |
| [1e-17 erg/s/cm2] | 053 | 0.99 | 1.04 | 0.70 | 0.98 | 0.63 | 0.95 | |
| [1e-17 erg/s/cm2] | 133 | 1.05 | 1.12 | 0.77 | 0.77 | 0.79 | 0.57 | |
| [1e-17 erg/s/cm2] | 053 | 0.98 | 0.96 | 0.86 | 0.86 | 0.85 | 0.87 | |
| [1e-17 erg/s/cm2] | 133 | 0.97 | 1.00 | 0.69 | 0.77 | 0.70 | 0.72 | |
| [1e-17 erg/s/cm2] | 053 | 0.76 | 0.70 | 0.58 | 0.61 | 0.58 | 0.58 | |
| [1e-17 erg/s/cm2] | 133 | 0.68 | 0.39 | 0.35 | 0.51 | 0.49 | 0.50 | |
| EW | [Å] | 053 | 83 57 | 19 | 94 31 | 88 17 | 69 14 | 315 |
| EW | [Å] | 133 | 89 64 | 22 | 57 28 | 93 16 | 74 13 | 711 278 |
| EW | [Å] | 053 | 48 | 16 | 85 25 | 18 | 31 11 | 425 213 |
| EW | [Å] | 133 | 49 | 18 | 29 | 16 | 17 13 | 217 |
| EW | [Å] | 053 | 35 18 | 11 | 25 21 | 37 10 | 49 9 | 161 |
| EW | [Å] | 133 | 27 | 9 | 19 | 22 | 16 7 | 221 148 |
| EW | [Å] | 053 | 69 | 30 | 42 | 32 | 17 | 450 |
| EW | [Å] | 133 | 74 | 32 | 46 | 25 | 21 | 270 |
| EW | [Å] | 053 | 69 | 27 | 51 | 28 | 23 | 412 |
| EW | [Å] | 133 | 68 | 28 | 41 | 25 | 19 | 339 |
| EW | [Å] | 053 | 56 | 25 | 44 | 24 | 19 | 298 |
| EW | [Å] | 133 | 50 | 14 | 26 | 20 | 16 | 254 |
| Unit | Note | Estimate | |
|---|---|---|---|
| [1e-17 erg/s/cm2] | -corrected | 0.89 | |
| ⋆ | [1e-17 erg/s/cm2] | -corrected | 0.43 |
| [1e-17 erg/s/cm2] | -corrected | 0.21 | |
| [1e-17 erg/s/cm2] | -corrected | ||
| [1e-17 erg/s/cm2] | -corrected | ||
| [1e-17 erg/s/cm2] | -corrected | ||
| EW | [Å] | rest-frame | 68 |
| EW⋆ | [Å] | rest-frame | 25 |
| EW | [Å] | rest-frame | 24 |
| EW | [Å] | rest-frame | |
| EW | [Å] | rest-frame | |
| EW | [Å] | rest-frame | |
| [1e-17 erg/s/cm2] | stack (incl. ) | ||
| [1e-17 erg/s/cm2] | stack (incl. ) | ||
| [1e-17 erg/s/cm2] | stack (incl. ) | ||
| [1e-17 erg/s/cm2] | stack (incl. ) | ||
| [1e-17 erg/s/cm2] | stack (incl. ) | ||
| [1e-17 erg/s/cm2] | stack (incl. ) |
Peer Reviews
No public reviews on file for this paper yet. If you reviewed it on a platform where reviews are public (OpenReview, ICLR, NeurIPS, ICML), you can paste yours below so the community can read it here.
Videos
No videos yet. Explain this paper in a talk, walkthrough, or lecture? Add one.
The Grism Lens-Amplified Survey from Space (GLASS). XI. Detection of CIV in Multiple Images of Ly Emitter Behind RXCJ2248.7-4431
K. B. Schmidt1,⋆ K.-H., Huang2, T. Treu3,∗, A. Hoag2, M. Bradač2, A. L. Henry4, T. A. Jones2,†, C. Mason3, M. Malkan3, T. Morishita3,5,6, L. Pentericci7, M. Trenti8, B. Vulcani8, X. Wang3
1Leibniz-Institut für Astrophysik Potsdam (AIP), An der Sternwarte 16, 14482, Potsdam, Germany
2Department of Physics, University of California, Davis, CA, 95616, USA
3Department of Physics and Astronomy, UCLA, Los Angeles, CA, 90095-1547, USA
4Space Telescope Science Institute, 3700 San Martin Drive, Baltimore, MD, 21218, USA
5Astronomical Institute, Tohoku University, Aramaki, Aoba, Sendai 980-8578, Japan
6Institute for International Advanced Research and Education, Tohoku University, Aramaki, Aoba, Sendai 980-8578, Japan
7INAF - Osservatorio Astronomico di Roma Via Frascati 33 - 00040 Monte Porzio Catone, I
8School of Physics, The University of Melbourne, VIC, 3010 Australia
Abstract
The CIII] and CIV rest-frame UV emission lines are powerful probes of the ionizations states of galaxies. They have furthermore been suggested as alternatives for spectroscopic redshift confirmation of objects at the epoch of reionization (), where the most frequently used redshift indicator, Ly, is attenuated by the high fraction of neutral hydrogen in the inter-galactic medium. However, currently only very few confirmations of carbon UV lines at these high redshifts exist, making it challenging to quantify these claims. Here, we present the detection of CIV1548,1551Å in HST slitless grism spectroscopy obtained by GLASS of a Ly emitter at multiply imaged by the massive foreground galaxy cluster RXCJ2248.7-4431. The CIV emission is detected at the 3–5 level in two images of the source, with marginal detection in two other images. We do not detect significant CIII]1907,1909Å emission implying an equivalent width EWÅ (1) and (2). Combined with limits on the rest-frame UV flux from the HeII1640Å emission line and the OIII]1661,1666Å doublet, we put constraints on the metallicity and the ionization state of the galaxy. The estimated line ratios and equivalent widths do not support a scenario where an AGN is responsible for ionizing the carbon atoms. SED fits including nebular emission lines imply a source with a mass of log(M/M, SFR of around 10M⊙/yr, and a young stellar population Myr old. The source shows a stronger ionizing radiation field than objects with detected CIV emission at and adds to the growing sample of low-mass (log(M/M) galaxies at the epoch of reionization with strong radiation fields from star formation.
Subject headings:
galaxies: evolution — galaxies: high-redshift — galaxies: clusters: individual (RXC J2248.7-4431)
\star$$\staraffiliationtext: [email protected]\ast$$\astaffiliationtext: Packard Fellow{}^{\dagger}$${}^{\dagger}affiliationtext: Hubble Fellow
1. Introduction
Spectroscopically confirming galaxies at the Epoch of Reionization (EoR) at redshifts above 6 has been challenging owing to the fact that Lyman-\alpha$$\;\lambda1216Å (henceforth referred to as Ly) photons are attenuated by neutral hydrogen in the inter-galactic medium (IGM; e.g., Fontana et al., 2010; Pentericci et al., 2011; Stark et al., 2011; Treu et al., 2012, 2013; Caruana et al., 2012, 2014). Dedicated efforts and improved observational tools keep providing larger and larger samples of Ly emitters (LAEs) at these extreme redshifts (e.g., Schenker et al., 2012; Finkelstein et al., 2013; Zitrin et al., 2015b; Oesch et al., 2015; Schmidt et al., 2016; Song et al., 2016; Huang et al., 2016a, b; Roberts-Borsani et al., 2016, Hoag et al. in prep.). However, at the highest redshifts, where a significant fraction of the hydrogen in the inter-galactic medium (IGM) is neutral alternative methods of redshift confirmation which are independent of the neutral hydrogen fraction are desirable.
The CIII] and CIV rest-frame ultra-violet (UV) lines have been proposed as such alternatives (e.g. Erb et al., 2010; Stark et al., 2014). Photoionization models predict that CIII] is the strongest rest-frame UV emission line at Å after Ly (Jaskot & Ravindranath, 2016) with a ratio between CIV and CIII] often below one (Gutkin et al., 2016; Feltre et al., 2016). Therefore, even though the observed equivalent width (EW) ratios between CIII] and Ly are often very small (Rigby et al., 2015), models imply that CIII] is the most promising alternative to Ly for redshift determination in the early Universe. In the near future, the James Webb Space Telescope (JWST) will enable independent redshift determinations from rest-frame optical emission lines at Å of such sources, making non-Ly redshifts in the early universe more accessible. However, rest-frame UV emission lines still provide valuable measures of physical conditions in star forming galaxies and Active Galactic Nuclei (AGN), and will likely continue to do so after the launch of JWST.
From photoionization models it is evident that the detection of rest-frame UV lines (other than Ly) is not only useful for redshift confirmation, but also for determining the physical properties of the emitting galaxies (e.g., Erb et al., 2010; Steidel et al., 2016; Pérez-Montero & Amorín, 2017; Amorín et al., 2017). For instance, as the rest-frame UV emission lines are closely related to the electron density, the gas-phase metallicity and the ionization state of the underlying stellar populations of the galaxies, they can provide constraints which are complimentary to rest-frame optical spectra. By determining fluxes and flux ratios (or the corresponding limits) in the rest-frame UV, studies of galaxy properties in individual galaxies at the EoR have recently started to emerge (Stark et al., 2015a, b, 2017; Mainali et al., 2017) painting a picture of highly ionizing and star forming systems with low metallicity. Hence, the continued search for rest-frame UV emission lines has the potential to not only provide confirmation of the redshifts of EoR systems when Ly is not available, but will also be useful to help determine the characteristics of the galaxies that reionized the IGM at . Rest-frame UV emission lines will therefore be invaluable beacons of information when assembling the picture of the very early Universe.
Here we present the detection of CIV1548,1551Å from HST slitless spectroscopy from the Grism Lens-Amplified Survey from Space (GLASS111http://glass.astro.ucla.edu/; Schmidt et al., 2014; Treu et al., 2015) in a multiply imaged LAE at the EoR. Ly and CIV detections from this object were also presented in Boone et al. (2013); Balestra et al. (2013); Karman et al. (2015); Schmidt et al. (2016) and Mainali et al. (2017). We use the GLASS measurement, together with spectroscopic limits on the CIII]1907,1909Å and HeII1640Å lines, to explore the physical properties of the galaxy via recent photoionization models. In Section 2 we present the system and summarize the spectroscopic confirmations in the literature. In Section 3 we describe the HST spectroscopy and photometry as well as the lens models used in this work. This leads to a discussion of whether the proposed images of the lensed system indeed belong to the same background object in Section 4. We confirm that one of the six proposed images (Image F) is likely not part of the system. In Section 5 we present the CIV detections as well as upper limits and marginal detections for other UV emission lines from the combined and individual components of the multiply imaged system. In Section 6 we compare our result with the recent study by Mainali et al. (2017) who presented an independent CIV detection in one component of the system before we conclude our study in Section 7. Throughout this paper magnitudes are given in the AB magnitude system by Oke & Gunn (1983) and a standard cosmology with km/s/Mpc, , and .
2. A Multiply Imaged LAE at
We study the multiply imaged system behind the galaxy cluster RXCJ2248.7-4431 (also known as Abell S1063; Abell et al., 1989) at (Bohringer et al., 2004) first presented by Monna et al. (2014). From modeling the spectral energy distribution (SED) using Bruzual & Charlot (2003) models with a Chabrier (2003) initial mass function and Padova 1994 evolutionary tracks, Monna et al. (2014) estimated the background source to be a low-metalicity () star-bursting galaxy at . Several components of this system have since been spectroscopically confirmed via detection of the Ly line at . Boone et al. (2013) and Balestra et al. (2013) were the first to spectroscopically confirm components of the system. These detections were corroborated by Karman et al. (2015), Schmidt et al. (2016) and Mainali et al. (2017). This makes the background LAE one of very few multiply imaged systems at the EoR with multiple images spectroscopically confirmed. At present, only 3 other spectroscopically confirmed systems are known at (Richard et al., 2011; Vanzella et al., 2014, 2016c; Huang et al., 2016a).
Monna et al. (2014) initially presented five images of the background LAE. Later, Karman et al. (2015) suggested a tentative sixth image of the system (named Image F, here) from an emission line detection in Multi Unit Spectroscopic Explorer (MUSE) data. Karman et al. (2015) emphasized that the location of this image is in disagreement with their lens model’s predictions. We will reexamine this conclusion in Section 4.3. In Table 1 we provide the coordinates of all components of the system proposed in the literature and give references to the IDs used in the different studies. The position of the individual images are marked on the false-color image of RXCJ2248.7-4431 in Figure 1, where we also show postage stamps zoomed in on each image.
3. HST Spectroscopy, Photometry, SEDs and Lens Models
In this section we summarize the data used in the current study. These include Hubble Space Telescope (HST) grism spectroscopy, archival HST broad band imaging as well as archival lens models based on existing photometry and spectroscopic redshifts.
3.1. The Grism Lens-Amplified Survey from Space (GLASS)
The main spectroscopy used in this work are from near-infrared (NIR) HST slitless grism spectroscopy acquired as part of GLASS. GLASS observed the cores of 10 massive galaxy clusters with the G102 and G141 Wide-Field Camera 3 (WFC3) grisms covering the wavelength range m. Each cluster was observed at two distinct position angles (PAs) roughly 90 degrees apart (indicated by the magenta squares in Figure 1) to accommodate robust contamination subtraction and confirmation of low signal-to-noise ratio (S/N) emission lines. The GLASS spectroscopy is reaching 1 line flux sensitivities of background sources of roughly erg/s/cm2/, where is the lens magnification from the foreground cluster at the position of the source. The broad NIR wavelength range enables the detection of rest-frame UV emission lines, in particular Ly, of a large number of galaxies as illustrated by the 24 LAEs at presented by Schmidt et al. (2016), the multiply imaged LAE at presented by Huang et al. (2016a) as well as the current study. The GLASS data were reduced using an updated version of the 3D-HST reduction pipeline (Momcheva et al., 2016). For further details on the GLASS survey and data reduction we refer the reader to Schmidt et al. (2014) and Treu et al. (2015). Figure 8 in Appendix A shows the 24 individual 2D spectra of the six proposed components of the system in G102 and G141 at the two distinct PAs.
3.2. HFF Imaging and Updated Photometry
The cluster RXCJ2248.7-4431was initially shown to be a prominent lens by the The Cluster Lensing And Supernova survey with Hubble (CLASH; Postman et al., 2012). These data enabled the discovery and study of the LAE studied here as explained in Section 2, and qualified the cluster to be selected as one of the six massive efficient galaxy clusters studied in the Hubble Frontier Fields campaign (HFF; Lotz et al., 2016). As part of the HFF, RXCJ2248.7-4431 was observed multiple times with HST from late 2014 to mid 2016, obtaining deep broad-band images in the optical and NIR with limiting magnitudes down to m (not accounted for lensing magnification). For further details about the HFF data222http://www.stsci.edu/hst/campaigns/frontier-fields/ we refer to Lotz et al. (2016). The completed full-depth HFF imaging was combined with ancillary imaging from the GLASS program, the CLASH imaging, and the HST program ID 14209 (PI: B. Siana). The HST imaging was complemented by Spitzer IRAC channel 1–2 data from the Spitzer Frontier Fields campaign333http://ssc.spitzer.caltech.edu/warmmission/scheduling/approvedprograms/ddt/frontier/ (Capak et al. in prep.) containing 50 hr per band in channel 1 [3.6] and channel 2 [4.5]. We did not include archival observations in channel 3 [5.7] and channel 4 [7.9] as these limits are too shallow to put meaningful constraints on the SEDs presented in Section 3.3. All these data result in two broad-band images blue-wards of the Lyman limit, three in-between the Lyman limit and the Ly wavelength, and nine broad-bands including or being red-wards of the Ly wavelength for this object (cf. Table 2). The two Spitzer bands cover wavelengths long-ward of the Balmer Break.
We estimated the photometry for each component of the multiply imaged system, from the combined mosaics of all these data, many of which are made publicly available by the HFF team.444https://archive.stsci.edu/prepds/frontier/abells1063.html The photometric measurements were obtained by closely following the approach adopted and developed for the ASTRODEEP catalogs for A2744 and MACS0416 (Merlin et al., 2016; Castellano et al., 2016). The ASTRODEEP pipeline models the intra-cluster light (ICL) and bright cluster galaxies with Sérsic and Ferrer components using GALFIT (Peng et al., 2002) and subtracts these, before detecting objects and measuring fluxes, improving photometry of sources close to bright cluster members (e.g., image A and B of the system studied here, see Figure 1). We ran the source detection on the F160W mosaic and obtained broad band fluxes in dual-image mode using SExtractor (Bertin & Arnouts, 1996). As flux errors are often underestimated in deep co-added images due to correlated noise, we estimate the flux error of each source by placing empty apertures within 05 to 20 from each source, similar to the approach described by Trenti et al. (2011).
For each image we compared three different estimates of the final magnitudes:
- i)
Nominal isophotal magnitudes.
- ii)
Nominal isophotal magnitudes imposing ACS magnitude limits for low-S/N detections.
- iii)
Magnitudes estimated in a 04 diameter circular aperture with ACS magnitude limits imposed on the low-S/N detections.
All magnitudes are aperture corrected, where the aperture correction is defined as the difference between SExtractors estimate of the total magnitude (MAG_AUTO) and the isophotal magnitude (MAG_ISO) which is more appropriate for measureing colors. In Table 2 we list the magnitudes obtained from ii) for images B-F, whereas the magnitudes for Image A are aperture magnitudes from iii). The photometry of image A is, despite the GALFIT cluster member subtraction and ICL modeling, affected by the bright central cluster galaxy RXCJ2248.7-4431(see Section 4.2) biasing isophotal magnitudes. We determined the validity of the aperture photometry and aperture corrections for image A based on fake-source simulations in the vicinity of image A. We found iii) to be the most robust photometric measurement for image A and have therefore quoted these results in Table 2.
Comparing our updated photometry from combining archival imaging with the HFF imaging described above, to the archival photometry from CLASH555https://archive.stsci.edu/prepds/clash/, the magnitudes for images C, D, and E, which are less affected by light from neighboring cluster members, agree to within mag averaged over the bands F850LP, F105W, F110W, F125W, F140W, and F160W, where all objects are detected. The CLASH team also provided measurements for image B. In this case the updated ICL-subtracted magnitudes presented here differ from the previous values by on average 0.8 magnitudes. This is to be expected as we subtracted two bright neighboring cluster members (see insert in Figure 1) during the GALFIT modeling, which have likely contaminated the CLASH photometry of image B. The CLASH catalogs do not contain measurements of images A and F due to contamination from the bright central galaxy of RXCJ2248.7-4431 and a non-detection in the shallower CLASH imaging, respectively.
The IRAC imaging used here was deep enough to detect image C in band [3.6] and image E in both [3.6] and [4.5]. The remaining images only have upper limits to their IRAC fluxes due to heavy blending with foreground galaxies or ICL in IRAC (images A, B and D) or non-detections (images F). Detections with IRAC have the power of probing the optical rest-frame emission. If all the IRAC flux was produced by starlight the [4.5] flux is expected to be comparable to, or greater than the flux in [3.6]. An excess in the [3.6] band can be attributed to a contribution from strong [OIII]4959,5007Å line emission at . Such excesses have been proven to be very useful for the selection and study of high-redshift star-forming galaxies (e.g., Stark et al., 2013; Smit et al., 2014, 2015; Roberts-Borsani et al., 2016, Malkan et al. 2016, ApJ in press). Both image C and E show a strong flux excess in the [3.6] band. We will discuss this further in Section 3.3 below.
The UV slope, , based on the obtained photometry for images A-E has a median value of . Combining the UV values for the individual images accounting for uncertainties in the estimates by perturbing the measured flux values according to their photometric errors we get (68% confidence intervals). This is not quite as steep as the UV slope estimated by Monna et al. (2014), and is therefore in better agreement with measurements from HUDF09, ERS and CANDELS (Bouwens et al., 2012, 2014; Finkelstein et al., 2012) correlating the absolute UV magnitude with the spectral slope, . For (mean of magnification-corrected for images A-F) at redshift 6 these relations predict a -value of roughly -2.0, though with a significant scatter in the individually measured slopes of up to 1.
Using GALFIT we find a median half-light radius measured along the major axis of images B–E (uncorrected for lens-distortion) in the F160W images of 350pc. Image A and F were too contaminated/faint to reveal sensible measurements. This size measurements indicates that the background LAE is fairly compact in the continuum, and is in agreement with estimated sizes of equally bright galaxies at similar redshift from the literature (e.g., Huang et al., 2013; Shibuya et al., 2015; Kawamata et al., 2015; Vanzella et al., 2016a, b, c).
3.3. SED Modeling of Photometry
Using the updated ICL-subtracted photometry we estimated the photometric redshift of each of the components of the multiply imaged system using EAY (Brammer et al., 2008) with SED models from Bruzual & Charlot (2003), a Chabrier (2003) initial mass function, and the dust attenuation curve from Calzetti et al. (2000). The resulting best-fit SEDs are shown for images A-F in Figure 2. The redshift probability distribution, , for each fit is shown in the inserted panels. All images favor an SED solution at , in agreement with the spectroscopic redshifts of the individual images presented here and in the literature. Image A and F are the only images with a non-negligible probability of being a galaxy at lower redshift according to these SED fits. We will discuss each of the SED fits in Section 4 and investigate the low-redshift solution for image F further in Section 4.3.
Fixing the redshift of the SED fits to we used the Bruzual & Charlot (2003) models assuming a constant star formation history and 0.2 solar metallicity (the upper bound reported by Monna et al., 2014) we get estimates for the stellar mass (M∗), the star formation rate (SFR), the specific star formation rate (sSFR), the reddening (E(BV)), and the age of the underlying stellar population (Age; the minimum age of the templates in the library is 10Myr). The results from these fits are shown for all six images in Figure 3. The M∗ and SFR are dependent on the lens magnification and have been corrected by described in Section 3.4 (adding the uncertainties in quadrature). The red symbols in Figure 3 show the values from the observed photometry before correcting for the lens magnification, . We note that the results are essentially identical if we use isophotal magnitudes (i) instead of isophotal magnitudes with ACS magnitude limits (ii) for images B-F.
Overall the lens magnification corrected values of M∗ and SFR agree for images A-E within a few . Compared to the stellar mass estimate presented by Monna et al. (2014) and Mainali et al. (2017), the updated photometry presented here (ignoring image F) appears to prefer a higher mass of the lensed source (M⊙ as opposed to M⊙). The SFR is predicted to be of the order 10M⊙/yr. The sSFR shown in Figure 3 agree within 1, except for the estimated sSFR for image C which is below 3.9Gyr*-1* (1), whereas the mean and median values are closer to 35Gyr*-1* (1). This is in good agreement with the 50Gyr*-1* presented for Image E by Mainali et al. (2017). The model for the evolution of the galaxy UV luminosity function by Mason et al. (2015) predicts a sSFR of 3Gyr*-1* for a galaxy of MM⊙ at with an assumed stellar mass to halo mass ratio of 0.01. This is somewhat below the best-fit sSFR for the objects, but is in fair agreement considering the uncertainties in both the models and the SED fits. The low values of the reddening, E(B-V), preferred by the SED fits also agree within a few and are in agreement with the values found by Monna et al. (2014) (A) and the E(B-V)=0.01 found for Image E by Mainali et al. (2017).
The main difference in the fitted SED parameters appear in the estimated age of the underlying stellar population. Images A, B and D, for which we are only able to measure IRAC upper limits, seem to prefer a stellar population younger than Myr. Images C and E also favor stellar population templates younger than 50Myr old when only HST flux densities are included in the SED fits (these HST-only fits are shown by the red dashed lines in Figure 2 for images C and E). However, when their IRAC detections are included, both are favored by older (Myr old) templates, even though they are both still consistent with very young (Myr old) templates within . At , both [OIII]4959,5007Å and H fall in the IRAC [3.6] bandpass, and H falls in the [4.5] band. The blue [3.6][4.5] colors of images C and E ( and , respectively) suggest strong nebular emission lines (e.g., Smit et al., 2015; Huang et al., 2016b) and very young stellar populations. But our Bruzual & Charlot (2003) templates have a hard time matching the red F160W[3.6] and F160W[4.5] colors even with nebular emission lines of large EW1000 and EW{}_{\textrm{H\alpha}}> 500 and line ratios from Anders & Fritze-v Alvensleben (2003) included.
There are two possible reasons why our templates can not simultaneously reproduce the blue [3.6][4.5] color and the red F160WIRAC colors. The first possibility is that this galaxy has emission line ratio [OIII]/H much higher than those inferred by Anders & Fritze-v Alvensleben (2003), in agreement with the expected progressively increasing [OIII]/H ratio at (Faisst et al., 2016). The second possibility is that the Lyman-continuum photon production rate predicted by the Bruzual & Charlot (2003) models are too low for this galaxy. Recent studies (Bouwens et al., 2016) argue for a high LyC photon production rate per UV luminosity at . This could also explain the red F160WIRAC colors for a stellar population younger than 50Myr. Otherwise the red F160WIRAC colors suggest at least a moderate 4000Åbreak.
To summarize, the SED fits to the photometry of images A–E of the LAE indicate a galaxy with a mass of a few times 109M⊙, a SFR of 50–100M⊙/yr, low dust content, and a preferred stellar population Myr old.
3.4. Lens Models of RXCJ2248.7-4431
Being part of the HFF efforts and having extensive spectroscopy from GLASS666https://archive.stsci.edu/prepds/glass/, CLASH-VLT (Balestra et al., 2013; Caminha et al., 2016a) and MUSE (Karman et al., 2015), several high-fidelity lens models of RXCJ2248.7-4431 exist (e.g., Richard et al., 2014; Johnson et al., 2014; Caminha et al., 2016a, and https://archive.stsci.edu/prepds/frontier/abells1063_models_display.html). In Figure 1 we show the critical curve at (white contour) from our Strong and Weak Lensing United (SWUnited, Bradač et al., 2009; Bradac et al., 2005) lens model, which is based on spectroscopic redshifts from Richard et al. (2014) and Monna et al. (2014), i.e. pre-HFF imaging and pre-GLASS spectroscopy.
To estimate the lensing magnification at the location of each of the images A–F we use the HFF magnification calculator777https://archive.stsci.edu/prepds/frontier/lensmodels/#magcalc which returns the predictions from all the available HFF lens models. As large scatter in the estimated magnifications between different models can occur, in Table 2 we quote the median magnification at each image position () after removing the minimum and maximum value. The error bars represent the range of magnifications in the remaining models which roughly corresponds to a 75% confidence interval (\sim$$1\sigma) given that two of the eight estimates were ignored. We also quote the values from our SWUnited model explicitly (). We will use the combined HFF estimates as the lens magnification for each image in the remainder of this paper unless mentioned otherwise.
4. Is the LAE Sextuply Imaged?
In light of the results presented in this paper, the updated HFF photometry on RXCJ2248.7-4431 and results presented in the recent literature, in this section, we will assess whether or not each of the proposed components is likely to be images of the same LAE at .
4.1. Images B–E
Images B, C, D, and E were all independently confirmed to have Ly emission from ground-based spectroscopy at high enough resolution and S/N to resolve the line profile (cf. references in Table 2). Hence, there exists little doubt, if any, that these are all components of the same multiply imaged Ly emitter at . The best-fitting SEDs to the updated ICL-subtracted photometry and the corresponding narrow profiles shown in Figure 2, as well as the detection of Ly and CIV in the GLASS spectra from several of these components, which we will describe in Section 5, confirm this conclusion.
4.2. Image A
The SED fit to the updated ICL-subtracted photometry of image A shown in Figure 2 suggests a high redshift solution for this image, in agreement with the brighter, spectroscopically confirmed components of the system. However, the does suggest a non-negligible low-redshift solution for the SED-fit. Due to image A’s vicinity to the bright central galaxy of RXCJ2248.7-4431 we rely on aperture photometry to get as robust a magnitude measurement as possible. The aperture photometry of image A quoted in Table 2 is in good agreement with the visual impression that image A is fainter than image B in the NIR (see Figure 1).
The potential Ly detections in the spectra of image A are both below 2 and the single CIV detection is also tentative, but agree well with the preferred high- solution of the SED fits
Combined with the predictions of an image of the background LAE at the location of Image A by the lens models (we searched the vicinity of image A for other high- candidates but found none), these measurements leads us to believe that image A is likely a counterpart of the system as suggested in the literature.
The estimates of M∗, SFR, sSFR, E(BV), and the age from the SED fitting shown in Figure 3 are in good agreement with the average values of the other images (the mean and median values shown in Figure 3 changes very little by leaving out Image A), and therefore seem to represent the same (intrinsic) photometry.
4.3. Image F
Karman et al. (2015) proposed a 6th image of the multiply lensed system based on a tentative emission line detection at a wavelength agreeing with the wavelength of Ly in images D and E from the MUSE data of program ID 60.A-9345(A). Karman et al. (2015) emphasized that the component and the detected emission has to be confirmed and that their lens model did not predict an image of the system at the observed location. The critical curve at from our SWUnited lens model shown in Figure 1 confirms that image F is not expected to be part of the system, as the existence of an additional image at the location of image F is incompatible with the geometry of the critical curve and the presence of images D and E, which are both unambiguously part of the multiple image system. The location of the critical curves for the remaining available HFF lens models also disagree with Image F being another image of the system. Hence, based on the lens model it is more likely that the emission is from a low-redshift object, or from another LAE at behind RXCJ2248.7-4431. In the latter case we would expect another set of multiple images from this source. Based on the HFF lens models we locate a box (dashed white box to the NE of image C in Figure 1) in the WFC3/IR field-of-view where 5/7 models predict the counter-image of image F to be (which deviates from the position of images A-E). Five sources located within this box have a photometric redshift estimate in our photometric catalog. None of the GLASS spectra extracted at the location of these sources show signs of an emission line at Å. This is not surprising given that all candidate counterparts have observed magnitudes . In a single source a flux excess at Å is present in one of the two G102 spectra and is not accounted for by the contamination model. We consider this feature unlikely to be an emission line from the source.
The SED fit shown in the bottom right panel of Figure 2 prefers a high- solution, but the probability distribution is much broader for image F than for images B–E and also permits a low- solution at –2. If the MUSE line emission presented by Karman et al. (2015) is [OII]3726,3729Å this would correspond to a galaxy at matching this low- solution. We note that the spectral slope of Image F, if it is at , estimated from the photometry is in agreement with the slope of images A-E quoted in Section 3.2, which is expected giving the similarity of the SEDs of image F and those of images A-E.
As an independent check we downloaded the fully reduced MUSE data cubes of program ID 60.A-9345(A) available from the ESO phase 3 archive888http://archive.eso.org/wdb/wdb/adp/phase3_main/form and extracted the 1D spectra of images D, E and F covered by these data. The location of the MUSE field-of-view is shown by the green square in Figure 1. We extracted the spectra using a simple circular aperture extraction setting the diameter of the extraction aperture to the seeing FWHM for each of the four individual exposures. Figure 4 shows the resulting 1D spectra around the Ly wavelength. Images D and E show clear Ly profiles, whereas the detection in Image F is tentative. The profile of the emission does not match the expected skewed profile of Ly seen in images D and E. This can be caused by a combination of the lower S/N, the increased sky emission in the vicinity of the line (shown in gray in Figure 4), an underlying intrinsic non-Ly profile, or by the absence of a line altogether. In Figure 4 we have shown the expected location of the [OII] doublet at matching the low-redshift solution suggested by the bimodal of the best-fit SED for image F shown in Figure 2. We do not detect any flux-excess at the location of the MgII2796,2803Å doublet in the MUSE spectrum at this redshift, nor do we detect any [OIII]4959,5007Å (which coincides with the location of HeII at ) or H6563Å emission in the GLASS G141 spectra of Image F.
As described in Section 5 below (cf. Table 2) a flux excess at the Ly wavelength was detected in one of the G102 spectra of Image F. This might be a confirmation of the low-S/N line (potential [OII] doublet) seen in the MUSE data.
At the proposed location of image F, the HFF lens models predict a higher magnification than at the location of images A-D (cf. Table 2). This can be seen in Figure 1 by the proximity of image F to the critical curve at . Hence, if image F belongs to the same background source, it should appear brighter in both photometry and in the Ly line than the other less-magnified components of the system. This is clearly illustrated by the inferred absolute UV magnitude () of Image F listed in Table 2 which, given the estimated magnification and the faint observed magnitudes, is several magnitudes below for images A-E. Even though the individual lens models are uncertain, the data disagree with image F being the brightest image and it is therefore unlikely that image F is part of the multiply imaged system and that the feature seen in the MUSE and GLASS spectra is Ly of the same intrinsic strength observed in the other components. The potential CIV detection (1.6) at PA=133 of Image F listed in Table 2 is tentative, and does therefore not contradict this conclusion.
Based on the above arguments, we do not believe that image F is a multiple image of the LAE emitter behind RXCJ2248.7-4431 studied here, and we therefore excluded the spectra and measurements of image F from any of the stacked or combined measurements presented in the analysis and discussion in the remainder of this paper. This conclusion agrees with the caution that image F is not likely part of the system by Karman et al. (2015). Instead image F might be a low-redshift object with [OII] being emitted at the observed wavelength of Ly at .
To conclude, according to the above, the LAE is lensed by RXCJ2248.7-4431 into a quintet of images A, B, C, D and E in the image plane of the cluster as originally identified by Monna et al. (2014) (see also Karman et al., 2015).
5. UV Emission Lines in the System
To measure the line fluxes, flux limits and rest-frame EWs of the rest-frame UV lines in the GLASS spectra, we follow the approach detailed by Schmidt et al. (2016). In short, we use ellipsoidal apertures applied to the contamination subtracted 2D spectra. The sizes of these apertures are either manually optimized to maximize S/N for the flux measurements or set to a fixed size for the flux limit estimates. The continuum levels used for the EW calculations are obtained from the HFF photometry described in Section 3.2. The line fluxes, 1 flux limits at the expected line locations, and the EW estimates are summarized in Table 2 for all components of the lensed system. Neither the flux measurements nor the flux limit estimates in Table 2 have been corrected for the lensing magnification, .
5.1. Combining Flux Measurements and Correcting for Lensing Magnification
The multiple imaging of the background source, and the multiple PAs of the GLASS observations, result in 10 independent spectra of the same source. As listed in Table 2 the Ly and CIV emission lines were detected in multiple components of the system. The lines were observed at wavelengths 8640Å (Schmidt et al., 2016) and 11010Å. Hence, the GLASS data does not indicate any offset between Ly and CIV in excess of the 24Å dispersion of the G102 grism which corresponds to a velocity shift of km/s at the observed Ly wavelength.
To combine the data to improve both S/N and reliability of the individual flux (limit) measurements we have taken two approaches: i) we stacked the observed 2D spectra and ii) combined the individual measurements via a ‘probabilistic Gaussian product’. We will describe each of these approaches and the conclusions we can draw from them in the following.
In the first approach, we created rest-frame stacks of the contamination corrected 2D grism spectra to improve the observed S/N of the emission lines. Figure 5 shows 80Å by 20 cutouts from the inverse variance weighted stack around some of the expected rest-frame UV lines of the LAE. The location of each line is marked by a white circle, which has a diameter of 30Å (rest-frame) in the dispersion direction and in the spatial direction. Clear detections of Ly and CIV are seen in the rest-frame stacks. In an attempt to improve S/N and to remove any possible bias towards the brighter components of the multiply imaged system, we also generated: median stacks, stacks after weighting each spectrum by the measured Ly flux, stacks without weighting and/or scaling, stacks accounting for the continuum levels predicted by the HST broad bands, and all possible combinations of these setups. In all resulting stacks CIV (and Ly) is clearly detected. In Figure 5 a low-S/N flux excess is seen at the OIII] doublet location, which is in agreement with the detection presented by (Mainali et al., 2017, see Section 6). This feature and a potential flux excess at the location of CIII] show up in a few of the differently combined stacks, but deeper data (like those presented by Mainali et al., 2017) are needed to confirm these.
We measured the observed line fluxes and flux limits on these 2D rest-frame stacks. The measurements are summarized in Table 3. Formally we detect OIII]1661,1666Å at 3. However, given significant contamination subtraction residual at the location of the OIII-doublet in the stacks, and given the lack of a detection in several of the alternative stacks described above (unlike Ly and CIV which were both clearly detected in all stacks) we consider this detection tentative.
The rest-frame stack of the grism spectroscopy allows us to estimate the spatial extent of any detected emission in the 2D stacks. Following the approach described by Schmidt et al. (2016), we extracted spatial profiles of the Ly and CIV detections shown in the stacks in Figure 5. To represent the spatial profile of the PSF we extracted an average profile from GLASS spectra of bright stars. Figure 6 shows the resulting spatial profiles of both the emission lines (green and gray curves) and the PSF (blue curve). By modeling each of the spatial profiles as a Gaussian convolution of the PSF, sampling the standard deviations, and minimizing of the comparison we obtain a quantitative estimate of the difference between the emission line profiles themselves and the PSF (red curve in Figure 6; see Schmidt et al., 2016, for details). For both the Ly and CIV profile we do not find any significant deviation from the extent of the PSF. Hence, both emission line profiles are un-resolved in the GLASS observations and do not show any signs of an extended halo. Compared to the surface brightness levels of known Ly halos beyond (erg/s/cm2/arcsec2; Wisotzki et al., 2016) this is not surprising, as the GLASS stack is not expected to reach flux levels below erg/s/cm2/arcsec2. Furthermore, as the morphology of the observed images are distorted by the foreground cluster lensing the stacked signal in the spatial direction is not necessarily enhanced by the same factor as the emission line (source) centers, further impeding the detection of the faint halos.
In the MUSE data described in Section 4.3 the extent of the Ly flux is several times larger than the approximate reported in Figure 6. This extent is driven mainly by the seeing of the MUSE observations (– per visit), which makes it hard to directly compare the spatial extent to the one estimated here from the HST data. However, given that the MUSE data are reaching depths of erg/s/cm2 (Karman et al., 2015) a significant contribution from faint wings below the GLASS detection limits might be seen in the MUSE data.
Ly photons scatter in the IGM and circum-galactic medium, and extended Ly emission is therefore expected and has been reported on several occasions for both galaxies at as well as at lower redshifts (e.g., Steidel et al., 2011; Matsuda et al., 2012; Momose et al., 2014; Wisotzki et al., 2016). How this compares to the CIV emission which also resonantly scatters (e.g. Feibelman, 1983; Villar-Martin et al., 1996; Villar-Martín, 2007; Ardila et al., 2013; Stark et al., 2015a) is still unknown, though we expect the CIV emission to be less extended, as HI probes (Ly) are more sensitive to low density gas, whereas metals (CIV) may be too weak to detect where overall gas column densities are low (Henry et al., 2015; Caminha et al., 2016b). However, given that both the Ly and CIV emission is unresolved in the GLASS grism spectral stacks (and the MUSE wavelength range does not cover the CIV line), we can not draw any conclusions on the (dis)similarities of the two emitting regions. Approved integral field unit observations with The K-band Multi-Object Spectrometer (KMOS) on VLT (196.A-0778, P.I. Fontana) will further help characterize the spatial extent of the CIV emission.
The second approach for combining the GLASS measurements, was to combine the individual fluxes () and flux limits () listed in Table 2. We represented each measurement by a Gaussian probability density function (PDF) with mean and standard deviation . For the flux limits we used the 1 upper limits as as well as for the PDFs. All PDFs are set to 0 for negative fluxes. Each of these Gaussian PDF representations of the measurements are corrected by the lens magnifications listed in Table 2, using that the intrinsic flux is simply the observed flux divided by the magnification, and that the variance on the intrinsic flux is given by:
[TABLE]
Here is the estimated lensing magnification for each image. The uncertainties on the magnification factors quoted in Table 2 are not symmetric, and we therefore, conservatively, use the largest absolute value of the upper/lower magnification ranges as . The product of the individual magnification-corrected PDFs for each image gives us a representation of the intrinsic flux of the background source including information from both the detections and the upper limits. If any of the detections and/or upper flux limits were in disagreement such a product would be driven to 0. Within 3 all our measurements are in agreement with each other. Sampling the distribution resulting from taking the product of the individual PDFs, we obtain the combined intrinsic magnification-corrected line fluxes or line flux limits. In Table 3 we quote the median value and 68% (1) confidence intervals for the final distribution. Comparing these values with the measurements performed directly on the stack also given in Table 3 scaled by the average HFF lens magnification of images A-E (), the de-magnified Ly and CIV fluxes agree within the errors (especially if the large uncertainties on the magnification are folded into the error budget). The intrinsic flux limits appear to be roughly a factor of three tighter from the stack than from the Gaussian PDF if the uncertainties on the lens magnification are ignored. The tentative detection of the OIII]-doublet in the stacks agree with the magnification corrected flux limit set by the Gaussian PDF combination.
5.2. Interpreting UV Line Fluxes and EWs
As mentioned in Section 1, EWs and flux ratios of rest-frame UV lines are strongly correlated with the ionization strength and the gas-phase metallicity of the stellar populations dominating the SEDs of the emitters (e.g. Jaskot & Ravindranath, 2016; Gutkin et al., 2016; Feltre et al., 2016; Stark et al., 2015a, 2017; Mainali et al., 2017; Pérez-Montero & Amorín, 2017). Hence, the obtained flux ratios (limits) from the GLASS spectra can be used as an indicator of the physical properties of the multiply imaged source behind RXCJ2248.7-4431 as described in the following.
The CIII] EW and the flux ratio between CIV and CIII] are sensitive to the gas-phase metallicity and the ionization parameter of the stellar populations (Jaskot & Ravindranath, 2016; Gutkin et al., 2016; Feltre et al., 2016; Pérez-Montero & Amorín, 2017). From the GLASS spectra we get rest-frame EWÅ(1). As shown by Rigby et al. (2015) EWÅ is mainly seen in low-metallicity () systems. The rest-frame EW limit from GLASS is in agreement with the EWs of CIII] seen in EW{}_{\textrm{Ly\alpha}}\sim 70Å objects in the literature (Rigby et al., 2015) and the limits presented in recent studies of other sources at the epoch of reionization (e.g., Zitrin et al., 2015a; Watson et al., 2015; Stark et al., 2017), intermediate redshifts (Amorín et al., 2017), as well as low- systems (Du et al., 2016). The exact levels of CIII] and Z are also dependent on galaxy mass and age of the stellar population. From the GLASS spectra (2). Jaskot & Ravindranath (2016) stress the rarity of (the GLASS data shows a 1 flux ratio of 1.4) illustrating the uncommon properties of this source when compared with the average expected population of UV line emitters in photoionization models. As we only have upper limits on CIII] and HeII we are currently not in a position to put strong constraints on the UV shock diagnostics of the object using the CIII/HeII vs. CIV/HeII diagram proposed by Allen et al. (1998); Villar-Martin et al. (1997) and explored by Jaskot & Ravindranath (2016) and Feltre et al. (2016).999It is worth mentioning that the stellar population synthesis models used to generate these diagnostic diagrams, usually do not incorporate binary massive star systems, which have been found to be important for reproducing observed broad HeII emission at (Steidel et al., 2016). An example of incorporating the effect of binary stars has been developed as part of the Binary Population and Spectral Synthesis code, (BPASS; Eldridge et al., 2008; Eldridge & Stanway, 2009, 2016; Stanway et al., 2016) which was used by Jaskot & Ravindranath (2016) but not by Gutkin et al. (2016) and Feltre et al. (2016). However, the GLASS flux limits on CIII] and HeII combined with the CIV detection allow us to assess the likelihood of the ionizing radiation to come from an AGN and to explore the physical properties of the object using the recent photoionization models by Feltre et al. (2016) and Gutkin et al. (2016). In Figure 7 we show the AGN models (gray diamonds, Feltre et al., 2016) and star forming galaxies (colored circles, Gutkin et al., 2016) in the parameter spaces spanned by the CIV, CIII], HeII and OIII] emission line ratios. We have marked the regions allowed by the GLASS flux measurements by the gray shaded regions (using 2 limits). From this it is clear that the ionizing emission is most likely from star formation and not generated by AGN as very few of the AGN models fall in the areas allowed by the GLASS data.
The first LAE found to have such extremely high-ionization, but narrow, UV line emission was MTM095355+545428 (a galaxy; Malkan et al., 1996). Although MTM095355+545428 also has CIV emission substantially stronger than its CIII]1909, HeII1640, and OIII]1663 lines, Malkan et al. (1996) concluded that they are primarily photoionized by a starburst, rather than a Seyfert nucleus. Their arguments are similar to the ones made here for the LAE behind RXCJ2248.7-4431.
Stark et al. (2015a) presented an example of a star forming galaxy at with f_{\textrm{CIV}}/f_{\textrm{Ly\alpha}}>0.2 similar to CIV-Ly flux ratios from hard ionizing narrow-line type II quasar candidates from Alexandroff et al. (2013). The magnification-corrected combined EWÅ and f_{\textrm{CIV}}/f_{\textrm{Ly\alpha}}=0.24\pm 0.13 of the LAE behind RXCJ2248.7-4431 from the GLASS spectroscopy are very similar to the EW and flux ratio of the object at from Stark et al. (2015a). Given the larger rest-frame EW{}_{\textrm{Ly\alpha}}=68\pm 6Å, as for the Stark et al. (2014) object, it is unlikely that the unusually high CIV-Ly flux ratio is driven mainly by IGM attenuation of the Ly line. Hence, this indicates that the source studied here likely has a more extreme ionizing spectrum, similar to those of AGN, than the more modest CIV-Ly flux ratios seen in redshift 2 galaxies (Stark et al., 2014).
In Figure 7 the star forming models from Gutkin et al. (2016) are color coded according to the gas-phase metallicity (Z, top panels) and the volume averaged ionization parameter (, bottom panels). Here Z is defined as the mass fraction of all elements heavier than Helium (cf. equation (10) by Gutkin et al., 2016). In Figure 7 we have marked the solar value Z and 0.2Z⊙ used in the SED modeling described in Section 3.3 and quoted as the upper limit for the system by Monna et al. (2014). Models with a large range of Z and logU are capable of reproducing the GLASS measurements. However, we note that the relative fraction of ZZ⊙ models with logU is higher in the regions allowed by the GLASS data.
Flux measurements and flux ratios containing NV measurements are also powerful discriminators when comparing ionizing radiation from star formation with that from AGN. In Table 2 we have listed several potential detections of NV. However, given the S/N of some of these (e.g., Image E PA=053) and the non-detection in other spectra, we only consider these detections as tentative, and therefore avoid drawing conclusions on the NV measurements here. Also, as the ionization potential of NV is 97.9 eV (Kramida et al., 2015)101010http://physics.nist.gov/PhysRefData/ASD/ionEnergy.html and we do not detect any HeII (ionization energy = 54.4 eV), we consider it unlikely for this object to have NV-HeII flux ratios given the data. However, should this object indeed have a large NV-HeII ratio, this would point towards radiation powered by star formation from a stellar population, as opposed to an AGN, according to the Gutkin et al. (2016) and (Feltre et al., 2016) models in line with what is seen in Figure 7. The spurious nature of the flux excess at the NV location is supported by a non-detection in the MUSE spectra described in Section 4.3 (even though significant sky-line contamination is present at the NV location in these).
In summary, combining the flux and EW measurements and limits on the rest-frame UV emission lines from the GLASS spectra of the LAE behind RXCJ2248.7-4431 draws a picture of non-AGN system with star-formation ionizing radiation arising in a young stellar population (a few – 200 Myr cf. Section 3.3 and Jaskot & Ravindranath (2016) models).
6. Comparison with Mainali et al. (2017)
Mainali et al. (2017) published a CIV detection in Image E obtained from 9.17 hours of slit-based spectroscopy with FIRE on Magellan. In their work, they extracted the GLASS spectrum of this component. In the following we will compare their results with the results presented in the current work.
Mainali et al. (2017) measure a Ly and CIV1551Å line flux of erg/s/cm2 and erg/s/cm2 from the FIRE spectrum and erg/s/cm2 and erg/s/cm2 from their extraction of the GLASS spectra of Image E. The grism flux estimates of Mainali et al. (2017) are roughly 4 smaller for Ly than the values presented in Table 2. This can probably be attributed to the different approaches in reduction and potential over/under-subtraction of contamination from the spectra before fluxes are measured. The estimated EW{}_{\textrm{Ly\alpha}} from the GLASS spectra also disagree by 4 indicating that the estimated continuum fluxes are similar. Here we used the F105W broadband magnitude from our ICL-subtracted photometry whereas Mainali et al. (2017) estimated the continuum from SED fitting to their own HST and Spitzer/IRAC photometry. Comparing to the EW estimated from the FIRE spectrum, the combined EW presented in Table 2 differs by 3.6. Furthermore, comparing to the EW{}_{\textrm{Ly\alpha}} estimated by Balestra et al. (2013) of Å our estimate agrees with theirs at the 3.0 level. Hence, our space-based EW{}_{\textrm{Ly\alpha}} estimate is bracketed by the FIRE and Balestra et al. (2013) ground-based slit spectroscopic estimates, where correctly accounting for slit-losses is always challenging.
The independent CIV detection and CIII] flux limit from the FIRE and grism spectra, respectively, presented by Mainali et al. (2017) are in good agreement with the measurements presented in Table 2. Following the example of Mainali et al. (2017) and assuming that the flux line ratio f_{\textrm{CIV\lambda1548}}/f_{\textrm{CIV\lambda1551}}=1 for metal poor CIV emitters, the unresolved CIV doublet should have flux of erg/s/cm2 in the GLASS spectra. This is within 3 of the values we measure in the spectra of image E. For a 1:1 flux ratio the EW from Mainali et al. (2017) is in good agreement (1) with the combined EWÅ from the GLASS spectra presented in Table 3. The theoretically expected ratio of the two components in the CIV doublet is 2:1 (e.g., Feibelman, 1983) which has been observed in young low-metallicity objects at presented by Vanzella et al. (2016a). With a CIV doublet flux ratio of two the Mainali et al. (2017) detection would result in a combined CIV flux of erg/s/cm2, which is within 2.4 of the GLASS measurements.
At the location of NV we see a flux excess in the GLASS spectra analyzed in this study. However, as mentioned previously the brightness in individual spectra (including the extracted spectra of Image E) and lack of detection in other spectra, leads us to believe that this feature is spurious. Hence, on the NV flux measurements, we can only conclude that our combined limit is likely biased by spurious detections, but that the individual flux limits do not dis-agree with the limit obtained from the FIRE spectrum by Mainali et al. (2017).
The GLASS limits on HeII presented here agrees with the limit obtained from the FIRE spectrum (erg/s/cm2) presented by Mainali et al. (2017).
Finally, we put observed upper limits on the flux (EW) of OIII] of erg/s/cm2 (Å) and erg/s/cm2 (Å) from the GLASS spectra from the two PAs of image E, respectively (cf. Table 2). These limits are in agreement with the estimates from the FIRE spectrum. However, given that the OIII] doublet is unresolved in the GLASS spectra, the combined flux of the two components of the OIII] doublet from the FIRE spectrum (erg/s/cm2) should in principle be detectable in the stack of the GLASS spectra from all multiply imaged components. The flux excess at the OIII] wavelength seen in the GLASS stack in Figure 5 is as mentioned formally a 3 detection even though we consider it only tentative (see Section 5.1 and Table 3). Nevertheless, we do note that the measured observed flux in the GLASS stack is in agreement with the FIRE detection reported by Mainali et al. (2017).
In the bottom panels of Figure 7 we have over-plotted the FIRE emission line flux ratios of CIV, HeII and OIII from Mainali et al. (2017) (assuming a CIV doublet line ratio of both 2:1 and 1:1). These measurements are in good agreement with the GLASS limits presented in the current study.
Based on the detections and upper limits presented by Mainali et al. (2017) they arrive at conclusions similar to the ones presented in Section 5.2, i.e. that the object has a hard ionizing spectrum arising from star formation rather than AGN activity. They also stress that the system agrees with low-metallicity stellar populations in good agreement with the metallicity indicated by the GLASS data presented here. However, as described in Section 5.2 and shown in Figure 7, also higher metallicities sampled in current photoionization modeling (Gutkin et al., 2016; Jaskot & Ravindranath, 2016; Feltre et al., 2016) can reproduce the current measurements.
7. Conclusions
We have presented the detection of CIV1548,1551Å (and Ly) in a known quintuply imaged object (Monna et al., 2014) at behind the Hubble Frontier Fields cluster RXCJ2248.7-4431 (Abell S1063). The emission was detected in HST slitless grism spectroscopy obtained as part of the GLASS observations. We put informative upper limits on other rest-frame UV emission lines including the CIII]1907,1909Å and OIII]1661,1666Å doublets and HeII1640Å. By combining these measurements with updated ICL-subtracted photometry on all components we have drawn the following main conclusions from the data:
We detect CIV1548,1551Å at more than 3 in two of the five components of the multiply imaged LAE behind RXCJ2248.7-4431. In two further components we see marginal CIV emission at the 2 level. A marginal flux excess of the previously published OIII]1661,1666Å emission (Mainali et al., 2017) is seen in the stack of all components of the system. 2. 2.
The equivalent widths combined from all components of the multiply imaged system of CIII] (EWÅ), CIV (EWÅ) and Ly (EW{}_{\textrm{Ly\alpha}}=68^{+6}_{-6}) are in good agreement with values published in the literature for this system, and agree well with expectations from previous measurements of similar objects. 3. 3.
The flux and EW measurements and limits of the rest-frame UV lines support a picture of a high-redshift galaxy with ionization produced by rapid star formation from a young stellar population (Myr old). The presented data do not favor an AGN-supported radiation field. 4. 4.
Our results and conclusions are in good agreement with the independent detection of CIV (and OIII]1661,1666Å) in image E of the system by Mainali et al. (2017). 5. 5.
The spatial extent of the Ly and CIV emission is un-resolved in the GLASS spectra, i.e. similar to the spatial extent of the PSF estimated from spectra of stars. Hence, we are unable to analyze the potential difference in the spatial extent of the regions emitting in Ly and CIV with the current data. 6. 6.
Based on GLASS and MUSE spectroscopy, the HFF cluster lens models, as well as the updated photometric measurements presented in the current study, we confirm that the potential sixth image proposed by Karman et al. (2015) (image F), is more likely a low- [OII]3726,3729Å emitter or another LAE at .
Hence, the quintuply imaged LAE at studied here is another example of a highly ionizing source powered by star formation in the first 900Myr after Big Bang. Similar sources have likely had an important effect on the ionization history of the Universe. To quantify this effect, larger samples of similar sources need to be assembled to assess whether such galaxies are frequently occurring at high redshift, or have only been discovered in the recent literature due to their extreme properties. JWST will help explore this domain by enabling detection of larger, potentially more typical, populations of galaxies at the EoR () through imaging and spectroscopy in the rest-frame optical.
We would like to thank A. Fontana, M. Castellano. E. Merlin and the ASTRODEEP collaboration for sharing their photometric pipeline and assisting us in developing the photometric catalogs on RXCJ2248.7-4431. We would like to thank E. Vanzella for valuable discussions and input. T.M. acknowledges support from the Japan Society for the Promotion of Science (JSPS) through JSPS research fellowships for Young Scientists. T.J. acknowledges support provided by NASA through Program # HST-HF2-51359 through a grant from the Space Telescope Science Institute, which is operated by the Association of Universities for Research in Astronomy, Inc., under NASA contract NAS 5-26555. This paper is based on observations made with the NASA/ESA Hubble Space Telescope, obtained at STScI, on observations made with the Spitzer Space Telescope, which is operated by the Jet Propulsion Laboratory, California Institute of Technology under a contract with NASA, and on data products from observations made with ESO Telescopes at the La Silla Paranal Observatory under programme ID 60.A-9345(A). We acknowledge support through grants HST-13459, HST-GO13177 and HST-AR13235. STScI is operated by AURA, Inc. under NASA contract NAS 5-26555. B.V. acknowledges the support from an Australian Research Council Discovery Early Career Researcher Award (PD0028506) This research made use of the following open-source packages for Python and we are thankful to the developers of these: Astropy (Astropy Collaboration et al., 2013), APLpy (Robitaille & Bressert, 2012), iPython (Pérez & Granger, 2007), numpy (van der Walt et al., 2011), matplotlib (Hunter, 2007), and PyFITS which is a product of the Space Telescope Science Institute, which is operated by AURA for NASA. The lens models were obtained via the HFF page on the Mikulski Archive for Space Telescopes (MAST).
Appendix A The Individual GLASS Spectra of the Multiple Images
In Figure 8 we show the 24 individual GLASS spectra of the six proposed components (Images A–F) of the LAE emitter at behind RXCJ2248.7-4431. Each spectrum has been subtracted the contamination model and has been scaled to highlight the emission line flux excesses marked by the white circles. The stack cutouts shown in Figure 5 have been generated by combining these spectra excluding the spectra for image F (which is likely not part of the system cf. Section 4.3) and Image B at PA=053 (due to the large contamination at this PA).
The reference list from the paper itself. Each links out to its DOI / PubMed record.
- 1Abell et al. (1989) Abell, G. O., Corwin, H. G. J., & Olowin, R. P. 1989, Astrophysical Journal Supplement Series (ISSN 0067-0049), 70, 1
- 2Alexandroff et al. (2013) Alexandroff, R., Strauss, M. A., Greene, J. E., et al. 2013, Monthly Notices of the Royal Astronomical Society, 435, 3306
- 3Allen et al. (1998) Allen, M. G., Dopita, M. A., & Tsvetanov, Z. I. 1998, The Astrophysical Journal, 493, 571
- 4Amorín et al. (2017) Amorín, R., Fontana, A., Pérez-Montero, E., et al. 2017, Nature Astronomy, 1, 0052
- 5Anders & Fritze-v Alvensleben (2003) Anders, P., & Fritze-v Alvensleben, U. 2003, Astronomy and Astrophysics, 401, 1063
- 6Ardila et al. (2013) Ardila, D. R., Herczeg, G. J., Gregory, S. G., et al. 2013, The Astrophysical Journal Supplement, 207, 1
- 7Astropy Collaboration et al. (2013) Astropy Collaboration, T., Robitaille, T. P., Tollerud, E. J., et al. 2013, Astronomy and Astrophysics, 558, A 33
- 8Balestra et al. (2013) Balestra, I., Vanzella, E., Rosati, P., et al. 2013, Astronomy and Astrophysics, 559, L 9