The Gaia-ESO Survey: low-alpha element stars in the Galactic Bulge
A. Recio-Blanco, A. Rojas-Arriagada, P. de Laverny, S. Mikolaitis, V., Hill, M. Zoccali, J.G. Fernandez-Trincado, A. C. Robin, C. Babusiaux, G., Gilmore, S. Randich, E. Alfaro, C. Allende Prieto, A. Bragaglia, G. Carraro,, P. Jofre, C. Lardo, L. Monaco, L. Morbidelli

TL;DR
This study analyzes Gaia-ESO Survey data to identify low-alpha element stars in the Galactic Bulge, revealing a complex, composite formation history with evidence of multiple stellar populations.
Contribution
It reports the first detection of low-alpha stars in the bulge and links their chemical patterns to the thin disc, highlighting bulge complexity.
Findings
Identification of 18 low-alpha stars deviating from the bulge sequence.
Low-alpha stars show chemical patterns similar to the thin disc.
Evidence supporting a complex, multi-component bulge formation process.
Abstract
We take advantage of the Gaia-ESO Survey iDR4 bulge data to search for abundance anomalies that could shed light on the composite nature of the Milky Way bulge. The alpha-elements (Mg, Si, and whenever available, Ca) abundances, and their trends with Fe abundances have been analysed for a total of 776 bulge stars. In addition, the aluminum abundances and their ratio to Fe and Mg have also been examined. Our analysis reveals the existence of low-alpha element abundance stars with respect to the standard bulge sequence in the [alpha/Fe] vs. [Fe/H] plane. 18 objects present deviations in [alpha/Fe] ranging from 2.1 to 5.3 sigma with respect to the median standard value. Those stars do not show Mg-Al anti-correlation patterns. Incidentally, this sign of the existence of multiple stellar populations is reported firmly for the first time for the bulge globular cluster NGC 6522. The identified…
Click any figure to enlarge with its caption.
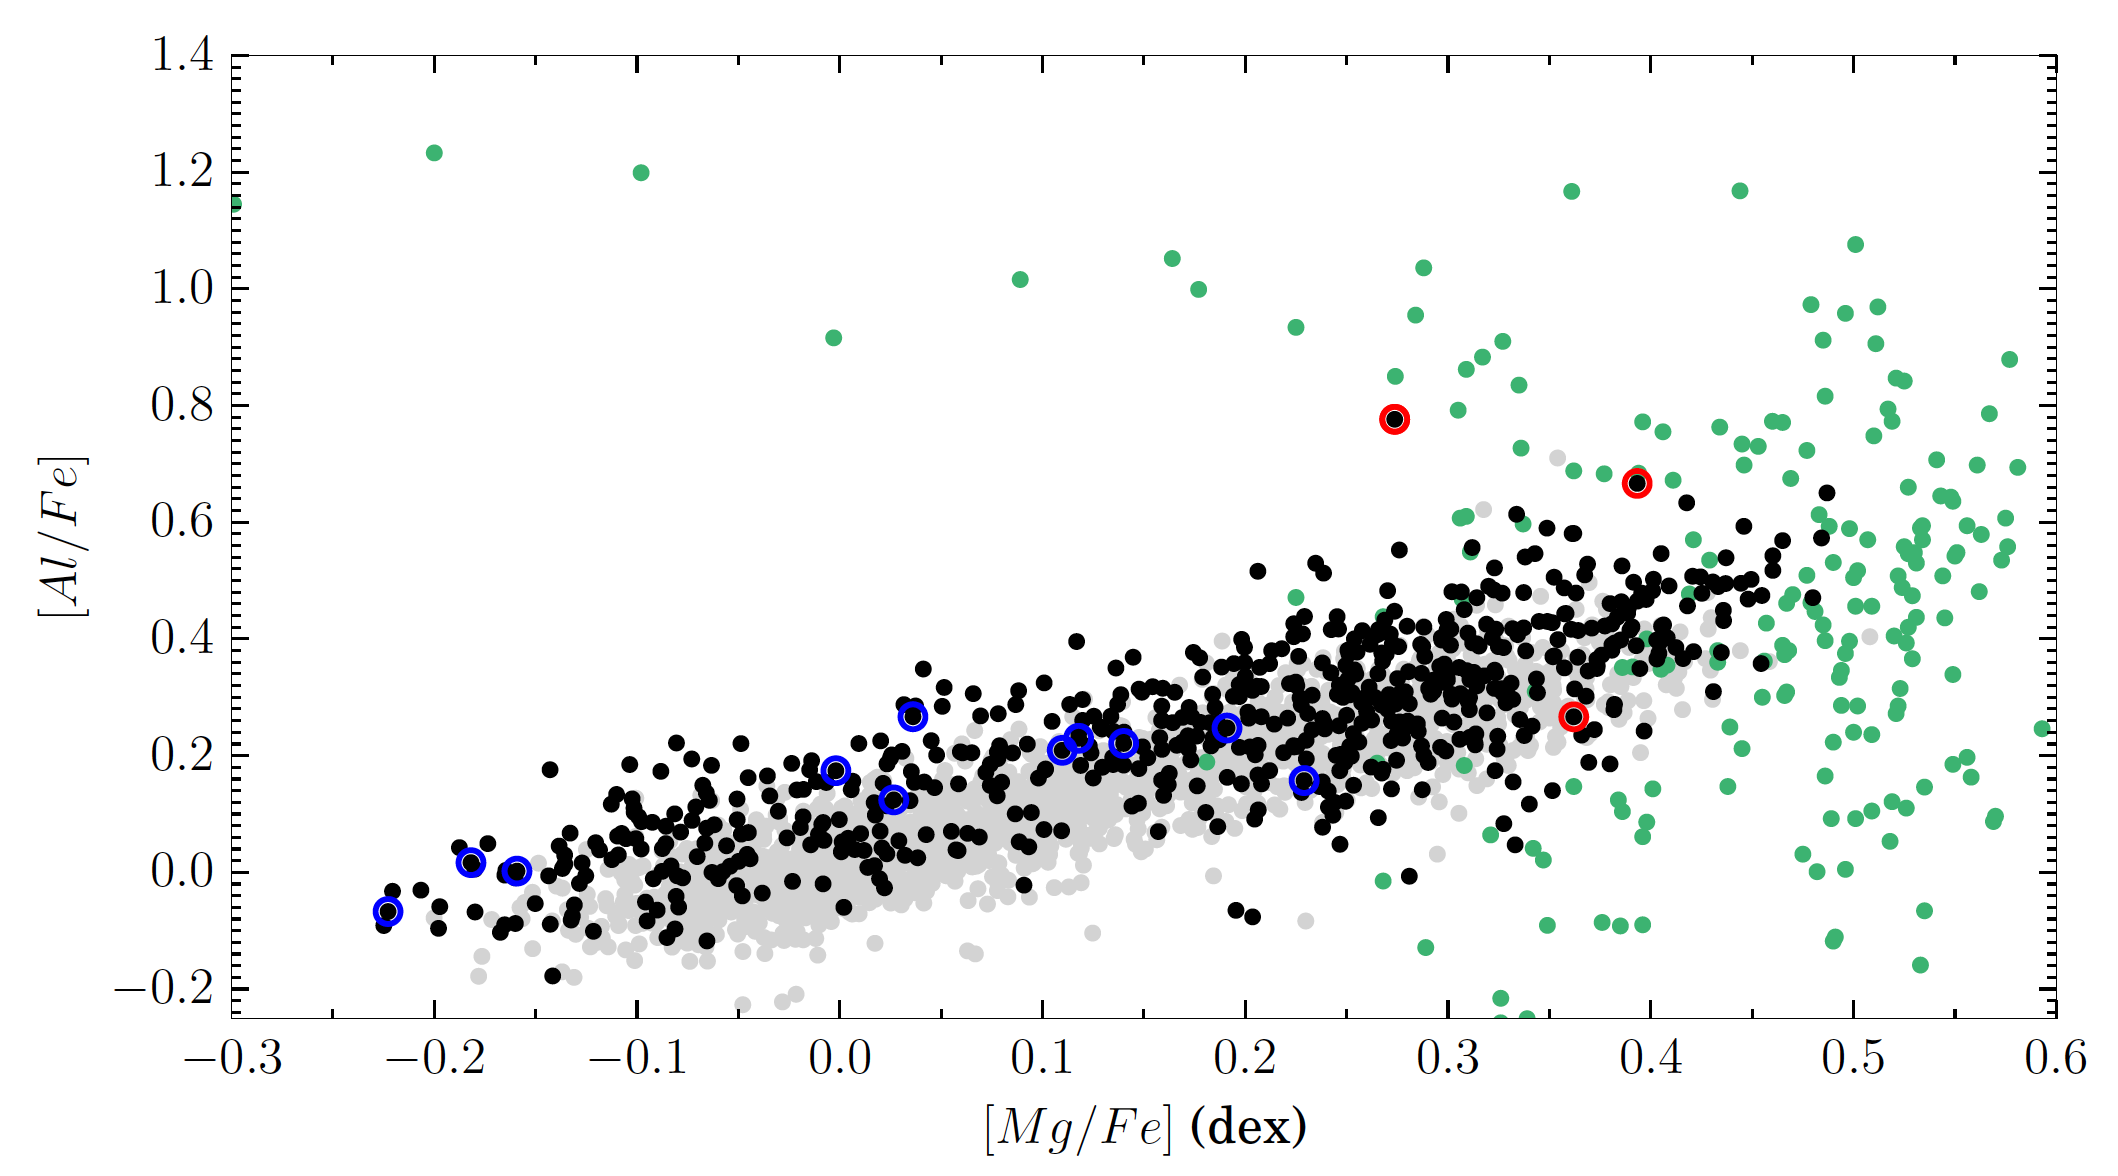 Figure 1
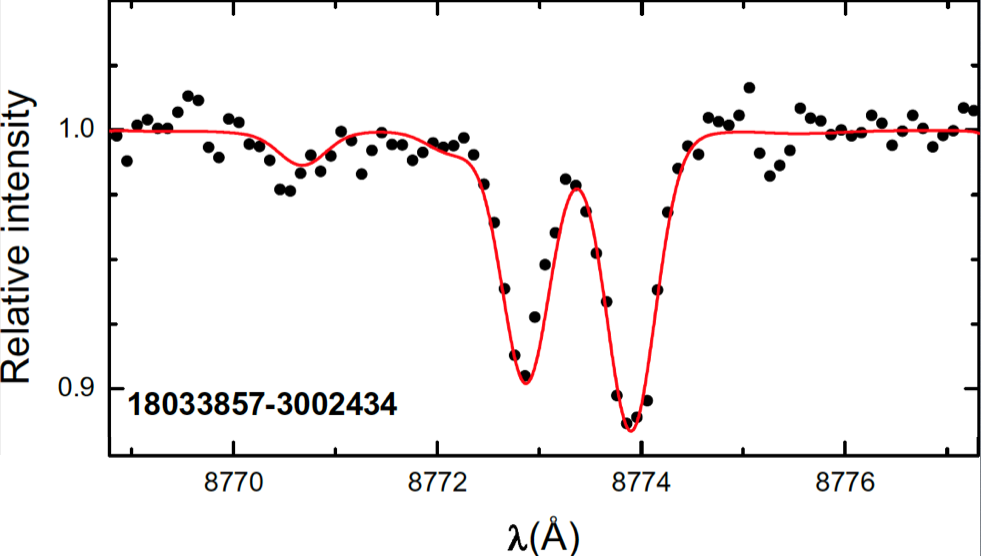 Figure 2
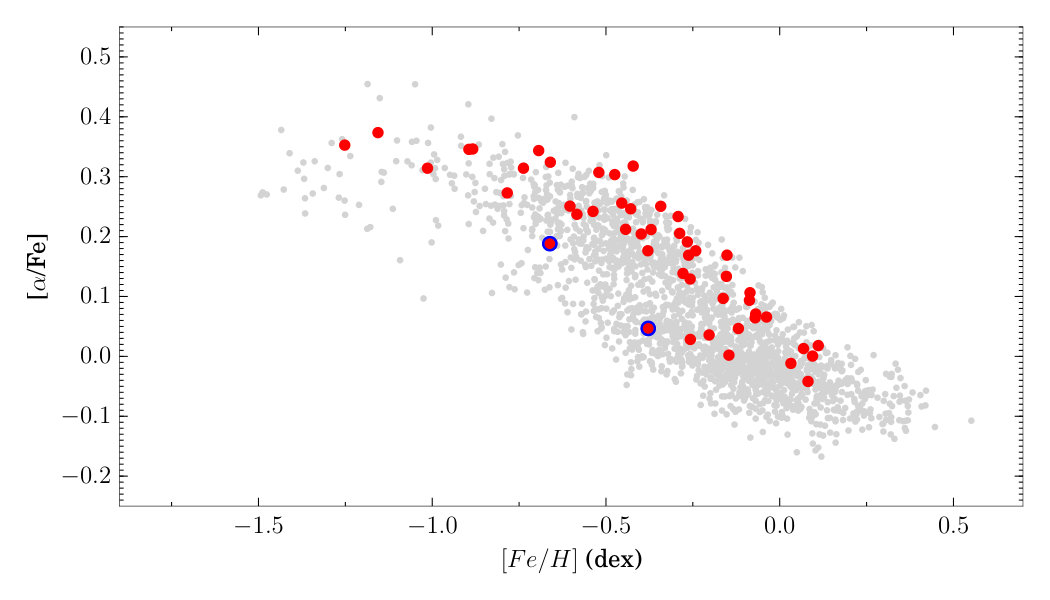 Figure 3
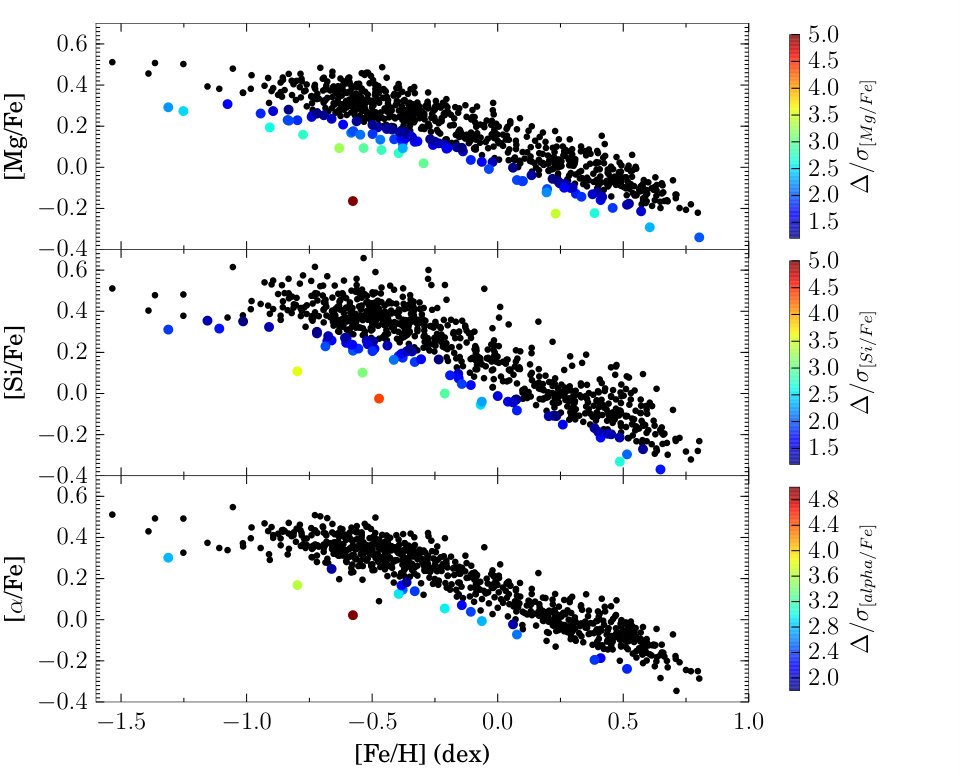 Figure 4
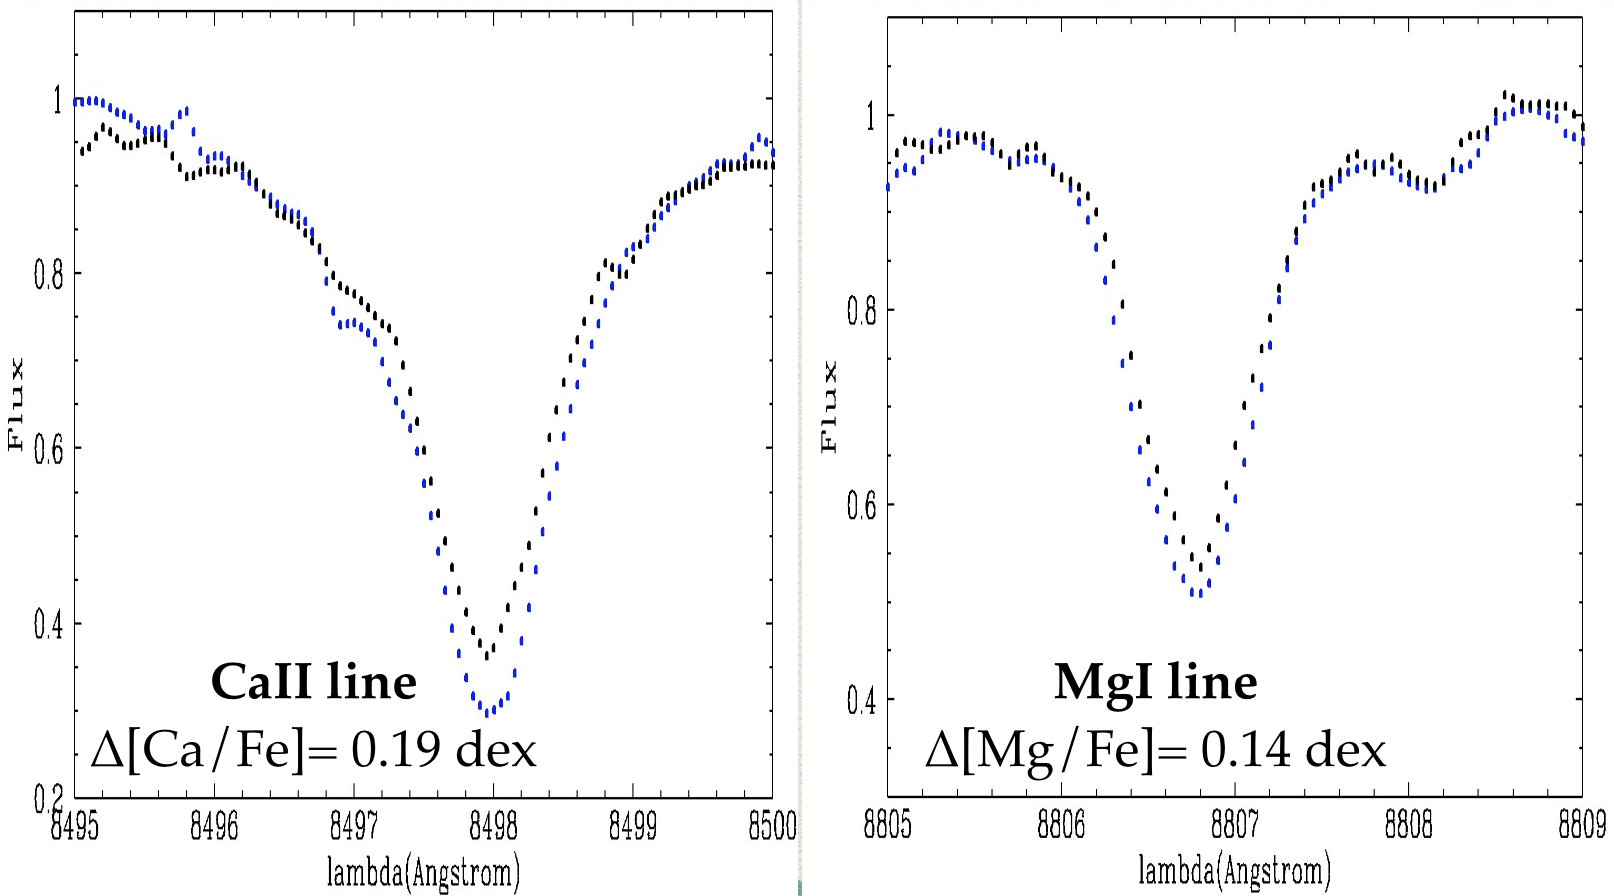 Figure 5
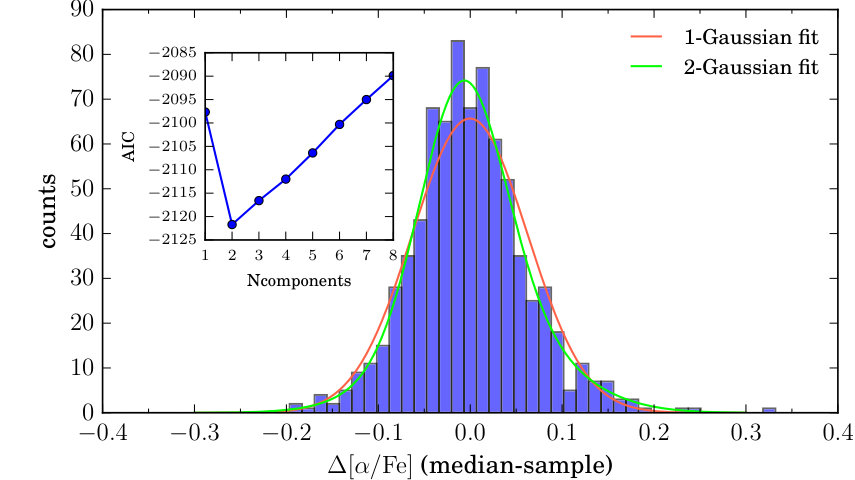 Figure 6
| cname | Teff | setup configuration | ||||||
|---|---|---|---|---|---|---|---|---|
| 18032412-3003001 | 4674 36 | 2.39 0.14 | -0.66 0.03 | 0.24 0.02 | 0.26 0.02 | — | 2.0 | HR10,HR21 |
| 18034317-3006349 | 4819 95 | 2.65 0.35 | -0.38 0.02 | 0.12 0.06 | 0.17 0.05 | 0.23 0.06 | 2.5 | HR10,HR21 |
| 17534571-4105165 | 4354 37 | 2.06 0.24 | -0.39 0.02 | 0.07 0.06 | 0.18 0.02 | — | 2.9 | HR21 |
| 17553025-4106299 | 4606 168 | 2.70 0.26 | -0.58 0.02 | -0.16 0.08 | 0.21 0.08 | — | 5.3 | HR21 |
| 17562638-4129329 | 4561 53 | 2.45 0.42 | -0.33 0.05 | 0.12 0.08 | 0.15 0.07 | — | 2.4 | HR21 |
| 17571064-4145311 | 4959 87 | 2.74 0.50 | -0.38 0.08 | 0.14 0.02 | 0.19 0.07 | 0.22 0.05 | 2.2 | HR21 |
| 17571166-4128521 | 4553 49 | 2.55 0.28 | -0.06 0.05 | 0.02 0.09 | -0.04 0.06 | 0.12 0.02 | 2.8 | HR21 |
| 17573538-4136125 | 4809 72 | 2.48 0.24 | -0.80 0.02 | 0.23 0.02 | 0.11 0.09 | 0.16 0.03 | 3.6 | HR21 |
| 17582234-3449464 | 4560 150 | 2.51 0.59 | 0.07 0.04 | -0.06 0.08 | -0.08 0.02 | — | 2.6 | HR21 |
| 18030869-2956389 | 4607 105 | 2.78 0.45 | -0.11 0.07 | 0.03 0.09 | 0.04 0.03 | 0.26 0.04 | 2.4 | HR21 |
| 18033088-3003563 | 4551 43 | 2.71 0.08 | 0.41 0.02 | -0.16 0.05 | -0.21 0.02 | 0.00 0.03 | 2.1 | HR21 |
| 18035188-3005558 | 4574 65 | 2.86 0.28 | -0.21 0.08 | 0.11 0.02 | 0.00 0.09 | 0.21 0.03 | 3.0 | HR21 |
| 18233838-3413015 | 4625 64 | 2.98 0.29 | 0.38 0.07 | -0.22 0.03 | -0.17 0.02 | -0.07 0.04 | 2.4 | HR21 |
| 18244002-2449329 | 5000 216 | 2.83 0.52 | -1.31 0.08 | 0.29 0.03 | 0.31 0.02 | — | 2.8 | HR21 |
| 18250175-2514127 | 4463 91 | 2.79 0.08 | 0.51 0.02 | -0.18 0.08 | -0.29 0.04 | 0.02 0.02 | 2.3 | HR21 |
| 18251816-2529497 | 4663 45 | 2.78 0.37 | -0.36 0.07 | 0.16 0.04 | 0.20 0.03 | — | 2.0 | HR21 |
| 18352178-2659169 | 4636 57 | 2.85 0.33 | 0.06 0.03 | 0.00 0.02 | -0.04 0.04 | 0.17 0.06 | 2.0 | HR21 |
| 18360308-2716364 | 4664 36 | 2.43 0.28 | -0.14 0.06 | 0.09 0.03 | 0.04 0.08 | — | 2.2 | HR21 |
Peer Reviews
No public reviews on file for this paper yet. If you reviewed it on a platform where reviews are public (OpenReview, ICLR, NeurIPS, ICML), you can paste yours below so the community can read it here.
Videos
No videos yet. Explain this paper in a talk, walkthrough, or lecture? Add one.
Taxonomy
TopicsAstronomy and Astrophysical Research · Stellar, planetary, and galactic studies · Astronomical Observations and Instrumentation
11institutetext: Université Côte d’Azur, Observatoire de la Côte d’Azur, CNRS, Laboratoire Lagrange, France
11email: [email protected] 22institutetext: Institute of Theoretical Physics and Astronomy, Vilnius University, A. Gotauto 12, 01108 Vilnius, Lithuania 33institutetext: Instituto de Astrofísica, Facultad de Física, Pontificia Universidad Católica de Chile, Av. Vicuña Mackenna 4860, Santiago, Chile 44institutetext: Millennium Institute of Astrophysics, Av. Vicuña Mackenna 4860, 782-0436 Macul, Santiago, Chile 55institutetext: Institut Utinam, CNRS, Université de Franche-Comté, OSU THETA Franche-Comté-Bourgogne, Obs. de Besançon, France. 66institutetext: GEPI, Observatoire de Paris, CNRS, Université Paris Diderot, 5 Place Jules Janssen, 92190 Meudon, France 77institutetext: Institute of Astronomy, Cambridge University, Madingley Road, Cambridge CB3 0HA, United Kingdom 88institutetext: INAF-Osservatorio Astrofisico di Arcetri, Largo E. Fermi, 5, 50125, Firenze, Italy 99institutetext: Instituto de Astrofísica de Andalucía-CSIC, Apdo. 3004, 18080, Granada, Spain 1010institutetext: Instituto de Astrofísica de Canarias, E-38205 La Laguna, Tenerife, Spain 1111institutetext: INAF - Osservatorio Astronomico di Bologna, via Ranzani 1, 40127, Bologna, Italy 1212institutetext: Dip. di Fisica e Astronomia, Univ. de Padova, Vicolo Osservatorio 3, 35122 Padova, Italy 1313institutetext: Núcleo de Astronomía, Facultad de Ingeniería, Universidad Diego Portales, Av. Ejercito 441, Santiago, Chile 1414institutetext: Astrophysics Research Institute, Liverpool John Moores University, 146 Brownlow Hill, Liverpool L3 5RF, United Kingdom 1515institutetext: Departamento de Ciencias Fisicas, Universidad Andres Bello, Republica 220, Santiago, Chile 1616institutetext: INAF Padova Observatory, Vicolo dell’Osservatorio 5, 35122 Padova, Italy
The Gaia-ESO Survey: low- element stars in the Galactic Bulge††thanks: Based on data products from observations made with ESO Telescopes at the La Silla Paranal Observatory under programme ID 188.B-3002. These data products have been processed by the Cambridge Astronomy Survey Unit (CASU) at the Institute of Astronomy, University of Cambridge, and by the FLAMES/UVES reduction team at INAF/Osservatorio Astrofisico di Arcetri. These data have been obtained from the Gaia-ESO Survey Data Archive, prepared and hosted by the Wide Field Astronomy Unit, Institute for Astronomy, University of Edinburgh, which is funded by the UK Science and Technology Facilities Council.
A. Recio-Blanco 11
A. Rojas-Arriagada 11
P. de Laverny 11
S. Mikolaitis 22
V. Hill 11
M. Zoccali 3344
J.G. Fernández-Trincado 55
A. C. Robin 55
C. Babusiaux 66
G. Gilmore 77
S. Randich 88
E. Alfaro 99
C. Allende Prieto 1010
A. Bragaglia 1111
G. Carraro 1212
P. Jofré 771313
C. Lardo 1414
L. Monaco 1515
L. Morbidelli 88
S. Zaggia 1616
(Received …; accepted …)
We take advantage of the Gaia-ESO Survey iDR4 bulge data to search for abundance anomalies that could shed light on the composite nature of the Milky Way bulge. The -elements (Mg, Si, and whenever available, Ca) abundances, and their trends with Fe abundances have been analysed for a total of 776 bulge stars. In addition, the aluminum abundances and their ratio to Fe and Mg have also been examined. Our analysis reveals the existence of low- element abundance stars with respect to the standard bulge sequence in the vs. plane. 18 objects present deviations in ranging from 2.1 to 5.3 with respect to the median standard value. Those stars do not show Mg-Al anti-correlation patterns. Incidentally, this sign of the existence of multiple stellar populations is reported firmly for the first time for the bulge globular cluster NGC 6522. The identified low- abundance stars have chemical patterns compatible with those of the thin disc. Their link with massive dwarf galaxies accretion seems unlikely, as larger deviations in abundance and Al would be expected. The vision of a bulge composite nature and a complex formation process is reinforced by our results. The used approach, a multi-method and model-driven analysis of high resolution data seems crucial to reveal this complexity.
Key Words.:
The Galaxy : abundances – The Galaxy : bulge – The Galaxy : stellar content
1 Introduction
The study of the Galactic bulge is rapidly unveiling its complexity. Because of its physical properties (metallicity distribution, age, spatial location, kinematical features…), the bulge is at the cross-road of the other main Galactic components like the halo, the thick disc and the thin disc. As a consequence, the formation scenarios currently invoked are directly linked to the general evolution of the Milky Way and to one crucial opened question: the importance of fast versus secular evolution. Three main scenarios are proposed: i) in situ formation via dissipative collapse of a protogalactic gas cloud (Eggen et al., 1962), ii) accretion of substructures in a CDM context (e.g. Scannapieco & Tissera, 2003), and (iii) secular formation from disc material through bar formation, vertical instability, buckling, and fattening, producing a boxy/peanut bulge (e.g. Martinez-Valpuesta & Gerhard, 2013; Di Matteo et al., 2014).
Our knowledge of the bulge has improved relevantly in the recent years, however, many key opened questions remain. By way of example, the number of bulge components, estimated from the metallicity distribution function, kinematical and structural data, is still under debate. Although up to five components have been suggested (e.g. Ness et al., 2013), recent studies (e.g. Rojas-Arriagada et al., 2014; Schultheis et al., 2016, Zoccali et al. 2016) show that only two components seem to be necessary. In this context, precise individual chemical abundances are crucial to disentangle the different evolutionary pathways responsible for the bulge formation. The first studies in this sense regarded mainly (but not exclusively) -element abundances (e.g. McWilliam & Rich, 1994; Bensby et al., 2013; Gonzalez et al., 2015) that, combined with iron abundances, can unveil important information regarding the initial mass function and the star formation history of a stellar system. Up to now, the different analyses have revealed a single sequence in the vs. plane, flattening at metallicities lower than -0.370.09 dex (e.g. Rojas-Arriagada et al., 2016a), the metallicity at which the maximum of supernovae type Ia rate occurred. However, recent observations extending the analysis to other elements have already detected departures from what seemed to be a simple chemical evolutionary path, like the existence of nitrogen over-abundant stars (Schiavon et al., 2017b).
The goal of this paper is to take advantage of the Gaia-ESO Survey (GES, Gilmore et al., 2012; Randich et al., 2013) bulge data to search for abundance anomalies that could reveal the bulge composite nature. The data are described in Sect. 2, our results are presented in Sect. 3 and their interpretation is developed in the final Sect. 4.
2 GES stellar parameters, distances and orbits.
We have used the atmospheric parameters and individual chemical abundances (Fe, Mg, Si and Al) of bulge stars observed by GES, using the GIRAFFE spectrograph, and included in its fourth internal data release. The data are described in detail in Rojas-Arriagada et al. (2016a). The initial total sample comprises 2320 red clump stars in 11 bulge fields, sampling the area -10 l +10*∘* and 10 b -4*∘*.
We remind that the HR21 setup was employed for all the bulge stars. In addition, 172 stars in Baade’s Window were observed with the HR10 setup. Those stars are in common with the analysis of Hill et al. (2011).
As the search for abundance anomalies has to rely on very precise results, we have applied the following selection criteria to the initial sample: 2.0 \log\leavevmode\nobreak\ g$$<3.0 dex, 250 K, 0.6 dex, 0.1 dex, 0.1 dex, 0.1 dex, 0.1 dex. This reduces the sample to 776 stars with very high quality parameters (42 of them observed with two setups). The mean signal-to-noise of the working sample is 28070 (deviation estimated from the MAD). We make use of the Rojas-Arriagada et al. (2016a) spectroscopic distances, estimated for the same data set, to ensure that our selection is confined to the bulge region (R kpc). The median error of the distances is 1.2 kpc (around 16%). Finally, OGLE proper motions available for the subsample of stars in Baade’s Window (Sumi et al., 2004) allowed the estimation of the stellar orbital parameters. To this purpose, we have adopted the Model 4 presented in Fernández-Trincado et al. (2016) and composed of nonaxisymmetric potentials.
3 Search for -element abundance anomalies
The main challenge of testing the existence of stars with non standard low- element abundances is demonstrating that they do not belong to the high error queue of a normal abundance distribution. To this purpose, we have first d a fiducial median profile and a 1 dispersion band, over 11 iron abundance bins for the , the and the abundances. Secondly, we have computed, for each star, the difference in , and with respect to the median values of the corresponding iron bin (in the sense median minus sample), called \Delta$${\rm[Mg/Fe]}, \Delta$${\rm[Si/Fe]} and \Delta$${\rm[\alpha/Fe]}, respectively.
If there are low- element stars in the bulge, the distribution of the \Delta$${\rm[\alpha/Fe]} around the standard value should be 1) skewed, and 2) not corresponding to a single gaussian. We have first applied a D’Agostino skewness test to the \Delta$${\rm[\alpha/Fe]} abundance distribution. The skewness value of the \Delta$${\rm[\alpha/Fe]} is 47.5 (p-value of 4.88e-11), confirming the asymmetry. We have tested the robustness of this result to the existence of strong outliers by reapplying the D’Agostino test considering only the stars within 2 sigma from the median abundance value. Both the z-score of the test (6.9) and its p-value (0.03) seem to confirm that even the core of the distribution deviates from normality and it is skewed towards the low-alpha side. In addition, we have applied a Gaussian Mixture Method (GMM, Rojas-Arriagada et al., 2016b) to estimate the number of components of the distribution. The GMM algorithm constructs a generative model that consists in the specific Gaussian mixture that better predicts the data structure. We adopted the Akaike information criterion (AIC) as a cost function to assess the relative fitting quality between different proposed mixtures. The results of this analysis are shown in Figure 1. Clearly, the single component solution can be excluded to explain the data distribution, highlighting the existence of an asymmetry.
Furthermore, the dispersion of the measured abundances in metal-rich globular cluster giants can help us to realistically evaluate the errors on the bulge abundances. We have considered two observed clusters, within the same constraints as in our bulge analysis sample (c.f. Sect. 2): NGC 104 (=-0.660.05 dex, 30 stars) and NGC 5927 (=-0.330.06 dex, 56 stars). The two clusters dispersion in the abundances (0.035 dex and 0.045 dex, respectively), the (0.04 and 0.05 dex, respectively) and the (0.05 and 0.06 dex, respectively) is clearly lower than that of the bulge distribution (0.06 dex for , 0.07 dex for and 0.08 dex for ), reinforcing the hypothesis of a complex v.s. sequence in the bulge.
3.1 Stars selection separately from different -elements.
First of all, we have analyzed the abundances of Mg and Si, and their trends with the Fe abundance. Figure 2 shows the vs. distribution (upper panel), the vs. one (middle panel) and the vs. distribution defined as (+)/2 (lower panel). Then, we have identified the stars showing deviations larger than 1.2 in \Delta$${\rm[Mg/Fe]} and in \Delta$${\rm[Si/Fe]} (colour coded in the upper and middle panels of Fig. 2). To ensure that the anomaly is present in more than one element (avoiding possible Mg depleted globular cluster escapées, e.g. Carretta et al., 2009), we have restricted the selection to the intersection of the low-Mg and low-Si subsamples. Finally, an additional condition was imposed: only the objects showing deviations greater than 2 in \Delta$${\rm[\alpha/Fe]} were selected. The final subsample of stars are colour coded in the bottom panel of Fig. 2. It includes 18 objects with underabundances ranging from 2.1 to 5.3 . 90% of them are within 2.5 kpc from the Galactic centre and two thirds are within 1.8 kpc.
A number of checks have been performed to further test the reliability of the abundance anomalies. First of all, it has been verified that the measurement dispersions in the parameters and the abundances provided by the different GES analysis nodes (and taken as a proxy of the error) are similar for the anomalous stars and for the reference sample of 776 objects. In addition, the spectra of representative stars showing anomalies have been compared to those of stellar twins (with maximum differences of 50 K for Teff, 0.02 dex for and 0.03 dex for ). This is possible thanks to the fact that the bulge GES targets are restricted to the red clump and the chances of finding stellar twins in the sample are high. These comparisons allowed to confirm that the Mg and Si abundances of the identified anomalous stars are in fact underabundant with respect to their twins of standard composition. As an example, the spectrum of the anomalous star 17553025-4106299 (with {\rm[Mg/Fe]}$$=-0.160.08 dex, {\rm[Si/Fe]}$$=0.210.08 dex) differs clearly in the -element lines from that of its twin 18262565-3151577, having {\rm[Mg/Fe]}$$=0.310.09 dex and {\rm[Si/Fe]}$$=0.370.06 dex. An additional illustration of spectral twins comparison is given in Figure B.1 of the Appendix. Third, the differences between the spectroscopic and the photometric Teff values (derived following González Hernández & Bonifacio, 2009) of the stars presenting abundance anomalies have been checked and compared to those of the stars with standard compositions. No particular problems that could indicate specific errors in the spectroscopic Teff of the anomalous stars have been found. Moreover, the sensitivity to possible errors of the Mg and Si lines has been verified using synthetic spectra. Although the estimated Si abundances are slightly sensitive to uncertainties, it is not the case of the Mg abundances. In the same line, the variation of the Mg and Si abundances with the typical uncertainties are at least 6 times smaller than the detected anomalies. Finally, it has been checked that the stars presenting abundance anomalies do not belong to a unique GES bulge field and GIRAFFE exposure, which could reveal possible problems with the data reduction, like sky sustraction residuals. In conclusion, all the above mentioned verification tests confirm the real -poor nature of the identified bulge stars.
3.2 Baade’s Window data
Particular attention has been paid to the stars in Baade’s Window (BW), for which both GES HR21 and HR10 spectra are available. Those stars, with more reliable parameters and abundance estimations, have measurements of an additional element (calcium), and they have literature abundance determinations from Hill et al. (2011) for comparison. Figure 3 shows the distribution of (defined as ) vs. for the 48 stars of BW with high quality estimations of Mg, Si and Ca abundances (red points). The two red circles highlighted with blue edges correspond to the stars 18034317-3006349 (\rm[Fe/H]$$=-0.38\pm 0.03 dex) and 18032412-3003001 (\rm[Fe/H]$$=-0.66\pm 0.02 dex), already identified to have Mg and Si underabundances in Fig. 1. These two stars are confirmed to be under abundant, even when Ca is considered. In addition, the star 18034317-3006349 seems to lay on the locus of the corresponding thin disc sequence, well below the standard values of the bulge at its metallicity interval.
Literature values from Hill et al. (2011) are available for these two stars. First, the GES iron abundances are compatible within the errors with the Hill et al. (2011) ones. Second, the ratio of Hill et al. (2011) for the star 18032412-3003001 (0.09 0.18 dex) is also 1 below the corresponding median value for that metallicity interval. They do not report Mg abundance estimations for the other star.
Lastly, the orbits of the two stars seem confined to the bulge region. The derived radial apocentric distances for 18034317-3006349 and 18032412-3003001 are 2.751.1 kpc and 1.871.3 kpc respectively. The corresponding maximum vertical amplitudes are 1.160.2 kpc and 1.660.4 kpc.
3.3 Aluminum abundances
Two aluminum lines in the HR21 spectra allowed the derivation of Al abundances for the GES bulge data. Figure 4 shows the abundance with respect to the one for the studied bulge stars (black points). Low- stars of Section 3.1 are highlighted with blue circles. As in Fig. 3, the abundances of disc stars are also included for comparison as light grey points. Finally, green points show the Carretta et al. (2009) values for GC stars (c.f their Figure 5). First, the results presented in Fig. 4 show that the identified low- bulge stars do not present GC abundance patterns. Their Al abundance seems to be in agreement with the Mg one, laying on the same sequence as bulge stars of standard composition. Moreover, the disc and the bulge sequences overly in the same locus of the figure, as expected.
Incidentally, three members of the globular cluster NGC 6522 (=-1.140.10 dex) were observed in the GES BW fields (marked with red circles in Fig. 4). One of these stars, 18033857-3002434, presents a clear Al over-abundance with =0.780.03 dex and a Mg-depletion with respect to the other two (=0.270.03 dex), with no sign of Si under-abundance (=0.380.07) or Ca under-abundance (=0.400.07). Figure B.2 shows the fit of the two Al lines at 8772.8 and 8773.8 Å for this star, confirming the reliability of the estimated Al abundance and the continuum normalisation. As a consequence, the three NGC 6522 members present clearly a Mg-Al anti-correlation, as seen in Fig. 4. This result confirms the previous abundance measurements of Ness et al. (2014) of 8 potential NGC 6522 members, and it reinforces the existence of multiple populations in this old cluster of relatively low-mass.
4 Discussion
The analysis of the Gaia-ESO survey bulge data reveals the existence of low- abundance stars. It is necessary to invoke a complex bulge phylogenesis to explain the reported intrinsic spread of abundances at a given metallicity. The results presented here are compatible with the existence of a (at least) bimodal distribution of . They also present a more detailed vision of the vs. bulge trends than previous works analyzing large samples of stars (e.g. Ness et al., 2013), thanks to the GES high resolution and high signal-to-noise data. They bring into light the presence of bona fide low- stars in the bulge that were already visible, without being remarked, in several studies in the literature (e.g. García Pérez et al., 2013, and references therein).
Several scenarios can be invoked to interpret this situation. First, only massive dwarf galaxies, like the Sagittarius dwarf spheroidal, could have benefited from an efficient enough chemical enrichment to reach the metallicity range concerned by our analysis. In those cases, we would expect deviations in the vs. plane of at least 3 or more with respect to the standard values of the bulge (e.g. McWilliam et al., 2013) Therefore, very few objects of our study have chemical patterns compatible with this explanation.
Second, the identified low- abundance stars have chemical patterns compatible with those of the thin disc. A disc contribution to the bulge formation (e.g. Di Matteo et al., 2015) would indeed leave its imprints in the chemical abundances, being compatible with the observed outliers from the standard bulge sequence. In this sense, a possible spread (or bimodality) of the stellar ages (Haywood et al., 2016) in the bulge would be in agreement with this scenario. Nevertheless, the spread could be present even at metallicities as low as -0.5 dex, challenging this interpretation.
On the other hand, our finding of multiple stellar populations in the cluster NGC6522, added to the Schiavon et al. (2017a) results for other clusters, reinforces the link between the globular clusters and the nitrogen abundance anomalies of field stars reported by Schiavon et al. (2017b).
Finally, we would like to point out that the search of non-standard objects benefits from the methodology implemented by GES. First, the use of a multi-method spectral analysis allows reducing the inevitable methodological errors. Moreover, the simultaneous analysis of several elements having similar nucleosynthetic origins is important to avoid errors affecting the lines of a particular element. Lastly, model-driven methods like the ones employed in this study are more appropriate for the search of unexpected objects than data driven methods, working by construction in a close environment of knowledge.
In summary, the bulge composite nature and, therefore, its complex formation process is reinforced by the present results, with all the strength of a multi-method abundance analysis of high resolution and high quality data.
Acknowledgements.
ARB, PdL and VH acknowledge financial support form the ANR 14-CE33-014-01. This work was partly supported by the European Union FP7 programme through ERC grant number 320360 and by the Leverhulme Trust through grant RPG-2012-541. We acknowledge the support from INAF and Ministero dell’Istruzione, dell’Università e della Ricerca (MIUR) in the form of the grant ”Premiale VLT 2012”. The results presented here benefit from discussions held during the Gaia-ESO workshops and conferences supported by the ESF (European Science Foundation) through the GREAT Research Network Programme. M. Zoccali gratefully acknowledge support by the Ministry of Economy, Development, and Tourism’s Millenium Science Initiative through grant IC120009, awarded to the Millenium Institute of Astrophysics (MAS), by Fondecyt Regular 1150345 and by the BASAL-CATA Center for Astrophysics and Associated Technologies PFB-06.
Appendix A List of stars with low- abundances
The list of stars identified in Sect. 3 as having anomalously low- abundances is included in Table A.1.
Appendix B Visual inspection of spectral lines
Figure B.1 presents two examples of -element lines (the CaII line at 8498.0 Åand the MgI line at 8806.7 Å) allowing to compare the spectra of two stellar twins. The abundances differences in Ca and Mg are reported in the figure.
Figure B.2 shows two aluminum lines of one Al-rich star of the globular cluster NGC6522.
The reference list from the paper itself. Each links out to its DOI / PubMed record.
- 1Bensby et al. (2013) Bensby, T., Yee, J. C., Feltzing, S., et al. 2013, A&A, 549, A 147
- 2Carretta et al. (2009) Carretta, E., Bragaglia, A., Gratton, R., & Lucatello, S. 2009, A&A, 505, 139
- 3Di Matteo et al. (2015) Di Matteo, P., Gómez, A., Haywood, M., et al. 2015, A&A, 577, A 1
- 4Di Matteo et al. (2014) Di Matteo, P., Haywood, M., Gómez, A., et al. 2014, A&A, 567, A 122
- 5Eggen et al. (1962) Eggen, O. J., Lynden-Bell, D., & Sandage, A. R. 1962, Ap J, 136, 748
- 6Fernández-Trincado et al. (2016) Fernández-Trincado, J. G., Robin, A. C., Moreno, E., et al. 2016, Ap J, 833, 132
- 7García Pérez et al. (2013) García Pérez, A. E., Cunha, K., Shetrone, M., et al. 2013, Ap J, 767, L 9
- 8Gilmore et al. (2012) Gilmore, G., Randich, S., Asplund, M., et al. 2012, The Messenger, 147, 25