Nematic Fluctuations and Phase Transitions in LaFeAsO: a Raman Scattering Study
U. F. Kaneko, P. F. Gomes, A. F. Garcia-Flores, J. Q. Yan, T. A., Lograsso, G. E. Barberis, D. Vaknin, and E. Granado

TL;DR
This study uses Raman scattering to investigate nematic fluctuations and phase transitions in LaFeAsO, revealing that magnetic fluctuations drive the structural transition and highlighting differences in nematic dynamics compared to related compounds.
Contribution
It provides new insights into the role of magnetic degrees of freedom in structural transitions of LaFeAsO through Raman scattering analysis.
Findings
Nematic fluctuations are observed via a quasi-elastic peak in Raman spectra.
Magnetic degrees of freedom drive the structural transition in LaFeAsO.
Nematic fluctuations exhibit slower dynamics compared to BaFe2As2.
Abstract
Raman scattering experiments on LaFeAsO with splitted antiferromagnetic (T_AFM = 140 K) and tetragonal-orthorhombic (T_S = 155 K) transitions show a quasi-elastic peak (QEP) in B2g symmetry (2 Fe tetragonal cell) that fades away below ~T_AFM and is ascribed to electronic nematic fluctuations. A scaling of the reported shear modulus with the T-dependence of the QEP height rather than the QEP area indicates that magnetic degrees of freedom drive the structural transition. The large separation between T_S and T_AFM in LaFeAsO compared with their coincidence in BaFe2As2 manifests itself in slower dynamics of nematic fluctuations in the former.
Click any figure to enlarge with its caption.
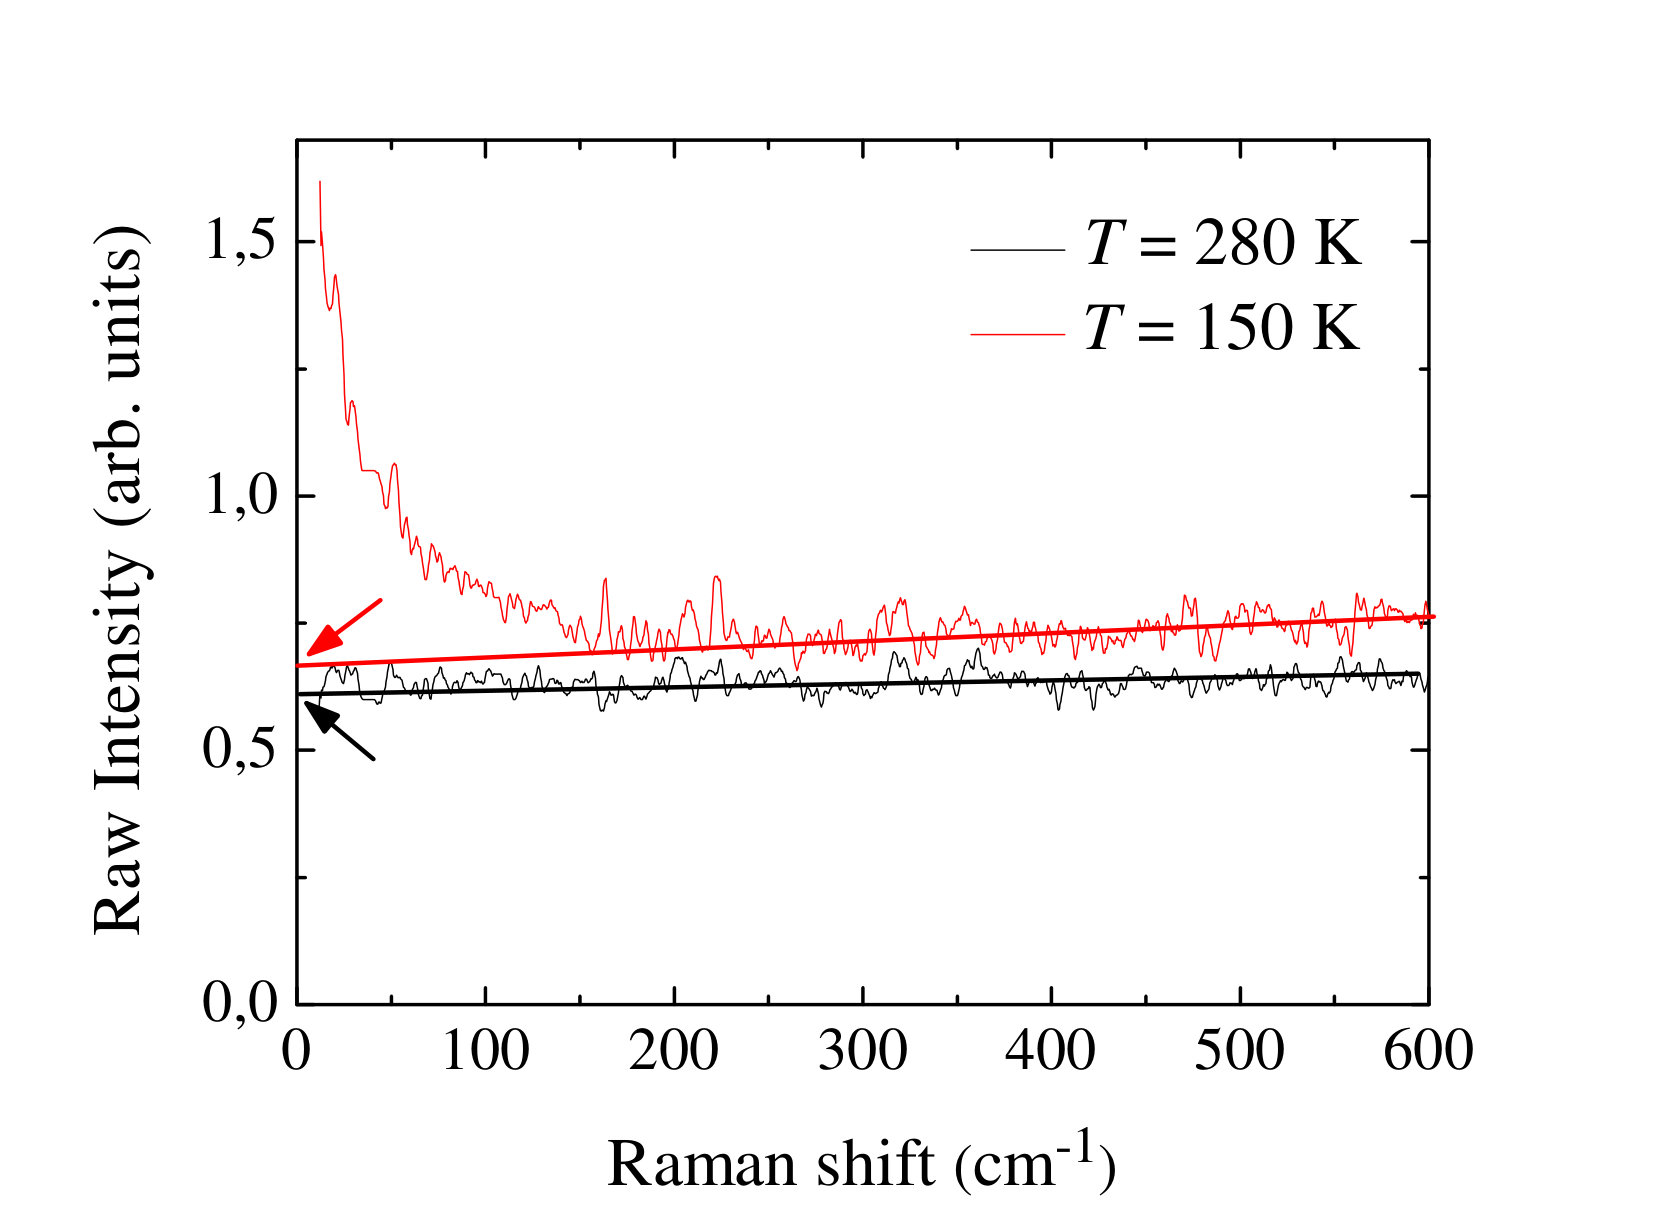 Figure 1
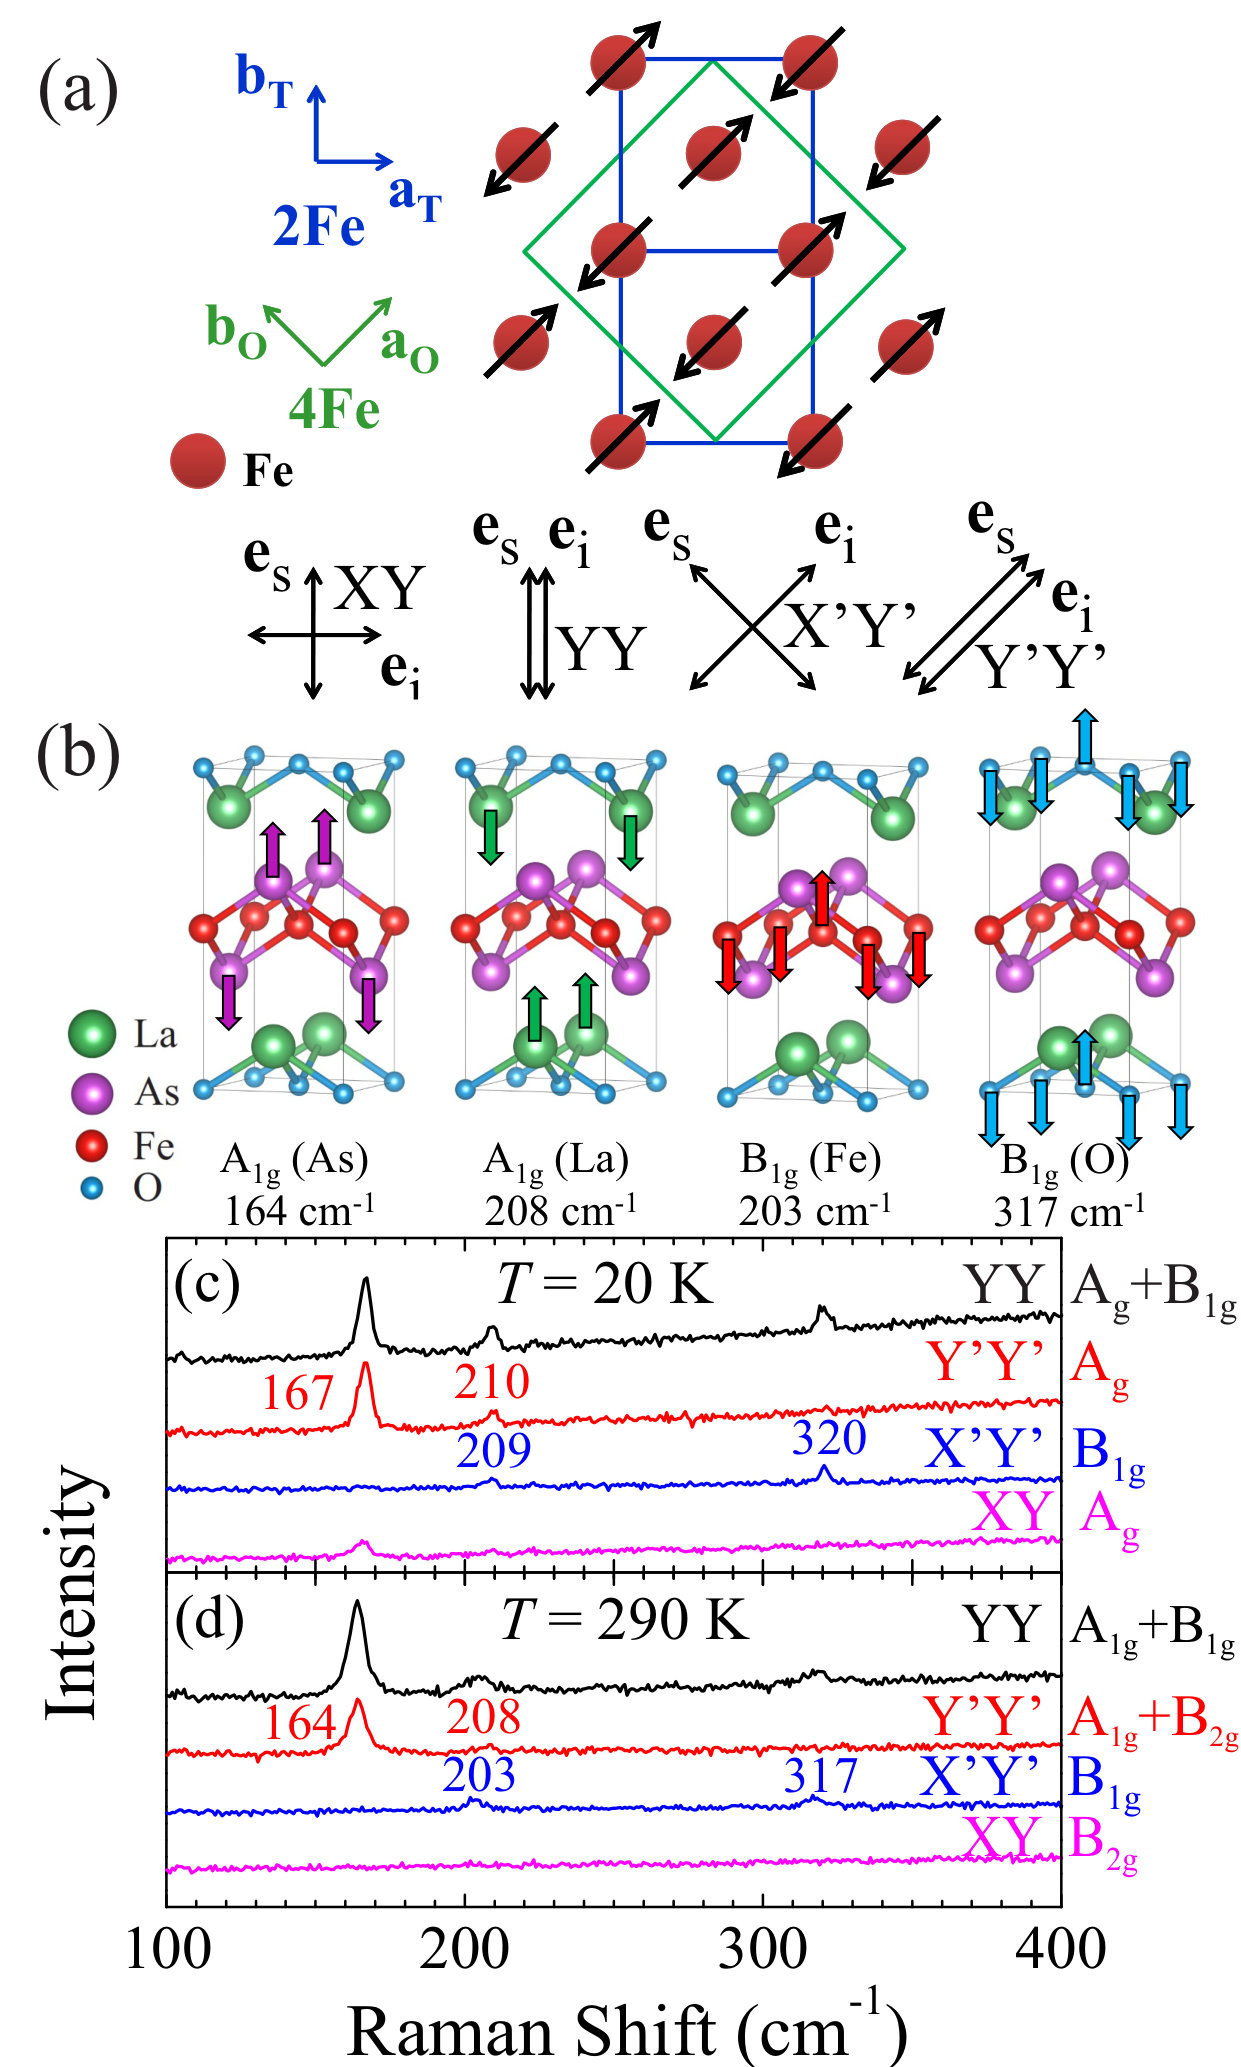 Figure 2
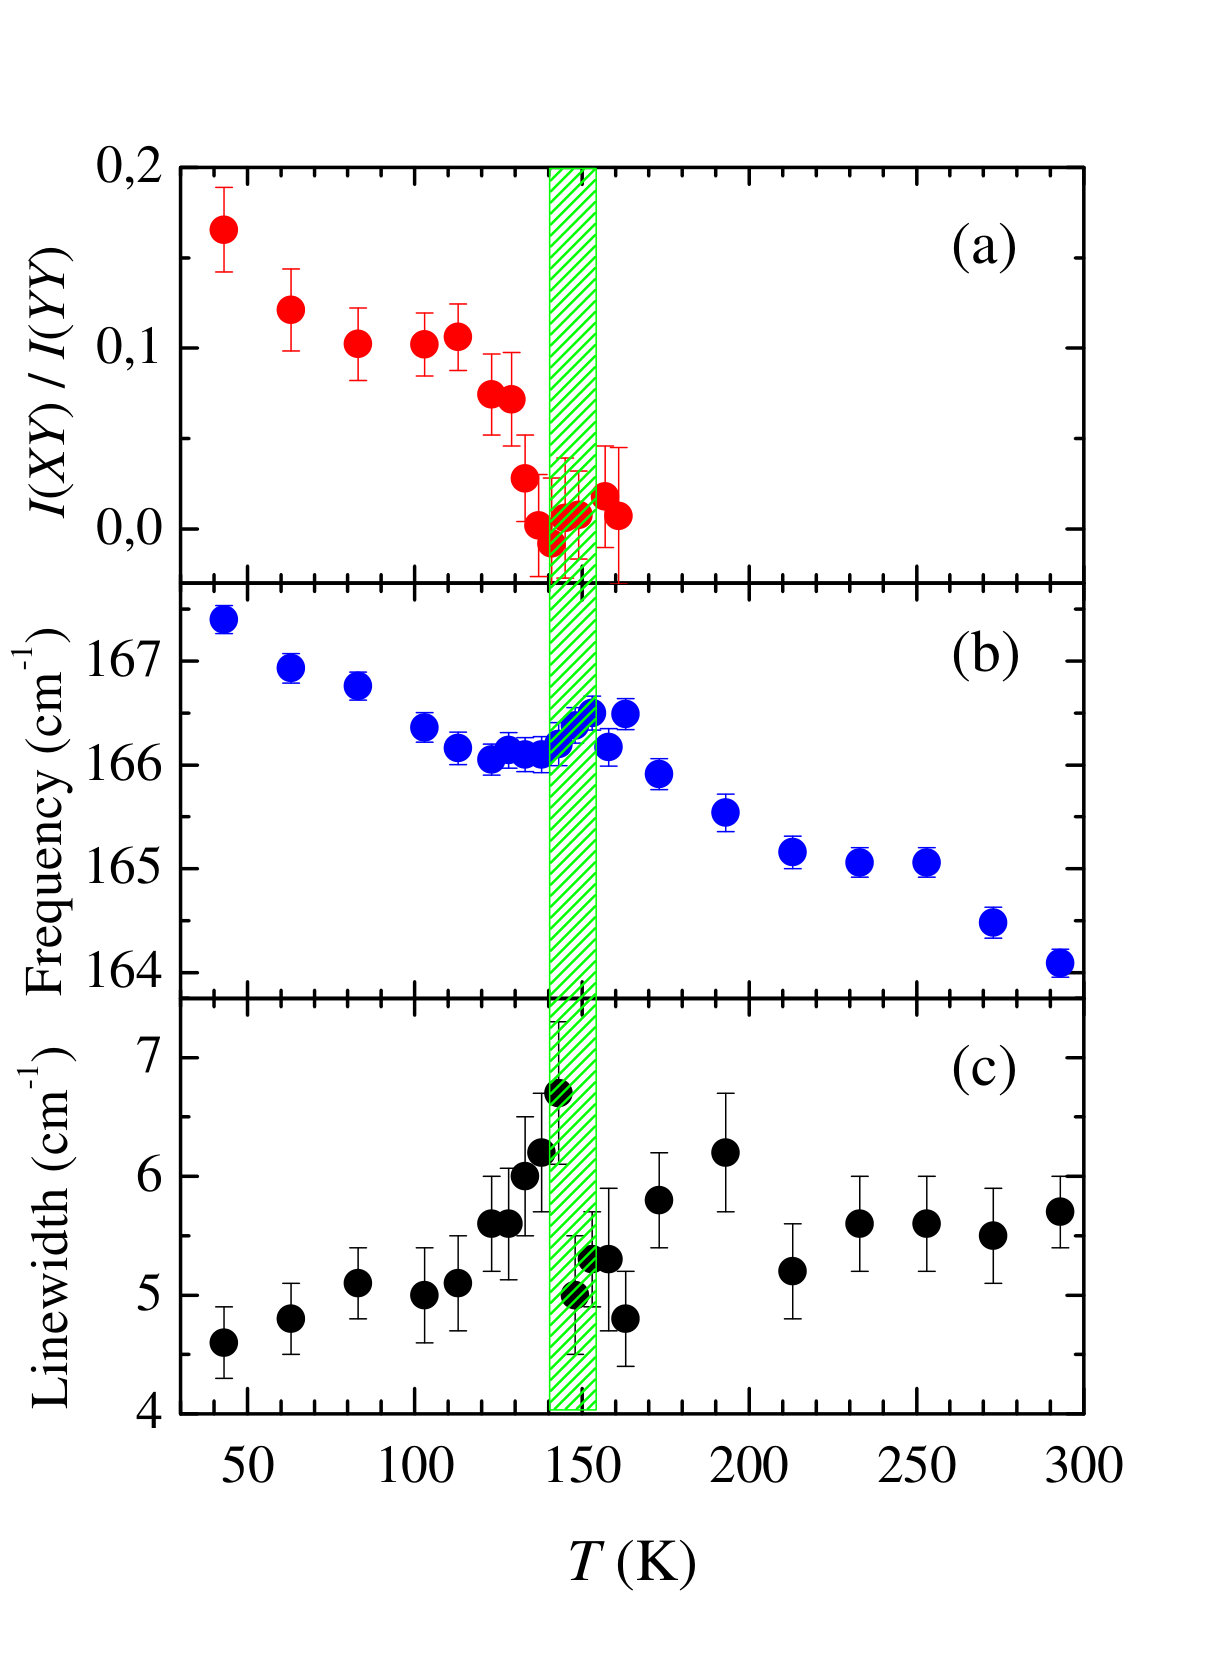 Figure 3
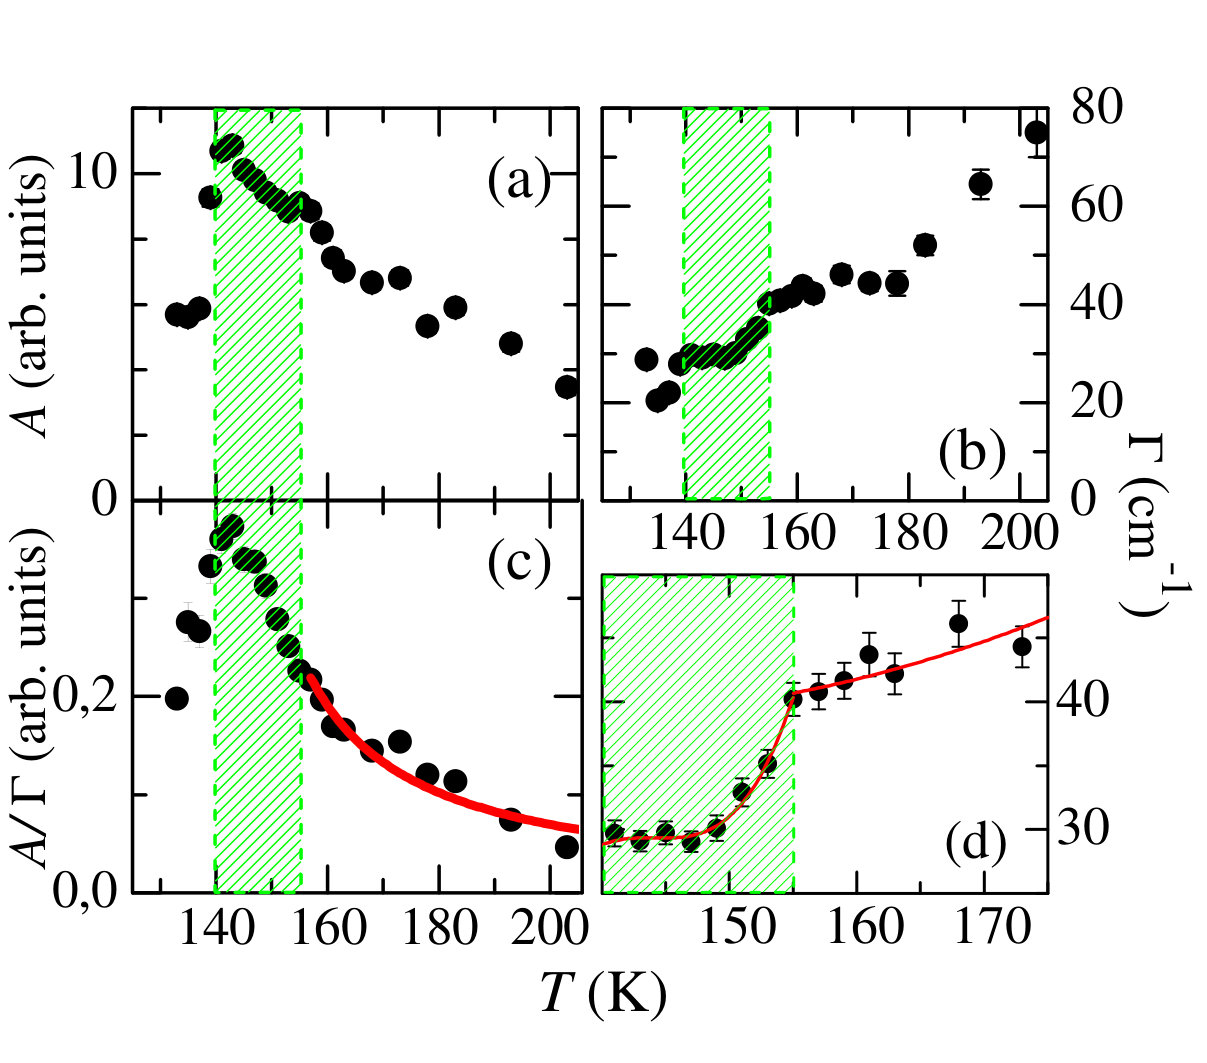 Figure 4
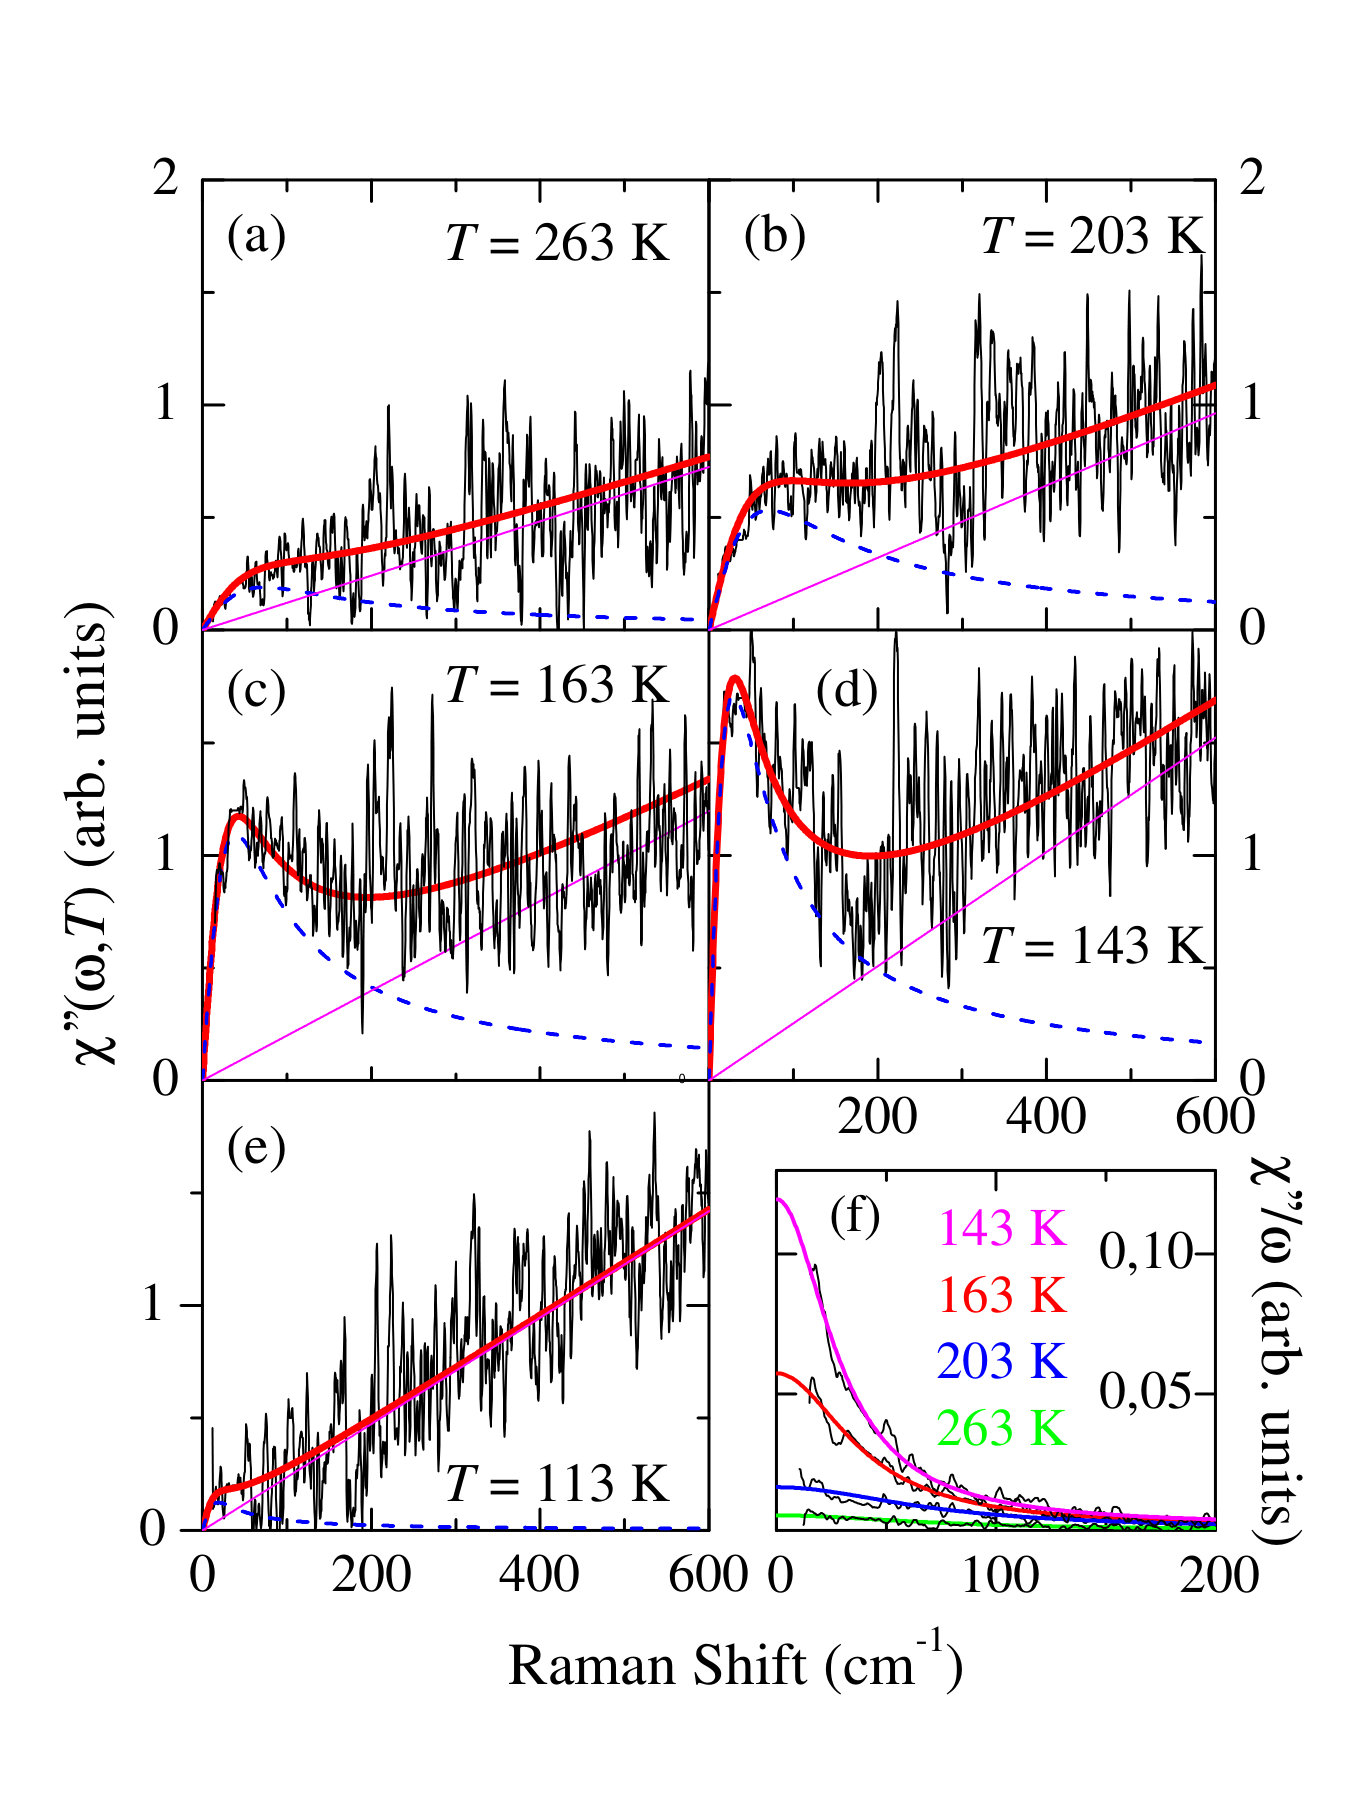 Figure 5
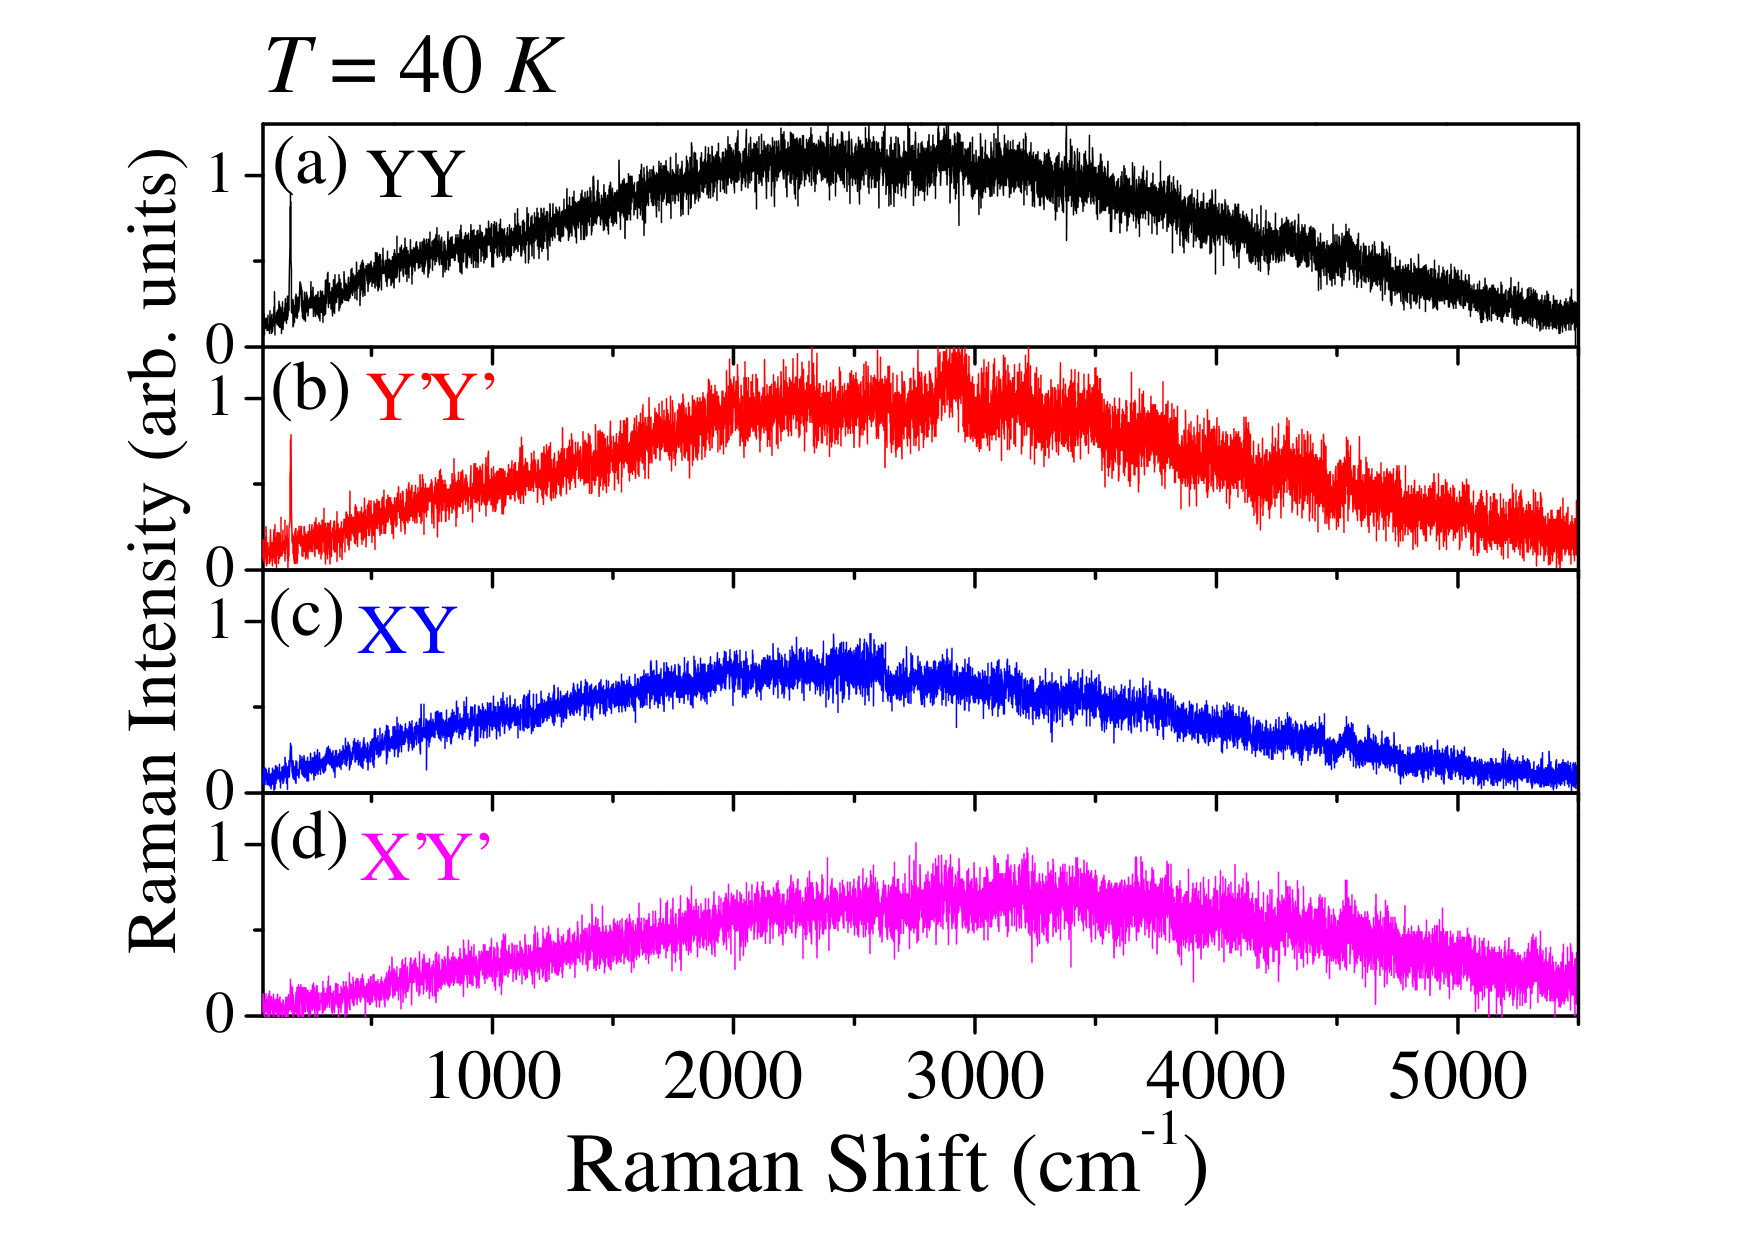 Figure 6
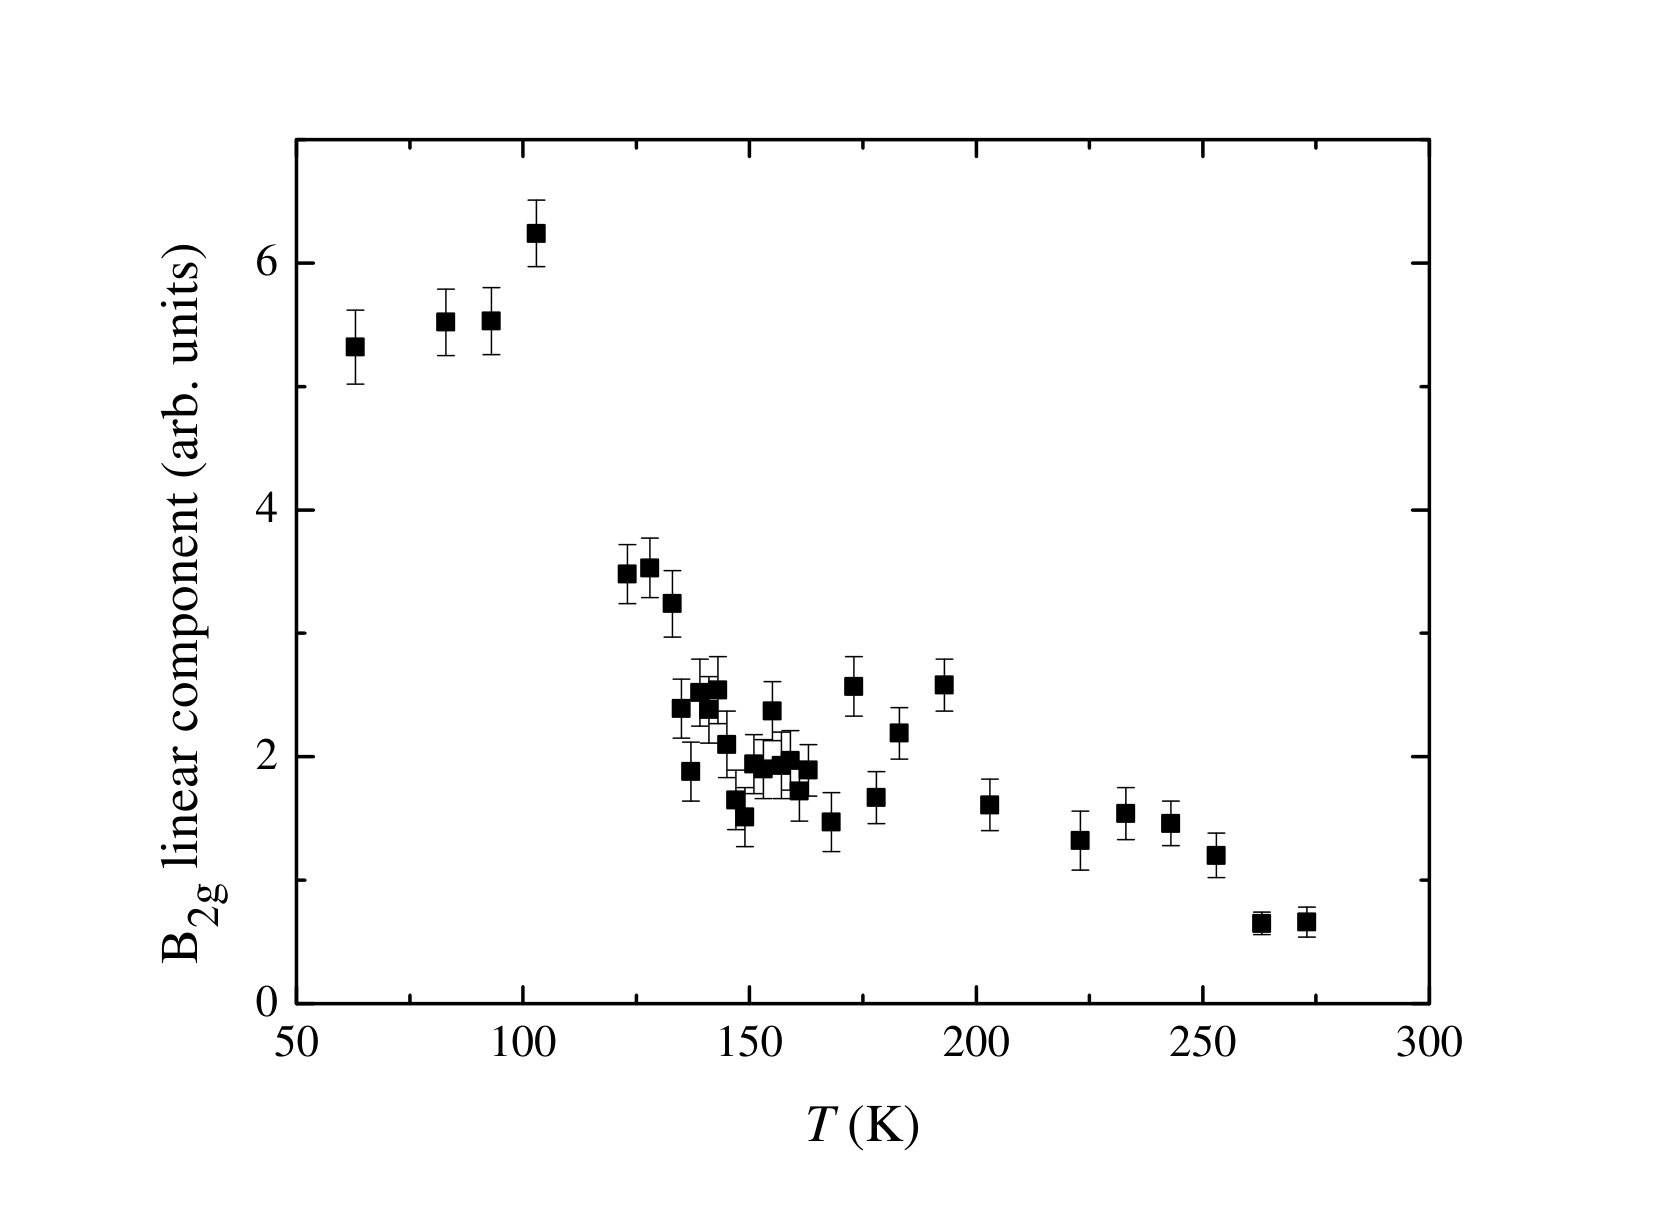 Figure 7
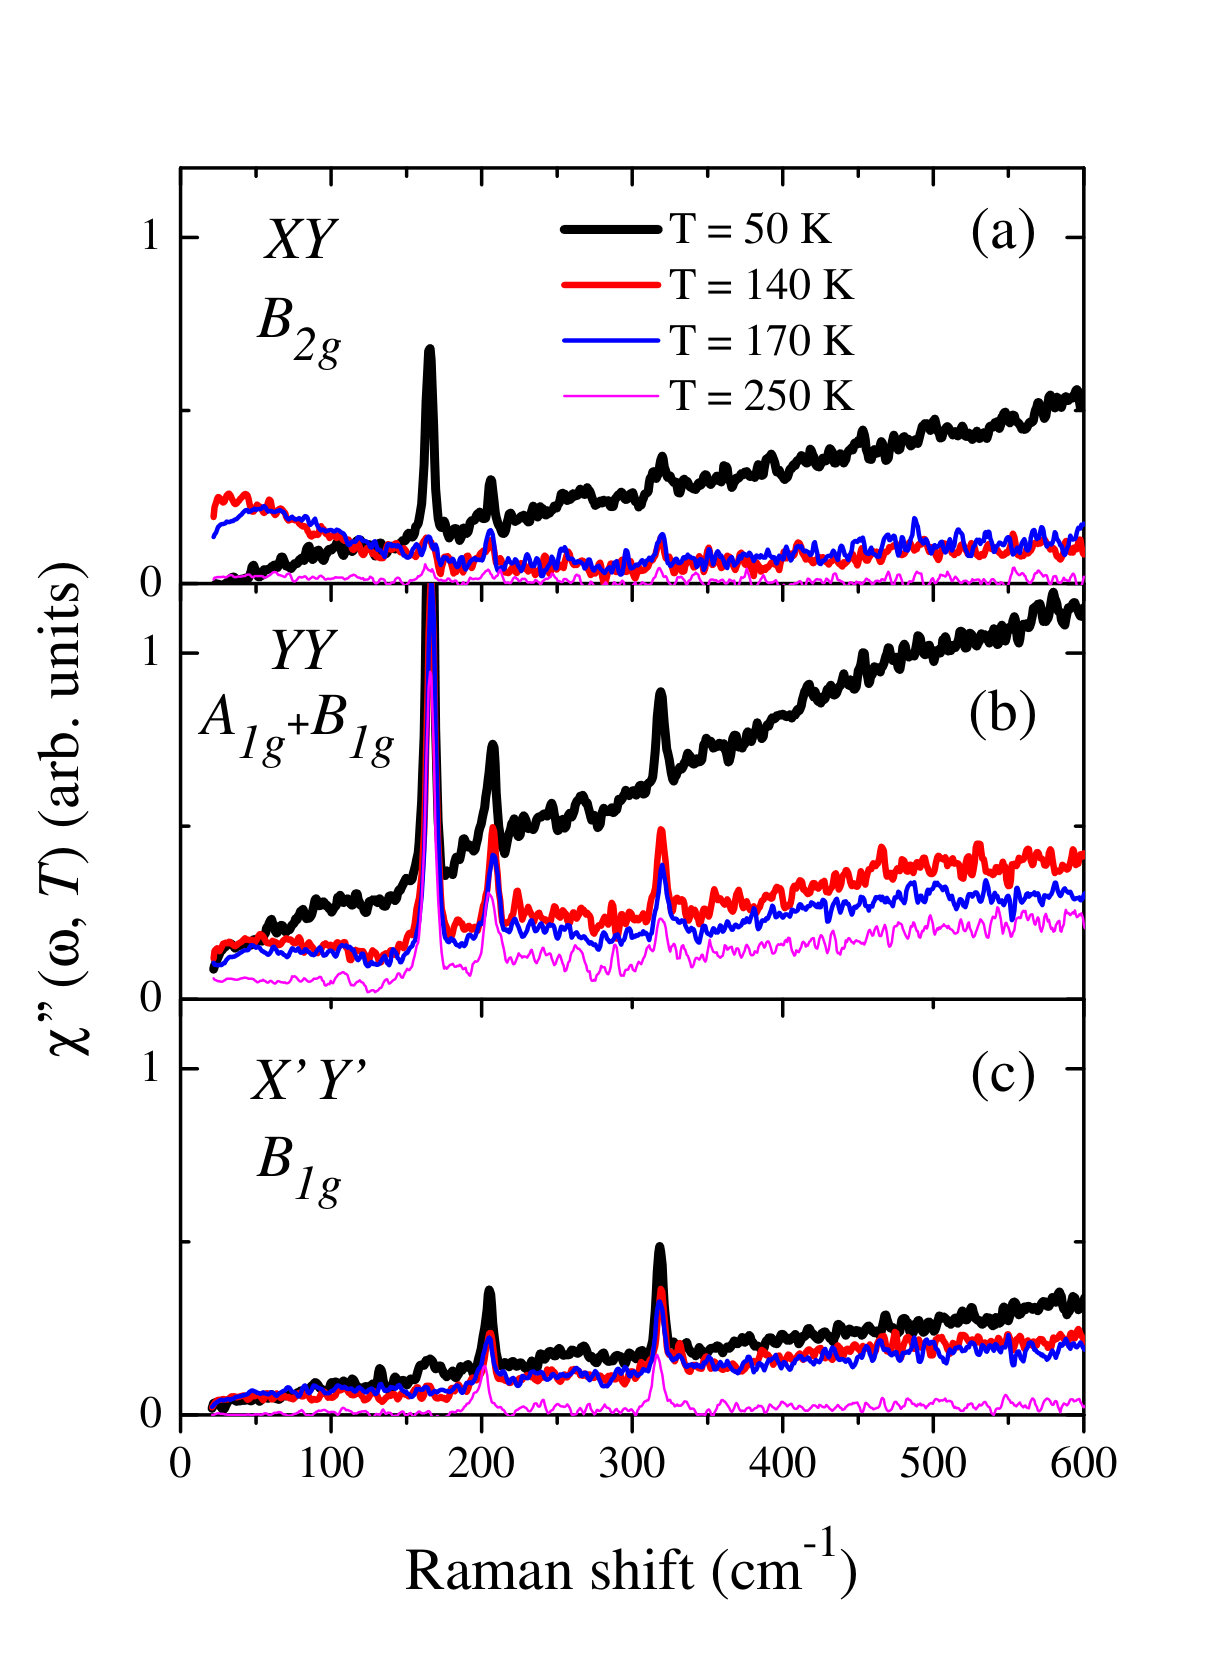 Figure 8
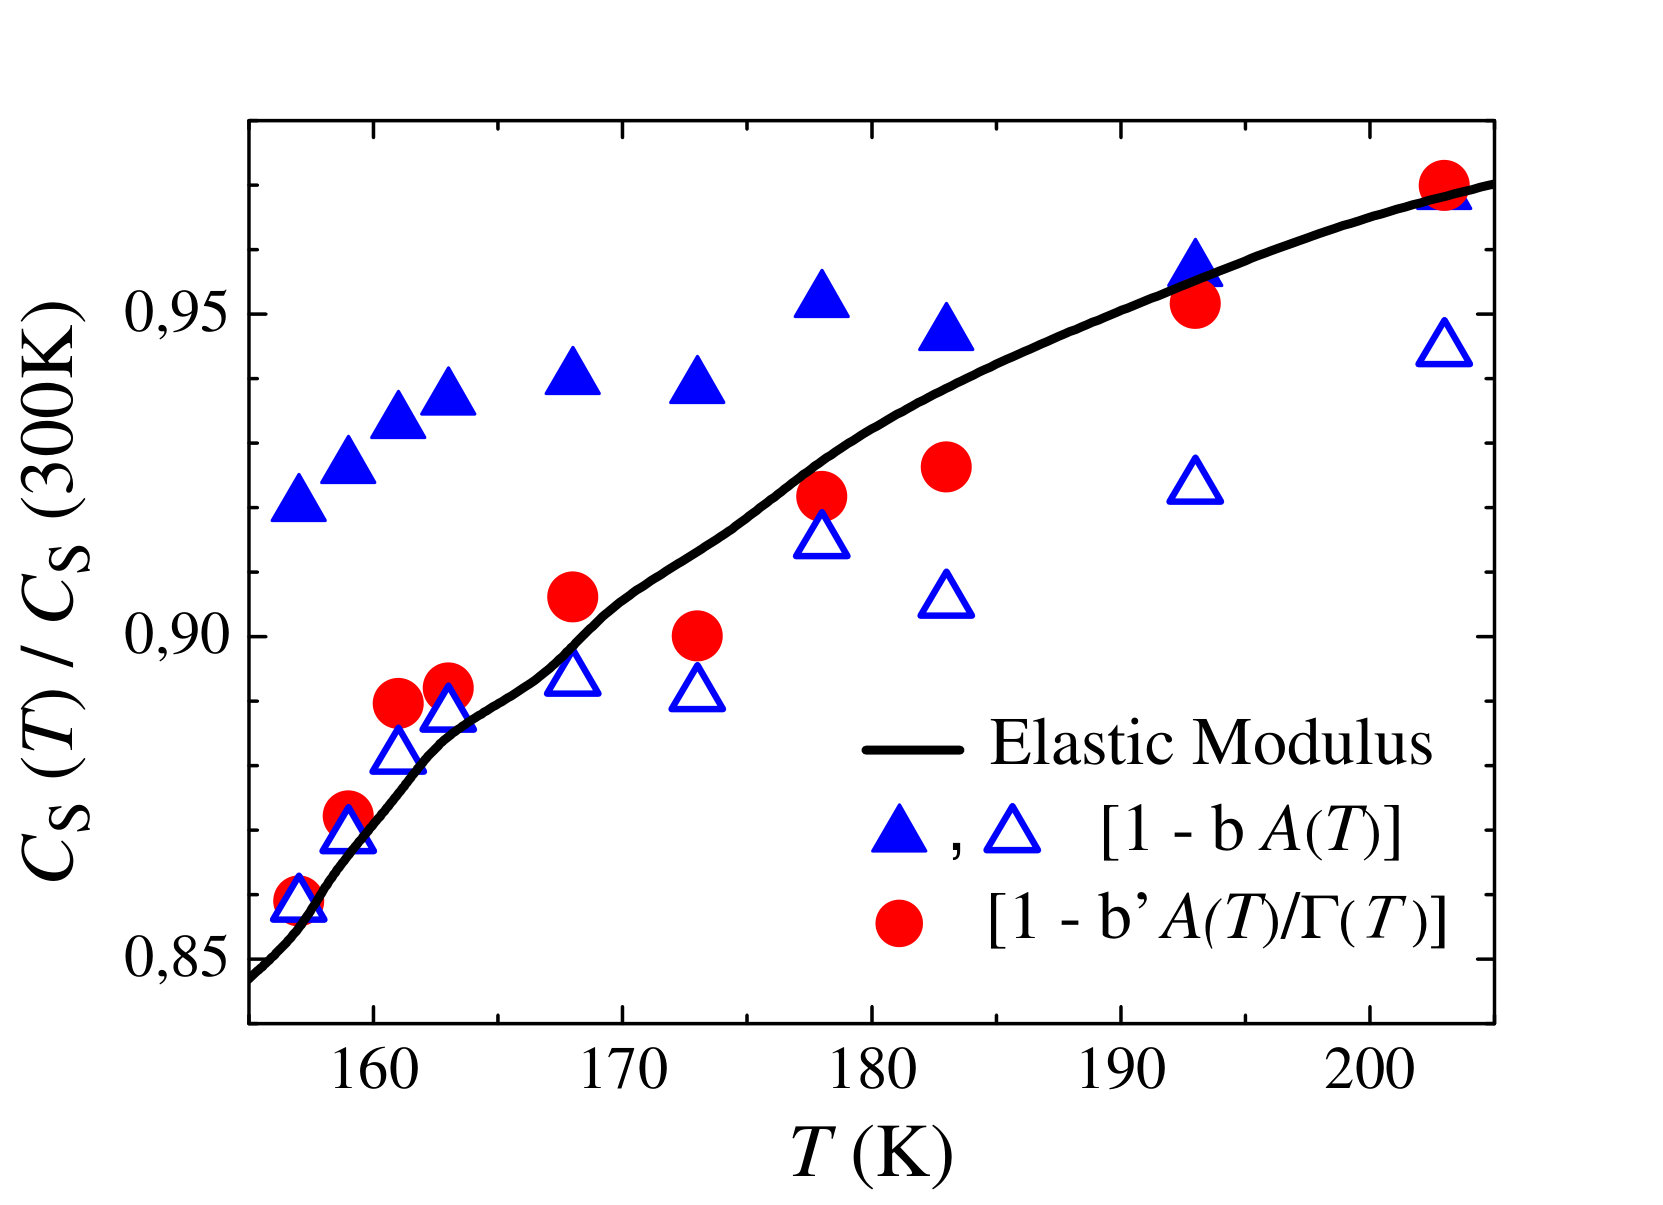 Figure 9
Peer Reviews
No public reviews on file for this paper yet. If you reviewed it on a platform where reviews are public (OpenReview, ICLR, NeurIPS, ICML), you can paste yours below so the community can read it here.
Videos
No videos yet. Explain this paper in a talk, walkthrough, or lecture? Add one.
Nematic Fluctuations and Phase Transitions in LaFeAsO: a Raman Scattering Study
U. F. Kaneko
“Gleb Wataghin” Institute of Physics, University of Campinas - UNICAMP, Campinas, São Paulo 13083-859, Brazil
P. F. Gomes
“Gleb Wataghin” Institute of Physics, University of Campinas - UNICAMP, Campinas, São Paulo 13083-859, Brazil
Federal University of Goiás - UFG, Jataí, Goiás 75801-615, Brazil
A. F. García-Flores
Federal University of ABC - UFABC, Santo André, São Paulo 09210-580, Brazil
J.-Q. Yan111Present address: Materials Science and Technology Division, Oak Ridge National Laboratory, Oak Ridge, Tennessee 37831, USA.
Ames Laboratory, US-DOE, Ames, Iowa 50011, USA
T. A. Lograsso
Ames Laboratory, US-DOE, Ames, Iowa 50011, USA
Department of Materials Sciences and Engineering, Iowa State University, Ames, Iowa 50011, USA.
G. E. Barberis
“Gleb Wataghin” Institute of Physics, University of Campinas - UNICAMP, Campinas, São Paulo 13083-859, Brazil
D. Vaknin
Ames Laboratory, US-DOE, Ames, Iowa 50011, USA
Department of Physics and Astronomy, Iowa State University, Ames, Iowa 50011, USA
E. Granado
“Gleb Wataghin” Institute of Physics, University of Campinas - UNICAMP, Campinas, São Paulo 13083-859, Brazil
Abstract
Raman scattering experiments on LaFeAsO with splitted antiferromagnetic ( K) and tetragonal-orthorhombic ( K) transitions show a quasi-elastic peak (QEP) in symmetry (2 Fe tetragonal cell) that fades away below and is ascribed to electronic nematic fluctuations. A scaling of the reported shear modulus with the dependence of the QEP height rather than the QEP area indicates that magnetic degrees of freedom drive the structural transition. The large separation between and in LaFeAsO compared with their coincidence in BaFe2As2 manifests itself in slower dynamics of nematic fluctuations in the former.
pacs:
74.70.Xa, 74.25.nd
The discovery of Fe-based superconductors (FeSCs) with high transition temperatures (above 100 K in FeSe films Ge ) triggered much interest on these materials Kamihara ; Paglione ; Fernandesnem ; Fernandes . Nematicity, characterized by large in-plane electronic transport anisotropy Chu , is normally observed below a tetragonal-orthorhombic transition temperature , and seems to be also present in other high- superconductors Ando . Also, divergent nematic susceptibility in the optimal doping regime suggests that nematic fluctuations play an important role in the superconducting pairing mechanism Kuo . Thus, investigations of the nematic order and fluctuations in FeSCs and their parent materials are pivotal to unraveling the origin of high- superconductivity. Clearly, it is necessary to identify the primary order parameter associated with the nematic phase Fernandesnem ; Fernandes . A relation between nematicity and magnetism is suggested by the near coincidence between and the antiferromagnetic (AFM) ordering temperature in some materials, most notably BaFe2As2 with K Kim ; Garitezi . In fact, the magnetic ground state is a stripe AFM phase that breaks the 4-fold tetragonal symmetry of the lattice (see Fig. 1(a)), providing a natural mechanism for electronic anisotropy. On the other hand, and are significantly separated for LaFeAsO (LFAO) ( K and K) McGuire ; Yan2009 ; Li , while FeSe does not order magnetically at ambient pressure but still shows a nematic transition at K McQueen , motivating suggestions that the nematic transition may be driven by charge/orbital degrees of freedom rather than magnetism in the latter Baek ; Bohmer . However, even for FeSe the magnetic scenario may still apply Chubukov . In Ba(Fe1-xCox)2As2 and other doped systems, the splitting between and increases with doping Kim ; Pratt . Overall, the primary order parameter that drives the structural/nematic transition at and the dominating mechanism of separation in parent FeSCs are not fully settled yet.
Raman scattering was recently employed as a probe of nematic fluctuations in FeSCs and their parent materials. In (Fe1-xCox)2As2 ( Ca, Sr, Ba, Eu) Chauviere ; Chauviere3 ; Gallais ; Gallais2 ; Kretzschmar ; Zhang2016 ; Bohm , Ba1-pKpFe2As2 Bohm , FeSe Massat ; Gnezdilov and NaFe1-xCoxAs Thorsmolle , a quasi-elastic peak (QEP) with symmetry (considering the 2 Fe tetragonal cell, see Fig. 1(a)) has been observed and interpreted in terms of either charge/orbital Gallais ; Gallais2 ; Zhang2016 ; Massat ; Yamase or spin Kretzschmar ; Bohm ; Khodas ; Yamase2 nematic fluctuations. An unambiguous experimental identification of the nature of the fluctuations generating the Raman QEP (charge/orbital or magnetic) is challenging due to the inherent coupling between the corresponding degrees of freedom. Despite such extensive investigations in several materials, no Raman study of the nematic fluctuations in the key parent compound LFAO has been carried out yet. In this work, we fill this gap and investigate in detail the temperature dependence of both electronic and phonon Raman scattering in LFAO.
Details of the synthesis procedure and basic characterization of the crystal employed in this work, showing K and K, are described elsewhere Yan2009 ; Zhang . A fresh surface with mm2 was obtained by cleaving the crystal and immediately mounting it at the cold finger of a closed-cycle He cryostat. The polarized Raman spectra were taken in quasi-backscattering geometry using the 488.0 nm line as exciting source focused into the surface with a spot of m diameter. A triple 1800 mm*-1* grating spectrometer equipped with a N2-cooled multichannel CCD detector was employed. The instrumental linewidth was cm*-1*. Figure 1(a) illustrates a square lattice of the Fe atoms and sets the conventions for polarizations. The 2 Fe tetragonal (space group P) and 4 Fe orthorhombic (space group C) unit cells and axes in the plane are also represented.
Symmetry analysis indicates that four Raman-active phonons are accessible by our experimental geometry in both tetragonal ( and ) and orthorhombic ( and ) phases. Illustrations of such modes are given in Fig. 1(b) (see also Ref. Hadjiev ). The raw Raman spectra in the phonon region at distinct linear polarizations are given in Figs. 1(c) ( K) and 1(d) ( K). The modes observed at 203 and 317 cm*-1* at K are ascribed to Fe and O vibrations along , respectively Hadjiev , while the modes at 164 and 208 cm*-1* are ascribed to As and La vibrations along . The position of the 164 cm*-1* mode is comparable to that reported for the As mode in NaFeAs (163 cm*-1* Um ) and in Fe2As2 ( Ca, Sr, Ba) (180-190 cm*-1* Chauviere3 ; Choi ; Litvinchuk ; Chauviere2 ). The -dependence of this phonon was investigated in detail (see SM). Its linewidth at low- is resolution-limited, suggesting a high crystalline quality, and shows a maximum at with no anomaly at . Frequency anomalies are observed for this mode at both and . Finally, an enhancement in polarization is observed below , which is similar to related systems Chauviere3 ; Choi ; Chauviere2 ; Kretzschmar and is due to the coupling of this phonon with anisotropic electronic states in the magnetic phase Martinez .
The Raman response is related to the raw intensity through the relation , where is the Bose-Einstein statistical factor and is an intensity offset (for details, see SM). Figures 2(a-e) show in polarization corresponding to symmetry in the 2 Fe tetragonal cell. These measurements were made with much less laser power ( mW) than for the data shown in Fig. 1 ( mW), in order to minimize laser heating effects Kretzschmar , and were also taken with less exposure times due to the large number of investigated temperatures. These limitations resulted in poorer signal-to-noise in the data shown in Figs. 2(a-e). An 8-point-average smoothing is applied in these data for better visualization of the broad electronic Raman signal. A linear component for is observed in the frequency region below 600 cm*-1*, which is enhanced below . Measurements performed on an extended frequency region show this component is part of broad peaks at cm*-1* (see SM). A similar structure was found in BaFe2As2 and attributed to two-magnon scattering Sugai . An additional scattering channel, which is most evident at low frequencies ( cm*-1*), is observed in this symmetry and enhances on cooling down to K, fading away on further cooling. This contribution is satisfactorily fitted by a quasi-elastic peak (QEP) (dashed lines in Figs. 2(a-d)), corresponding to a Lorentzian lineshape for . It can be seen from Fig. 2(f) that the relatively large noise in the Raman response above cm*-1* have little influence on the determination of the QEP fitting parameters and . The Raman response for other symmetries accessible by our experimental setup are given in SM at selected temperatures, also showing contributions from two-magnon scattering.
Figures 3(a) and 3(b) show the -dependence of the Lorentzian QEP area and width , respectively. Only data between and K are shown, corresponding to the interval where this signal is sufficiently strong to warrant reliable Lorentzian fits within our statistics. Figure 3(c) shows , corresponding to the QEP height, while Fig. 3(d) is a zoom in of Fig. 3(b) near . Between 280 and 120 K, the QEP area and height show a maximum at K, slightly above , nearly vanishing below 120 K. Concerning the widths, the QEP gradually sharpens on cooling down to . Below , further sharpens from to cm*-1*.
As for the other FeSCs Gallais ; Gallais2 ; Zhang2016 ; Massat ; Yamase ; Kretzschmar ; Bohm ; Khodas ; Yamase2 , we ascribe the QEP in LFAO to electronic nematic fluctuations. In principle, the Raman intensity may be dominated either by charge/orbital or spin nematic fluctuations. The significant residual nematic fluctuations observed between K and (see Figs. 3(a,c)) are consistent with 75As NMR measurements that show coexisting AFM and paramagnetic regions in this -interval Fu ; the paramagnetic regions are expected to host the residual nematic fluctuations observed here. Intriguingly, the temperature where the QEP area and height are maxima, , does not coincide with the bulk-average , contrary to other parent FeSCs Kretzschmar ; Massat . This deviation is likely related to the broad interval where tetragonal and orthorhombic domains coexist and fluctuate Li2 . In this scenario, while the QEP intensity per orthorhombic unit volume is expected to be reduced on cooling, the inverse tendency is found for the remaining tetragonal domains, leading to . Still, the nematic fluctuations in LFAO are clearly sensitive to , as demonstrated by the sharpening of the QEP below (see Fig. 3(d)). In fact, this is a manifestation of slower nematic fluctuations in the orthorhombic phase. This is again qualitatively consistent with 75As NMR results that show a slowing down of the magnetic dynamics below Fu and may be also related with the enhancement of the magnetic correlation length below observed in inelastic neutron scattering measurements Zhang .
We discuss our results considering separately the independent scenarios where charge/orbital or spin nematic fluctuations dominate the intensity of the Raman QEP. Starting with the charge/orbital scenario (scenario A), the bare static nematic susceptibility and are directly connected by a Kramers-Kronig transformation Gallais ; Gallais2 , corresponding to the QEP area in our analysis. An attempted scaling of obtained in this way and the polycrystalline shear modulus extracted from Ref.McGuire , i.e., (300 K) Gallais2 , is given in Fig. 4, where is a free parameter (see footnote explanation ). In our analysis, we tentatively varied to scale to either at (empty triangles in Fig. 4) or at K (filled triangles). However, no value for yielded a satisfactory scaling for the entire investigated interval K. The lack of scaling between the shear modulus and the QEP area, interpreted under scenario A, indicate that the charge/orbital fluctuations do not drive the structural transition at , and an additional electronic nematic degree of freedom, presumably the magnetic one, is driving the phase transitions in LFAO Fernandes . This reasoning closely follows that presented in Ref. Gallais for BaFe2As2.
We now explore the alternative scenario where spin nematic fluctuations dominate the intensity of the Raman QEP (scenario B). In this case, the dynamical electronic nematic susceptibility is not given directly by , and therefore a Kramers-Kronig transformation does not apply to extract . Instead, is proportional to the slope of in the limit Kretzschmar ; Karahasanovic , namely the QEP height . In this scenario, K, obtained from the fit of to a Curie-Weiss-like behavior over the interval K (solid line in Fig. 3(c)), is the bare nematic transition temperature in the absence of the magneto-elastic coupling that induces the transition at higher temperatures. Figure 4 displays a scaling of the polycrystalline shear modulus to the peak height, (300 K), showing an excellent agreement for the entire investigated interval. Therefore, independently of the assumption on the detailed nature of the Raman QEP, our analysis supports the scenario where the nematic transition is magnetically driven.
The thermal evolution of the relaxation rate provides further insight into the nematic transition. At K one has meV ( 80 cm*-1*), see Fig. 3(b), which is on the same energy scale of the optical phonons (see Fig. 1). However, the nematic fluctuations slow down continuously on cooling (see Fig. 3(b)). Presumably, as the nematic fluctuation rate become significantly smaller than the typical optical phonon frequencies, local and instantaneous orthorhombic distortions are expected to rise and accompany the electronic nematic correlations. We suggest that at the growing lattice strain caused by the local orthorhombic distortions finally drive the formation of a long-range orthorhombic phase, i.e., the so-called nematic phase. Immediately below the nematic fluctuations are slowed down further (see Fig. 3(d)). This is likely associated with changes in the and nearest-neighbor exchange integrals, partially releasing the magnetic frustration and allowing for increased magnetic correlation lengths Zhang .
Further inspection of our results gives insight into the large separation between and ( 15 K) compared to their near coincidence in BaFe2As2. We note that at K, for instance, the maximum of , corresponding to the QEP linewidth , is 43(2) cm*-1* for LFAO (see Fig. 2(c) and 3(d)), much smaller than cm*-1* for BFA at this temperature Gallais . Such slower nematic fluctuations in LFAO preempt the stabilization of orthorhombic domains significantly above . This scenario may also give insight into the nematic transition of other FeSCs. For instance, a QEP has also been reported Massat for FeSe, which also gradually sharpens on cooling, reaching cm*-1* at , which is comparable to the observed for LFAO in the nematic phase (see Fig. 3(d)).
In summary, polarized Raman scattering in LaFeAsO reveals a quasi-elastic scattering channel from nematic fluctuations above . An analysis of the -dependence of this signal supports the conclusion that magnetism is the primary order parameter driving the phase transitions in this material. Relatively slow electronic nematic fluctuations preempt and arguably signal the separation between and .
We thank R. M. Fernandes and P. G. Pagliuso for their critical reading of this manuscript and helpful discussions. This work was supported by FAPESP Grant 2012/04870-7 and CNPq, Brazil. Ames Laboratory is supported by the US Department of Energy, Office of Basic Energy Sciences, Division of Materials Sciences and Engineering under Contract No. DE-AC02-07CH11358.
Appendix A Supplemental Material for “Nematic Fluctuations and Phase Transitions in LaFeAsO: a Raman Scattering Study” by U. F. Kaneko et al.
A.1 Temperature-dependence of the Arsenic phonon
Figure S1(a) shows the temperature-dependence of the relative intensity of the As mode in with respect to polarizations (see also Fig. 1 of the main text). An enhancement of this mode in polarization is observed below . This is similar to observed in related systems Chauviere3 ; Choi ; Chauviere2 ; Kretzschmar and can be ascribed to the coupling of this phonon with anisotropic electronic states in the magnetic phase. Martinez Figures S1(b) and S1(c) show the frequency and linewidth of this mode. Frequency anomalies are observed at both and , the latter being likely due to spin-phonon coupling, Granado while the phonon linewidth shows a maximum at with no anomaly at . The linewidth of this mode at low- is resolution-limited, suggesting a high crystalline quality an homogeneity, at least within the relatively small sample region probed by the laser spot.
A.2 Extraction of the Raman response from the raw intensities
As discussed in the main text, the raw intensity (after subtraction of the dark noise) and the Raman response are related by the expression , where is the Bose-Einstein statistical factor and represents an intensity offset. The offset, which is frequency-independent over the limited spectral interval of interest to this work ( cm*-1*), may be due to a combination of residual stray light in the spectrograph stage of our instrument and luminescence. was subtracted from the raw intensity prior to the Bose-Einstein correction in order to avoid distorting the Raman susceptibility spectra. Non-systematical variations of the order of 20 % were observed as the laser spot moved slightly along the sample surface at different temperatures. Figure S2 shows the raw intensity spectra in polarization for K and 150 K. At K, the intensity follows a linear dependence down to the lowest frequencies. This indicates that no significant intrinsic Raman intensity is present for at K, which otherwise would be highly amplified by the Bose-Einstein statistical factor in the low- region leading to a non-linear contribution to the raw intensity. Thus, the raw intensity for at K was taken as the offset K). At K, a significant quasi-elastic intensity is also observed, associated with the nematic fluctuations (see main text). The offset K) was then taken as the extrapolation to of a linear fit taken in the region cm*-1* (see Fig. S2). This procedure was repeated for all investigated temperatures and polarizations.
A.3 Raman response at different polarizations; two-magnon scattering
Although the focus of this work is on the quasi-elastic peak (QEP) obtained in polarization, the electronic Raman signal of LaFeAsO was also investigated for the other accessible linear polarizations. Figures S3(a-c) show the Raman response for , and symmetries, respectively, at selected temperatures and cm*-1*. Besides the phonon modes and the QEP discussed in the main text, an additional signal that increases almost linearly with frequency in this range is observed for all polarizations. Figures S4(a-d) show the spectra at K over an extended frequency region. Broad peaks were observed at and cm*-1* for and polarizations, respectively, while the spectra at and polarizations seem to contain a combination of these contributions. It is important to notice that the linear component observed for cm*-1* in polarization is actually the lower-frequency limit of this broad scattering. Further insight into the nature of this contribution is gained by the -dependence of the slope of the linear component in the frequency range 300 cm*-1* in polarization, using the data of Fig. 2 of the main text. Notably, this slope increases significantly below . Thus, the linear contribution is not associated with nematic fluctuations, and can be safely excluded from the computation of the instantaneous nematic susceptibility. In fact, for BaFe2As2, broad signals centered at high frequencies were also observed and ascribed to two-magnon scattering. Sugai This identification is consistent with the temperature-dependence shown in Fig. S5.
References
- (1) L. Chauvière, Y. Gallais, M. Cazayous, M.A. Méasson, A. Sacuto, D. Colson, and A. Forget, Phys. Rev. B 84, 104508 (2011).
- (2) K.-Y. Choi, D. Wulferding, P. Lemmens, N. Ni, S.L. Bud’ko, and P.C. Canfield, Phys. Rev. B 78, 212503 (2008).
- (3) L. Chauviére, Y. Gallais, M. Cazayous, A. Sacuto, M.A. Méasson, D. Colson, and A. Forget, Phys. Rev. B 80, 094504 (2009).
- (4) F. Kretzschmar, T. Böhm, U. Karahasanović, B. Muschler, A. Baum, D. Jost, J. Schmalian, S. Caprara, M. Grilli, C. Di Castro, J.G. Analytis, J.-H. Chu, I.R. Fisher, and R. Hackl, Nature Phys. 12, 560 (2016).
- (5) N.A. García-Martínez, B. Valenzuela, S. Ciuchi, E. Cappelluti, M.J. Calderón, and E. Bascones, Phys. Rev. B 88, 165106 (2013).
- (6) E. Granado, A. García, J.A. Sanjurjo, C. Rettori, I. Torriani, F. Prado, R.D. Sánchez, A. Caneiro, and S.B. Oseroff, Phys. Rev. B 60, 11879 (1999).
- (7) S. Sugai, Y. Mizuno, R. Watanabe, T. Kawaguchi, K. Takenaka, H. Ikuta, Y. Takayanagi, N. Hayamizu, and Y. Sone, J. Phys. Soc. Jpn. 81, 024718 (2012).
The reference list from the paper itself. Each links out to its DOI / PubMed record.
- 1(1) J.-F. Ge, Z.-L. Liu, C. Liu, C.-L. Gao, D. Qian, Q.-K. Xue, Y. Liu and J.-F. Jia, Nature Mater. 14 , 285 (2015).
- 2(2) Kamihara, T. Watanabe, M. Hirano, and H. Hosono, J. Am. Chem. Soc. 130 , 3296 (2008).
- 3(3) J. Paglione and R.L. Greene, Nature Phys. 6 645 (2010).
- 4(4) R.M. Fernandes and J. Schmalian, Supercond. Sci. Technol. 25 , 084005 (2012).
- 5(5) R.M. Fernandes, A.V. Chubukov, and J. Schmalian, Nature Phys. 10 , 97 (2014).
- 6(6) J.-H. Chu, J.G. Analytis, K. De Greeve, P.L. Mc Mahon, Z. Islam, Y. Yamamoto, and I.R. Fisher, Science 329 , 824 (2010).
- 7(7) Y. Ando, K. Segawa, S. Komiya, and A.N. Lavrov, Phys. Rev. Lett. 88 , 137005 (2002).
- 8(8) H.-H. Kuo, J.-H. Chu, J.C. Palmstrom, S.A. Kivelson, and I.R. Fisher, Science 352 , 958 (2016).