Measurement of the energy and time resolution of a undoped CsI + MPPC array for the Mu2e experiment
O. Atanova, M. Cordelli, G. Corradi, F. Colao, Yu.I. Davydov, R., Donghia, S. Di Falco, S. Giovannella, F. Happacher, M. Martini, S. Miscetti,, L. Morescalchi, P. Murat, G. Pezzullo, A. Saputi, I. Sarra, S. R. Soleti, D., Tagnani, V. Tereshchenko, Z. Usubov

TL;DR
This study measures the energy and time resolution of an undoped CsI crystal array coupled with MPPCs, demonstrating a 16.4% energy resolution at 100 MeV and a 110 ps time resolution, relevant for the Mu2e experiment.
Contribution
First detailed measurement of energy and time resolution of undoped CsI + MPPC array for Mu2e, using electron beam tests in the 80-120 MeV range.
Findings
Energy resolution of 16.4% at 100 MeV
Time resolution of about 110 ps at 100 MeV
Measurements performed with electron beam at Frascati
Abstract
This paper describes the measurements of energy and time response and resolution of a 3 x 3 array made of undoped CsI crystals coupled to large area Hamamatsu Multi Pixel Photon Counters. The measurements have been performed using the electron beam of the Beam Test Facility in Frascati (Rome, Italy) in the energy range 80-120 MeV. The measured energy resolution, estimated with the FWHM, at 100 MeV is 16.4%. This resolution is dominated by the energy leakage due to the small dimensions of the prototype. The time is reconstructed by fitting the leading edge of the digitized signals and applying a digital constant fraction discrimination technique. A time resolution of about 110 ps at 100 MeV is achieved.
Click any figure to enlarge with its caption.
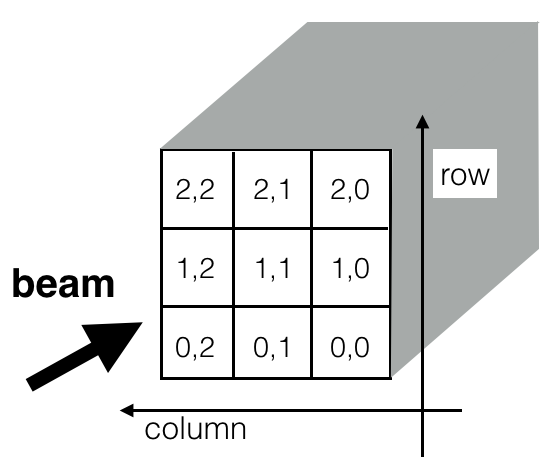 Figure 1
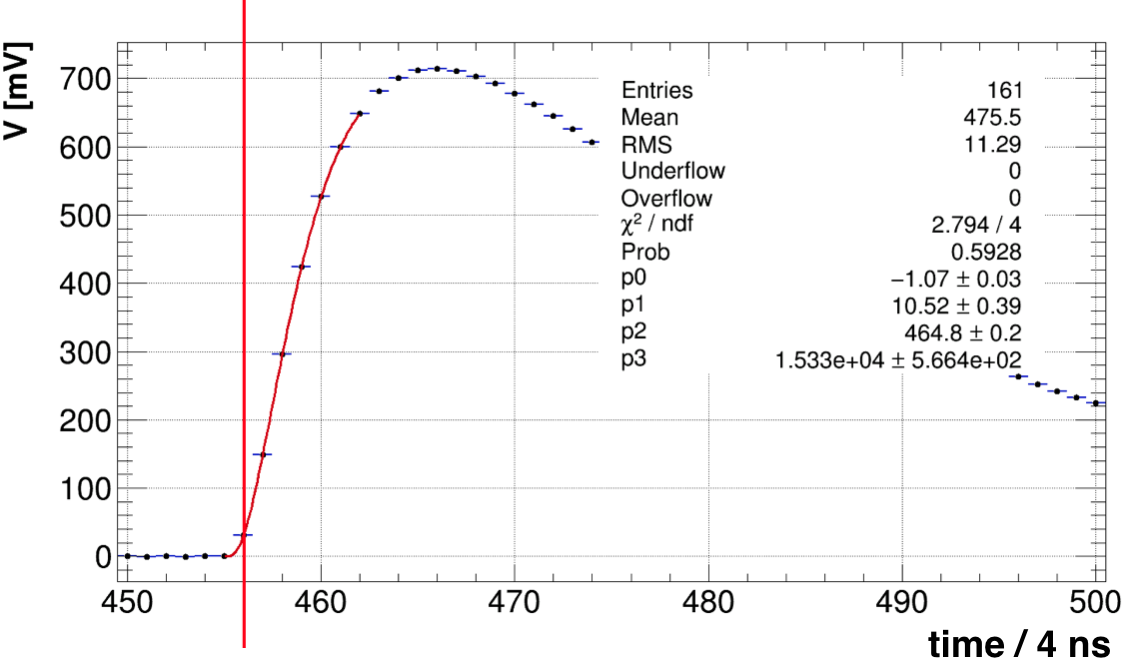 Figure 2
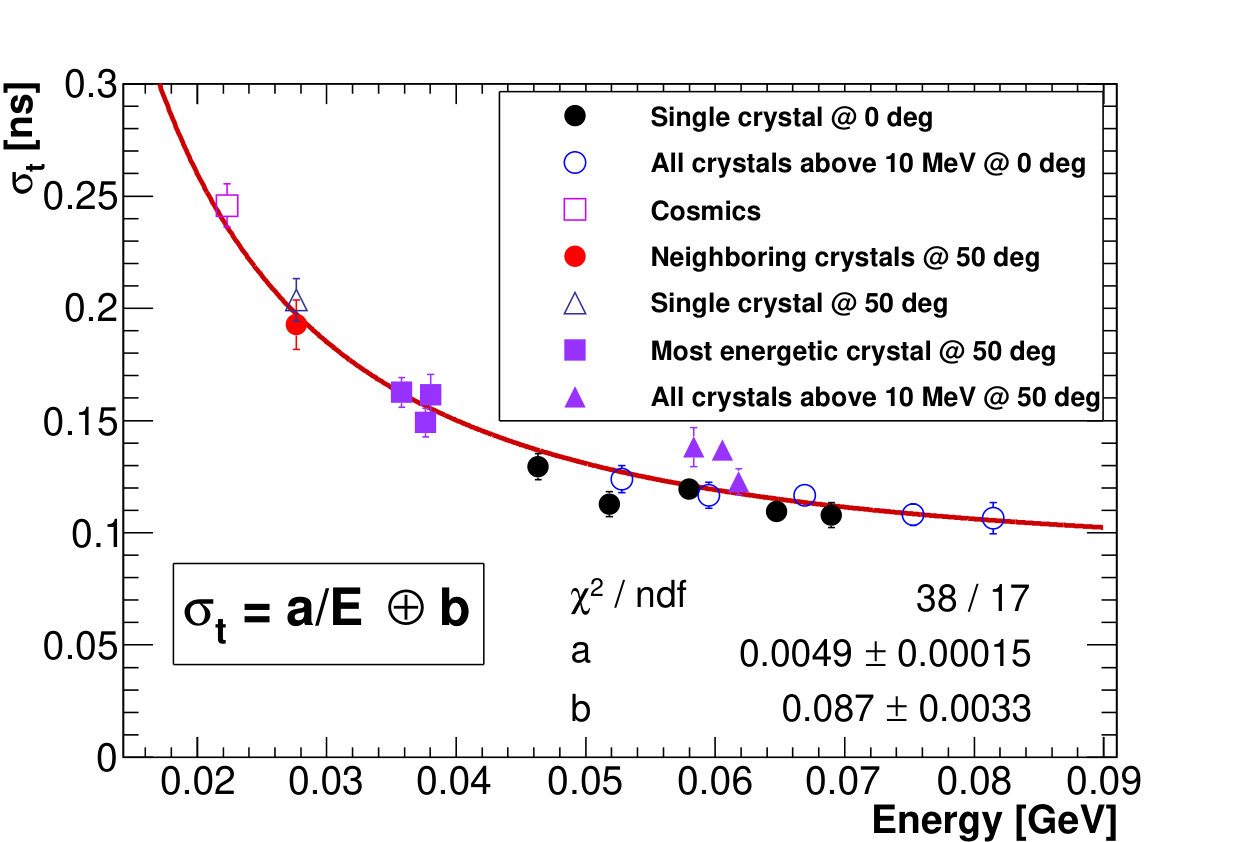 Figure 3
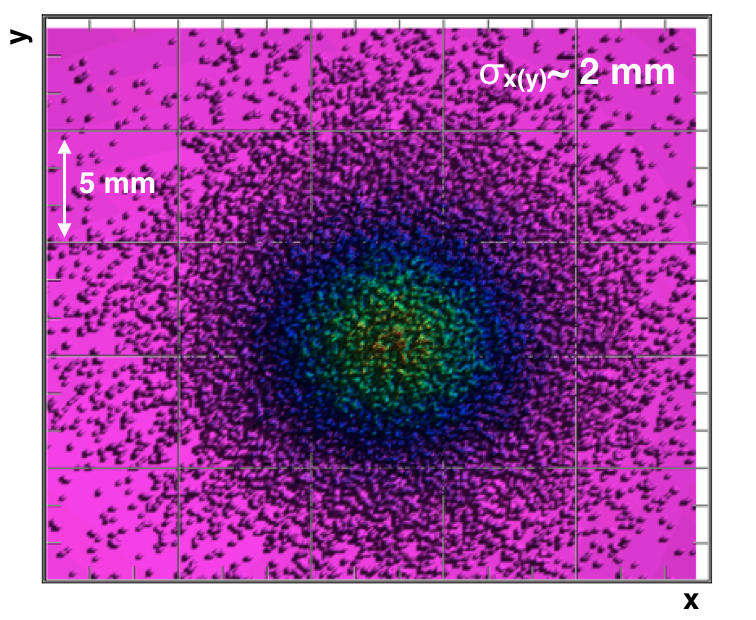 Figure 4
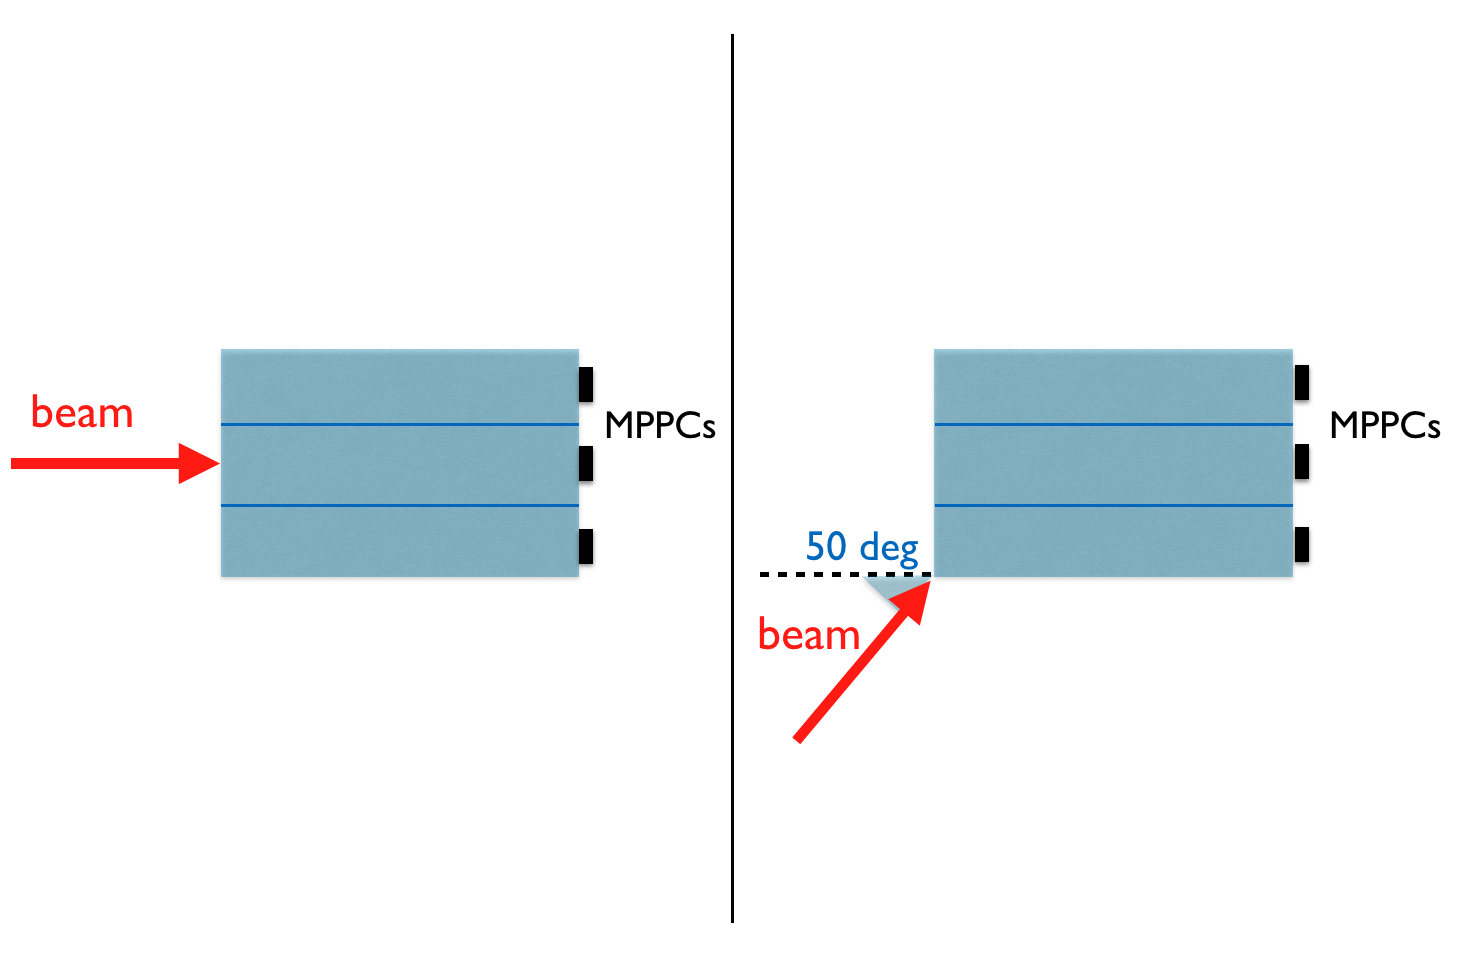 Figure 5
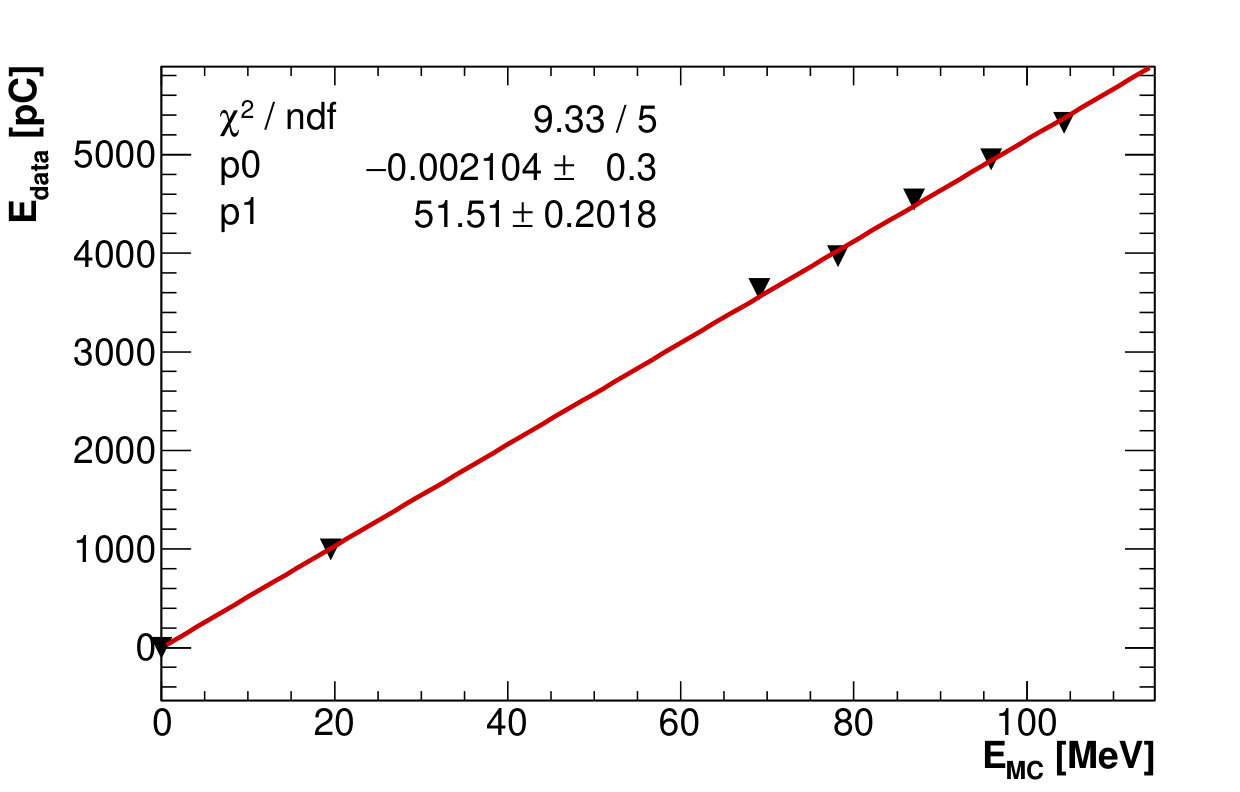 Figure 6
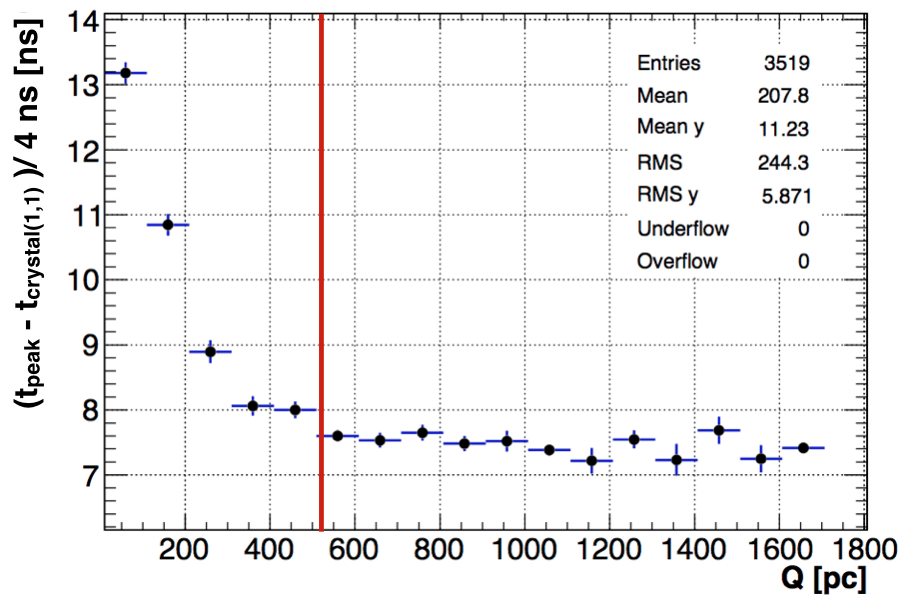 Figure 7
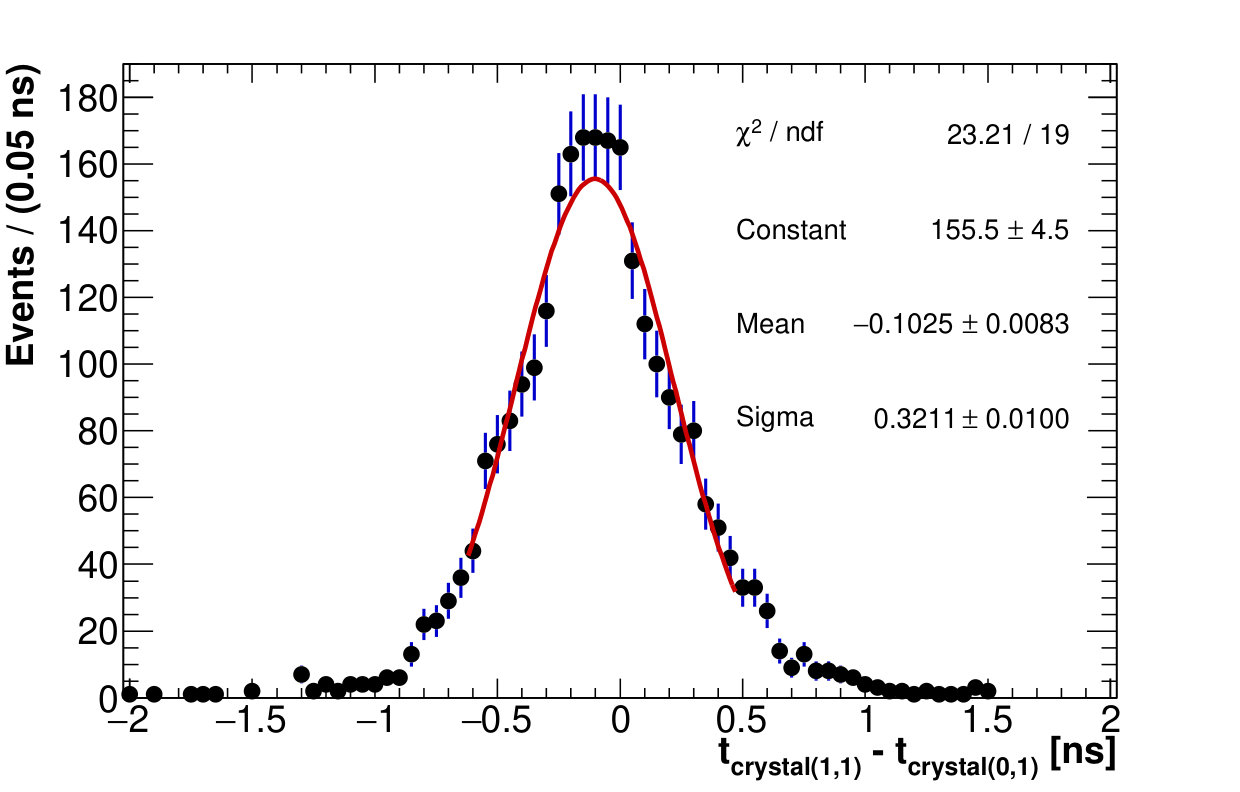 Figure 8
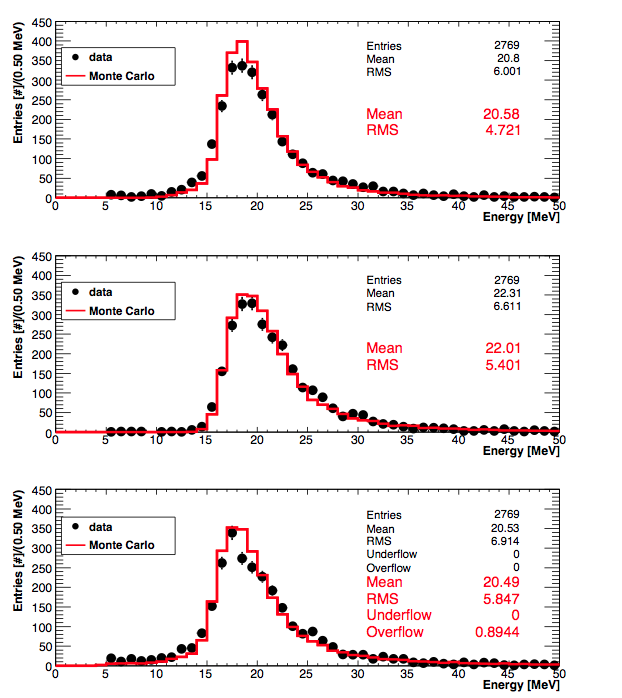 Figure 9
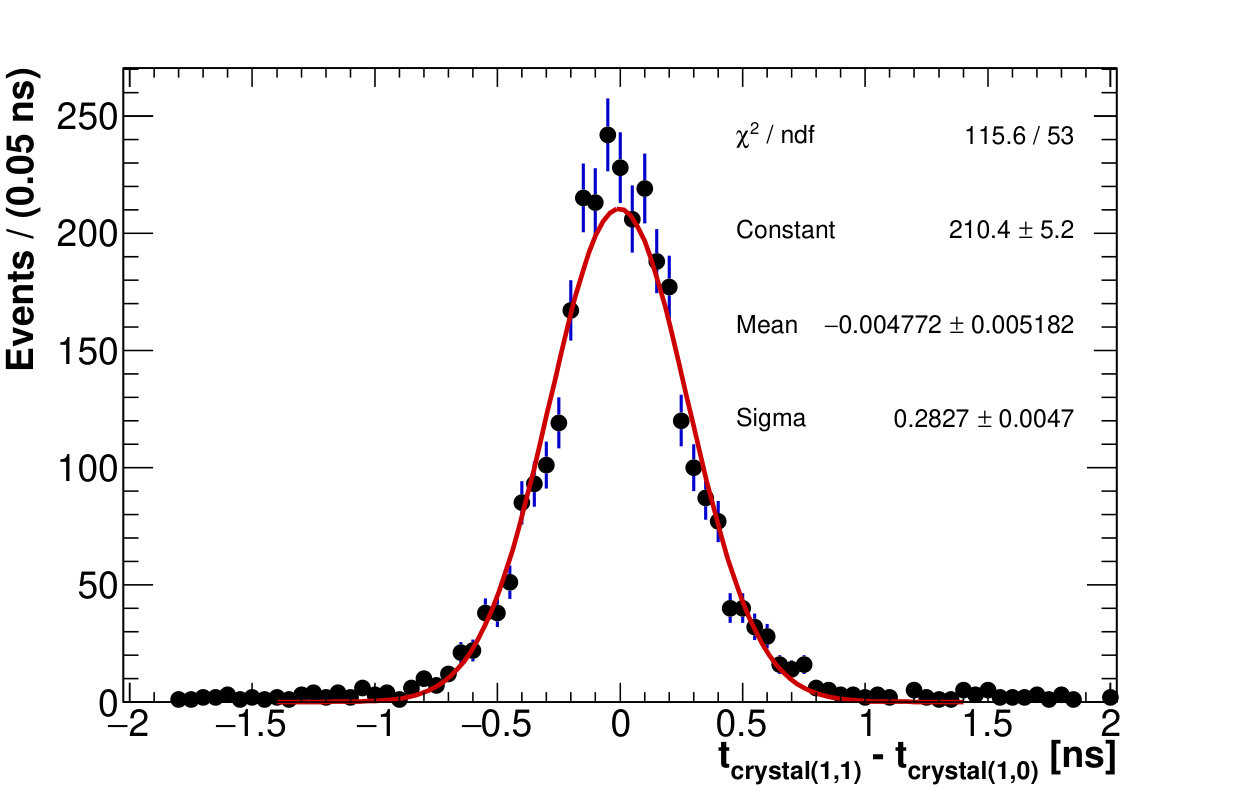 Figure 10
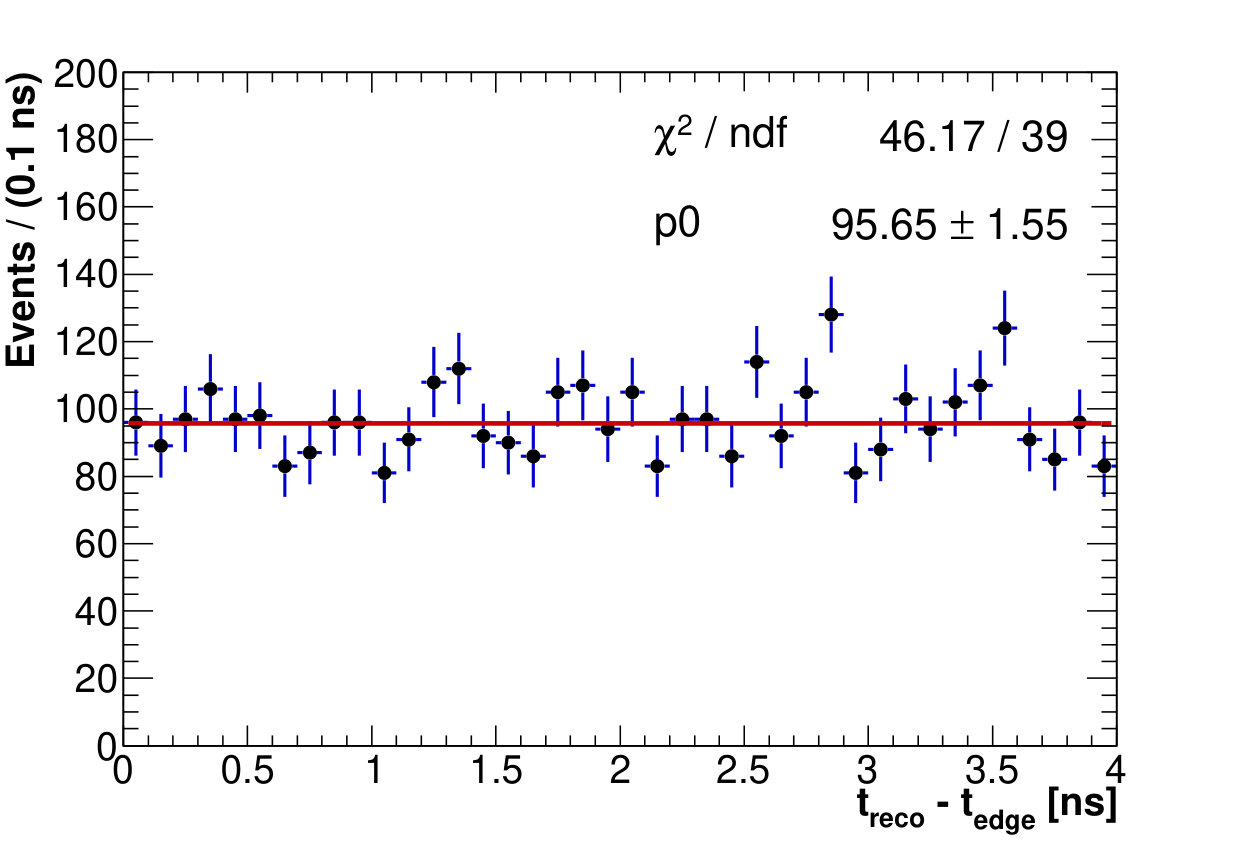 Figure 11
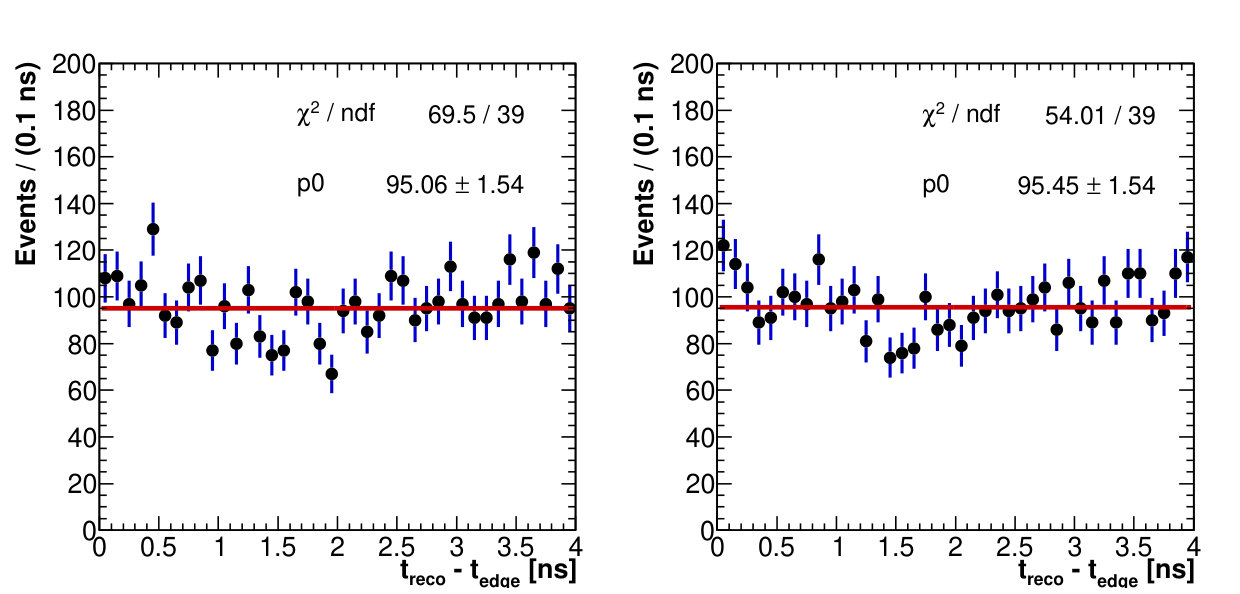 Figure 12
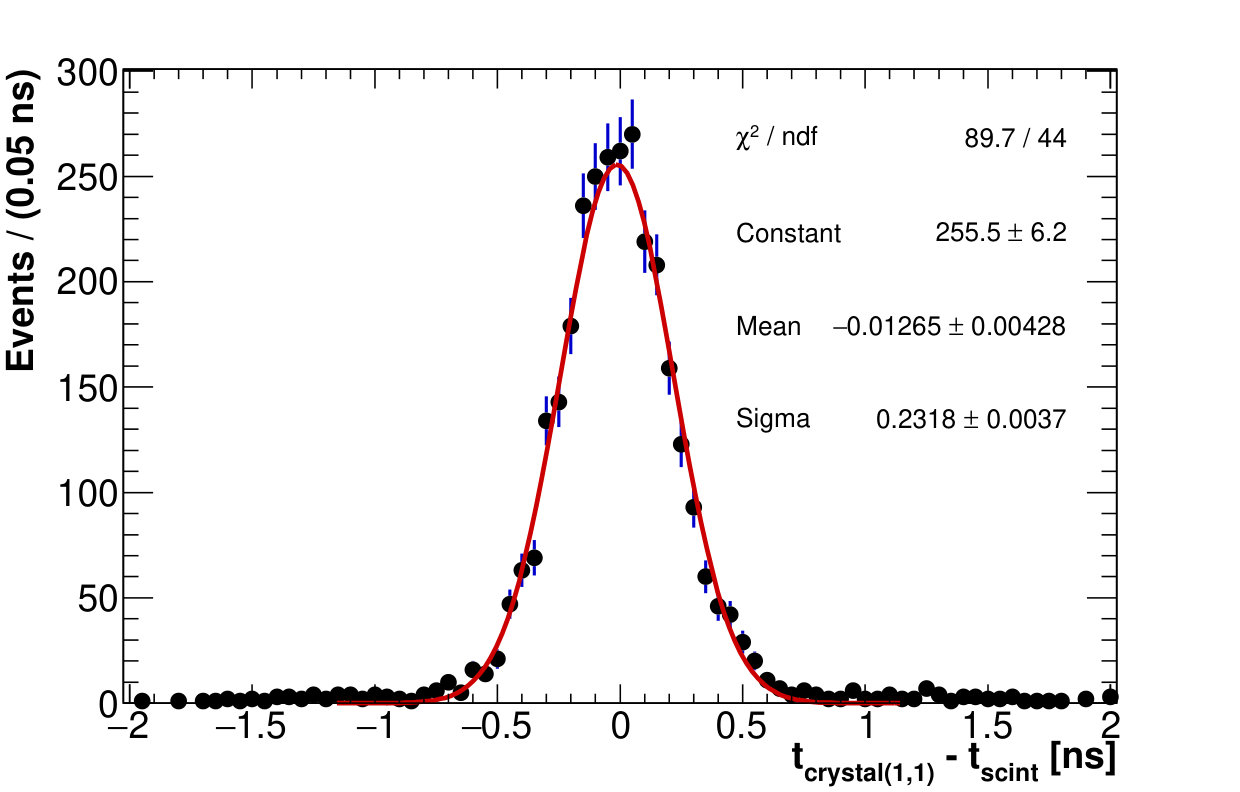 Figure 13
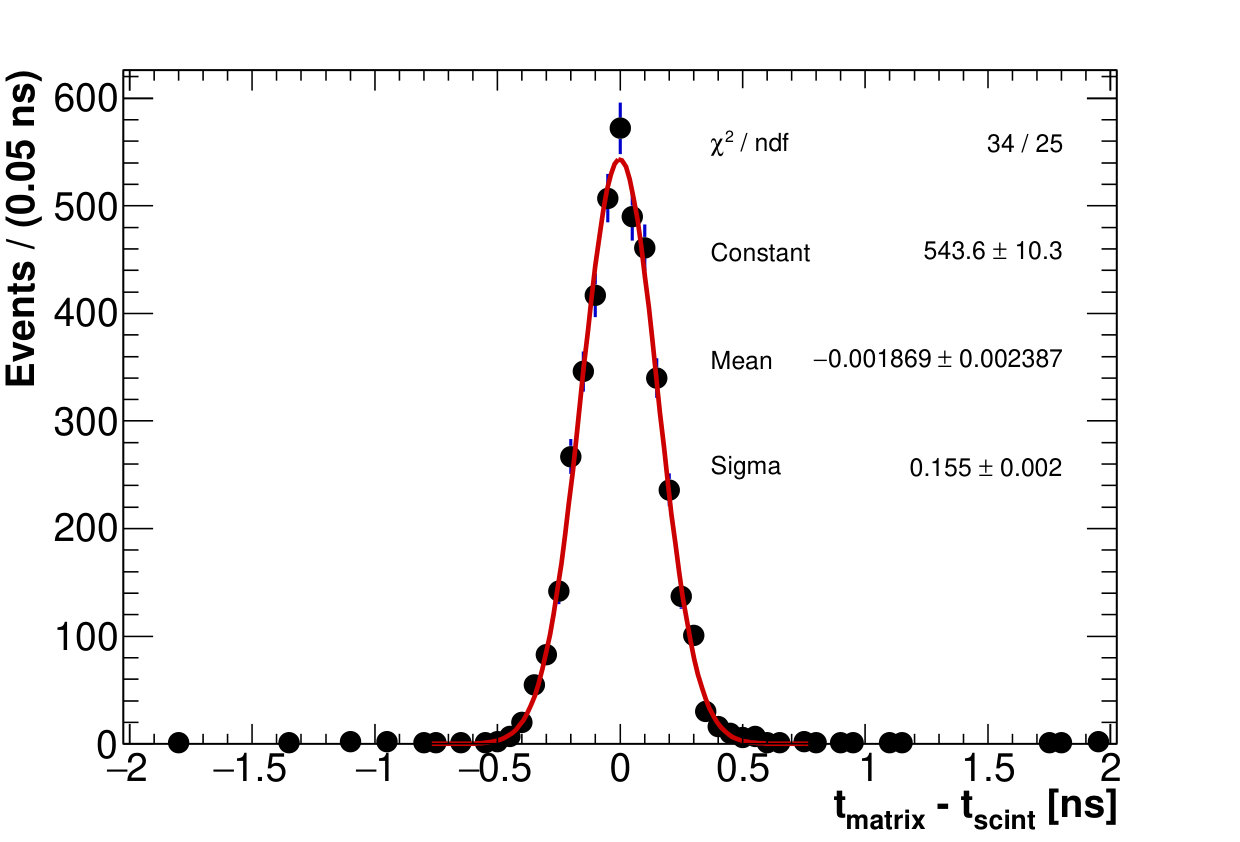 Figure 14
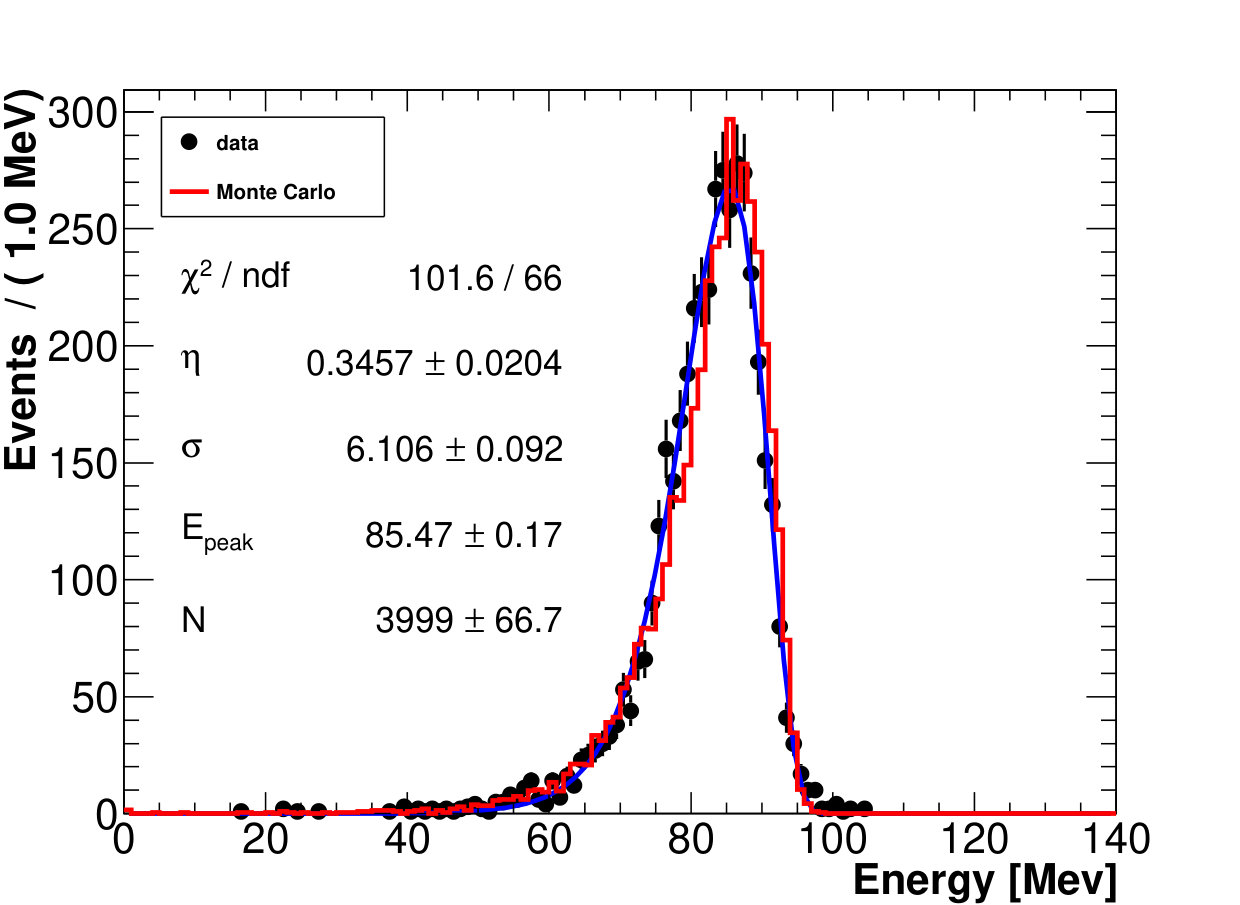 Figure 15
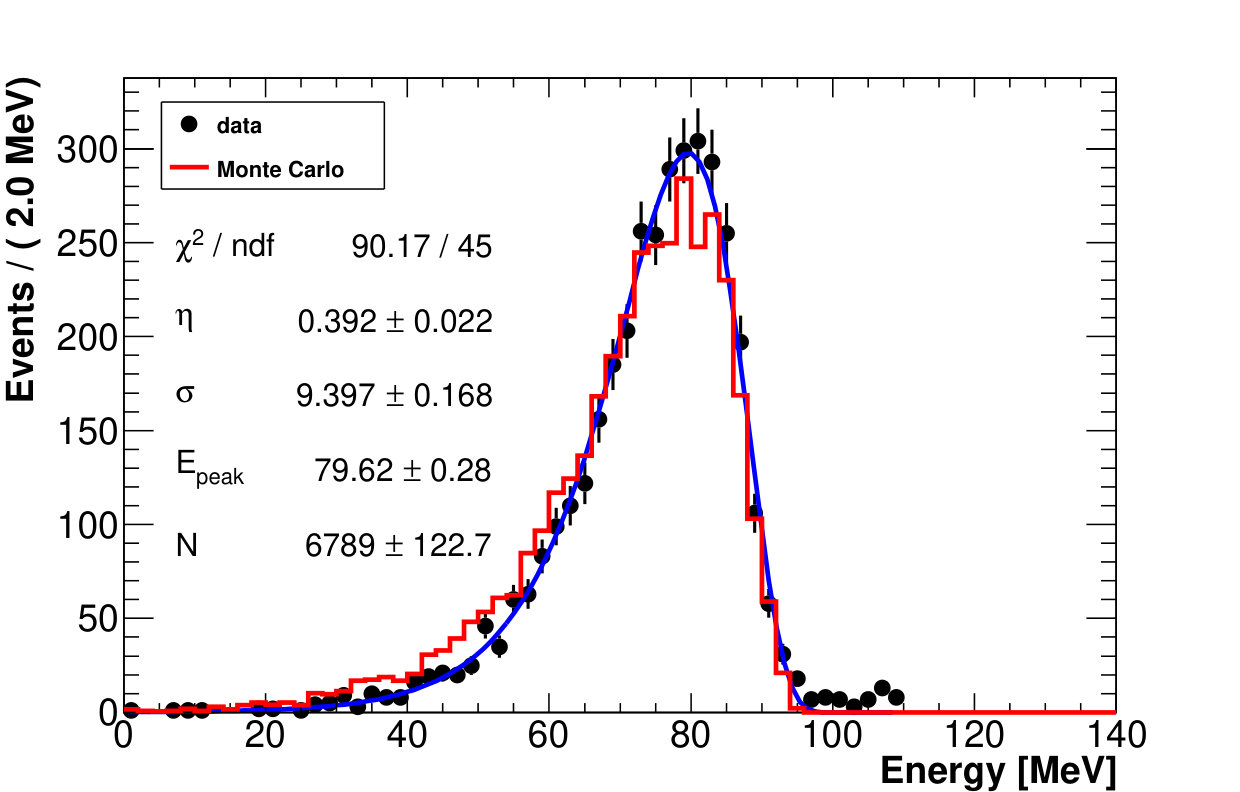 Figure 16
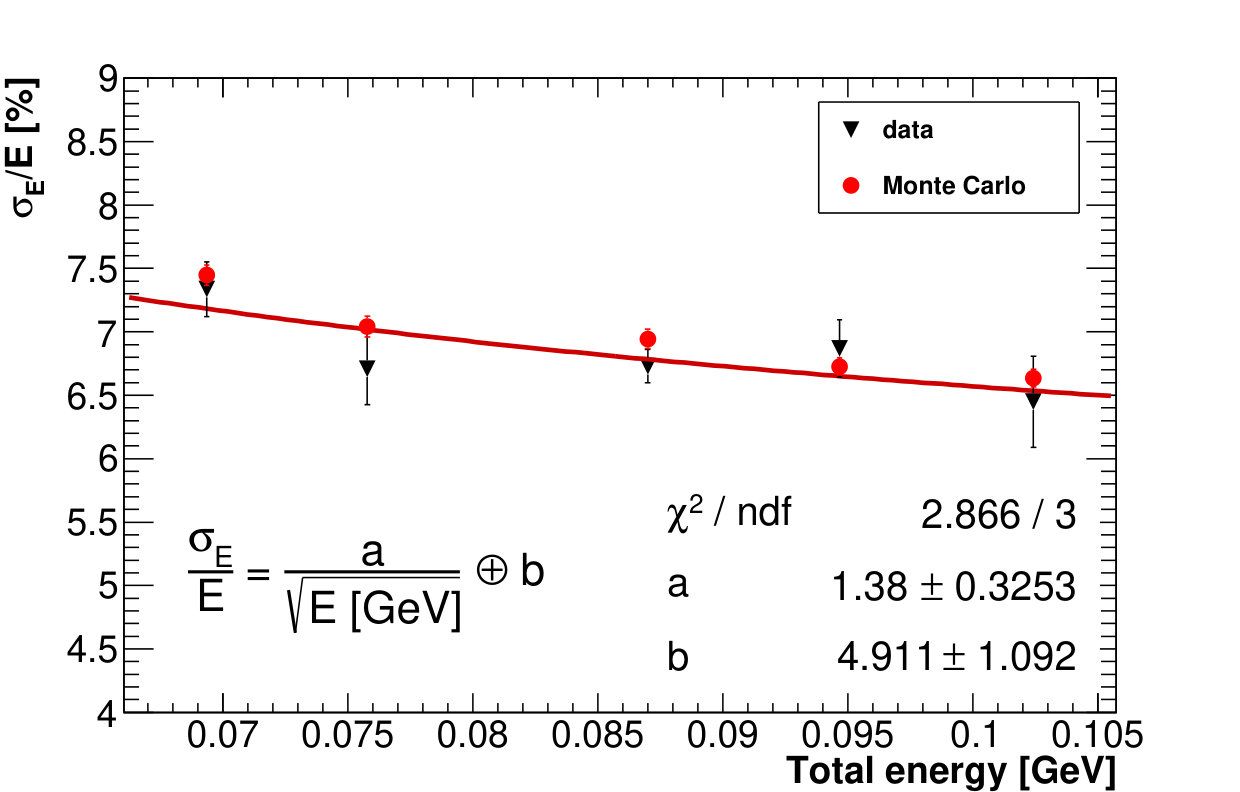 Figure 17
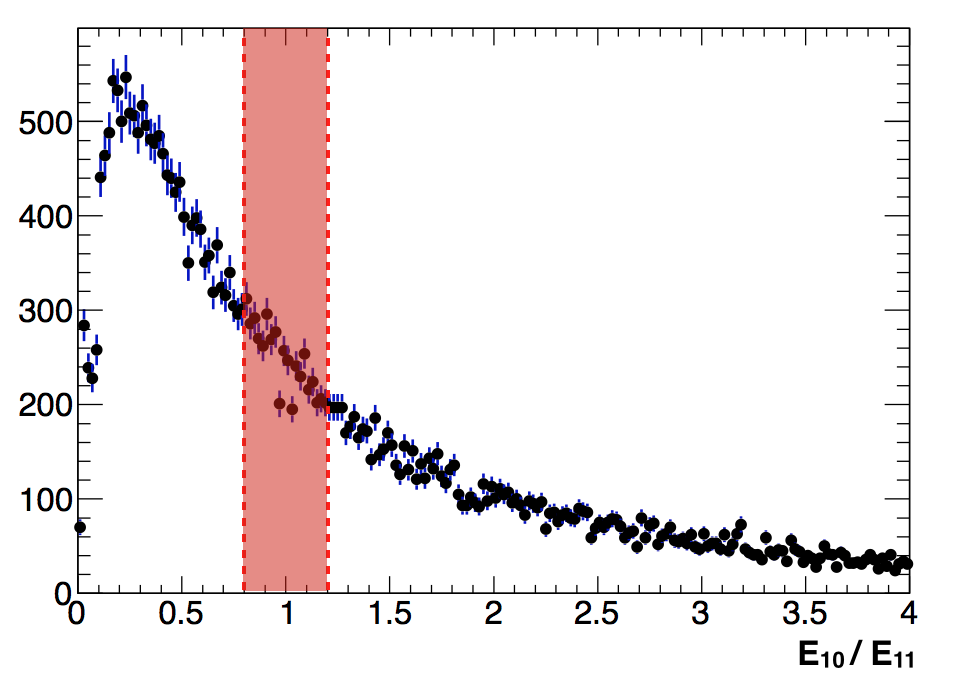 Figure 18
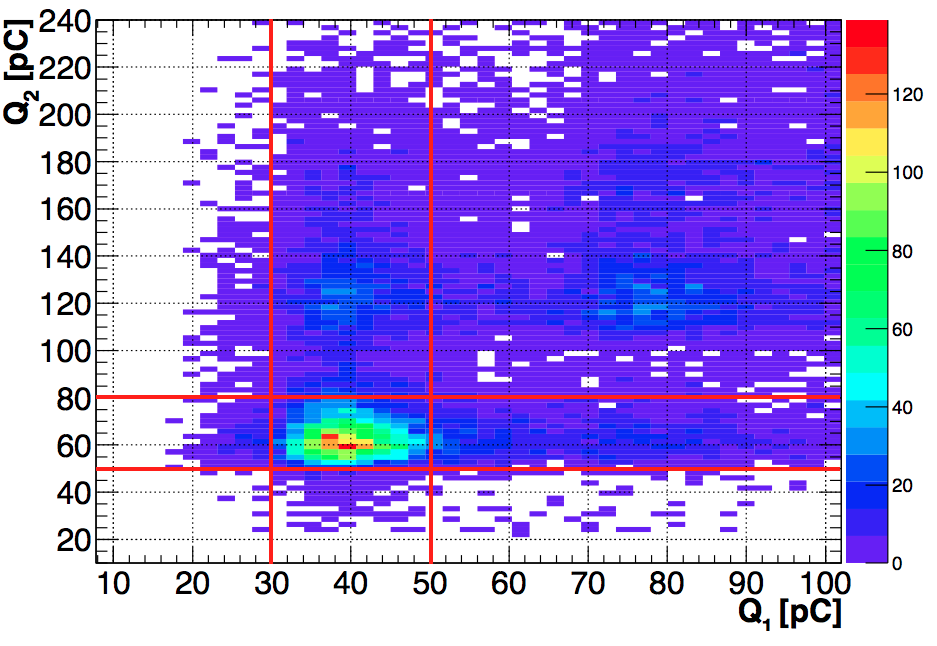 Figure 19
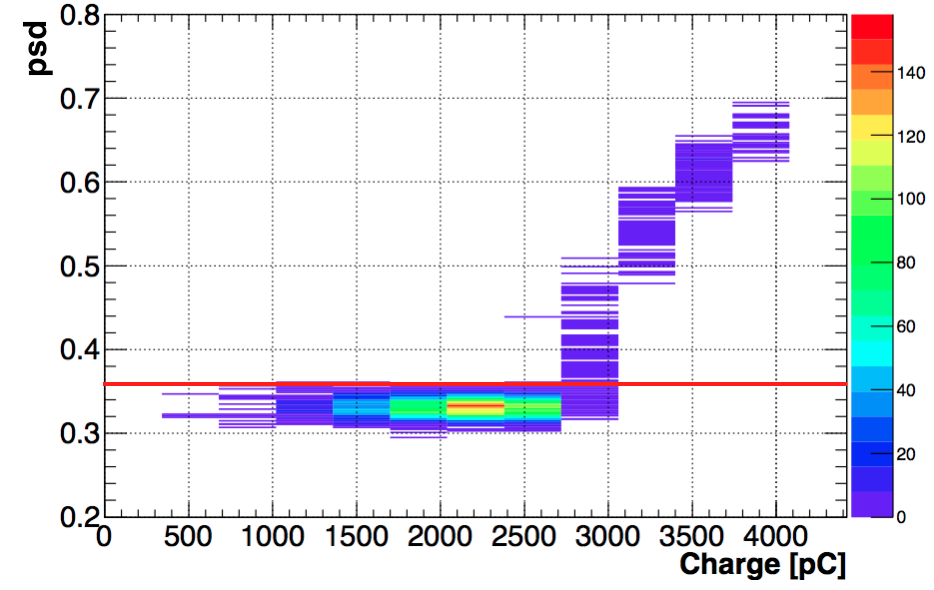 Figure 20
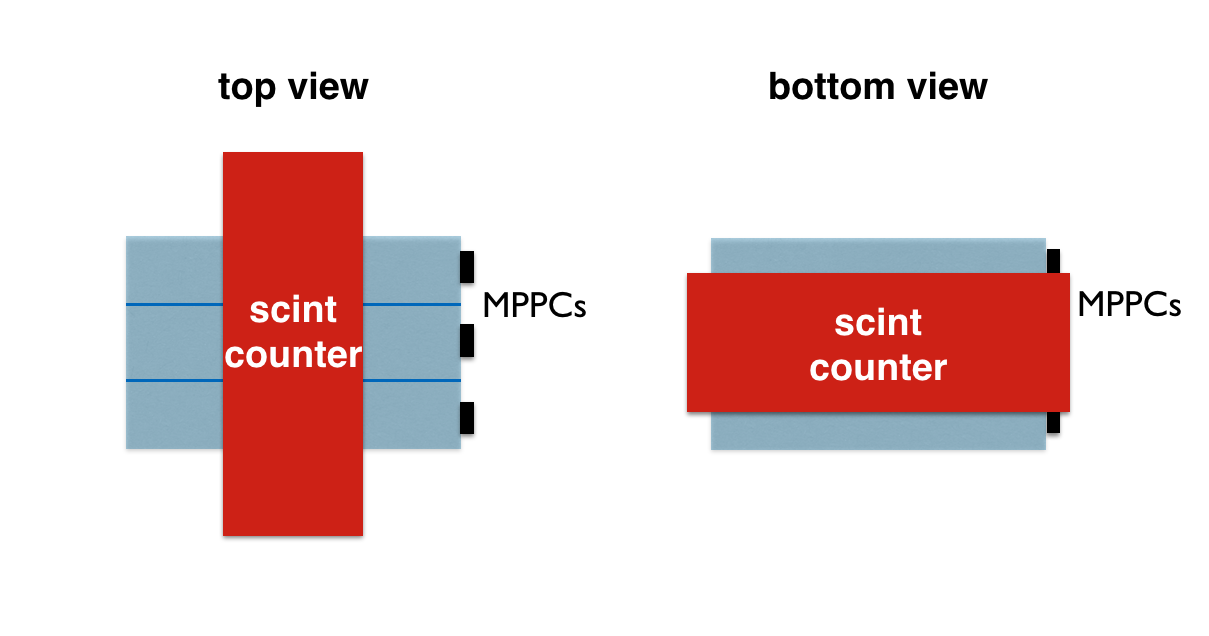 Figure 21
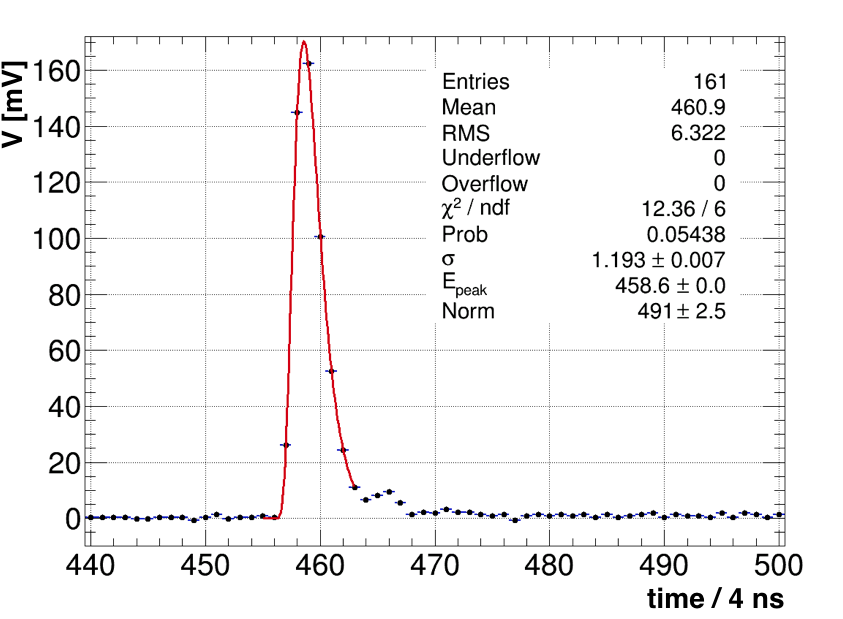 Figure 22
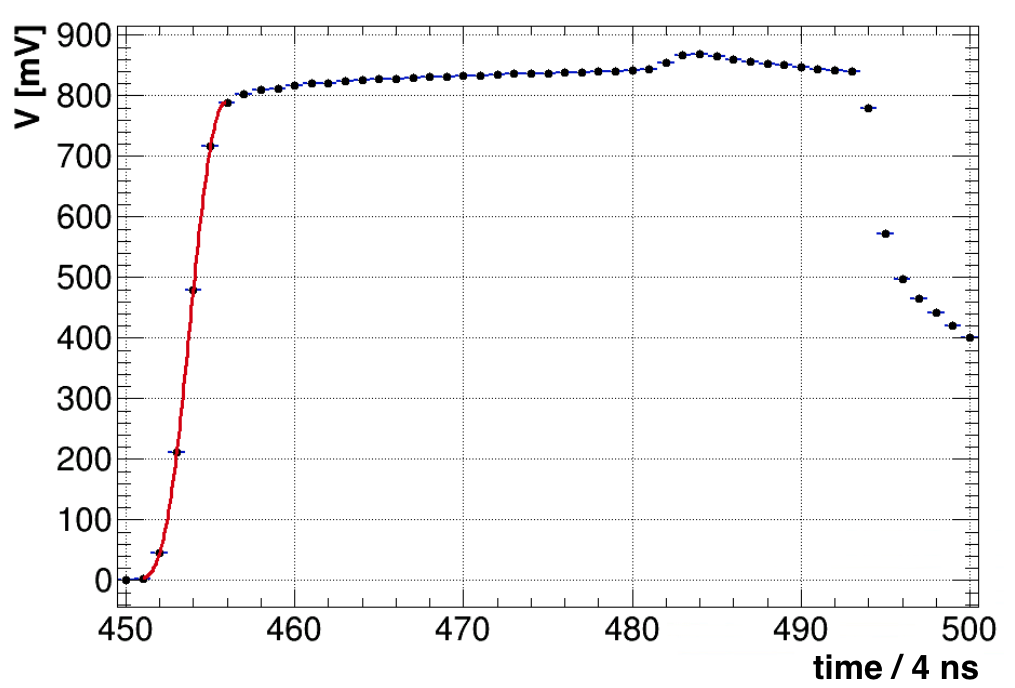 Figure 23
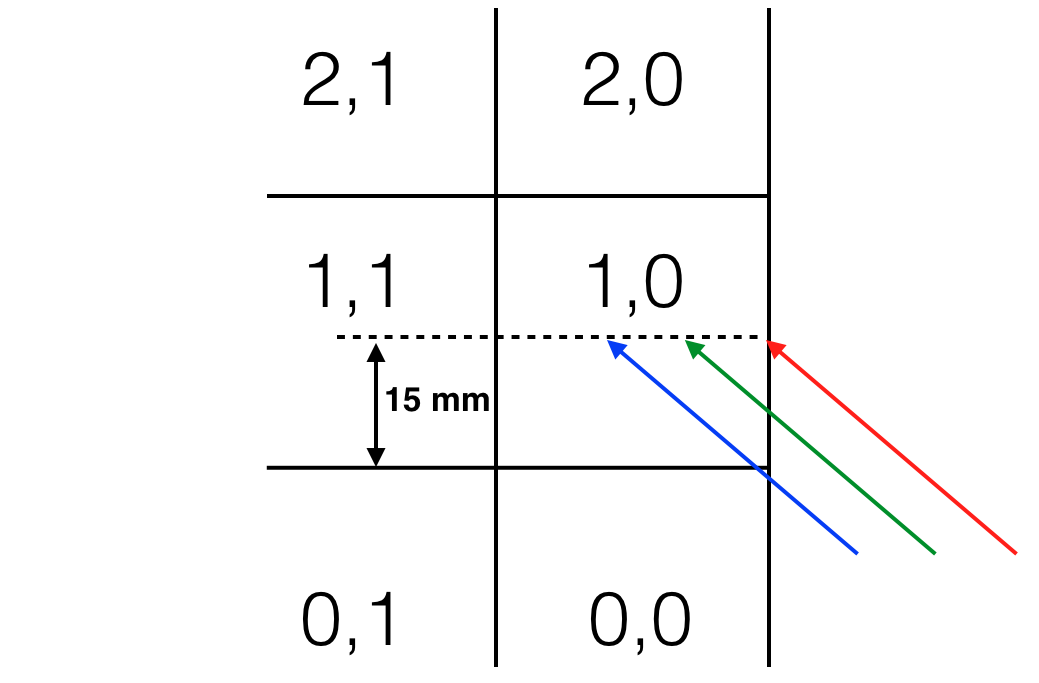 Figure 24
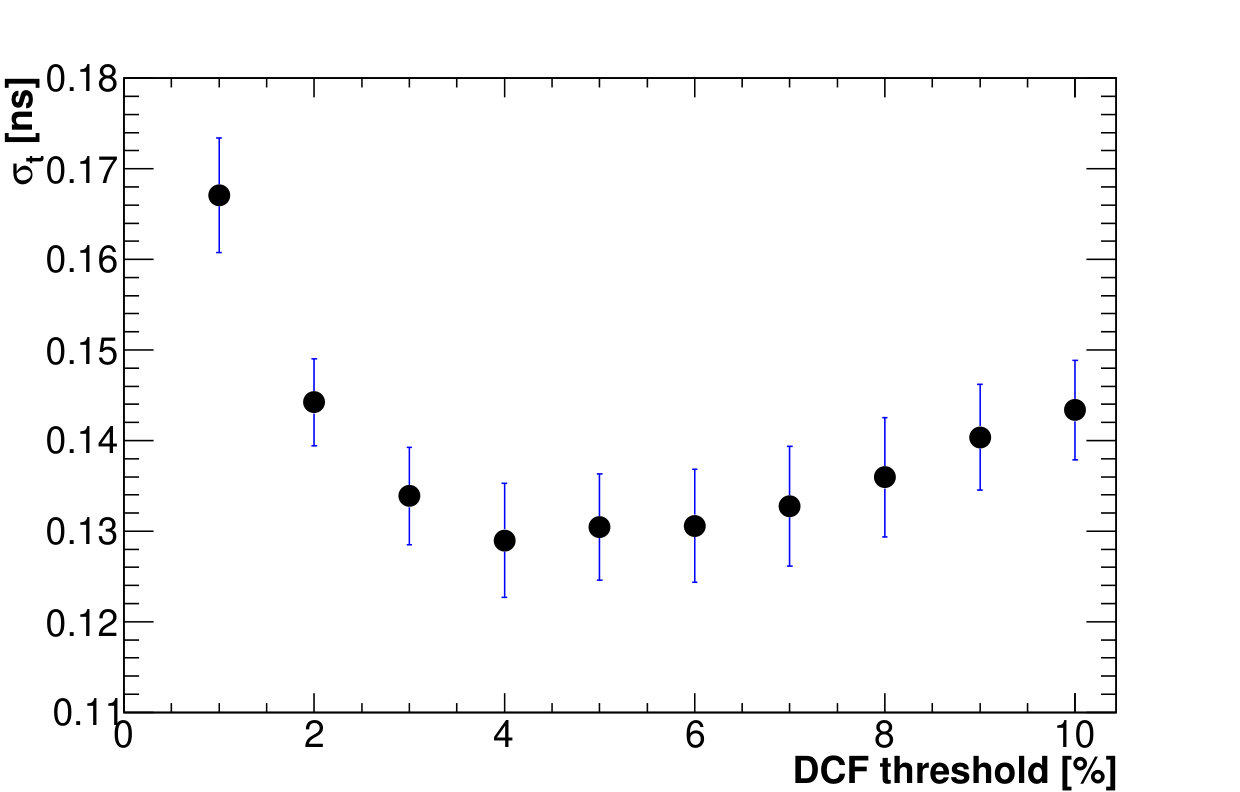 Figure 25
Peer Reviews
No public reviews on file for this paper yet. If you reviewed it on a platform where reviews are public (OpenReview, ICLR, NeurIPS, ICML), you can paste yours below so the community can read it here.
Videos
No videos yet. Explain this paper in a talk, walkthrough, or lecture? Add one.
Measurement of the energy and time resolution of a undoped CsI
- MPPC array for the Mu2e experiment
O. Atanova1, M. Cordelli2, G. Corradi2, F. Colao2, Yu.I. Davydov1, R. Donghia2, S. Di Falco3, S. Giovannella2, F. Happacher2, M. Martini24, S. Miscetti2, L. Morescalchi35, P. Murat6, G. Pezzullo3, A. Saputi2, I. Sarra2, S. R. Soleti7, D. Tagnani8, V. Tereshchenko1, Z. Usubov1
1Joint Institute for Nuclear Research, Dubna, Russia
2Laboratori Nazionali dell’INFN, Frascati, Italy
3INFN sezione di Pisa, Pisa, Italy
4Università Guglielmo Marconi, Roma, Italy
5Università di Siena, Siena, Italy
6Fermi National Accelerator Laboratory, Batavia, Illinois, USA
7University of Oxford, Oxford, United Kingdom
8INFN sezione di Roma3, Roma, Italy
[email protected], [email protected]
Abstract
This paper describes the measurements of energy and time response and resolution of a array made of undoped CsI crystals coupled to large area Hamamatsu Multi Pixel Photon Counters. The measurements have been performed using the electron beam of the Beam Test Facility in Frascati (Rome, Italy) in the energy range 80-120 MeV. The measured energy resolution, estimated with the FWHM, at 100 MeV is . This resolution is dominated by the energy leakage due to the small dimensions of the prototype. The time is reconstructed by fitting the leading edge of the digitized signals and applying a digital constant fraction discrimination technique. A time resolution of about 110 ps at 100 MeV is achieved.
pacs:
29.40.Mc, 29.40.Vj, 29.30.Dn
Keywords: Calorimetry, Timing, MPPC, undoped CsI crystal, Mu2e experiment \ioptwocol
1 Introduction
The Mu2e experiment at FNAL [1] aims to observe the charged-lepton flavor violating neutrinoless conversion of a negative muon into an electron. The conversion results in a monochromatic electron with an energy slightly below the muon rest mass (104.97 MeV). Two major elements of the detector system are the straw tube tracker and the crystal calorimeter. The calorimeter [2] should confirm that the candidates reconstructed by the extremely precise tracker system are indeed conversion electrons while performing a powerful /e particle identification. Moreover, it can provide a seed for the track search and a high level trigger for the experiment independently from the tracker system. The calorimeter should also keep functionality in the highest irradiated areas where the background delivers a dose of about 100 krad and a fluence of about 1012 neutrons/cm2 1-MeVeq in the hottest area, while working in the presence of a 1 T axial magnetic field. These requirements translate to a design of a calorimeter with large acceptance, good energy resolution O(5) and a reasonable position (time) resolution better than 1 cm (0.5 ns).
The baseline version of the calorimeter is composed of two disks of inner (outer) radius of 37.4 (66.0) cm assembled from about 1350 undoped CsI crystals of cm3 dimensions. Each crystal is read out by two large area Silicon Photomultiplier (SiPM) arrays. The undoped CsI emission spectrum peaks at 310 nm with a decay time constant of about 30 ns [3]. The characteristics of the undoped CsI are a reasonable match to the Mu2e requirements: light yield (2000 photons/MeV), radiation length (1.9 cm) and Molière radius (3.6 cm). Time resolution better than 0.5 ns has been recently measured with an undoped CsI calorimeter at 100 MeV using a PMT-based readout combined with a signal waveform digitization at 125 Msps [4, 5]. The tests discussed in this paper are motivated by the development of a new generation of UV-extended SiPM [6] from Hamamatsu that improves the photo-detection efficiency (pde) close to the peak in the wavelength emission spectrum of undoped CsI. This is obtained by replacing the epoxy resin with a silicon protection layer. A dedicated beam test was carried out during April 2015 at the Beam Test Facility (BTF) in Frascati (Italy) where time and energy measurements have been performed using a low energy electron beam, in the energy range [80,120] MeV.
2 Experimental setup
The calorimeter prototype consisted of nine cm3 undoped CsI crystals wrapped in 150 m of Tyvek®, arranged into a matrix. Out of the nine crystals, two were produced by Filar OptoMaterials [7], while the remaining 7 came from ISMA [8]. Each crystal was previously tested with a 22Na source to determine its light output (LO) and longitudinal response uniformity (LRU), with the results [9]:
- •
a LO of about 90 pe/MeV, when read out with a UV-extended PMT R2059 by Hamamatsu [10] coupled through an air gap;
- •
a LRU corresponding to a LO variation at both ends of the crystals less than .
Each crystal was coupled to a large area mm2 SPL TSV SiPM (MPPC) from Hamamatsu [6] by means of the Rhodorsil 7 silicon paste [11]. SPL stands for “silicon protection layer”, while TSV for “through silicon via” and indicates a new technique used for building the SiPM that is characterized by a lower noise and a higher fill-factor. The operating voltage was set at 55 V for each MPPC, about 3 V above the breakdown voltage, corresponding to an average gain of and a pde of about at 300 nm. Each MPPC is composed of an array of 16 single SiPM, each one read out with its own anode. A front-end electronics (FEE) board was developed to form an analog sum of the pulses from several anodes. This board provides also a local HV regulation and an amplification by a factor of 8. Photosensor signals coming from the crystals and from a pair of scintillating counters used for triggering were read out with 12 bit, 250 Msps waveform digitizer boards, V1720 from CAEN [12].
The coincidence of the signals from two cm3 plastic scintillating counters, crossed at 90 degrees, was used for triggering on the incoming beam. In addition, another coincidence of the signals from two cm3 scintillating counters, one above and one below the array as shown in Figure 1, was used to provide a cosmic ray trigger.
Two configurations, schematically shown in Figure 2, were studied during the test:
beam at 0 degrees with respect to the prototype front face, defined as the side opposite to the photosensors; 2. 2.
beam at 50 degrees with respect to the prototype surface.
Configuration (ii) was motivated by the fact that the expected average incidence angle of a signal electron in Mu2e is about 50 degrees. With the prototype rotated by 50 degrees, data were taken in three different beam impact points, as shown in Figure 3:
- •
on the edge of the crystal (1, 0);
- •
7.7 mm from the edge;
- •
15.4 mm from the edge.
The channel numbering convention used in the analysis is shown in Figure 4.
The BTF [13] uses the high current Dane linac beam to send e- (e) bunches, with an intensity between to particles/pulse and energy between 300 to 750 (550) MeV, to a Cu target to create secondary low momentum beams. The target attenuates the intensity and, in cooperation with a slit system and a bending dipole, allows to select various configurations of energy and intensity. In our test, we reduced the intensity to provide an average multiplicity of 0.8 e- per pulse in the 80-120 MeV region. The BTF repetition rate is 50 Hz, with a bunch width of around 10 ns. The beam energy spread is excellent at high energy but degrades at lower energies. In our previous test [14], we have measured an energy spread of 4.5% at 100 MeV. For the result reported here the BTF experts improved the slit system to reduce this spread as much as possible. We estimated the resulting beam energy spread to be less than .
The beam divergence in the plane transverse to the beam direction (X-Y) is small, a Gaussian beam profile is observed with a of about 2 mm as monitored by a dedicated GEM-TPC system (see Figure 5).
3 Charge and time reconstruction
A waveform sampling readout with 250 Msps allows an accurate analysis of the signals, which is useful in Mu2e to resolve the pileup of hits. The total charge and the time of the detected pulses were reconstructed as follows.
3.1 Charge reconstruction
The charge was estimated by numerical integration of the waveform; two time windows of 400 ns were used as integration gates in order to guarantee the full integration of the signals. The first gate was used to estimate the pedestal at early time, where no pulses were present, while the second gate, around the signal peak, was used to integrate the signal charge . The reconstructed charge was then defined as . The signal time was determined by fitting the leading edge of the waveform with an analytic function.
3.2 Time reconstruction
Assuming a constant pulse shape, the best accuracy is achieved by setting the signal time at a threshold corresponding to a constant fraction of the pulse height. Pivotal for this procedure, usually called digital constant fraction (DCF), are the choices of: fit function, fit range and threshold. Several parametrizations were tested: single and double exponential functions, exponential functions convoluted with a Gaussian, log-normal function , and several others. For each case, a scan over the DCF threshold and fit range has been performed. The fit function that provided the best time resolution was the asymmetric log-normal function [15] defined as:
[TABLE]
where is the normalization parameter, is the position of the peak, = FWHM/2.35, is the asymmetry parameter, and can be written as
[TABLE]
This can be understood, as the asymmetric log-normal function captures several important features of the electronic pulse, like the start of the pulse development at a finite time , an exponential growth at a very early stage of the pulse development, and the presence of the pulse height maximum.
Scintillating counter waveforms
In the beam test, the scintillating counters had signals with a leading edge of about 15 ns (3 digitized samples), and a total width shorter than 100 ns. Since the asymmetric log-normal is defined by 4 parameters, the fit range should be wider than 15 ns. The lower edge of the fit was set at the first sample where the signal exceeds 5 mV, while the upper edge was set 16 ns after the peak, thus providing more than 6 samples to perform the fit. An example of a fit to a pulse is shown in Figure 6.
This procedure was checked looking at the distribution of number of degrees of freedom ( ) and \chi^{2}/\mbox{N_{DOF} }. Presence of systematic effects has been investigated looking at the distribution of the reconstructed time within the digitized sample (). Figure 7 shows the distributions of for both scintillating counters that are reasonably flat.
CsI crystal waveforms
Waveforms corresponding to signals from the CsI crystals convoluted with the SiPM and pre-amp response function have a leading edge of about 25 ns, and a total width of about 300 ns. The duration of the leading edge allows to perform the fit only on this signal region. The fit range has been defined as follows: the lower limit was set at the first time sample where the pulse exceeds of the pulse maximum, while the upper limit has been set at the first time sample where the pulse exceeds of the pulse maximum. The DCF threshold, used to determine the reconstructed time, has been optimized using the data taken with a 80 MeV electron beam at 0 degrees incidence angle.
Figure 8 shows that, for the thresholds in the range 2% - 10% of the maximal pulse height, the time resolution is stable within . So the DCF threshold has been set to of the maximum pulse height. Figure 9 shows an example of a fit to a CsI crystal waveform.
The selected range provides more than 7 samples to perform the fit. The distribution of , shown in Figure 10, is flat and does not present any significant systematic effects.
4 Analyses selection
Events with a single beam particle within the integration gate were selected requiring:
Energy deposition in each of the two beam counters consistent with a single particle. 2. 2.
Pulse-shape discrimination of the waveforms from each of the CsI crystals to discard events with one or more channels saturated because of pileup of particles.
Figure 11 shows the scatter plot of the charges reconstructed in the beam counters, and . The cuts applied for selecting single particle events are the following: pC and pC.
However, this selection was not sufficient to discard all the events with more than 1 electron, due to the efficiency of the scintillating counters and their limited acceptance. Figure 12 shows an example of a saturated signal not discarded by the cut on and .
For that reason, an additional selection was made using a pulse-shape discriminator variable, psd, defined as follows:
[TABLE]
where and correspond to the time samples at of the maximum pulse height on the leading edge, and of the maximum pulse height on the trailing edge, respectively. Figure 13 shows the distribution of psd as a function of the reconstructed charge for the channel (0, 0). In the following, we consider “single particle events” as those with psd 0.36 on all the reconstructed hits. The psd discrimination allows to select a clean set of events at each beam energy without directly cutting on the energy distribution.
5 Energy and Time calibration
Equalization of the time and pulse height responses of the channels was achieved using data taken with the 80 MeV beam impinging normally on each crystal center. The energy scale calibration was performed using the beam at 0 degrees in the energy range [80, 120] MeV, while varying the energy in 10 MeV steps. An additional point at the energy of about 20 MeV was included using Minimum-Ionizing Particles (MIPs) from the cosmic ray data. The energy scale was determined comparing data with the results obtained by means of a GEANT4 [16] based Monte Carlo simulation. Figure 14 shows the calibration curve with a linear fit superimposed.
The energy response of the calorimeter prototype to the MIPs has also been compared with the Monte Carlo. Figure 15 shows the energy distributions of the crystals in the central column, after calibration and equalization, for data superimposed with the Monte Carlo. A good data-Monte Carlo agreement is seen.
The same data used for the charge equalization was also used to determine the time walk corrections of the prototype channels. A reference time , defined as the average of the beam counter times (): , was subtracted from each channel time. For the beam energies in the range [80, 120] MeV, the jitter of , defined as the standard deviation of its distribution of each run, is about () ps. The slewing functions of all the prototype channels were applied, following the same procedure described in reference [14]. Investigating other possible sources of systematic effects, a dependence of the reconstructed time on the waveform rise time was identified. Figure 16 shows the correlation between the rise time and the reconstructed charge.
To reduce the impact of the changing pulse shape on the reconstructed times, a threshold at 10 MeV was applied to the crystal signals used for the time resolution studies.
6 Measurement of the energy resolution
The active volume of the calorimeter prototype was cm3 and corresponded to . Due to the small dimensions, the transverse and longitudinal leakages impact significantly the energy response. Figure 17 shows the distribution of the total energy deposition obtained from data taken at a beam energy of 90 MeV and 0 degrees incidence angle compared with the Monte Carlo. The same Figure shows also a typical fit with a log-normal function to the data. The of this fit was used to evaluate the resolution.
Figure 18 shows the measured energy resolution as a function of the total energy reconstructed in the prototype, with the simulation results superimposed. Within the uncertainties, data and Monte Carlo distributions are in agreement.The measured energy resolution varies from to in the energy range [70, 102] MeV.
Figure 19 shows that in the configuration with the beam at 100 MeV and 50 degrees incidence angle the leakage is larger. Fit results show an energy resolution of about 9 MeV. The same Figure shows an adequate agreement between data and Monte Carlo.
7 Measurement of the time resolution
The time resolution was measured using three different methods:
using only the crystal with the largest energy deposition; 2. 2)
using the energy-weighted mean time of all crystals in the matrix:
[TABLE] 3. 3)
using two neighboring crystals with similar energy deposition.
The first two techniques require an external time reference . No external time reference is needed for the third one. Methods 1 and 2 were used with both beam configurations: at 0 degrees and 50 degrees. Method 3 was used only for the runs with the beam at 50 degrees, because these were the only ones where neighboring crystals with reconstructed energies larger than 10 MeV were present. The configuration at 0 degrees represents the simplest one from the point of view of the analysis, providing a helpful handle for the development of the time reconstruction method. Figure 20 shows an example of the distribution of time residual between and for the 100 MeV run. A Gaussian fit to the same distribution shows a standard deviation of about 150 ps, so that removing the contribution of the jitter, the resulting time resolution is of about 110 ps.
All data taken in the tilted configurations were combined to apply Method 3. Crystals (1, 1) and (1, 0) were used. Figure 21 shows the distribution of the reconstructed energy ratio between the two selected crystals.
To select the events, we required: . Figure 22 shows the distribution of time residuals between and . The sigma resulting from a Gaussian fit to this distribution is ps, so that assuming the time resolutions of the two channels to be similar, the single channel time resolution is ps.
Varying the cut on R by about 10% results in no significant difference in the time resolution. To cross check the result obtained with this technique, Method 1 was used to measure the time resolution in the same events. Figure 23 shows the time residual between and . Subtracting in quadrature the jitter of 100 ps results in a time resolution of about 200 ps that is compatible with the result obtained with Method 3.
7.1 Cosmic rays
As MIPs crossing 3 cm of CsI crystal, on average, deposit about 20 MeV of energy, cosmic muons allow a measurement of the time resolution in an energy range below the limits of the BTF. Only events where the cosmic ray crosses the central column of the prototype were selected, and the “neighboring crystals” technique was used to measure the time resolution. This procedure, however, includes an additional fluctuation due to variations in the path length of the muons crossing multiple crystals at different angles. The cosmic event selection requires a reconstructed energy above 5 MeV for each of the crystals in the central column, and less than 5 MeV of deposited energy for each of the other 6 crystals. With a total of three crystals in the central column, there are two independent pairs of neighboring crystals: (2, 1)-(1, 1) and (1, 1)-(0, 1) that were used to measure the time resolution with Method 3. Figure 24 shows as an example the time residuals for the pair (1,1) - (1,0). Distributions of time residual were fit to a Gaussian function. Then, the time resolution is quoted using the average of the standard deviations resulting from the two fits. Assuming the resolution in all channels to be the same, the resulting average is divided by a factor : ps.
All results plotted as a function of the energy are summarized in Figure 25. A clear trend of the timing resolution dependence on energy is shown. The timing resolution ranges from about 250 ps at 22 MeV to about 120 ps in the energy range above 50 MeV. The timing resolutions evaluated with different methods in the same energy range are consistent. Furthermore, in the same energy range, the time resolution using Method 2 is slightly worse when the beam impacts at 50 degrees (violet triangles).
Fluctuations of the shower development could result in additional time jitter between the signals from different crystals and might be partially responsible for this discrepancy. In principle the time resolution depends on the undoped CsI light emission characteristics [17] according to the following formula:
[TABLE]
where is proportional to the emission time constant of the undoped CsI, and represents the additional contribute from the readout electronics. The fit of the data to this function (see Figure 25) shows a good agreement between the data and the fitted function.
8 Summary
A reduced scale calorimeter prototype for the Mu2e experiment has been tested with an electron beam in the energy range [80, 120] MeV at the Beam Test Facility in Frascati (Italy). Good agreement between data and Monte Carlo is observed and the measured energy resolution is dominated by leakage due to the small dimensions of the prototype. The time resolution as a function of the energy deposition has been measured using three different techniques that consistently show that ranges from 250 ps at 22 MeV to about 120 ps above 50 MeV. These results satisfy the Mu2e requirements and also significantly improve the timing resolution achievable when using undoped CsI at these low energies.
Acknowledgment
The authors express their sincere thanks to the operating staff of the Beam Test Facility in Frascati (Italy), for providing us a good quality electron beam, and the technical staff of the participating institutions. This work was supported by the US Department of Energy; the Italian Istituto Nazionale di Fisica Nucleare; the US National Science Foundation; the Ministry of Education and Science of the Russian Federation; the Thousand Talents Plan of China; the Helmholtz Association of Germany; and the EU Horizon 2020 Research and Innovation Program under the Marie Sklodowska-Curie Grant Agreement No.690385.
References
- [1]
L. Bartoszek et al., Mu2e Technical Design Report, 3rd ed. arXiv:1501.05241 [physics.ins-det], 2014.
- [2]
N. Atanov et al., Design and status of the Mu2e electromagnetic calorimeter, NIM A 824, 695 - 698, 2016.
- [3]
K. A. Olive et al, Review of Particle Physics, Chin. Phys. 14, 2014.
- [4]
K. Abe et al., Undoped CsI calorimeter for the experiment at KEK-PS, NIM A, 545, 278, 295, 2005.
- [5]
E. Iwai et al., Performance study of a prototype pure CsI calorimeter for the KOTO experiment, NIM A, 786, 135-142, 2015.
- [6]
Hamamatsu, TSV MPPC datasheet, https://www.hamamatsu.com/resources/pdf/ssd/mppc_kapd0004e.pdf , 2016.
- [7]
Filar optoMaterials s.r.l., http://www.filaroptomaterials.com, 2016.
- [8]
Institute for Scintillating Materials (ISMA), http://isma.kharkov.ua/eng, 2016
- [9]
M. Angelucci et al., Longitudinal uniformity, time performances and irradiation test of pure CsI crystals, NIM A, 824, 678-680, 2016
- [10]
Hamamatsu, PMT R2059 datasheet,http://www.hamamatsu.com/resources/pdf/etd/R1828-01_R2059_TPMH1259E.pdf, 2016.
- [11]
RHODORSIL® PASTE 7 Technical data sheet, http://www.silitech.ch/upload/fiche_technique_D/245.pdf, 2001.
- [12]
CAEN, CAEN V1720 digitizer board datasheet, http://www.caen.it/csite/CaenProd.jsp?idmod=570&parent=11, 2016.
- [13]
G. Mazzitelli et al., Commissioning of the DANE beam test facility, NIM A, 515, 3, 524 - 542, 2003.
- [14]
N. Atanov et al., ”Measurement of time resolution of the Mu2e LYSO calorimeter prototype, NIM A, 812, 104-111, 2016.
- [15]
C. Grupen, Particle detectors, Cambridge Monographs on Particle Physics, Nuclear Physics and Cosmology, 239-240, 1996.
- [16]
S. Agostinelli et al., Geant4–a simulation toolkit, NIM A, 506, 3, 250-303, 2003.
- [17]
A. M. Baldini et al., A cryogenic facility for testing the PMTs of the MEG liquid xenon calorimeter, NIM A, 566, 294-301, 2006.
The reference list from the paper itself. Each links out to its DOI / PubMed record.
- 1[1] L. Bartoszek et al. , Mu 2e Technical Design Report , 3rd ed. ar Xiv:1501.05241 [physics.ins-det], 2014.
- 2[2] N. Atanov et al. , Design and status of the Mu 2e electromagnetic calorimeter , NIM A 824, 695 - 698, 2016.
- 3[3] K. A. Olive et al , Review of Particle Physics , Chin. Phys. 14, 2014.
- 4[4] K. Abe et al. , Undoped Cs I calorimeter for the K L 0 → π 0 ν ν → subscript superscript 𝐾 0 𝐿 superscript 𝜋 0 𝜈 𝜈 K^{0}_{L}\rightarrow\pi^{0}\nu\nu experiment at KEK-PS , NIM A, 545, 278, 295, 2005.
- 5[5] E. Iwai et al. , Performance study of a prototype pure Cs I calorimeter for the KOTO experiment , NIM A, 786, 135-142, 2015.
- 6[6] Hamamatsu, TSV MPPC datasheet , https://www.hamamatsu.com/resources/pdf/ssd/mppc_kapd 0004 e.pdf , 2016.
- 7[7] Filar opto Materials s.r.l., http://www.filaroptomaterials.com , 2016.
- 8[8] Institute for Scintillating Materials (ISMA), http://isma.kharkov.ua/eng , 2016