High pressures in room evacuation processes and a first approach to the dynamics around unconscious pedestrians
F.E. Cornes, G.A. Frank, C.O. Dorso

TL;DR
This paper investigates the dynamics of crowd evacuation under high-pressure conditions, modeling unconscious pedestrians as inanimate objects and analyzing how their behavior influences evacuation efficiency and crowd morphology.
Contribution
It introduces a novel modeling approach for unconscious pedestrians in evacuation scenarios and explores how their behavior affects crowd dynamics and performance.
Findings
Emergence of new crowd structures during evacuation
Unconscious pedestrians impact overall evacuation efficiency
Behavioral choices influence crowd morphology and flow
Abstract
Clogging raises as the principal phenomenon during many evacuation processes of pedestrians in a panic situation. As people push to escape from danger, compression forces may increase to harming levels. Many individuals might fall down, while others will try to dodge the fallen people, or, simply pass through them. We studied the dynamics of the crowd for these situations, in the context of the "social force model". We modeled the unconscious (fallen) pedestrians as inanimate bodies that can be dodged (or not) by the surrounding individuals. We found that new morphological structures appear along the evacuating crowd. Under specific conditions, these structures may enhance the evacuation performance. The pedestrian's willings for either dodging or passing through the unconscious individuals play a relevant role in the overall evacuation performance.
Click any figure to enlarge with its caption.
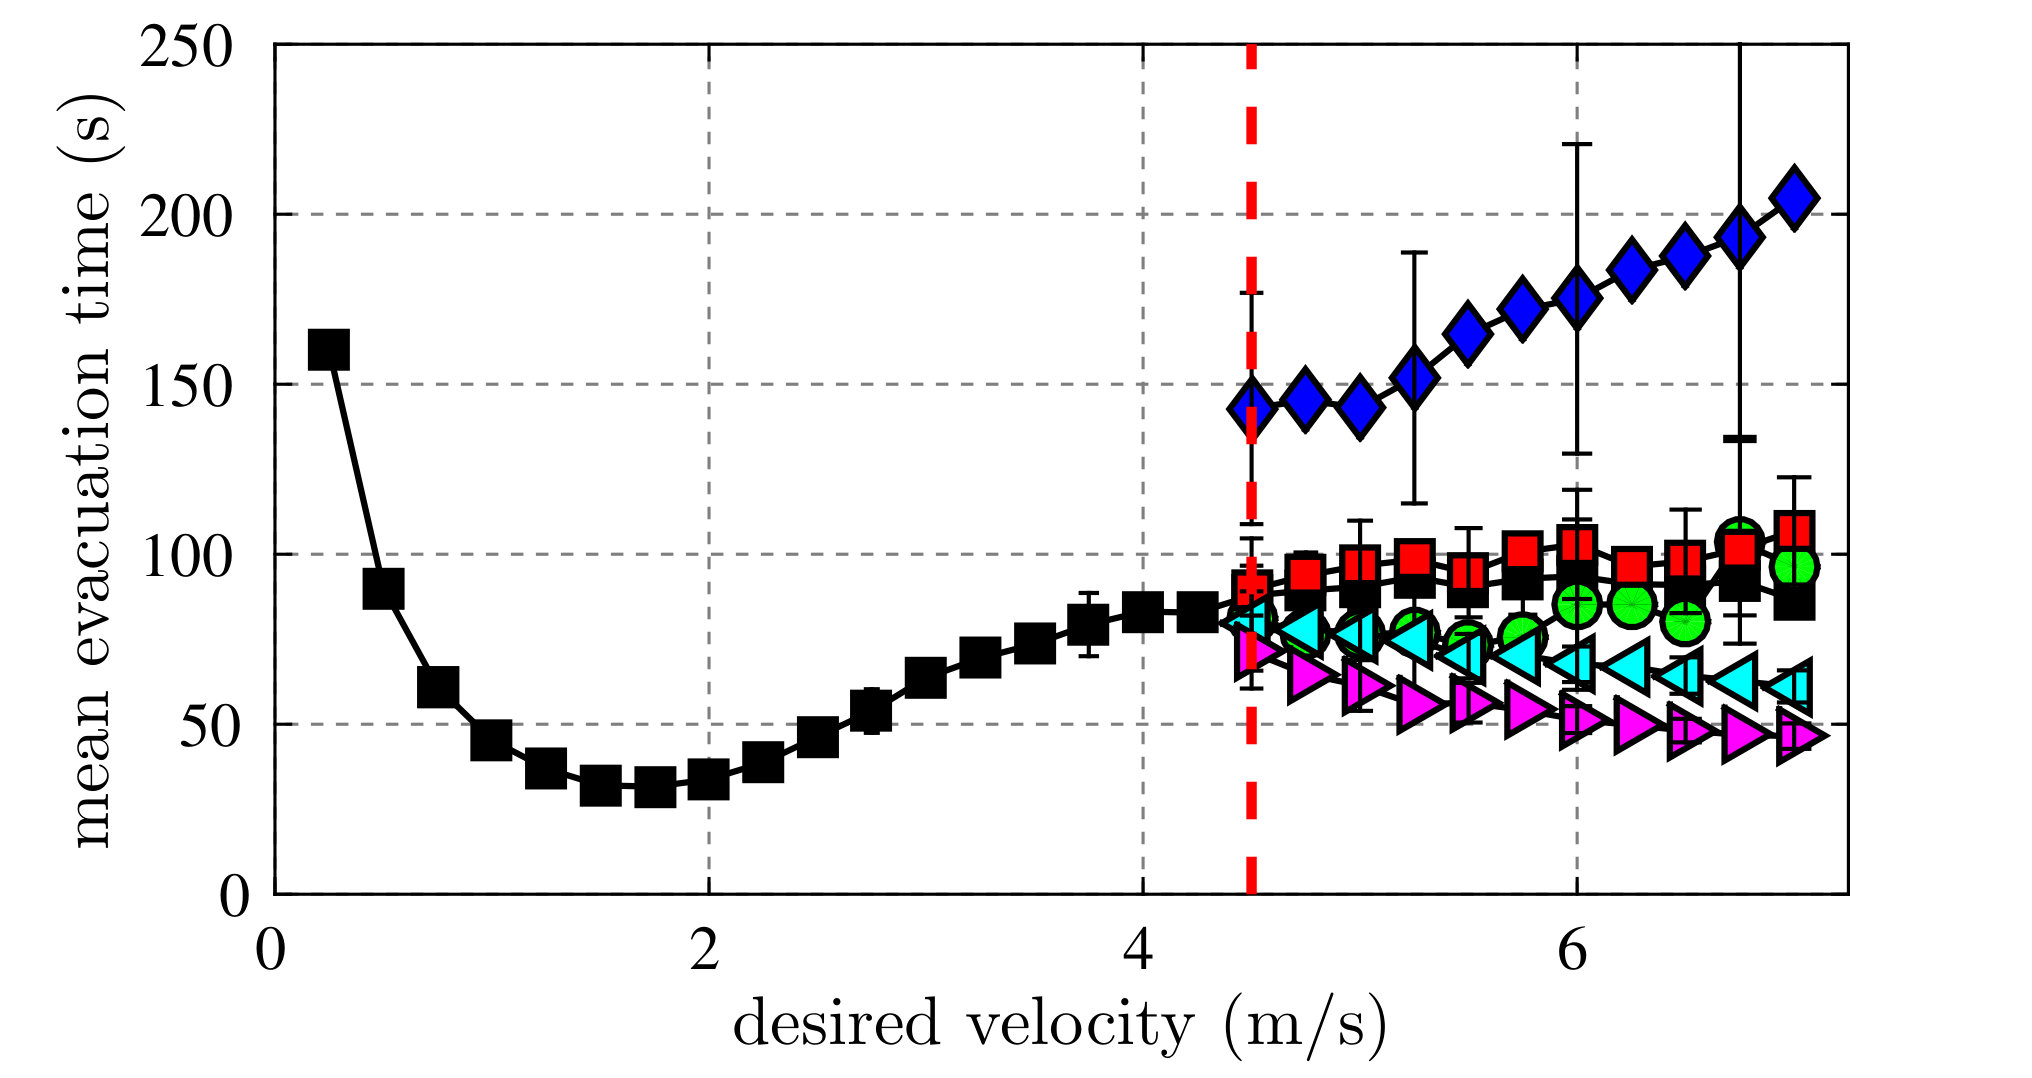 Figure 1
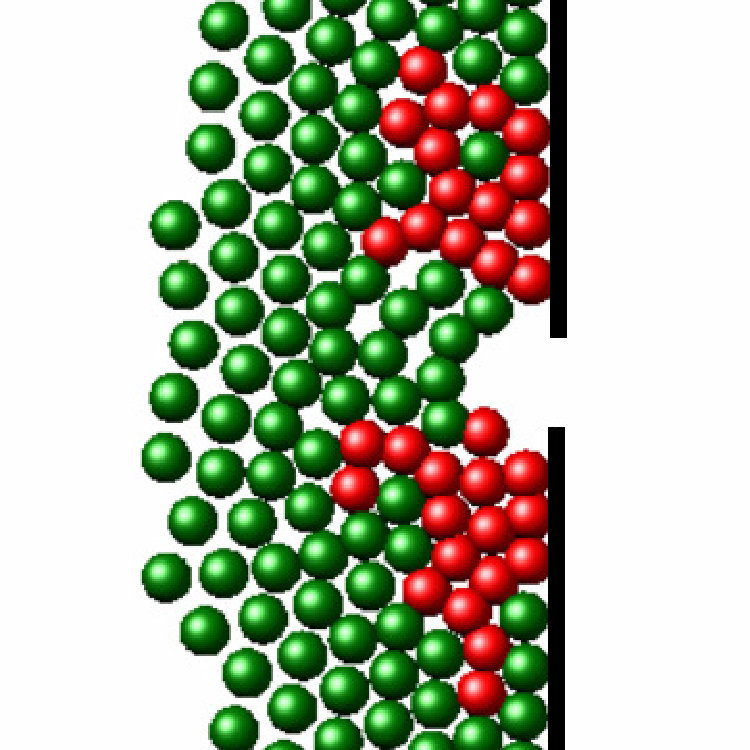 Figure 10
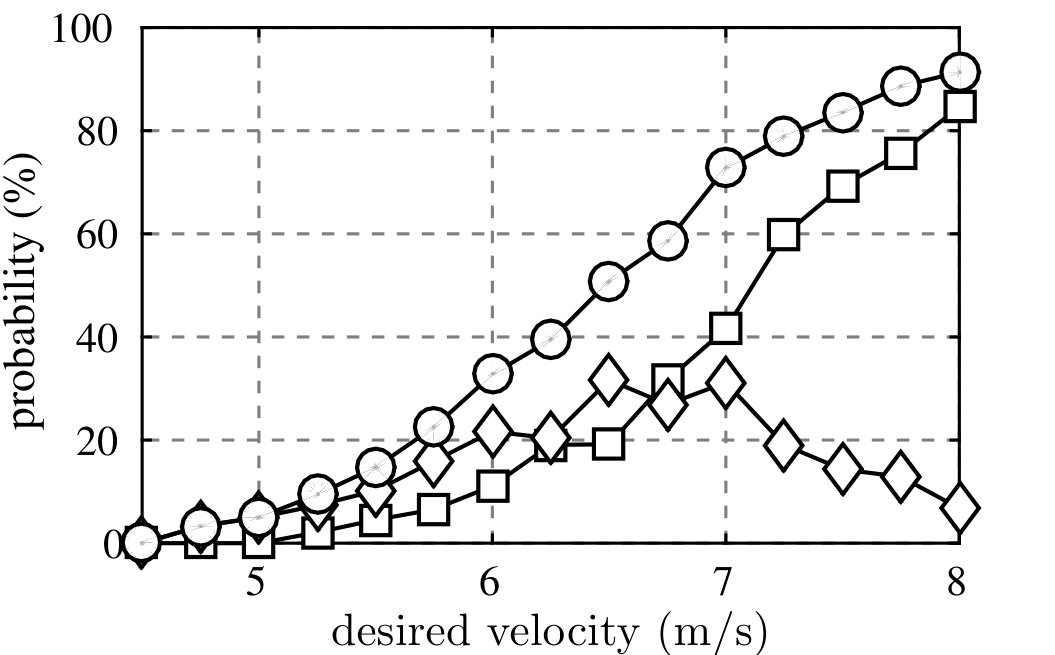 Figure 15
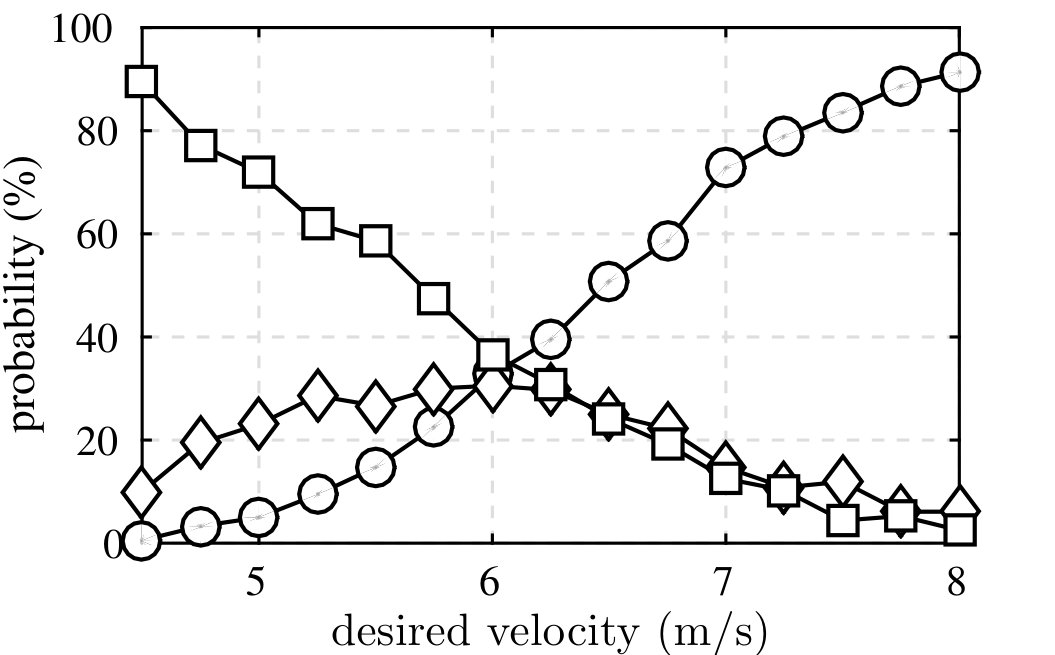 Figure 17
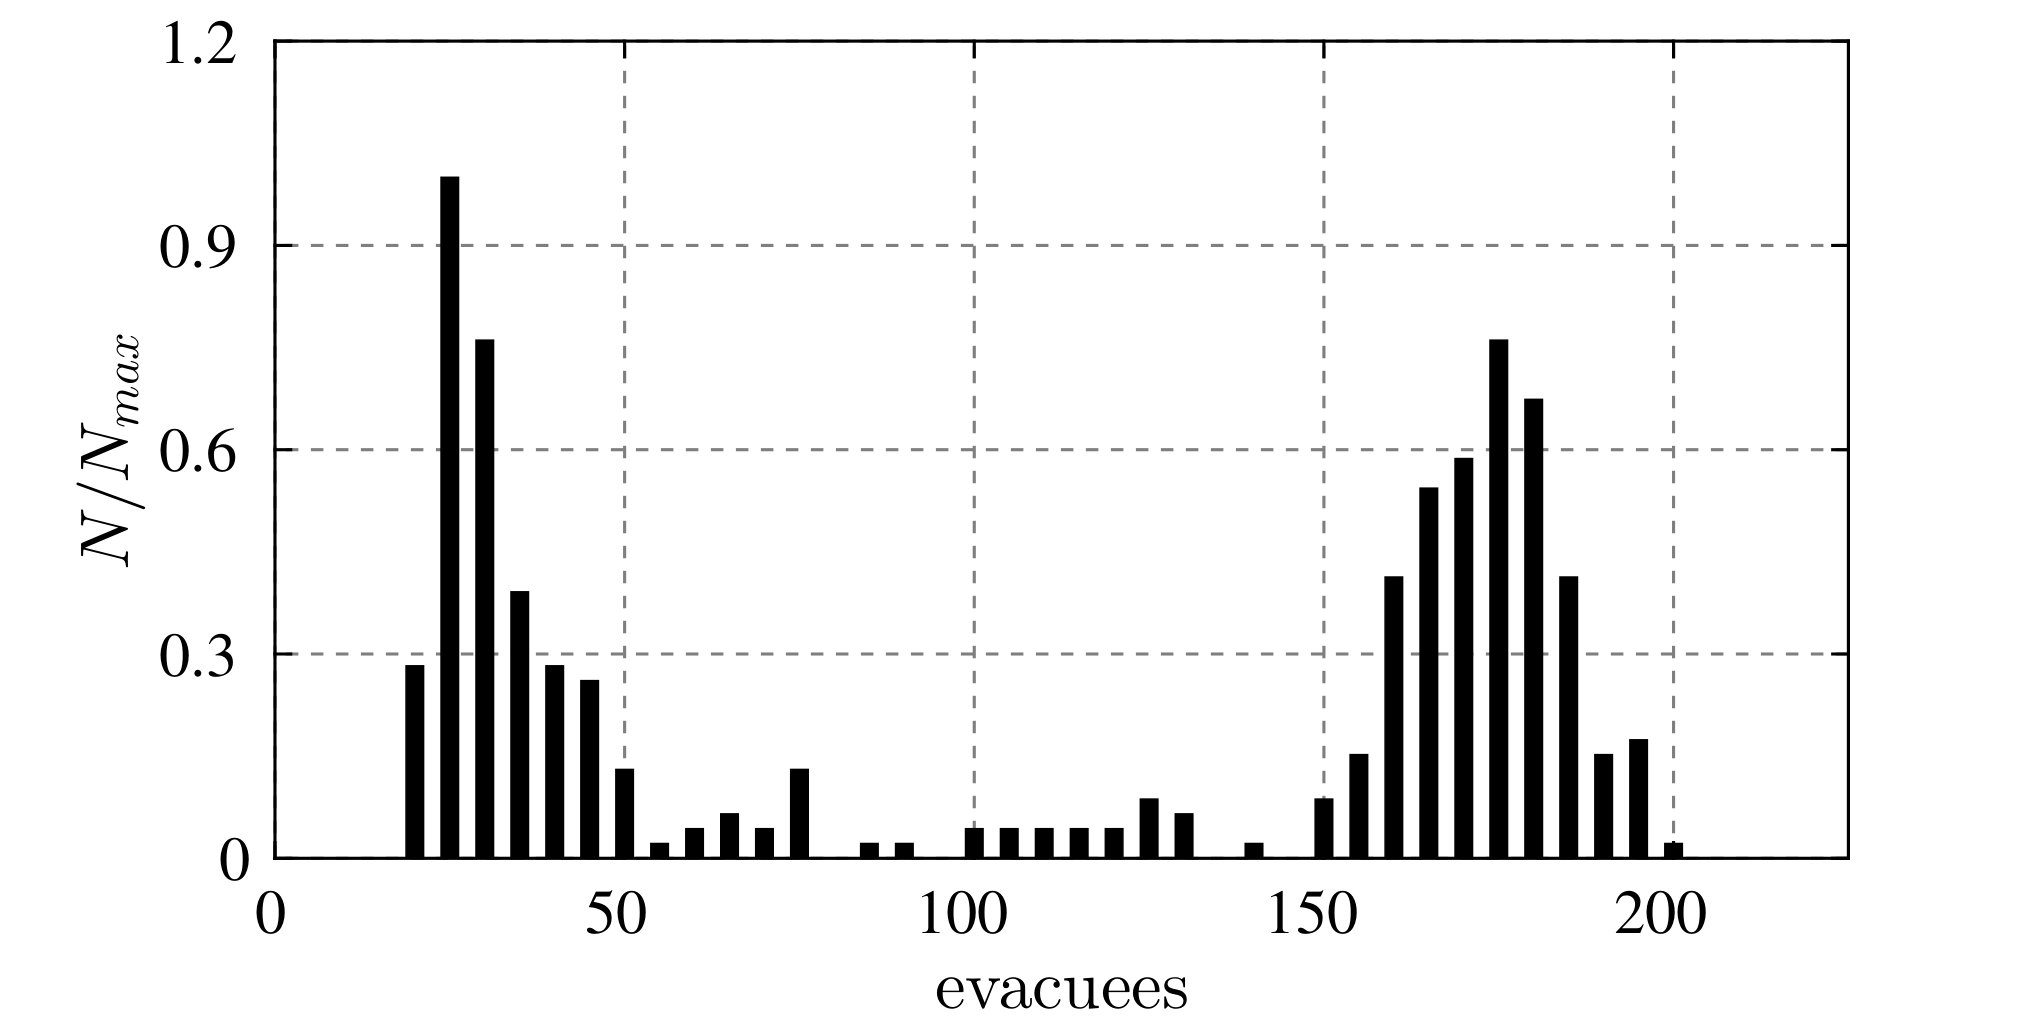 Figure 3
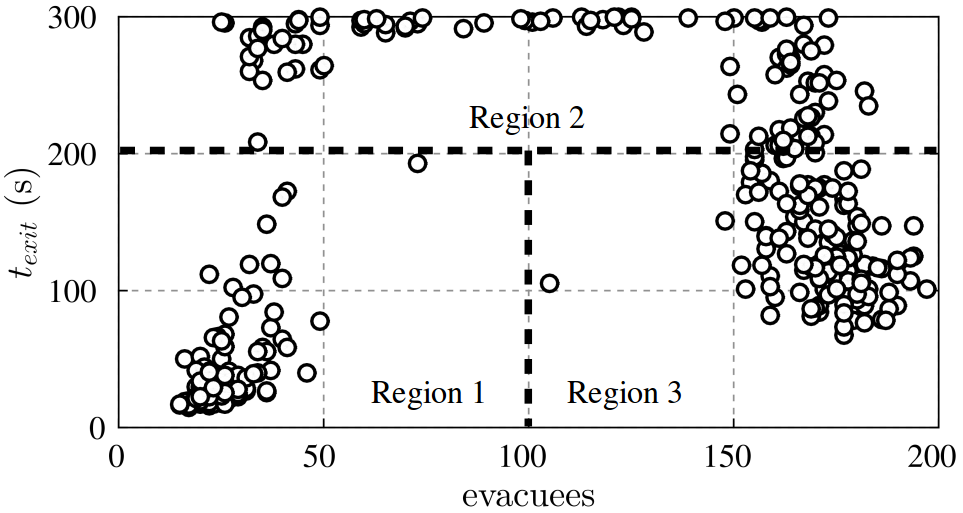 Figure 4
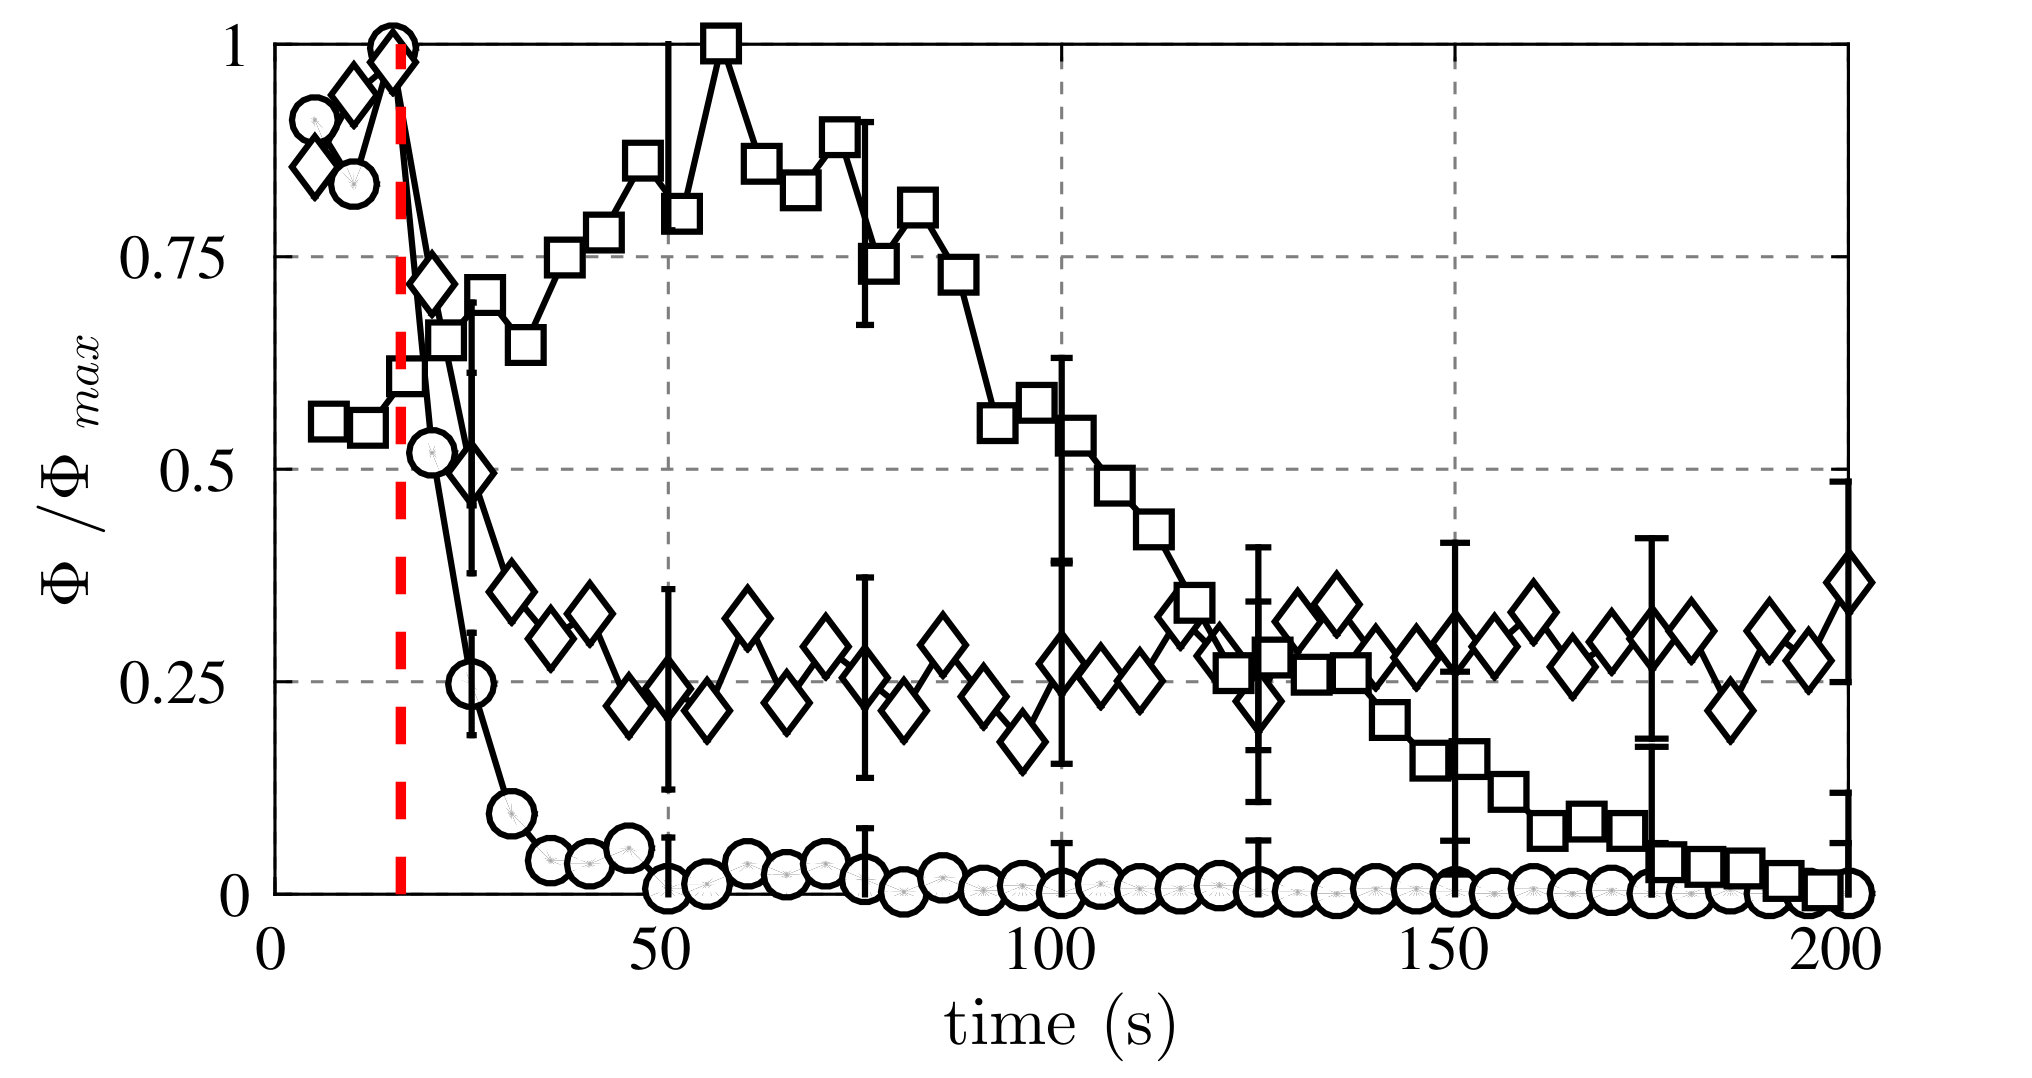 Figure 5
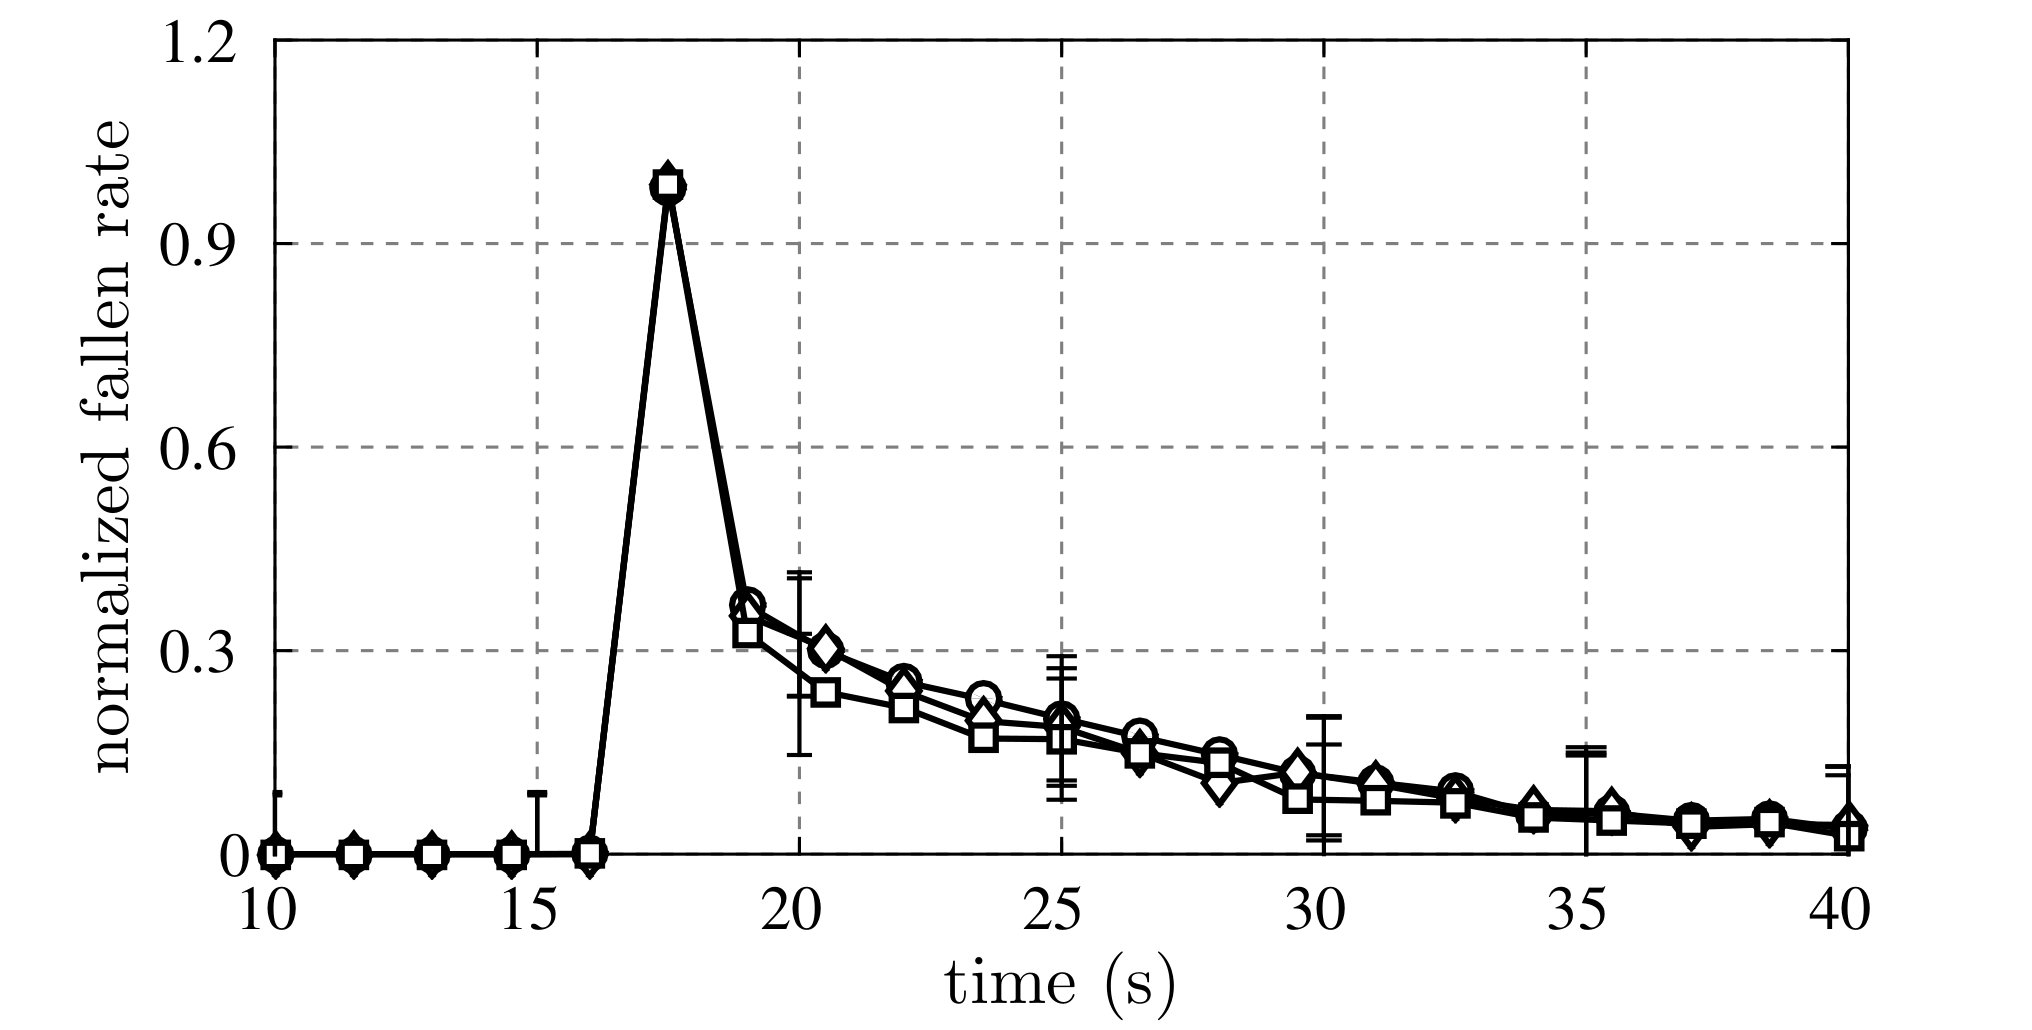 Figure 6
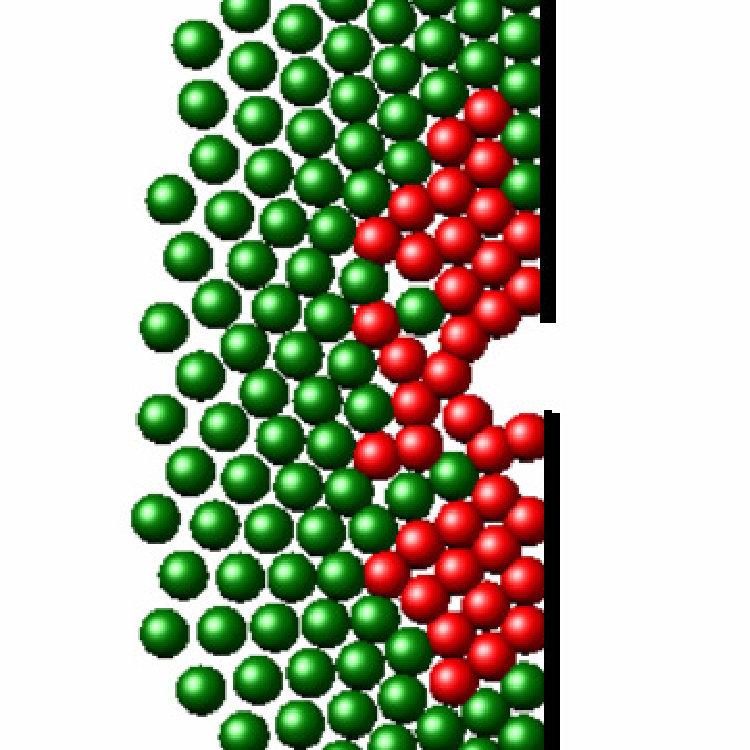 Figure 7
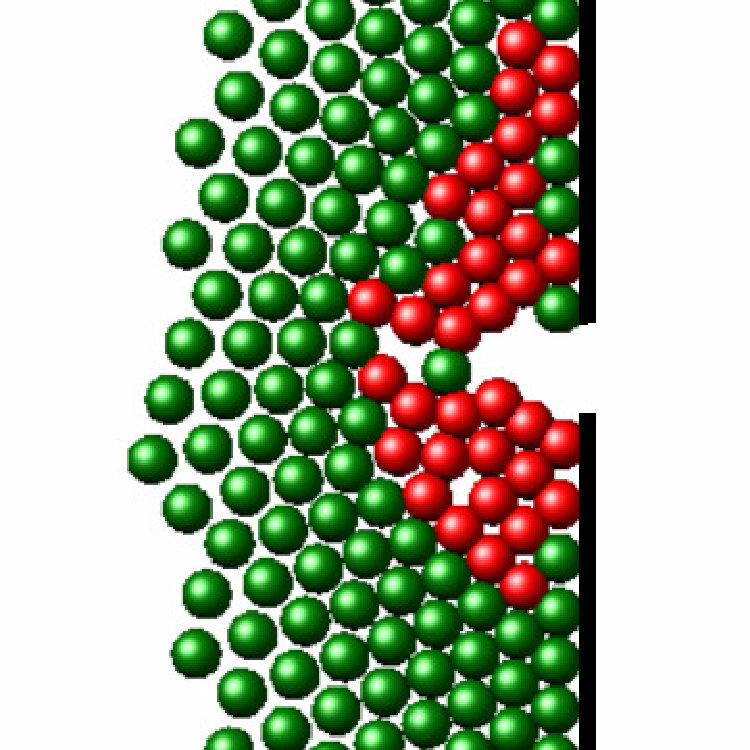 Figure 8
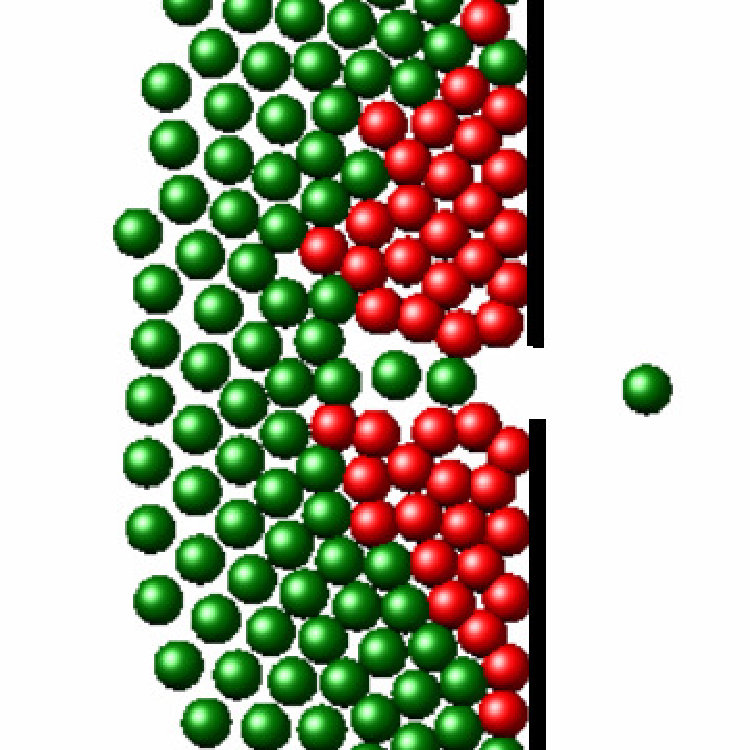 Figure 9
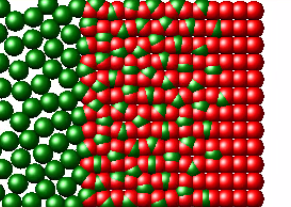 Figure 12
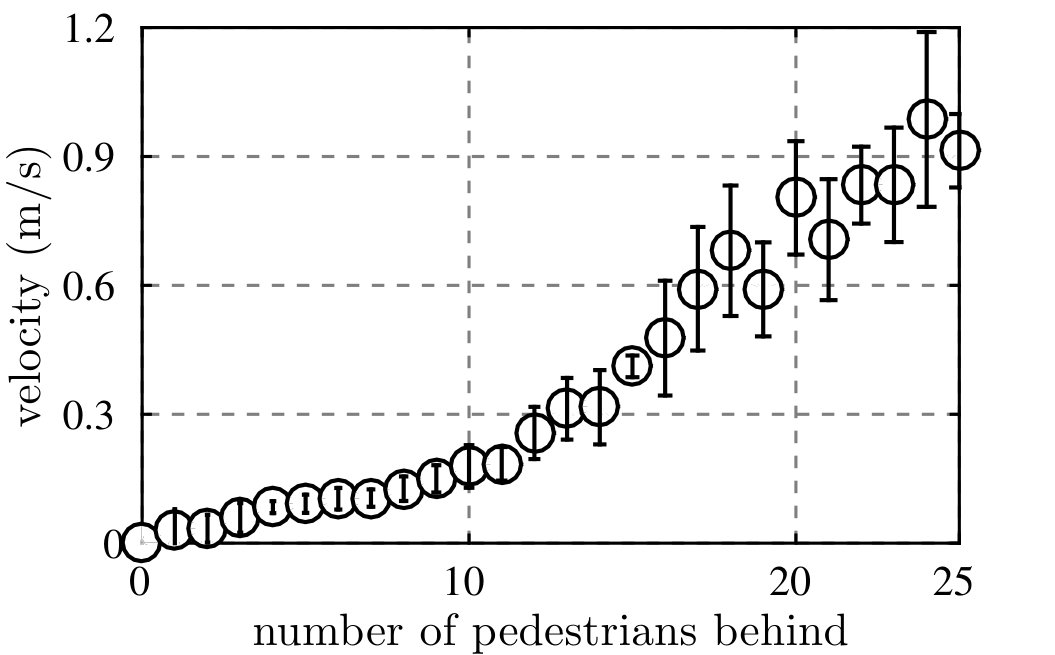 Figure 13
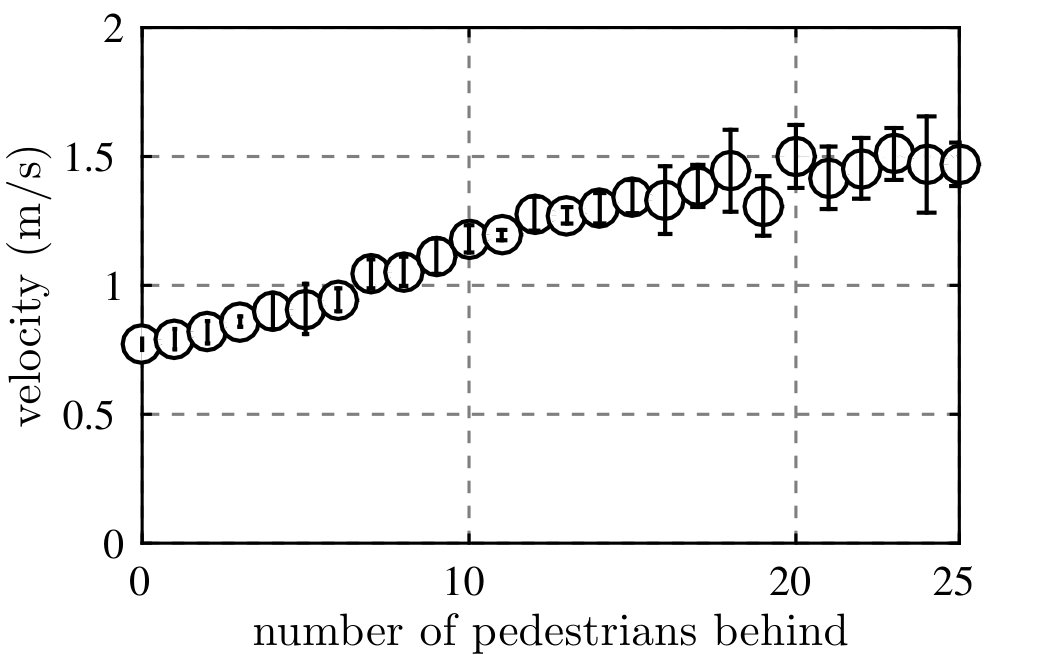 Figure 14
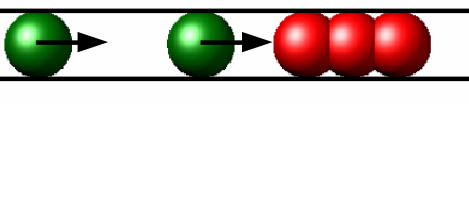 Figure 15
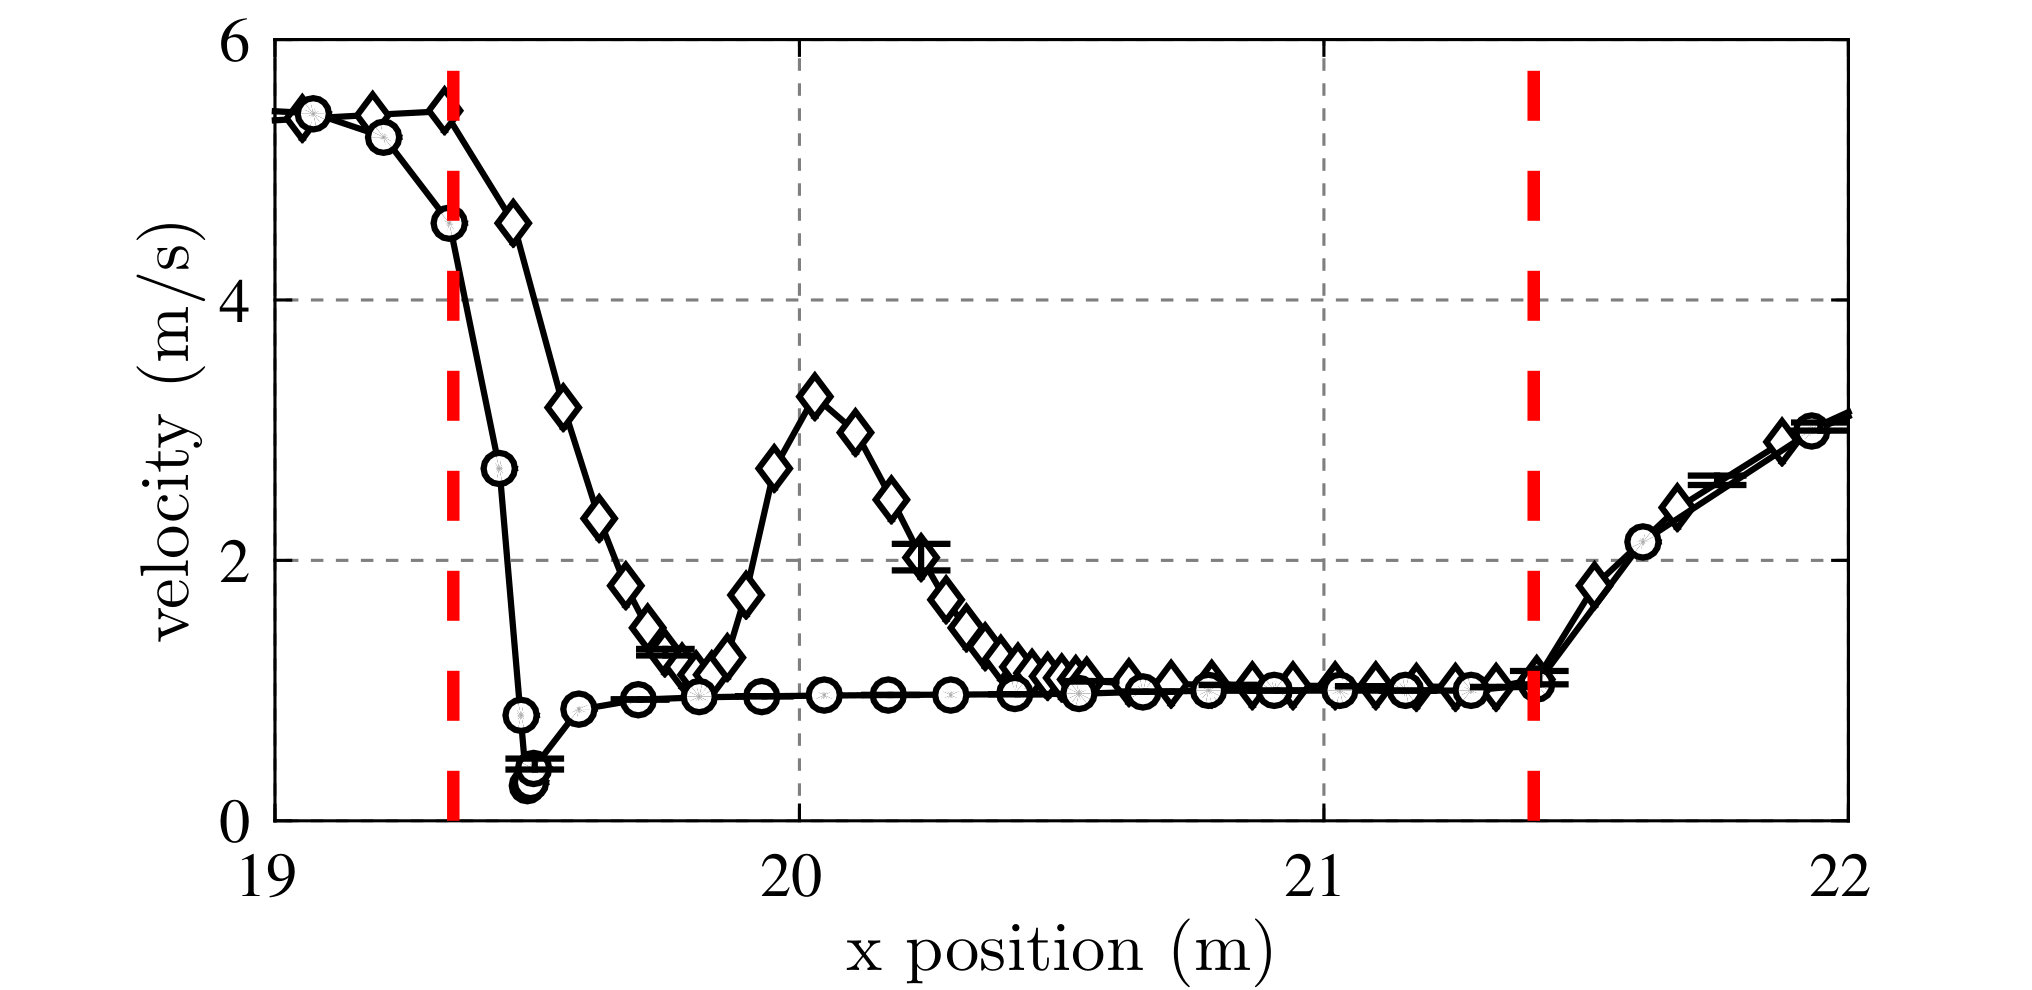 Figure 16
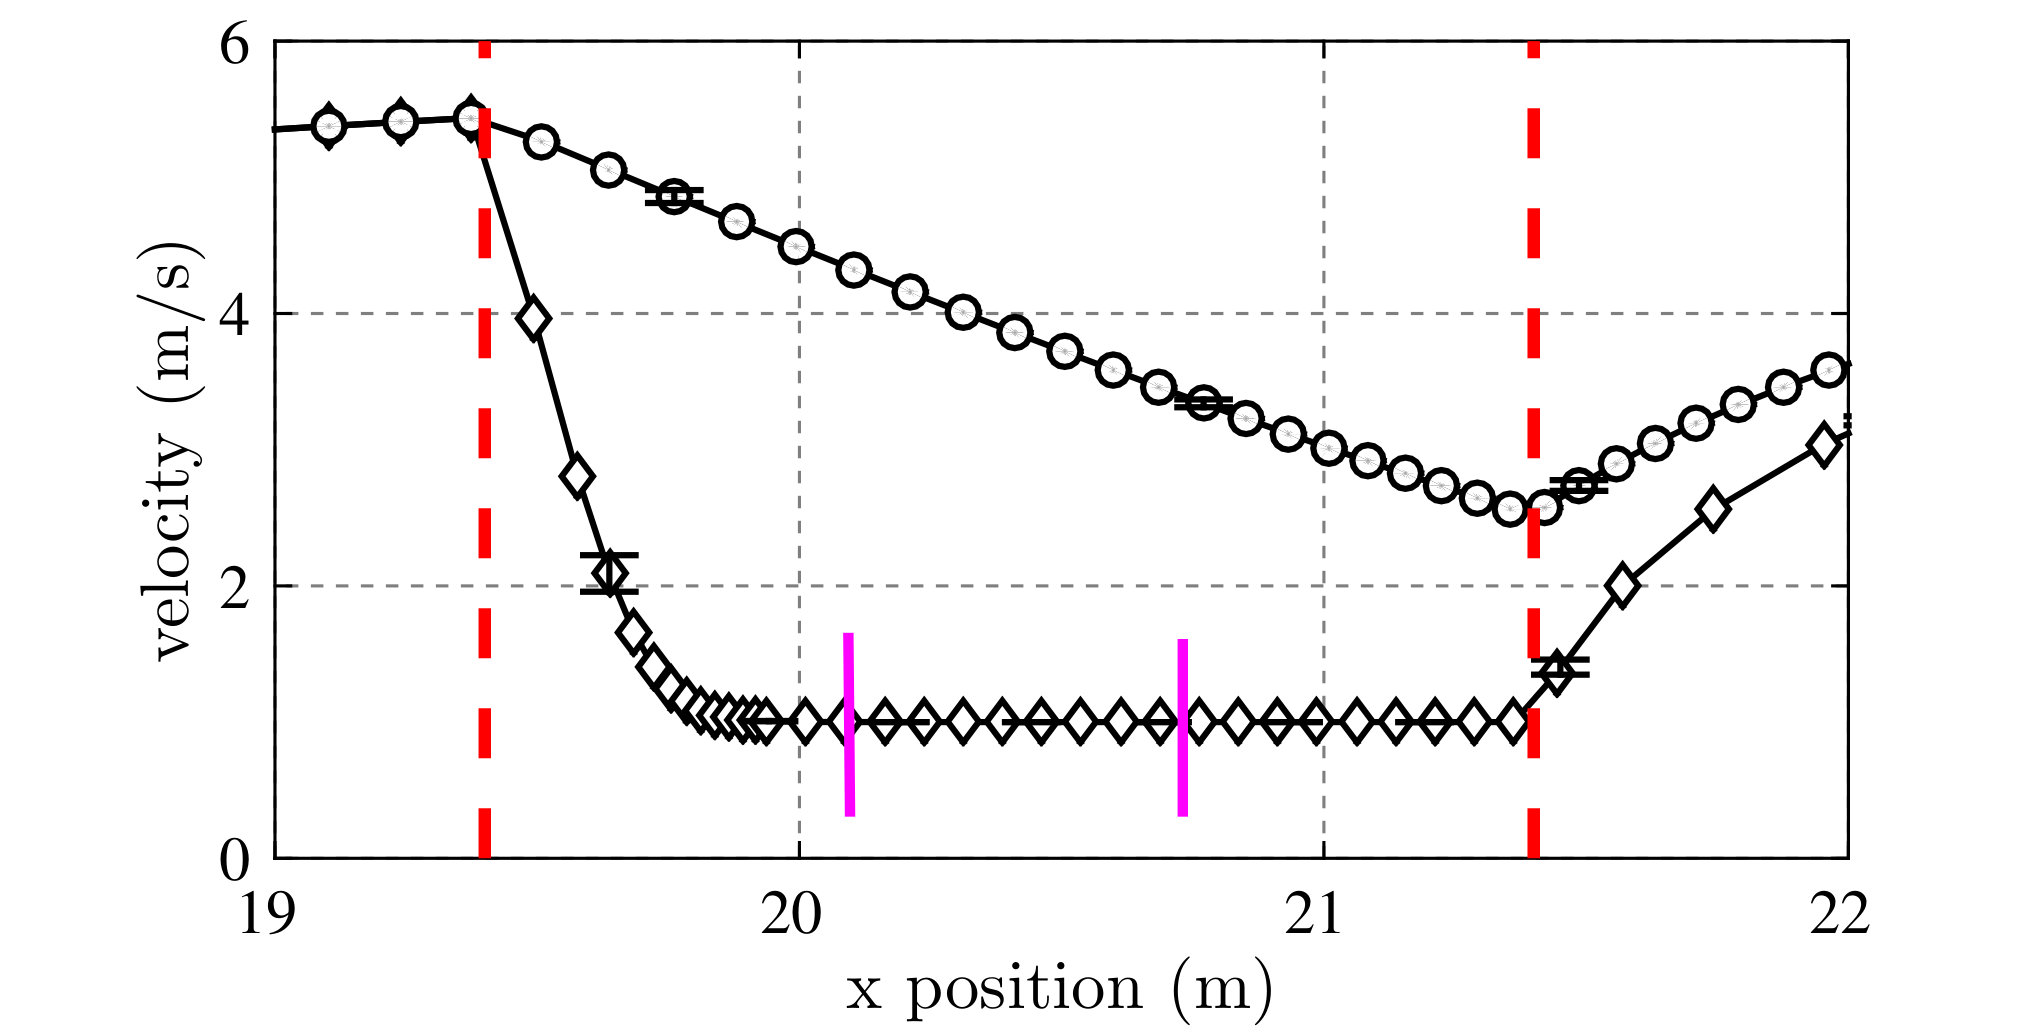 Figure 17
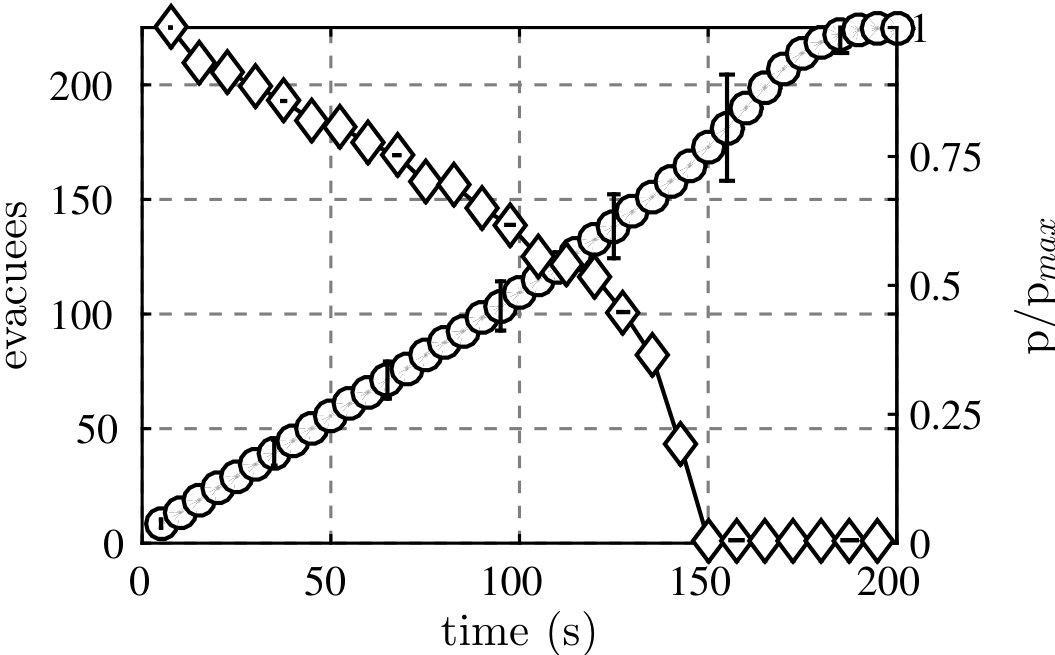 Figure 18
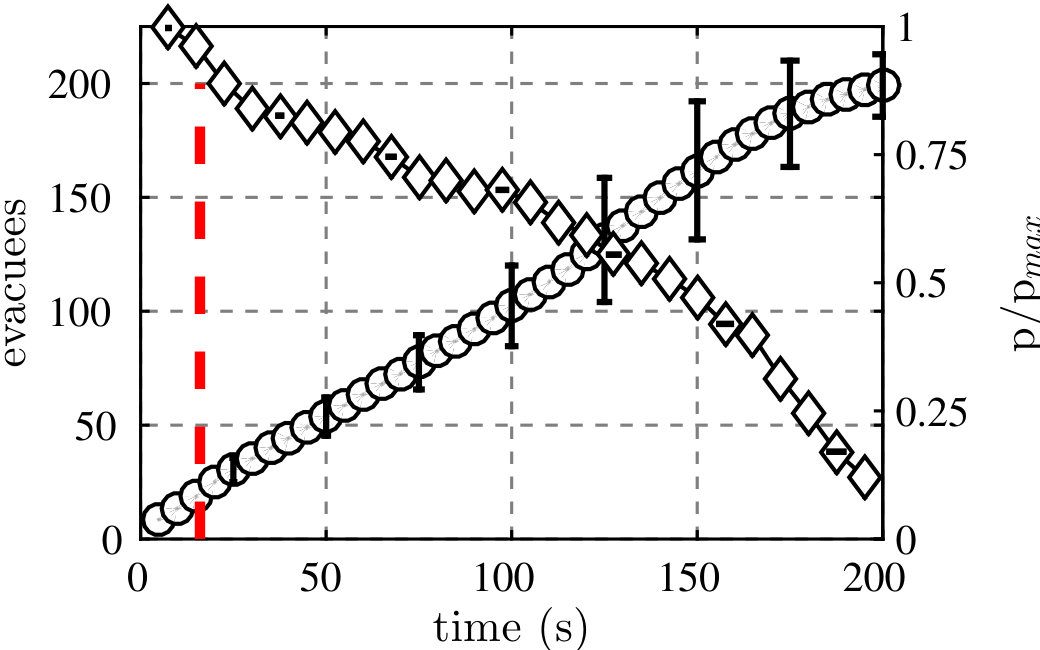 Figure 19
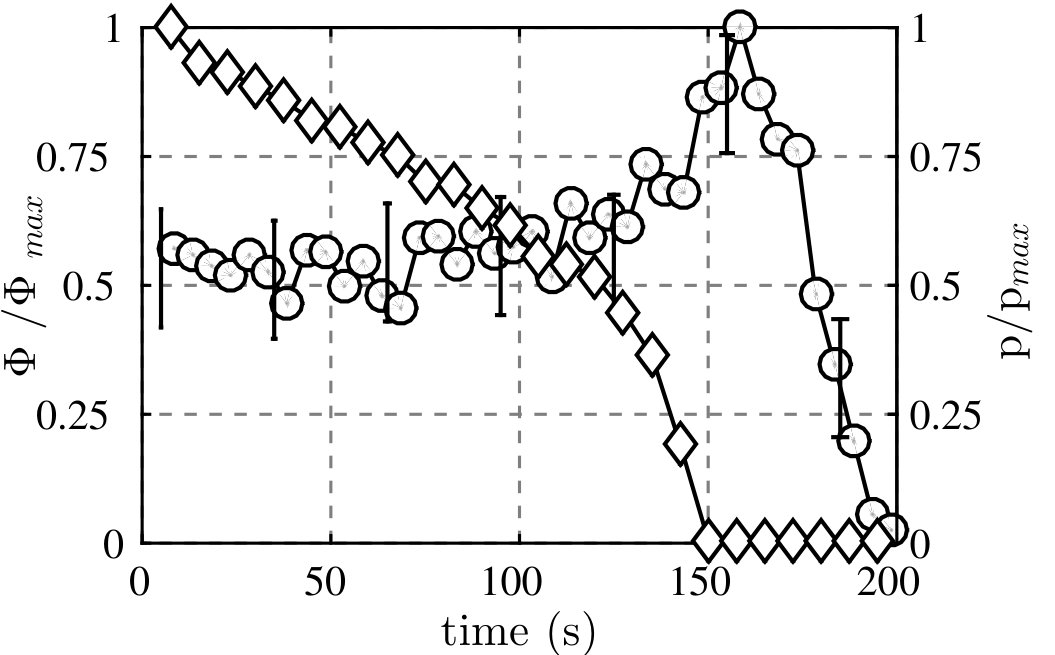 Figure 20
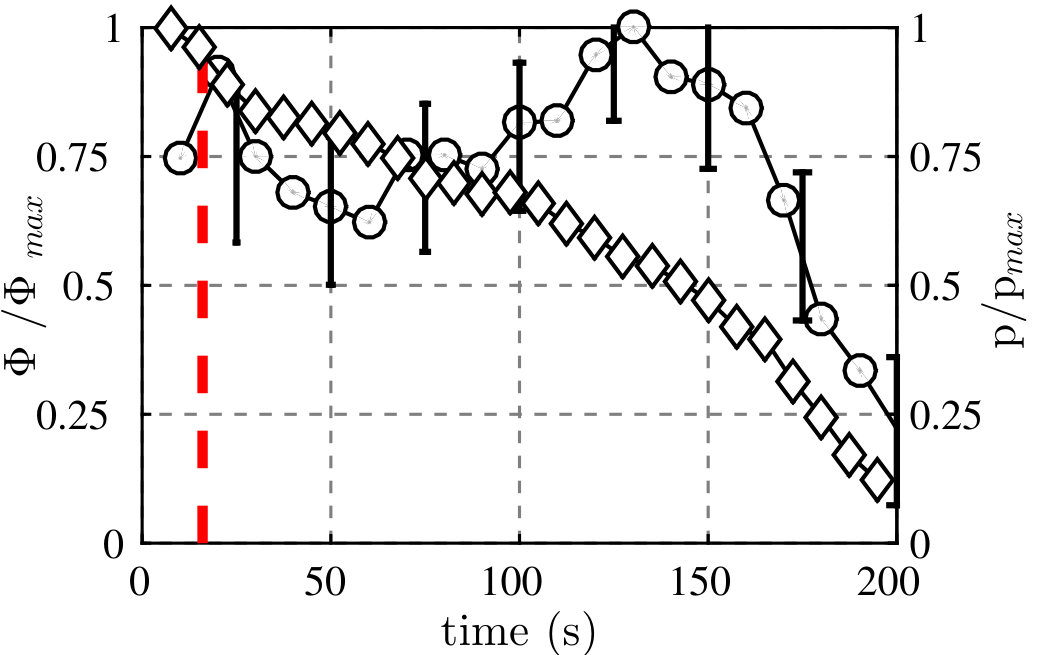 Figure 21
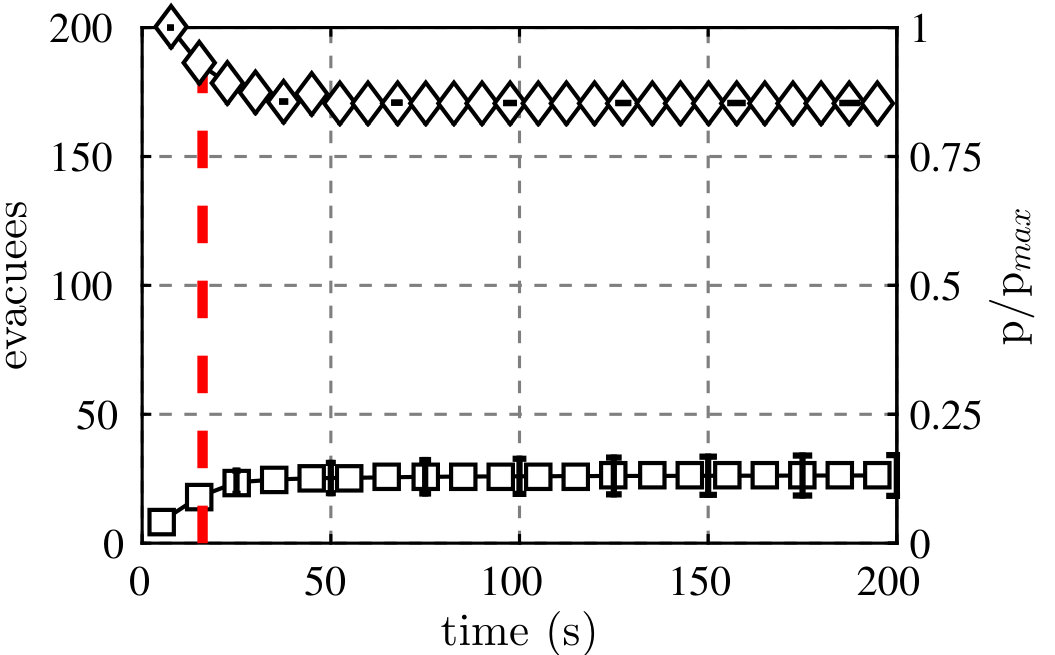 Figure 22
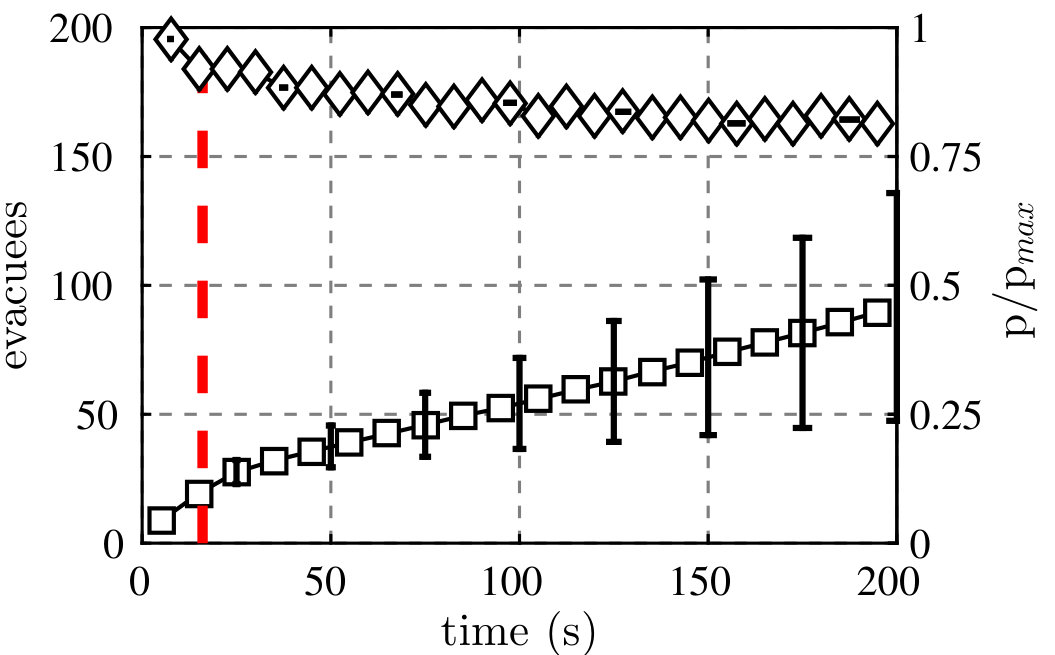 Figure 23
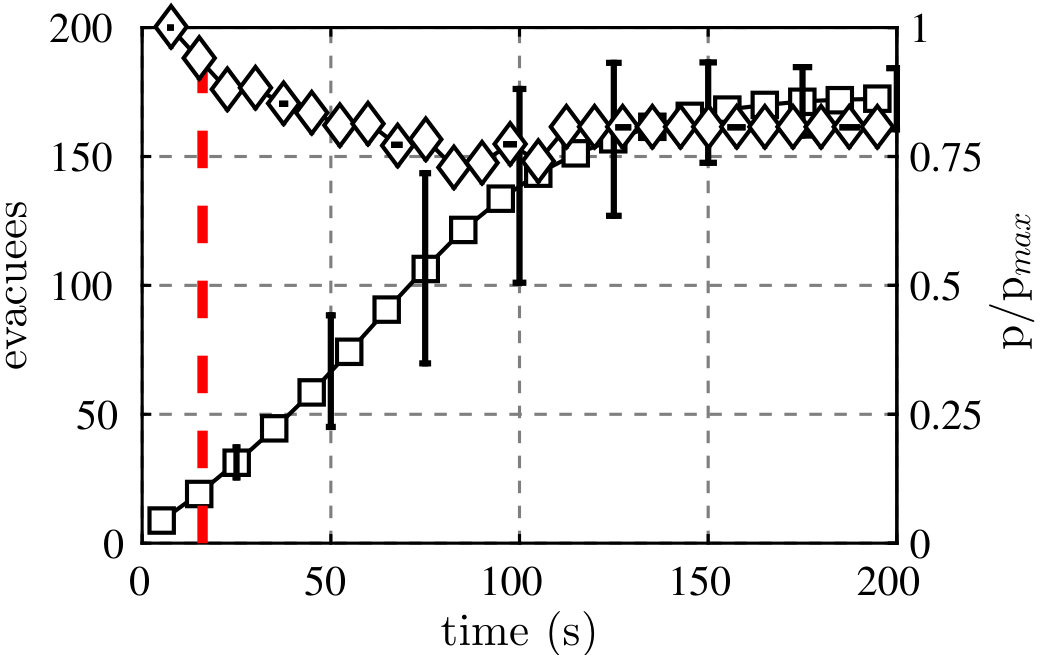 Figure 24
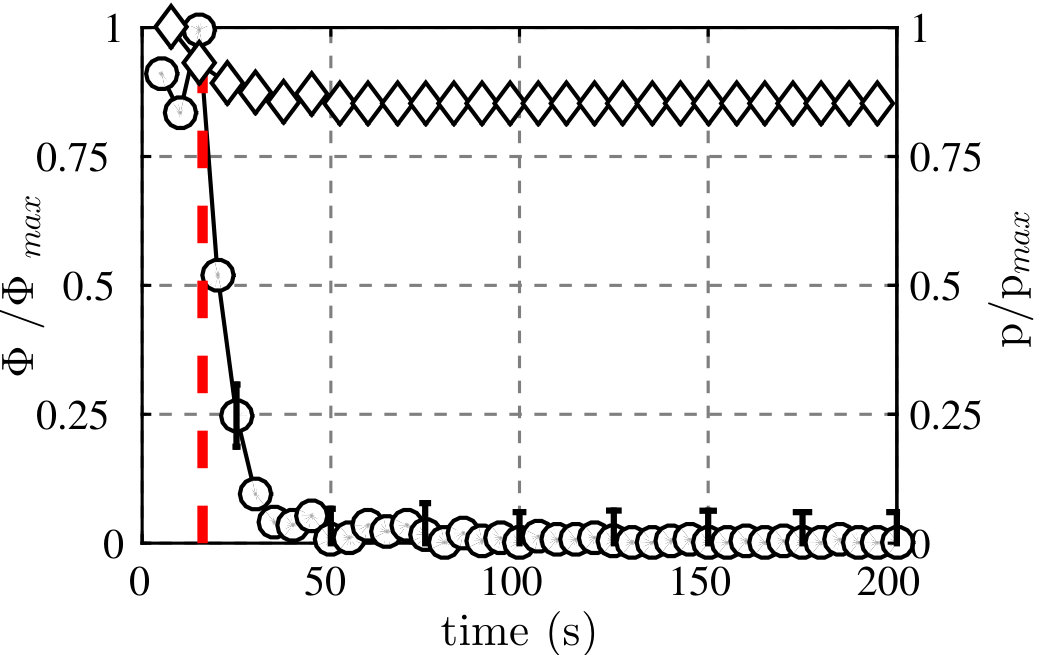 Figure 25
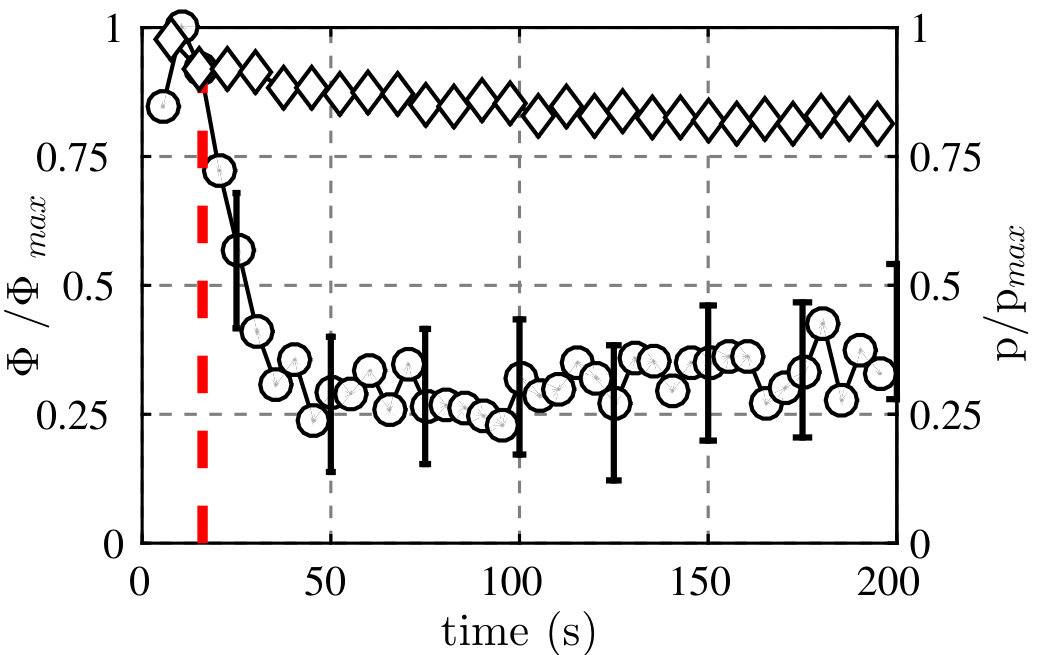 Figure 26
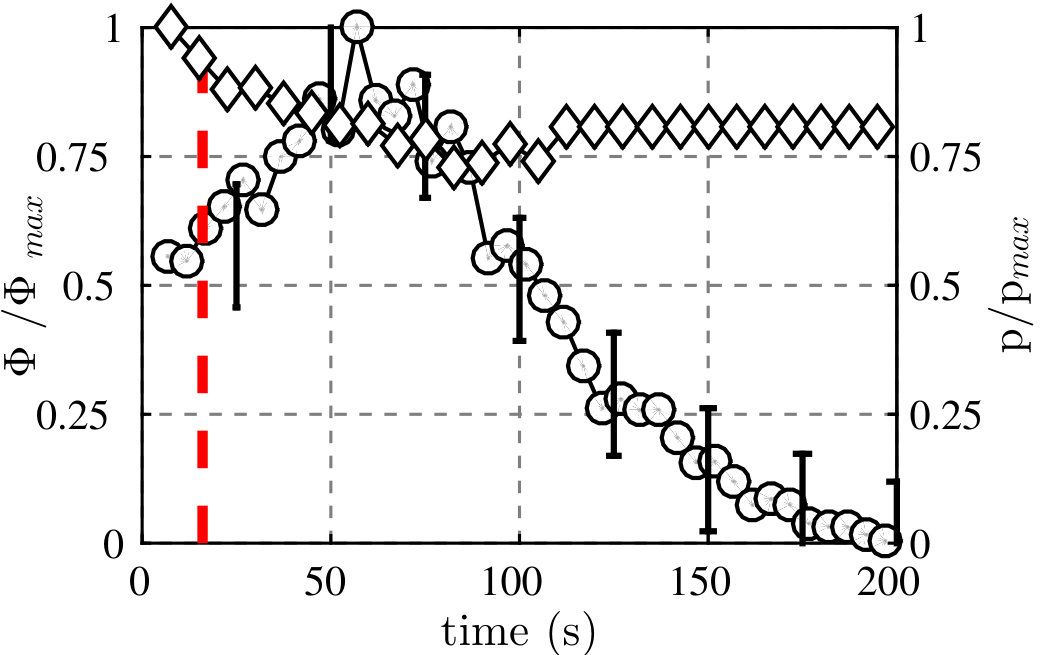 Figure 27
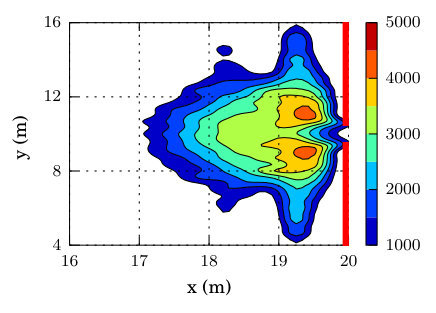 Figure 28
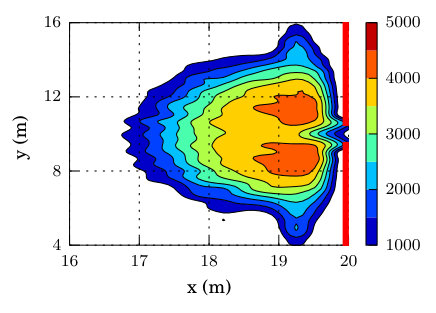 Figure 29
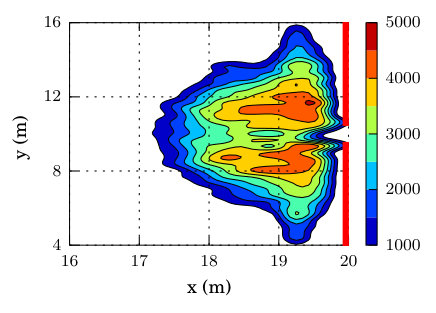 Figure 30
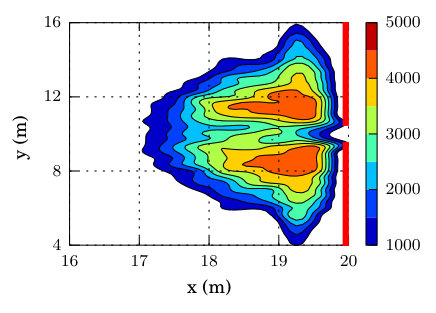 Figure 31
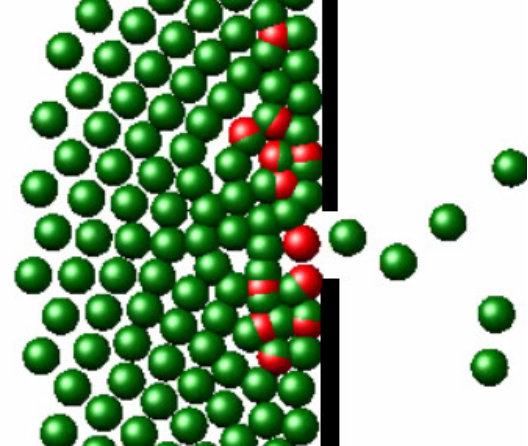 Figure 32
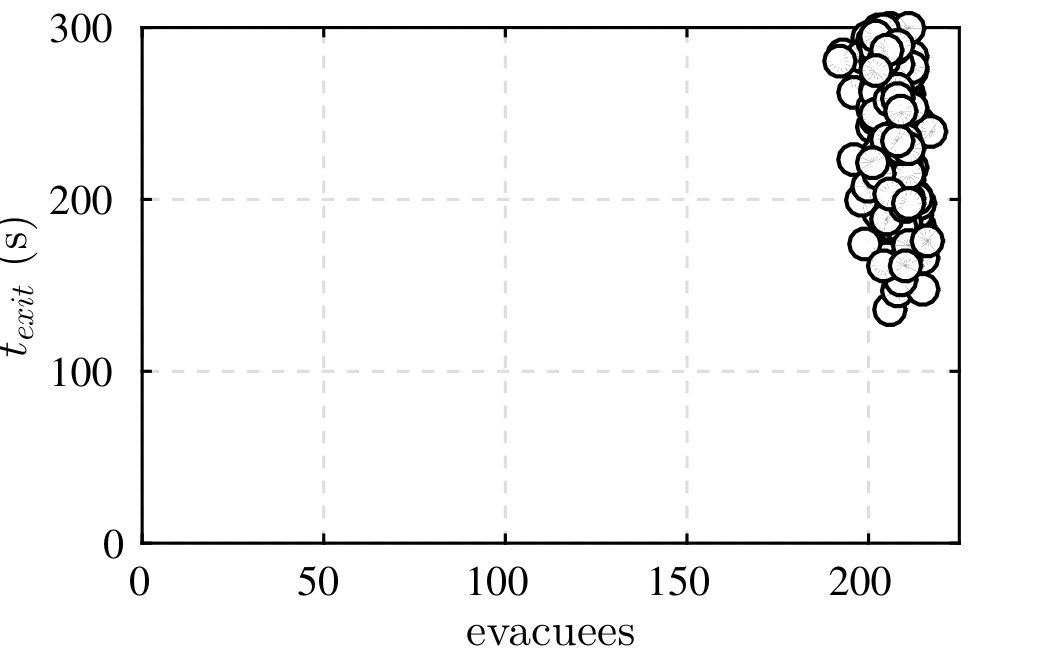 Figure 33
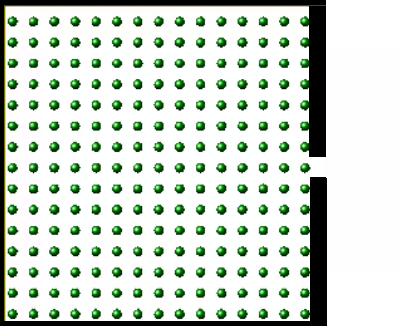 Figure 34
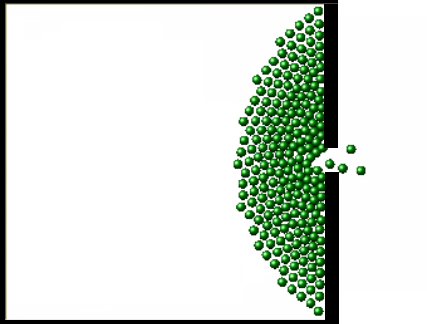 Figure 35
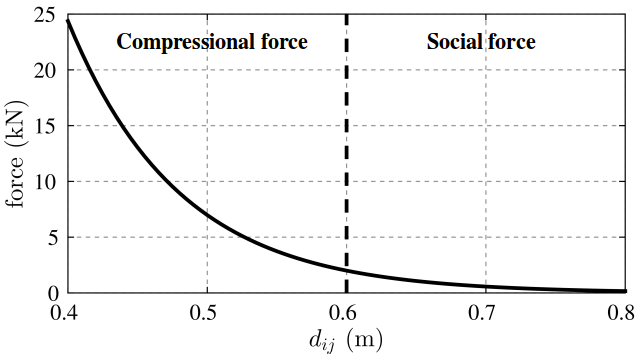 Figure 36
| Magnitude | Symbol | Value | Units | Refs. |
|---|---|---|---|---|
| Mean body surface | 1.750 | m2 | Tikuisis et al. (2001) | |
| Mean torso surface | 0.068 | m2 | Claire C. Gordon; Thomas Churchill; Charles E. Clauser; Bruce Bradtmiller; John T. McConville; Ilse Tebbetts and Robert A. Walker (1989); Huston (2009) | |
| Force tolerance threshold | 276-356 | N | Evans and Hayden (1971) | |
| Force death threshold | 6227 | N | I.H.G Hopkins and Sheppard (1993) | |
| Elastic coefficient on sternum | 13.1-21.9 | kN/m | Claire C. Gordon; Thomas Churchill; Charles E. Clauser; Bruce Bradtmiller; John T. McConville; Ilse Tebbetts and Robert A. Walker (1989) | |
| Elastic coefficient on thorax | 26.2 | kN/m | Claire C. Gordon; Thomas Churchill; Charles E. Clauser; Bruce Bradtmiller; John T. McConville; Ilse Tebbetts and Robert A. Walker (1989) |
Peer Reviews
No public reviews on file for this paper yet. If you reviewed it on a platform where reviews are public (OpenReview, ICLR, NeurIPS, ICML), you can paste yours below so the community can read it here.
Videos
No videos yet. Explain this paper in a talk, walkthrough, or lecture? Add one.
High pressures in room evacuation processes and a first
approach to the dynamics around unconscious pedestrians
F.E. Cornes
Departamento de Física, Facultad de Ciencias Exactas y Naturales, Universidad de Buenos Aires,
Pabellón I, Ciudad Universitaria, 1428 Buenos Aires, Argentina.
G.A. Frank
Unidad de Investigación y Desarrollo de las Ingenierías, Universidad Tecnológica Nacional, Facultad Regional Buenos Aires, Av. Medrano 951, 1179 Buenos Aires, Argentina.
C.O. Dorso
Departamento de Física, Facultad de Ciencias Exactas y Naturales, Universidad de Buenos Aires,
Instituto de Física de Buenos Aires, Pabellón I, Ciudad Universitaria, 1428 Buenos Aires, Argentina.
Abstract
Clogging raises as the principal phenomenon during many evacuation processes of pedestrians in a panic situation. As people push to escape from danger, compression forces may increase to harming levels. Many individuals might fall down, while others will try to dodge the fallen people, or, simply pass through them. We studied the dynamics of the crowd for these situations, in the context of the “social force model”. We modeled the unconscious (fallen) pedestrians as inanimate bodies that can be dodged (or not) by the surrounding individuals. We found that new morphological structures appear along the evacuating crowd. Under specific conditions, these structures may enhance the evacuation performance. The pedestrian’s willings for either dodging or passing through the unconscious individuals play a relevant role in the overall evacuation performance.
pacs:
45.70.Vn, 89.65.Lm
I Introduction
Recent investigation on panic evacuation has achieved a wide variety of scenarios and behavioural patterns Frank and Dorso (2015, 2016). But, to our knowledge, the research has not dug deeply enough into the consequences of injuries and unconsciousness.
History acknowledges many fatalities during stampedes. Unfortunately, such kind of disasters have increased in frequency because the number and size of massive events (music festivals, sports events, etc.) has become larger Fruin (1993). An inspection of the Crowdsafe DatabaseTM through 1992 to 2002 shows a correlation between the number of concerts and festival events, and the number of injuries cro (2003). Specially sorrowful are the incidents occurred in the nightclubs The Station (Rhode Island, 2003) and Cromañón (Buenos Aires, 2004) where 100 and 194 people lost their lives, respectively.
The overcrowding is one of the principal causes of injury or death while people try to escape under panic. Deaths may happen because of trampling or compression due to crush. The former occurs when someone falls in a high dense crowd, not being able to stand again due to the movement of the others, unaware of the fallen pedestrian. This produces a continue trampling that finally kills the individual Lee and Hughes (2006).
Compression due to crush is the other cause of death. This effect appears in high dense crowds, preventing the free movement of the pedestrians. If the pressures in the crowd become extremely high, each time an individual breaths out, the pressure restricts the inhalation of the next breath. Thus, compression due to crush causes asphyxia on the individual, evolving to unconsciousness or death after some time Gill and Landi (2004). Further information on fatal consequences by asphyxia can be found in Ref. Lee and Hughes (2006).
A brief review of the basic “social force model” can be found in Section II.1. We include in Section II.2 an upgrade of the basic model that makes possible to achieve compressional injuries.
In Section III we will present experimental data on the injury threshold due to compression. A simple model on the human torso will be examined for further simulations (see Section IV).
All the results of our investigations are presented in Section V. The corresponding conclusions are summarized in Section VI.
II Background
II.1 The Social Force Model
The “social force model” (SFM) proposed by Helbing and co-workers Helbing et al. is a generalized force model, including socio-psychological forces, as well as “physical” forces like friction. These forces enter the Newton equation as follows.
[TABLE]
where the subscripts correspond to any pedestrian in the crowd. means the current velocity of the pedestrian , while and are the socio-psychological forces acting on him (her). is the friction or granular force.
and are essentially different. The former corresponds to the “desire force”, that is, the pedestrians own willings to move towards a desired position. The latter corresponds to the “social force”, meaning the tendency of the pedestrians to preserve their private sphere. The “social force” prevents the pedestrians from getting too close to each other.
According to the anxiety state of the pedestrian, he (she) will accelerate (or decelerate) to reach any desired velocity that will make him (her) feel more comfortable. Thus, in the social force model, the desired force reads Helbing et al.
[TABLE]
where is the mass of the pedestrian and represents the relaxation time needed to reach his (her) desired velocity. is the unit vector pointing to the target position. For simplicity, we assume that remains constant during an evacuation process, but changes according to the current position of the pedestrian. Detailed values for and can be found in Refs. Helbing et al. ; Frank and Dorso (2011).
The private sphere preservation corresponds to a repulsive feeling between the pedestrians, or, between pedestrians and the walls Helbing et al. ; Helbing and Molnár (1995). These repulsive feelings become stronger as people get closer to each other (or to the walls). Thus, in the context of the social force model, this tendency is expressed as
[TABLE]
where represents any pedestrian-pedestrian pair, or pedestrian-wall pair. and are two fixed parameters (see Ref. Parisi and Dorso (2005)). The distance is the sum of the pedestrians radius, while is the distance between the center of mass of the pedestrians and . means the unit vector in the direction. For the case of repulsive feelings with the walls, corresponds to the shortest distance between the pedestrian and the wall, while Helbing et al. ; Helbing and Molnár (1995).
The granular force included in Eq. (1) corresponds to the sliding friction between pedestrians in contact, or, between pedestrians in contact with the walls. The expression for this force is
[TABLE]
where is a fixed parameter. The function is zero when its argument is negative (that is, ) and equals unity for any other case (Heaviside function). represents the difference between the tangential velocities of the sliding bodies (or between the individual and the walls).
II.2 Body compression in the Social Force
Model
Pedestrians that get in contact (or pedestrians that contact the walls) may experience some kind of body compression. The contacting force within the (basic) social force model is similar to Eq. (3), but for . While the private sphere preservation applies to repulsive feelings for , the compressional force corresponds to a contact phenomenon. That is, the social and compressional forces may be represented as two piecewise functions
[TABLE]
where is the Heaviside function. Thus, the social force and the compressional force share the same mathematical expression, despite that they have different meanings and apply to non-overlapping domains (see Fig. 1). Notice that the movement equation (1) needs no further modification because of this.
In order to capture the physical meaning of the compressional force , we expand the expression in (5) into powers of (within the domain ). The first order terms are as follows
[TABLE]
The first term on the right corresponds to the repulsive feelings at . The second term on the right resembles the Hooke law with elastic coefficient . This law applies to small body compressions. The third term on the right, however, resembles the stiffness for large compressions. According to literature values, the elastic coefficient is N/m (see Refs. Helbing et al. ; Frank and Dorso (2011)). In Section III we will show that this value is in agreement with experimental data for small body compressions.
II.3 The effective compressional force
We are interested in the forces causing body deformation in the front-back direction. This are actually the forces that may cause injury to the pedestrians. Therefore, we define the following “effective” compressional force
[TABLE]
where is the repulsive feeling at the contacting distance . The inner product produces the projection of the compressional force (excluding the repulsive feelings at ) in the front-back direction. The bars means the modulus of the magnitude. The sum does not include the walls, since we assume that the desired direction is tangential to the walls surface.
II.4 The local pressure on the pedestrians
The “social pressure” on a single pedestrian (say, ) is Helbing et al.
[TABLE]
The sum does not overlap, while it ensures continuity at . Recall that both forces point from any individual to the individual , and thus, the inner product is always positive.
Notice that Eq. (8) holds either if the pedestrians are in contact or not. The feelings for preserving the private sphere actuate as a “social pressure” that makes possible for the individuals to change their behavioural pattern when they come too close to each other or to the walls. The compressional force also changes the moving pattern of the pedestrian, if two pedestrians get in contact.
II.5 The pass through force
Pedestrians are capable of passing through other fallen individuals. This situation, however, can not be achieved by the basic “social force model” (SFM). According to Section II.1, repulsive feelings (i.e. the social force) actuate on neighboring pedestrians. Only the individual’s own desire (i.e. desire force) can balance these feelings because the granular force is actually orthogonal to the inter-pedestrian direction. Therefore, it might happen that, although the pedestrian wants to accelerate towards the target position, he (she) will get stuck because of repulsion.
The dynamics for passing through fallen individuals require further extensions of the basic SFM. The pedestrians who decide to pass through fallen people experience some kind of desire, regardless of their own private sphere preservation. Thus, the “passing through” process implies that the repulsive feelings (i.e. the social force) between the moving pedestrian and the fallen one do not play a role. The relevant force acting on the moving pedestrian during this process seems to be his (her) desire to “pass through” the fallen individual.
Recall that the desire force is related to the acceleration (deceleration) needed to reach any desired velocity . However, the pedestrians who pass through fallen individuals may experience additional moving difficulties that might change their desired velocity with respect to the free moving desired one. The “passing through” desired velocity is therefore not expected to be the same as . Actually, the acceleration (deceleration) time for the “passing through” process may be also different from the current relaxation time .
We postulate as a working hypothesis that a force actuates during the “passing through” process that is similar to the desire force . But, since this force corresponds to the willings of “passing through” a fallen pedestrian, instead of reaching the target position, its parameters should be different from those in Eq. (2). The “passing through” force is defined as follows
[TABLE]
Notice that shares the same mathematical expression as the desired force (Eq. 2). But, now, the desired velocity has been replaced by a “desired passing through” velocity , representing the slowing down with respect to due to the additional difficulties of the “passing through” context. Besides, the relaxation time has also been replaced by the relaxation time of the moving individual during the “passing through” process. The passing through direction , however, is the same as the desired velocity () since passing through fallen individuals can only take place if the latter is in the same path as the former.
Notice that and do not overlap in time. That is, the “passing through” force replaces the usual desired force whenever the moving pedestrian is in contact with the fallen pedestrian. This means that Eq. (1) needs no further modification.
II.6 Clustering structures
Clusterization is responsible for the time delays during an evacuation process, as explained in Refs. Parisi and Dorso (2005, 2007). Thus, a definition for the clustering structures appearing during an evacuation process is required. We define a human cluster as the group of pedestrians that for any member of the group (say, ) there exists at least another member belonging to the same group () in contact with the former. That is,
[TABLE]
where corresponds to any set of individuals.
One or more human clusters may be responsible for blocking the way out of the room. The minimum set of human clusters that are able to block the way out of the room will be called blocking clusters. If only one human cluster exists, we will call this blocking situation as a total blocking. If more than one human cluster exists simultaneously, we will call this situation a partial blocking.
III Experimental data
It was mentioned in Section I that compression due to crush may cause unconsciousness or death in an overcrowded environment. In a panic situation, where people push hard to get out, compression due to neighboring pedestrians can raise until certain injury limit. Although it is not possible to determine empirically this limit, a lower bound for the true injury level can still be established from the corresponding pain threshold. Additional data on compression from human cadavers or anesthetized animals is also available.
Table 1 resumes typical parameter values for the human body. Force thresholds were measured for quasi-static situations (that is, impact velocities less than 1 m/s). The elastic coefficients result from data fitting procedures into the (linear) Hooke’s law. For further details see Ref. Claire C. Gordon; Thomas Churchill; Charles E. Clauser; Bruce Bradtmiller; John T. McConville; Ilse Tebbetts and Robert A. Walker (1989).
Data shown in Table 1 focuses on the front-back direction. Body compression on the chest is, indeed, the relevant one since it restricts inhalation on each breathing cycle. Forces applied on the left-right sides of the body do not play an important role for human survivability (see Ref. Gill and Landi (2004)). Notice that the “effective” compressional force defined in Section II.3 resembles the chest compression only.
According to Table 1, the thorax seems to be somehow stiffer than the sternum. But, the upper bound for the sternum elastic coefficient is quite similar to the one for the thorax, and both are close to the estimation kN/m, obtained in Section II.2. Thus, the compressional force in Section II.2 is in agreement with the experimental data.
The forces and exhibited in Table 1 correspond to two different measurement conditions. The tolerance threshold represents the pain limit when pressure is applied during 1 s on the abdomen or sternum area. The death threshold represents the limit of fatality when pressure is applied during 15 s on the chest area. The total amount is less than since pain occurs at an early stage before injury. We choose the value as a suitable estimation for the falling pressure in our model. This pressure is approximately .
The ratio between the torso surface and the body surface is , according to Table 1. This is the fraction of the human body where the pressure limit of is applied to (during 15 s). We will assume that this fraction remains approximately valid, regardless of the volume representation of the body. That is, for any chosen body model (i.e. sphere, cylinder) enclosed by a surface , we will assume that the piece of surface corresponds to an “effective” torso surface. The compressional pressure is supposed to be applied on this area.
In order to link the experimental data shown in Table 1 to the model parameters, we associate the pressure limit to the “effective” compressional force defined in Section II.3. That is, we postulate that the “effective” force limit for reaching unconsciousness or fatality is roughly
[TABLE]
The surface needs to be specified for achieving a numerical value of . This value will be computed in Section IV.2.
IV Numerical simulations
IV.1 Boundary and initial conditions
We simulated the evacuation process of 225 pedestrians from a 20 m 20 m room with a single exit door. The door width was m, enough to allow up to two pedestrians to escape simultaneously.
The process started with all the pedestrians inside the room and equally separated in a square arrangement, as shown in the Fig. 2. The occupancy density was set to 0.6 people/m2, as suggested by healthy indoor environmental regulations Mysen et al. (2005). The pedestrians had random initial velocities computed from a Gaussian distribution (with null mean value). The rms value for the Gaussian distribution was close to 1 m/s.
The desired velocity was the same for all the individuals, meaning that all of them had the same anxiety level. At each time-step, however, the desired direction was updated, in order to point to the exit.
The evacuation processes began with all the pedestrians moving randomly, but willing to go to the exit. If certain conditions were met (see Section IV.2), any moving pedestrian could switch his (her) behaviour to the “fallen” pedestrian behaviour. Fallen pedestrians were those that remained at a fix position, that is, they did no longer move until the end of the evacuation process.
The evacuation processes were implemented on the Lammps molecular dynamics simulator Plimpton (1995). Lammps was set to run on multiple processors. The chosen time integration scheme was the velocity Verlet algorithm with a time step of s. Any other parameter was the same as in previous works (see Refs. Frank and Dorso (2015, 2011)).
We simulated between 30 and 360 processes for each evacuation situation (see figures caption for details). Data was recorded at time intervals of 0.05 s. The processes lasted for 300 s, but a few situations were also examined until 800 s (see Section V.1 for details). Only the evacuation processes shown in Section V.5 lasted until 100 individuals were able to leave the room.
The explored anxiety levels ranged from relaxed situations (1 m/s) to highly stressing ones (=8 m/s). Recall that the “faster is slower” effect occurs within this range.
IV.2 Moving and fallen pedestrians
We separated the pedestrians behavioural patterns into two categories: “moving” individuals and “fallen” individuals. The former are those that move according to Eq. (1). The latter are those that are not able to move at all until the end of the evacuation process. Moving pedestrians, however, can switch to the fallen category, but fallen pedestrians always remain in that category.
The condition for a moving pedestrian to switch to a fallen pedestrian’s behaviour is that the compressional pressure actuating on him (her) reaches the unconsciousness (or fatality) threshold for an uninterrupted time period of at least 15 s (see Section III). This threshold is expressed by Eq. (11). We simply modeled the pedestrian’s body as spheres of radius m (roughly, the neck-shoulder distance) and surface . Therefore, the compressional threshold, in our model, became N.
During the evacuation process simulation, we computed the “effective” force actuating on each moving pedestrian. This value was accumulated along time in a discrete variable as follows
[TABLE]
where was set to zero at the beginning of the process for each pedestrian . Notice that the value is reseted whenever the “effective” compresssional force vanishes, since the pedestrian’s breathing restrictions are supposed to be released. The condition for the moving pedestrian to become unconscious (i.e. “fallen” pedestrian) is that . Recall that the data recording was done every s, and thus, the threshold represents a time period of 15 s since .
Any meeting situation between a moving pedestrian and a fallen one was handled in two possible ways: the moving pedestrian dodged the fallen pedestrian (similar to an obstacle avoidance), or, the moving pedestrian passed through the fallen one. The dodging scenario is examined from Section V.1 to Section V.4, while the passing-through scenario is examined in Section V.5.
In the dodging scenario, the forces actuating on the moving pedestrian due to the fallen individual were similar to the forces actuating between two neighboring moving pedestrians. That is, the moving pedestrian experienced the same repulsive feelings and sliding friction as if the fallen individual belonged to the “moving” category. In the passing-through scenario, neither repulsive feelings nor friction (due to the fallen individual) were present on the moving pedestrian. But, as explained in Section II.5, the desired force was replaced by the “passing-through” force . The rest of the forces between moving pedestrians remained the same.
Recall that the “passing-through” scenario corresponds to a first approach on this kind of behavioral patterns. Therefore, we want to stress the fact that our model is as simple as we could imagine, in order to study the most basic effects out of the zero order approach of avoiding fallen pedestrians.
V Results
We divided our investigation into two different scenarios. From Sections V.1 to V.4 we examined those situations where the moving pedestrians were only able to dodge the fallen individuals. In Section V.5 we relaxed this restriction, while allowing the moving pedestrians to pass-through the fallen individuals. A new working hypothesis was introduced to achieve this behavioural pattern. Finally, in Section V.5 we compared the results obtained from these two main scenarios.
V.1 The outgoing flux at high pressure levels for the
dodging scenario
As a starting point, we examined the evacuees distribution for the first 300 s of the leaving process. All the individuals had a desired velocity of 6 m/s in order to achieve the “faster is slower” effect. This desired velocity also allowed many individuals to become unconscious (i.e. fallen individuals).
Fig. 3 shows the corresponding histogram for the evacuees distribution (see caption for details). As can be seen, the most probable number of evacuees lies within two separated intervals: the lower interval ranging between 0 and 50 evacuees, and the upper interval ranging between 150 and 200 evacuees. The intermediate interval in between, say, 50 to 150 evacuees is very unlikely.
The drawback for the evacuees distribution in Fig. 3 is that we get no information on whether the evacuation processes fail for the lower and intermediate intervals (that is, the exit gets blocked), or, if only a “slowing down” is present in any of these processes. The latter means that the time delays between two outgoing individuals are very large, and thus, the evacuation does not finish by 300 s.
In order to get a better understanding of the evacuation process, we recorded the time when the last pedestrian left the room before 300 s for each process. We also did this recording at 800 s (not shown) as a crosscheck. Fig. 4 shows the recorded time vs. the number of pedestrians that left the room for the 300 s case.
The data points in Fig. 4 show that the number of leaving pedestrians mostly lie in the lower and upper intervals, as exhibited in Fig. 3. But, the leaving time for the last pedestrian (before 300 s) does usually not exceed the 200 s. We can envisage some kind of correlation between the leaving time for the last individual (before 300 s) and the total number of evacuees.
Notice in Fig. 4 that is close to 300 s for the number of leaving pedestrians that lie between 50 and 150 individuals. The crosscheck with the recording at 800 s (not exhibited) shows that many of the data points that formerly lied in the 50 to 150 evacuee interval (see Fig. 4), actually move to the upper interval (beyond 150 evacuees). This means that the 50 to 150 evacuee interval corresponds to not completely finished processes, and consequently, to a “slowing down” in the evacuation.
Fig. 4 summarizes three qualitative situations. These are roughly separated by the dashed lines. The first situation (labeled as “region 1”) corresponds to those processes where a small fraction of the pedestrians are able to leave the room and the evacuation virtually ceases after 200 s. The second situation (labeled as “region 2”) corresponds to a “slowing down” in the evacuation process, with an uncertain ending time. The third situation (labeled as “region 3”) actually finished when almost all of the individuals (beyond 150) left the room.
The existence of three qualitatively different situations is a novel result. The fallen people seem to affect the evacuation performance in different ways if the surrounding pedestrians are only able to avoid them. Thus, we decided to deep into the fallen people behaviour for the further understanding of this new dynamic in the high pressure scenario (m/s).
Fig. 5 shows the (mean) number of fallen pedestrians per unit time along the evacuation process for each qualitative region. Clearly, the maximum rate of fallen pedestrians occurs at the beginning of the evacuation process, say, at approximately 20 s. This is in agreement with the fact that high pressures should be present for least for 15 s before the individual becomes unconscious (see Section III). Furthermore, Fig. 5 indicate that the pressure in the bulk surmounts the injury limit from the very beginning of the evacuation process. However, after the first 20 s, the rate of fallen individuals slows down, regardless of the locus where the process lies in Fig. 4. The qualitative different situations corresponding to the locus in Fig. 4 does not actually depend on the rate of unconsciousness. We also checked over that these situations do not depend on the total number of fallen individuals (roughly, 20 individuals in our simulations).
Besides the rate of fallen pedestrians, we analyzed the flow rate of surviving individuals. Fig. 6 exhibits the flow rate of the leaving pedestrians along time. Three data sets are shown, each one representing the mean flow value for each corresponding region in Fig. 4. A vertical dashed line (red in the on-line version) also represents the time when the maximum rate of fallen people occurs. Notice that the (mean) flow rate for the “region 3” processes is qualitatively different from the ones corresponding to the “region 1” and the “region 2” processes. The former has a positive slope until 50 s, while regions 1-2 have negative or null slopes. Therefore, the “region 3” processes manage to keep a high rate of people leaving the room, while the other two situations makes it harder (or even impossible) for the individuals to escape.
Fig. 6 also gives us a better understanding of Fig. 4 for the different behaviours between the “region 1” and “region 2” processes. Both situations have a diminishing flow rate, according to Fig. 6. But, the flow rate of the “region 2” processes is non-vanishing, although weak. The number of evacuees above 50 in “region 2” (see Fig. 4) can be explained by the weak flow rate beyond 50 s appearing in Fig. 6. This is in agreement with the mentioned uncertainty in the ending time for the “region 2” processes. On the contrary, the vanishing flow rate for the “region 1” processes means that the evacuation process finishes after a relatively short time period. Consequently, the expected is relatively low, as shown in Fig. 4.
A few conclusions can be outlined from the above analysis. For the dodging scenario (and high pressures) three situations appear to be possible. The first situation (i.e. “region 1” processes) occurs when the evacuation ceases in a short time period and a small fraction of the pedestrians are able to leave the room. The second situation (i.e. “region 2” processes) has a very similar performance as the first situation at the beginning of the process, but instead of ceasing after this time period, it “slows down”, like a “leaking” process. The “slow down” seems endless because the “leaking” delays the evacuation to very long time periods. The third situation (i.e. “region 3” processes) corresponds to high flow rates, allowing a large fraction of the pedestrians to leave the room.
Surprisingly, the rate of fallen pedestrians is actually not relevant for allowing one of the three situations. Thus, the spatial distribution of the fallen individuals should be analyzed next.
V.2 The social pressure for the dodging scenario
In Section V.1 we analyzed the rate of fallen individuals and the flow rate of the outgoing pedestrians. As a second step in the investigation, we studied the pressure patterns inside the bulk. We first computed the bulk mean social pressure due to the moving pedestrians (that is, excluding the fallen individuals), and then, we studied the spatial distribution of the pressure for all the individuals (including the fallen pedestrians).
Fig. 7 shows the mean social pressure of the moving pedestrians in the bulk along the evacuation process. The leaving flow rate and the total number of evacuees are also included for comparison reasons. The data sets are separated into the qualitative situations described in Section V.1 (i.e regions 1-3).
The mean social bulk pressure shown in Fig. 7 converges approximately to a fixed fraction of the maximum pressure value, regardless of the flow rate pattern and the amount of evacuees. This means that some individuals remain in the room at the end of the process, whatever the locus of this process in Fig. 4. We checked over this result by running some process animations (not shown) and we found that this asymptotic pressure corresponds to the pressure actuating on those individuals that actually get locked by fallen pedestrians.
We can see in Figs. 7a and 7c (and the corresponding Fig. 7b, 7d) that the pressure slope is always negative (or vanishing). However, it can be noticed that while the pressure settles at the same time as the flow rate in Fig. 7a, it does not in Fig. 7c. That is, the “region 2” processes represented in Fig. 7c continue loosing pressure during the constant flow rate interval (say, beyond 50 s). We can envisage here some kind of “slowly controlled” evacuation situation that is not present in the “region 1” processes. This means that the pressure reduction and the leaving flux are related in some way.
The pressure slope shown in Fig. 7e and Fig. 7f for the “region 3” processes is negative along the first 75 s (approximately). It slightly changes sign near 100 s, and immediately after, vanishes. Notice that this pressure pattern is qualitatively different from the ones shown in Figs. 7a and 7c. Here, the pressure lose occurs while the flow rate increases or remains almost unchanged (for a short period of time). But, while the pressure slope changes sign and vanishes, the flow rate decreases (see Fig. 7e beyond 100 s). We can not envisage a “slowly controlled” evacuation situation, as for the “region 2” situation. This suggests that the pedestrians might be leaving the room in a somehow different way.
We next examined the mean social pressure contour maps for the three main loci represented in Fig. 4. The contour maps are shown in Fig. 8. It also includes the situation where the pedestrians are not allowed to become unconscious (see Fig. 8d). Notice that the contour maps include the pressure actuating on all the crowd (that is, either the conscious and unconscious pedestrians).
The higher pressure zones in all the contour maps appear on the sides of the exit (see Fig. 8). But the “region 1” processes (Fig. 8a) exhibit a qualitative difference in the middle of the room with respect to the other processes (Fig. 8b and Fig. 8c). The former shows a widely spread high pressure area centered at the mid-path m. Instead, Fig. 8b and Fig. 8c show a low pressure path along m.
Recall that the flow rate vanishes for the “region 1” situation. Thus, Fig. 8a represents the pressure map when the pedestrians are not able to leave the room. Notice that this pressure map is opposed to the one shown in Fig. 8d where (all) non-unconscious pedestrians can manage to get out. This outgoing flow diminishes the bulk pressure, specially in the middle of the room (see Fig. 8d). See further details in Section V.5.
The low pressure mid-path appearing in Fig. 8b and Fig. 8c can be associated to the non-vanishing pedestrian flow rates for “region 2” and “region 3”, respectively. However, the “region 3” mid-path pattern resembles better the one with no unconscious pedestrians (see Fig. 8d). This fact suggests that the mid-path configuration is responsible for the performance differences between the “region 2” and the “region 3” situations.
The possible evacuation situations for the dodging scenario can be summarized as follows. The first situation (i.e. “region 1” processes) only allows the evacuation for a short time period after the rate of fallen pedestrians reaches a maximum. No low pressure paths remain open after the evacuation becomes frustrated. The low pressure paths only remain open (during long time periods) for the second and third situation (i.e. “region 2” and “region 3”, respectively). However, some connection appears to exist between the evacuation performance of each situation and the path configuration. The third situation resembles better the evacuation processes with no unconscious pedestrians.
V.3 The evacuation pathway for the dodging
scenario
Recall once again the process loci shown in Fig. 4. We examined separately the process animations for the three situations labeled as regions 1, 2 and 3. Fig. 9 shows four representative snapshots for these evacuation processes. The snapshots were recorded at 100 s, that is, at the stage where each situation can be differentiated easily.
Fig. 9a and Fig. 9b correspond to two representative snapshots for the “region 1” situation. The unconscious (fallen) pedestrians are blocking the exit in both pictures. However, only one blocking cluster appears in Fig. 9a, while two blocking clusters can be seen in Fig. 9b. These correspond to a total blocking situation and a partial blocking situation, respectively, as defined in Section II.6. No pathway exists at all for the moving pedestrians to leave the room, in agreement with the corresponding (mean) flow rate shown in Fig. 7a and the contour map shown in Fig. 8a.
Fig. 9c and Fig. 9d correspond to two representative snapshots for the “region 2” and “region 3” situations, respectively. Both situations exhibit an available pathway for the moving pedestrians to leave the room. This means that the outgoing flow is non-vanishing, as reported in Fig. 7c and Fig. 7e. Thus, the snapshots confirm that a mid-path configuration is actually responsible for allowing the individuals to leave the room. The difference between Fig. 9c and Fig. 9d corresponds, however, to the pathway width. This path is approximately one pedestrian width (0.6 m) for the “region 2” situation, while it appears wider for the “region 3” situation. The contour maps in Fig. 8b and Fig. 8c resemble quite accurately this difference.
It is immediate that the wider the leaving pathway, the better evacuation performance. But a close examination of the animations for the “region 2” situation shows that the pedestrians leave the room intermittently, following a stop-and-go behaviour. This is qualitatively different from the “region 3” situation, where more than one individual can leave the room almost simultaneously. The stop-and-go behaviour is responsible for the regular flow in Fig. 7c, resembling a “leaking-like” process. On the contrary, the “region 3” situation allows an increasing number of pedestrians to leave the room (see Fig. 7e), until no more unlocked pedestrians are available in the room.
The above analysis from the snapshots and animations (not shown) summarizes as follows. The pedestrians located on the sides of the door experience the higher pressure in the bulk, and thus, have the higher probability to become unconscious. The unconscious (fallen) pedestrians may or may not block the exit. If a partial or total blocking occurs (as defined in Section II.6), the outgoing flow immediately vanishes and the evacuation becomes frustrated. The “region 1” resembles this situation.
If the unconscious (fallen) pedestrians do not block the exit, the remaining pathway plays an important role. For narrow pathways (i.e. width close to 0.6 m), the overall evacuation slows down due to a stop-and-go dynamic along the pathway. For wider pathways, the individuals can manage to get out easily, and consequently, the evacuation process improves.
Notice that all the pedestrians are located in a square arrangement at the beginning of the process. The initial velocities are set to random (according to a Gaussian distribution). Thus, as a first thought, we might expect the three studied situations to be equally likely. In Section V.4 we will show that this is not actually the case.
V.4 The role of the desired velocity for the dodging
scenario
We examined the dodging scenario for the desired velocity m/s through Section V.1 to Section V.3. We now vary the desired velocity from 4.5 m/s to 8 m/s. For desired velocities below 4.5 m/s, no pedestrians become unconscious.
Fig. 10a shows the probability of attaining any of the three evacuation situations (i.e. regions 1, 2 or 3). We observe that the probability for the region 1 raises as the desired velocity increases, that is, as the individuals become more and more anxious. The region 3 processes decrease along the same interval of . But, the region 2 situation achieves a maximum at 6 m/s. Notice that the three situations are equally likely only at 6 m/s. This is a nice anxiety level for equally sampling all the possible situations.
It becomes clear from Fig. 10a that the desired velocity is somehow a control parameter for attaining any of the three possible situations. As the desired velocity is increased, the evacuation processes loci shown in Fig. 4 move from “region 3” to “region 1”, resembling a counterclockwise movement. However, this does not mean that “region 2” is an intermediate step between “region 3” and “region 1”. As mentioned in Section V.1, the probability of attaining “region 2” processes decreases as the simulation time increases.
The blocking configuration of the “region 1” situation also changes as the desired velocity increases. Fig. 10b shows the total and partial blocking probability as a function of the desired velocity. The total blocking probability becomes relevant beyond m/s with respect to the partial blocking probability. This means that all the moving pedestrians will be locked due to a barrier surrounding the exit (for our simulation conditions).
We conclude that the number of leaving pedestrians will depend on the desired velocity (i.e. anxiety level) of the individuals, according to our simulations (and for the current initial conditions). The desired velocity controls the probability of attaining any of the three possible situations, that is, the situations labeled as region 1, 2, or 3 (see Fig. 4).
V.5 The passing-through scenario
We now assume a different behavioural pattern for the moving pedestrians: they are able to pass-through unconscious (fallen) individuals in order to get out of the room. They no longer dodge the fallen pedestrians, since we assume that the passing-through is always possible, regardless of the additional difficulty that implies this new dynamic (see Section II.5 for details).
In A we isolated a few pedestrians and studied the passing-through dynamics for the theoretical situations of a single and multiple lanes. We estimated the passing-through velocity and the relaxation time following a specific criterion (see Section II.5 for details). Thus, A provides the parameters used in this Section.
Fig. 11a shows a snapshot of an evacuation process in the passing-through scenario. The overlapping individuals are actually the ones passing through unconscious (fallen) pedestrians. Recall from Section IV.2 that no repulsive feelings due to fallen pedestrians actuate on the passing-through individuals. In this context, the moving pedestrians can manage to get out, and thus, the evacuation process can be fulfilled (except for the unconscious people).
The processes loci for the passing-through scenario is shown in Fig. 11b for the desired velocity of m/s and the passing-through velocity of m/s. The null value of means that the passing-through individual experiences a moving difficulty such that his (her) willing vanishes. The passing-through pedestrian actually moves forward due to the individuals pushing from behind.
A quick comparison between Fig. 4 and Fig. 11b shows that switching from the dodging scenario to the passing-through one shifts the “region 1” and “region 2” loci to the “region 3” location. Therefore, we realize that the passing-through dynamic enhances the evacuation performance for those situations where dodging achieves a narrow pathway, or, some kind of blocking (i.e. total or partial).
Notice that the “region 1” situation becomes relevant for m/s, according to Fig. 10a. This means that the evacuation enhancement will not be significant below this range. The same can be said about the “region 2” situation.
Since the passing-through dynamics improve the evacuation processes, we asked ourselves for the differences between this scenario and the one with non-unconscious pedestrians. That is, we investigated how similar could both scenarios be. Fig. 12 exhibit the flow rates and mean pressures for both scenarios.
The pressure patterns in Fig. 12a and Fig. 12c correspond to the passing-through and non-unconscious scenarios, respectively. Both patterns look very similar for the first 100 s (roughly, the first half of the process), but somehow differentiate beyond this interval. The social pressure for the non-unconscious scenario decreases sharply until vanishing at 150 s. On the contrary, the passing-through scenario does not vanish, but diminishes to a lower level. This level corresponds to the pressure on the pedestrians that are not able to get out, since their passing-through velocity is null ().
The flow rate patterns represented in Fig. 12a and Fig. 12c are also quite similar. The (normalized) flow rate for the passing-through scenario appears higher than the one for the non-unconscious scenario because the former does not present a sharp maximum close to 150 s as the latter. This is in agreement with the vanishing pressure shown in Fig. 12c. That is, no individuals remain locked behind any unconscious pedestrian, and thus, pressure can be completely released.
We conclude from Fig. 12 that, although the passing-through and non-unconscious scenarios correspond to qualitatively different dynamics, the overall evacuation performance is quite similar for the null passing-through velocity (). The only noticeable difference corresponds to those individuals that can not manage to leave the room because of unconsciousness or null passing-through velocity .
We finally compared the overall performance for the different scenarios, as shown in Fig. 13. The evacuation time in Fig. 13 corresponds to the time interval until 100 individuals leave the room, in order to include the slow processes from the “region 2” situation. Notice that the unconscious (fallen) scenario data points lie beyond m/s since there are no fallen individuals for lower desired velocities.
According to Fig. 13, the “region 3” situation does not actually improve the evacuation with respect to the non-unconscious scenario for the first 100 pedestrians leaving the room. But, the passing-through dynamics improves the evacuation performance for increasing values of . Recall that regulates the difficulty experienced by the pedestrians passing through unconscious individuals. As increases, his (her) willing gets stronger because the degree of difficulty is supposed to diminish.
A brief summary for the evacuation performance in the two investigated contexts can be expressed as follows: the dodging scenario may worsen the evacuation performance with respect to the non-unconscious scenario, but, the passing-through scenario may improve the evacuation performance with respect to the same non-unconscious scenario. Both cases, the worsening or the enhancement, occur under certain conditions only. We were able to identify the desired velocity and the passing-through willing as two relevant control parameters for achieving this changes (for the setting mentioned in Section IV.1). The worsening becomes noticeable for desired velocity m/s. Besides, the enhancement becomes noticeable for passing-through willings m/s.
VI Conclusions
Our research focused on the high pressure scenarios during an emergency evacuation. Pressure is responsible for asphyxia and unconsciousness during the evacuation. People may fall, while others will further manage to escape. Two opposed scenarios are likely to happen: the moving pedestrians dodge the unconscious individuals, or, they manage to pass through them. In order to face these scenarios in the context of the “social force model”, we hypothesized that a “passing-through” force may be present or not, in order to attain either one scenario or the other. We stress that this is a first approach to the aforementioned scenarios.
According to our simulations, unconsciousness is more likely to occur on the sides of the exit. For this reason, the unconscious (fallen) individuals not always block the exit completely. We arrived to the unexpected conclusion that neither the number of unconscious (fallen) pedestrians nor the falling rate of these individuals are relevant for the probability of blocking the exit. This conclusion holds for a fixed desired velocity m/s.
We first focused on the dodging scenario. This scenario assumes that moving pedestrians always dodge the unconscious (fallen) individuals. As opposed to the “passing-through” scenario, the evacuation performance strongly depends on how the unconscious (fallen) individuals group into clusters. Our research was able to distinguish between those situations that block the exit, and the ones where a free pathway remains open. The pathway width was found to be relevant for the evacuation performance. Therefore, three situations were well established: the blocking (totally or partially) situation, the narrow pathway situation (roughly, one individual’s diameter) and the wide pathway situation. The overall performance of the dodging scenario depended on the probability of attaining any of these three possible situations.
We acknowledged that the evacuation process becomes interrupted after a short time period for the blocking situation. This is the worst situation, since many pedestrians get locked in the room because to the blocking clusters. On the contrary, if the grouping of unconscious (fallen) pedestrians allows a wide pathway to remain open, the dodging scenario does not show a significant worsening with respect to the lack of unconscious pedestrians.
The most interesting effect was captured for the narrow pathway situation. The moving pedestrians were only able to leave the room one after the other, in a stop-and-go process. This is a novel result and explains the significant slowing down that occurs for some processes in the dodging scenario.
Our investigation on the dodging scenario explored a wide range of desired velocities, that is, we varied the anxiety level of the pedestrians. We specifically examined the range . We concluded that the probability for the wide pathway situation was only relevant along the lower half of this range. Instead, the blocking situation became relevant for the upper half. The narrow path situation was relevant only around m/s. All these conclusions showed that the desired velocity (or anxiety level of the pedestrians) is a control parameter for attaining any of the three possible situations. This is valid for the fixed initial conditions detailed in Section IV.1.
We secondly focused on the “passing-through” scenario. Recall that we postulated the existence of a “passing-through” force in order to achieve a first approach to this scenario. In this context, the pedestrian that passes through a fallen individual overcomes any blocking, although the difficulties, since the other pedestrians pushing from behind makes him move forward. Therefore, the overall evacuation performance improves with respect to the dodging scenario. Our investigation shows, however, that the passing-through willings need to surpass certain threshold (say, m/s) for the improvement to become noticeable.
Acknowledgments
C.O. Dorso is a main researcher of the National Scientific and Technical Research Council (spanish: Consejo Nacional de Investigaciones Científicas y Técnicas - CONICET), Argentina. G.A. Frank is an assistant researcher of the CONICET, Argentina. F.E. Cornes has degree in Physics.
References
- Frank and Dorso (2015) G. A. Frank and C. O. Dorso, International Journal of Modern Physics C 26, 1550005 (2015).
- Frank and Dorso (2016) G. A. Frank and C. O. Dorso, International Journal of Modern Physics C 27, 1650091 (2016).
- Fruin (1993) J. Fruin, in Engineering for Crowd Safety, edited by R. Smith and J. Dickie (Elsevier Science Publishers BV, 1993) pp. 1–10.
- cro (2003) (2003), database maintained by Crowd Management Strategies.
- Lee and Hughes (2006) R. S. Lee and R. L. Hughes, Accident Analysis & Prevention 38, 712 (2006).
- Gill and Landi (2004) J. Gill and K. Landi, Am. J. Forensic Med. Pathol. 25, 358 (2004).
- (7) D. Helbing, I. Farkas, and T. Vicsek, Nature , 2000.
- Frank and Dorso (2011) G. Frank and C. Dorso, Physica A: Statistical Mechanics and its Applications 390, 2135 (2011).
- Helbing and Molnár (1995) D. Helbing and P. Molnár, Phys. Rev. E 51, 4282 (1995).
- Parisi and Dorso (2005) D. Parisi and C. Dorso, Physica A: Statistical Mechanics and its Applications 354, 606 (2005).
- Parisi and Dorso (2007) D. Parisi and C. Dorso, Physica A: Statistical Mechanics and its Applications 385, 343 (2007).
- Claire C. Gordon; Thomas Churchill; Charles E. Clauser; Bruce Bradtmiller; John T. McConville; Ilse Tebbetts and Robert A. Walker (1989) Claire C. Gordon; Thomas Churchill; Charles E. Clauser; Bruce Bradtmiller; John T. McConville; Ilse Tebbetts and Robert A. Walker, Anthropometric survey of U.S. army personnel: summary statistics interim report, Tech. Rep. (1989).
- Evans and Hayden (1971) E. Evans and F. Hayden, Tests on live subjects to determine the tolerable force that may be exerted by crowd control crush barriers, Tech. Rep. (University of Surrey, Department of Biomechanics, 1971).
- Tikuisis et al. (2001) P. Tikuisis, P. Meunier, and C. Jubenville, European Journal of Applied Physiology 85, 264 (2001).
- Huston (2009) R. L. Huston, Principles of biomechanics (CRC Press, Taylor & Francis Group, 6000 Broken Sound Parkway NW, Suite 300, 2009) boca Raton, FL 33487-2742.
- I.H.G Hopkins and Sheppard (1993) P. H. I.H.G Hopkins, S.J. Pountney and M. Sheppard, in Engineering for Crowd Safety, edited by R. Smith and J. Dickie (Elsevier Science Publishers BV, 1993) pp. 389–398.
- Mysen et al. (2005) M. Mysen, S. Berntsen, P. Nafstad, and P. G. Schild, Energy and Buildings 37, 1234 (2005).
- Plimpton (1995) S. Plimpton, Journal of Computational Physics 117, 1 (1995).
Appendix A Lanes of unconscious pedestrian
This appendix examines the behaviour of one or more lanes of pedestrians willing to pass through unconscious (fallen) individuals. The “passing-through” pedestrians move from left to right. The unconscious pedestrians are grouped in a compact cluster, located in the way of the “passing-through” pedestrians. Two situations follow: the single lane situation and the multiple lane situation.
A.1 The single lane situation
The most simple process that we can imagine corresponds to a single pedestrian passing through a small group of unconscious (fallen) individuals, as shown in Fig. 14a.
The “passing-through” pedestrian does not experience a social repulsive force due to the unconscious individuals, but the willing of passing through them . Thus, solving Eq. (1) for this process arrives to the expressions
[TABLE]
for the initial conditions and . The latter expresses that the pedestrian is moving freely before reaching the first unconscious (fallen) individual at position and time . Fig. 15 is a simulation of Eq. 13 for two different values of .
Notice from Fig. 15 that a passing-through relaxation time of s is too long for the pedestrian to reach the passing-through velocity within the distance of the first fallen individual (that is, m). But, shrinking the relaxation time value to roughly 10% accelerates the process, in order to reach within the expected distance. Thus, the value s is now meaningful, according to the definition given in Section II.5. Recall that this is a first approach for the passing-through dynamics.
The willing for passing through unconscious (fallen) pedestrians is regulated by the passing-through velocity . There is currently no experimental value for in the literature to our knowledge. But, represents a slowing down in due to the difficulties of the “passing-through” context (see Section II.5). We fixed m/s in Fig. 15 as a first example. Other possible values can be found in Section V.5.
We further included a second pedestrian passing through the lane, as shown in Fig. 14a. Both moving pedestrians pass through the unconscious individuals, one after the other. Fig. 16 exhibits their velocity profiles as a function of the position.
The velocity profile in Fig. 16 for the first pedestrian passing through the unconscious (fallen) individuals differs from the profile in Fig. 15. There is a maximum velocity immediately after the initial position of the lane (red line in Fig. 16). This maximum corresponds to the pushing effect of the pedestrian behind him (her). Thus, our model for passing through unconscious individuals succeeds in capturing the effect of “pushing from behind”. Furthermore, this pushing effect allows the moving pedestrians to pass through the unconscious individuals even though m/s. That is, if the passing-through pedestrian experiences a moving difficulty such that his (her) willing vanishes.
Notice in Fig. 16 that the second pedestrians slows down immediately after entering the unconscious zone. This is the counterpart effect of “pushing from behind”.
A.2 The multiple lane situation
We introduced a multiple lane situation in order to deep into the “pushing from behind” and the “slowing down” effects. As shown in Fig. 14b, an arrangement of unconscious (fallen) individuals was placed at the right of 135 moving pedestrians. The moving pedestrians had the desire to go to the right. We simulated two situations: the pedestrian’s passing-through velocity was null (m/s), or, the passing-through velocity was m/s. The former corresponds to pedestrians experiencing greater difficulties to surpass the unconscious individuals than the latter. Fig. 17 shows the mean velocity of the moving pedestrians as a function of the number of pushing people from behind (see caption for details).
Fig. 17a exhibits a null velocity if there are no other pushing pedestrians behind him (her). This is right, since the surpassing difficulties resembles a vanishing willing (m/s). But, as more people push from behind, his (mean) velocity increases. For 25 pushing pedestrians, the mean velocity is close to 1 m/s.
Fig. 17b exhibits a mean velocity below 1 m/s if there are no pedestrians pushing from behind. This is less than and corresponds to the “slowing down” due to the pedestrians in front of him (that is, at the right of his current position). Notice that the “slowing down” diminishes as more people push from behind. At some point, both effects (the “slowing down” and the “pushing”) balance and the mean velocity becomes similar to m/s. For 25 pushing pedestrians, the mean velocity of the passing-through individuals converges to 1.5 m/s. This value is in agreement with the measured velocity of the single individual in Fig. 16. That is, from Fig. 16 we can expect a mean value between 1 m/s and 2 m/s. It also confirms that the “slowing down” is no longer relevant when 25 individuals push from behind.
The reference list from the paper itself. Each links out to its DOI / PubMed record.
- 1Frank and Dorso (2015) G. A. Frank and C. O. Dorso, International Journal of Modern Physics C 26 , 1550005 (2015) . · doi ↗
- 2Frank and Dorso (2016) G. A. Frank and C. O. Dorso, International Journal of Modern Physics C 27 , 1650091 (2016) . · doi ↗
- 3Fruin (1993) J. Fruin, in Engineering for Crowd Safety , edited by R. Smith and J. Dickie (Elsevier Science Publishers BV, 1993) pp. 1–10.
- 4cro (2003) (2003), database maintained by Crowd Management Strategies.
- 5Lee and Hughes (2006) R. S. Lee and R. L. Hughes, Accident Analysis & Prevention 38 , 712 (2006).
- 6Gill and Landi (2004) J. Gill and K. Landi, Am. J. Forensic Med. Pathol. 25 , 358 (2004).
- 7(7) D. Helbing, I. Farkas, and T. Vicsek, Nature , 2000.
- 8Frank and Dorso (2011) G. Frank and C. Dorso, Physica A: Statistical Mechanics and its Applications 390 , 2135 (2011).