Measurement of the cross section for inclusive isolated-photon production in $pp$ collisions at $\sqrt s=13$ TeV using the ATLAS detector
ATLAS Collaboration

TL;DR
This paper measures the production rate of isolated photons in proton-proton collisions at 13 TeV using ATLAS, comparing results with theoretical predictions to test quantum chromodynamics models.
Contribution
First measurement of inclusive isolated-photon cross sections at 13 TeV with detailed comparison to NLO QCD and Monte Carlo predictions.
Findings
NLO QCD and Monte Carlo models adequately describe the data.
Photon cross sections measured as a function of transverse energy and pseudorapidity.
Results provide constraints for theoretical models of photon production.
Abstract
Inclusive isolated-photon production in collisions at a centre-of-mass energy of 13 TeV is studied with the ATLAS detector at the LHC using a data set with an integrated luminosity of 3.2 fb. The cross section is measured as a function of the photon transverse energy above 125 GeV in different regions of photon pseudorapidity. Next-to-leading-order perturbative QCD and Monte Carlo event-generator predictions are compared to the cross-section measurements and provide an adequate description of the data.
Click any figure to enlarge with its caption.
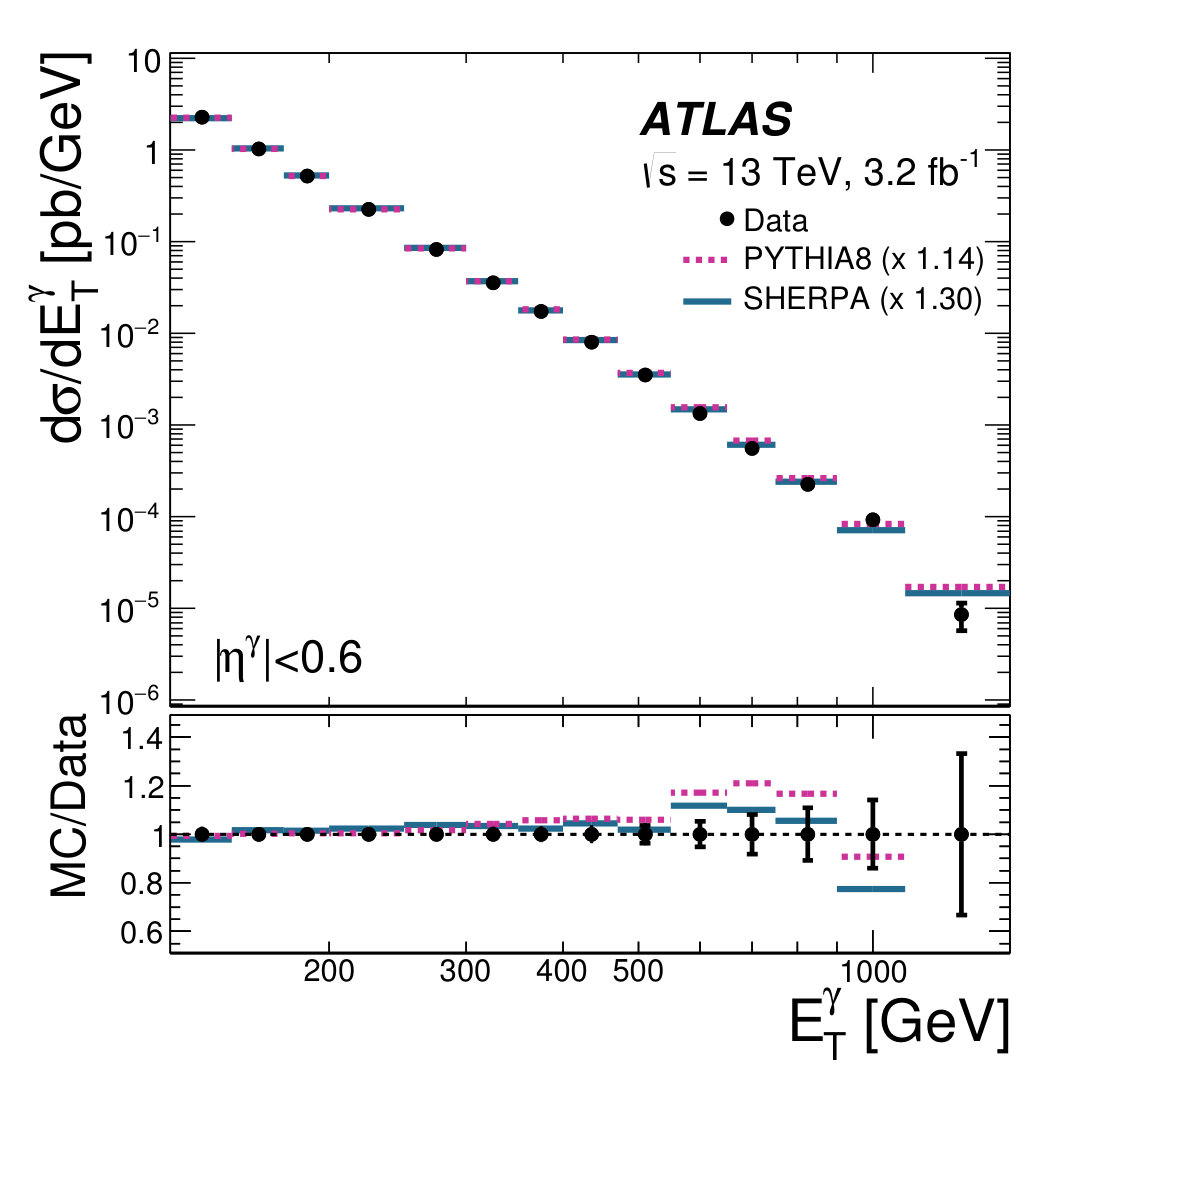 Figure 1
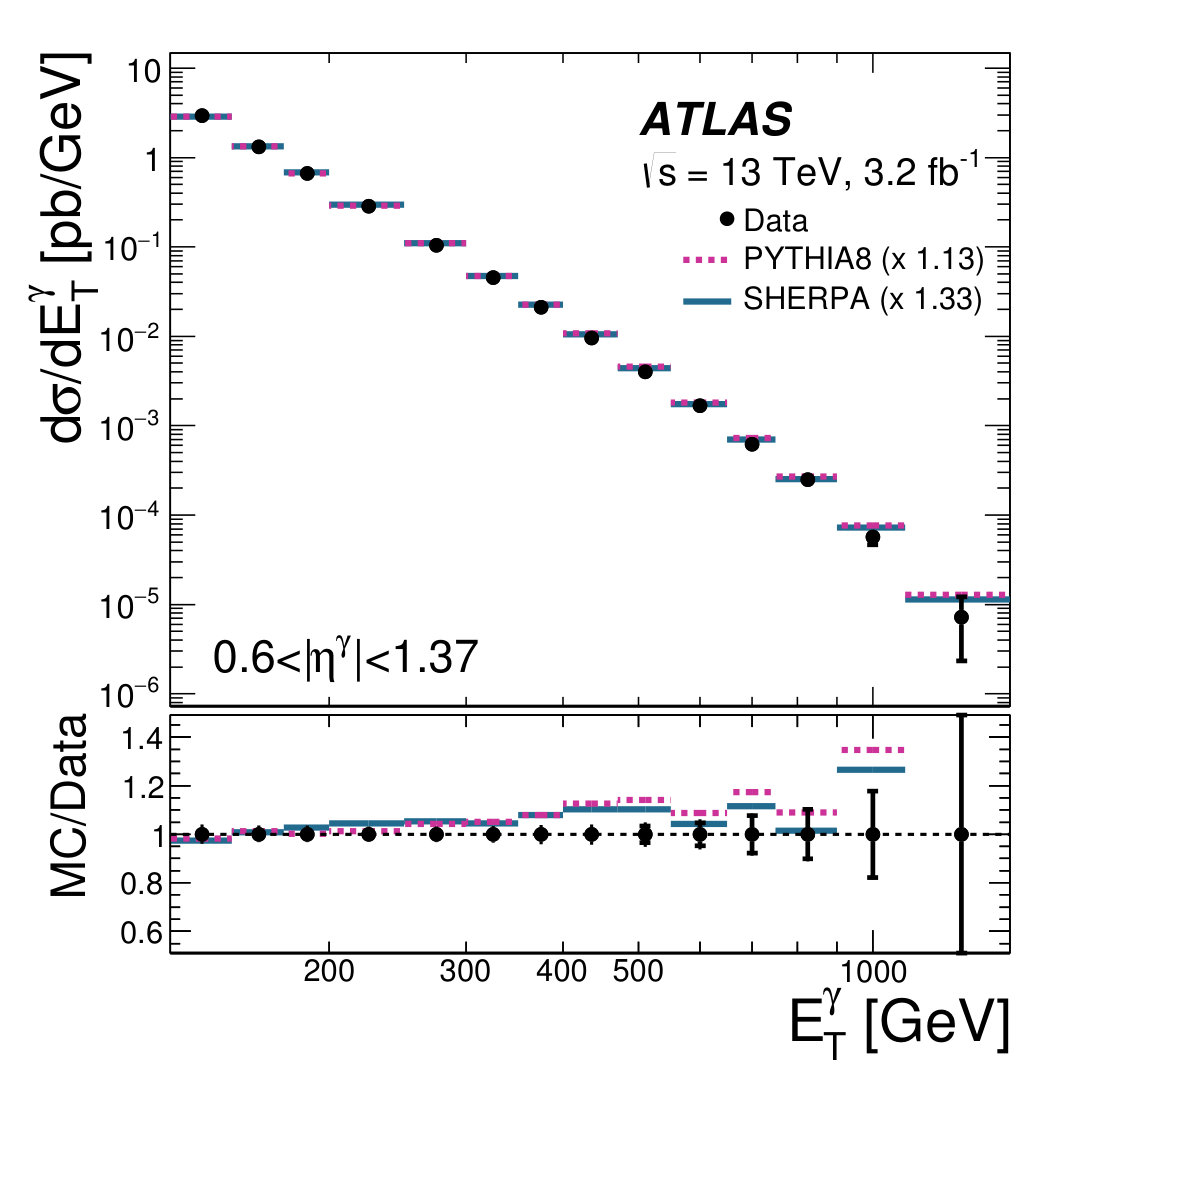 Figure 1
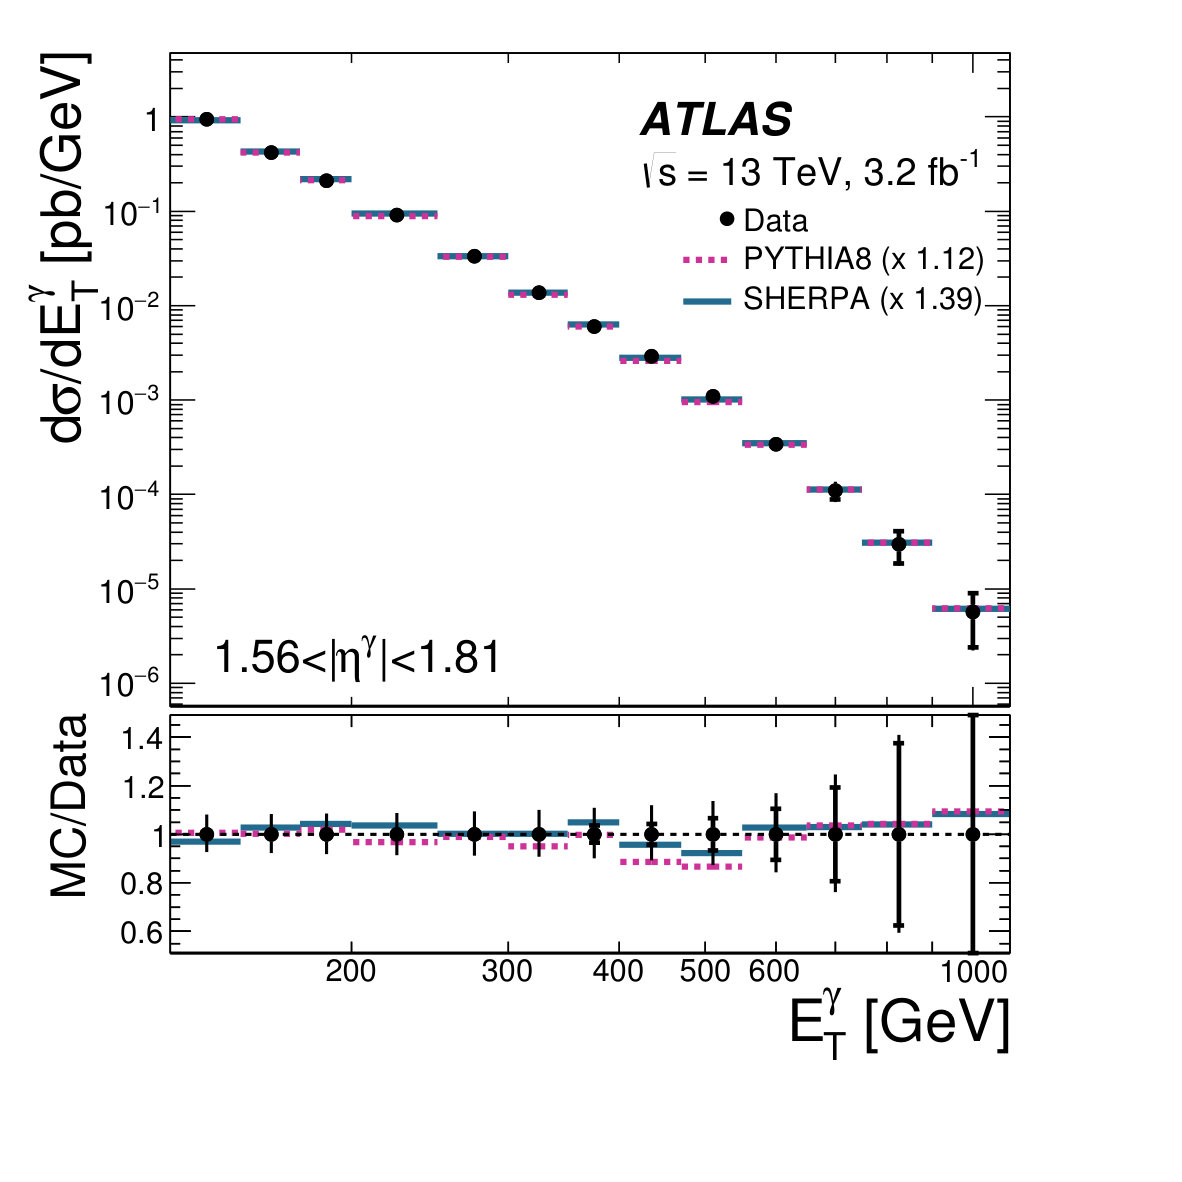 Figure 1
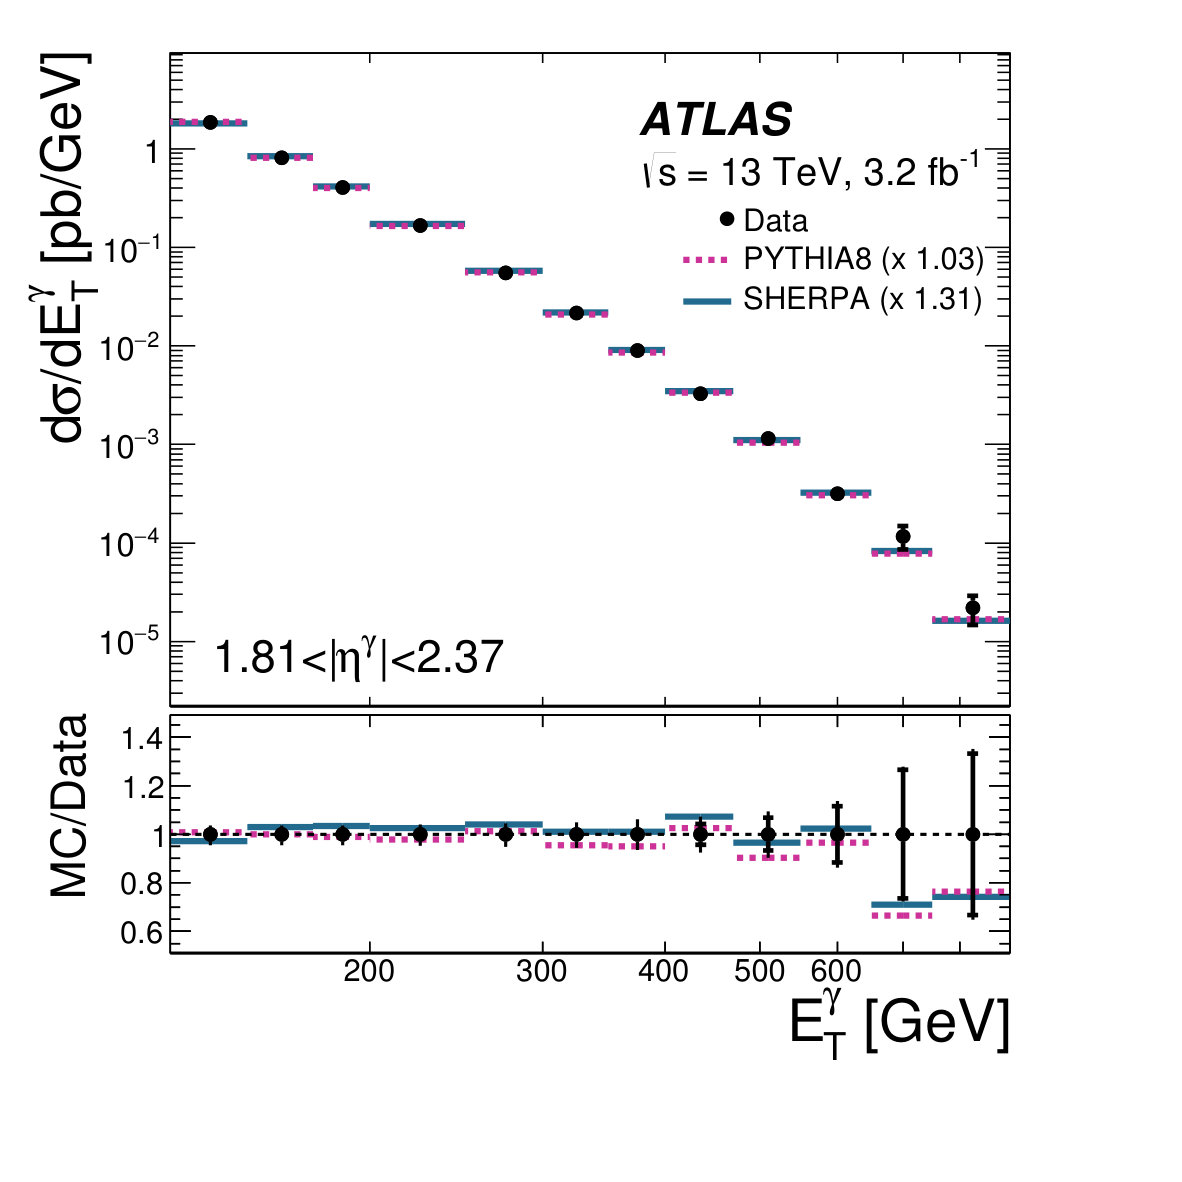 Figure 1
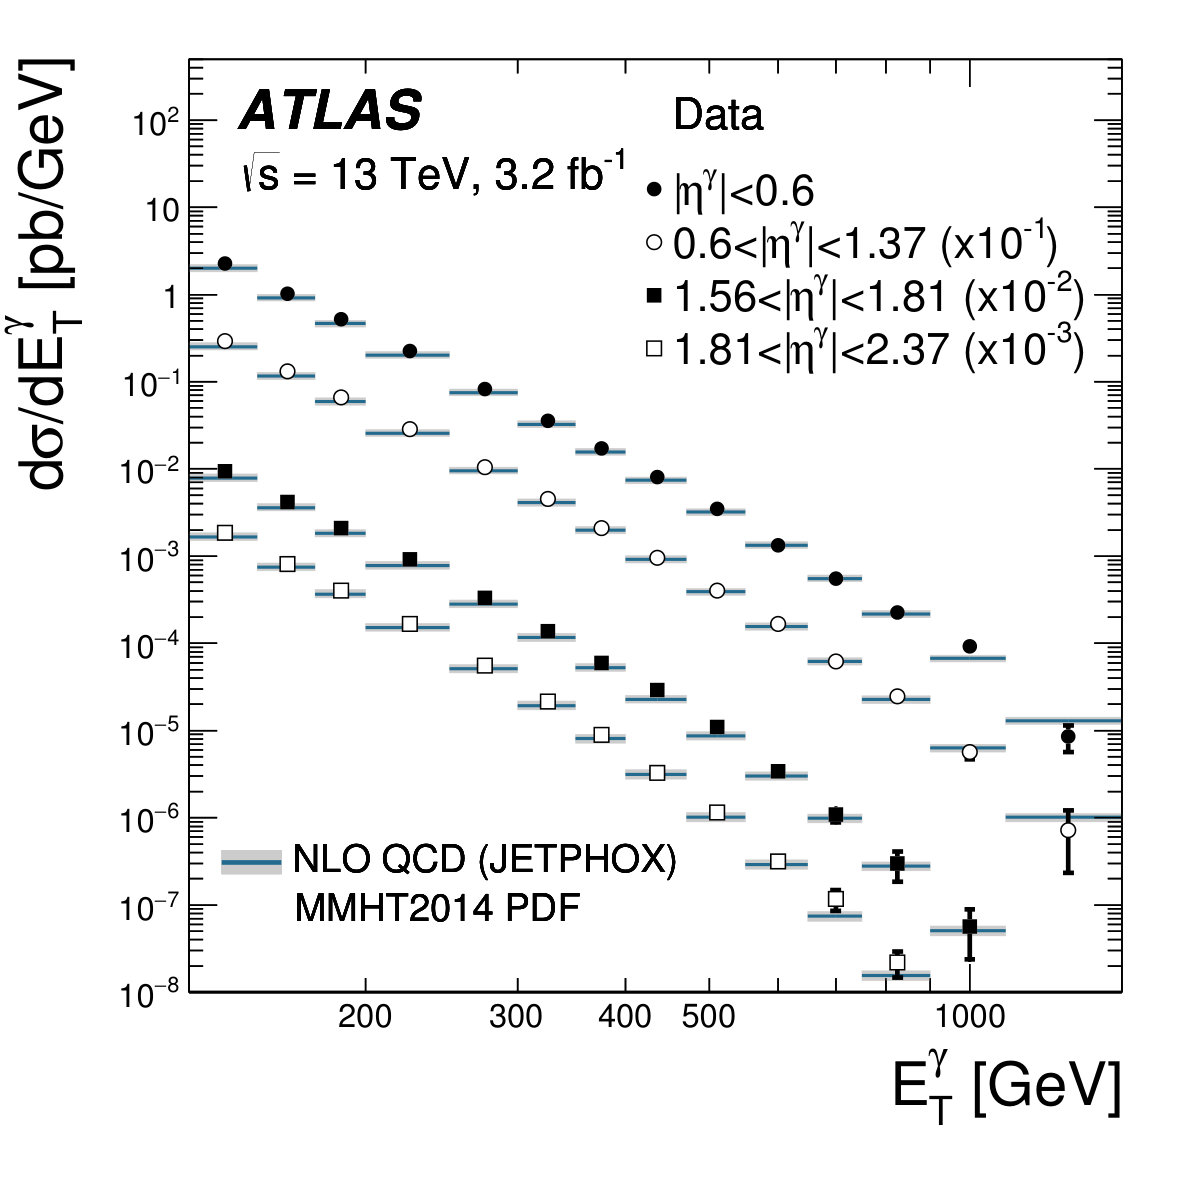 Figure 2
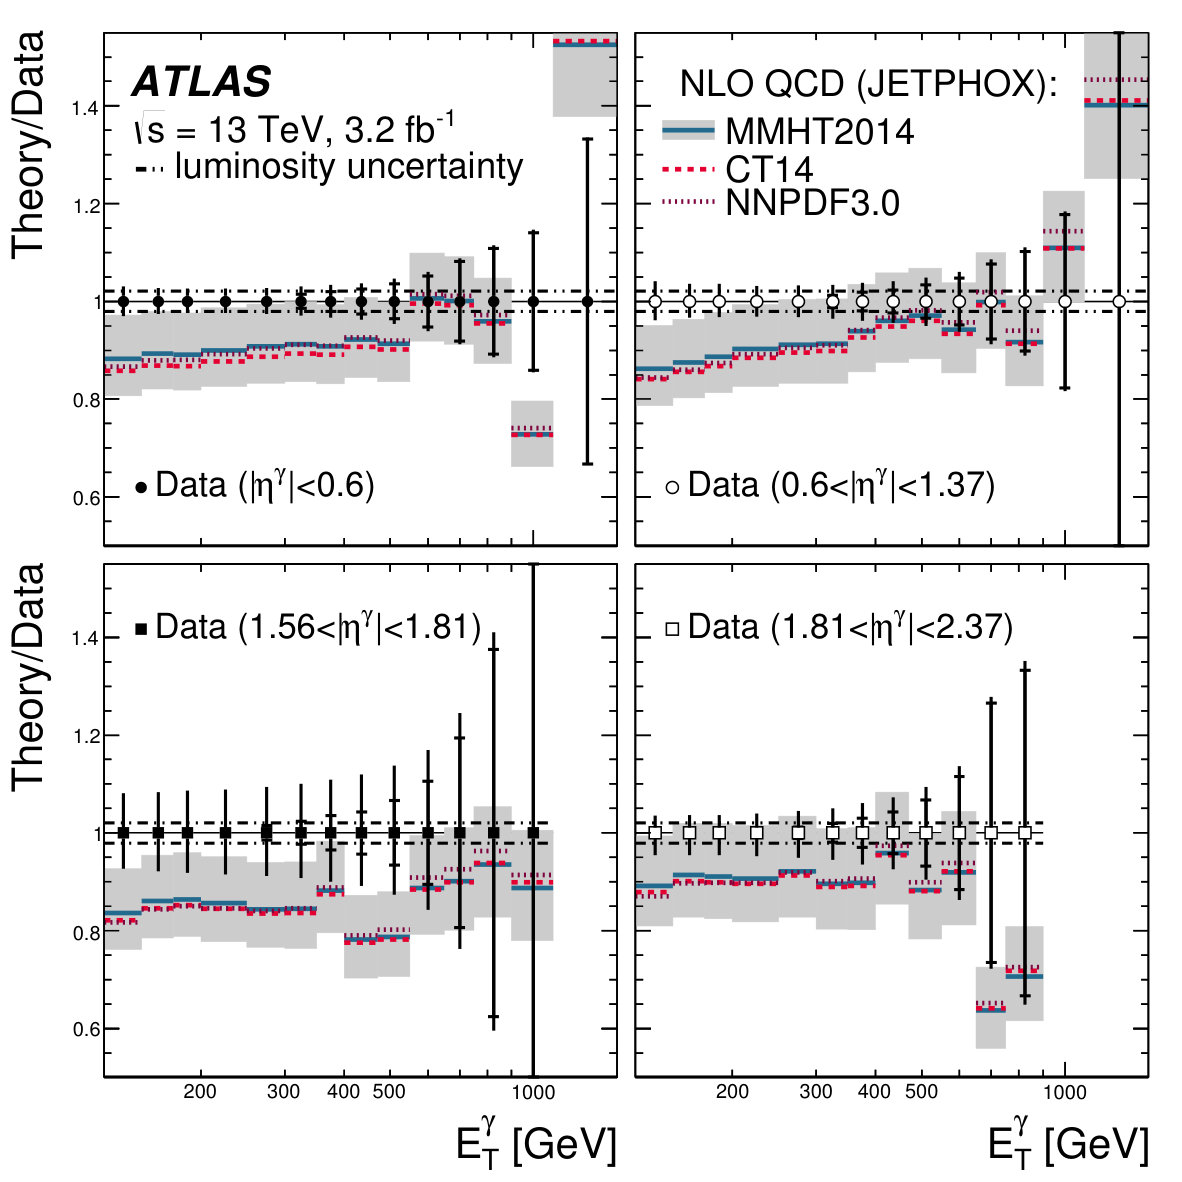 Figure 3
 Figure 7
 Figure 8
 Figure 9
| Uncertainties [pb] | |||||
|---|---|---|---|---|---|
| ID | ES+ER | Gap | |||
| upp. lim. | invert. var. | ||||
| Leak. Sherpa | Unf. Sherpa | MC | |||
| Hard and brem | Pile-up | MC stat. | |||
| Trigger | Data stat. | Luminosity | |||
Peer Reviews
No public reviews on file for this paper yet. If you reviewed it on a platform where reviews are public (OpenReview, ICLR, NeurIPS, ICML), you can paste yours below so the community can read it here.
Videos
No videos yet. Explain this paper in a talk, walkthrough, or lecture? Add one.
\AtlasTitle
Measurement of the cross section for inclusive isolated-photon production in collisions at TeV using the ATLAS detector
\AtlasJournalRefPhys. Lett. B 770 (2017) 473 \AtlasDOI10.1016/j.physletb.2017.04.072 \AtlasAbstract Inclusive isolated-photon production in collisions at a centre-of-mass energy of TeV is studied with the ATLAS detector at the LHC using a data set with an integrated luminosity of fb*-1*. The cross section is measured as a function of the photon transverse energy above GeV in different regions of photon pseudorapidity. Next-to-leading-order perturbative QCD and Monte Carlo event-generator predictions are compared to the cross-section measurements and provide an adequate description of the data.
1 Introduction
The production of prompt photons in proton–proton () collisions, , provides a testing ground for perturbative QCD (pQCD) with a hard colourless probe. All photons produced in collisions that are not secondaries from hadron decays are considered as “prompt”. Two processes contribute to prompt-photon production in : the direct process, in which the photon originates directly from the hard interaction, and the fragmentation process, in which the photon is emitted in the fragmentation of a high transverse momentum () parton [1, 2]. Measurements of inclusive prompt-photon production were used recently to investigate novel approaches to the description of parton radiation [3] and the importance of resummation of threshold logarithms in QCD and of the electroweak corrections [4]. Comparisons of prompt-photon data and pQCD are usually limited by the theoretical uncertainties associated with the missing higher-order terms in the perturbative expansion. The extension of the recent next-to-next-to-leading-order (NNLO) pQCD calculations for jet production [5] to prompt-photon production111After completion of the work presented here, first NNLO calculations for prompt-photon production have been completed [6]. will allow a more stringent test of pQCD. To make such a test with small experimental and theoretical uncertainties, it is optimal to perform measurements of prompt-photon production at high photon transverse energies and at the highest possible centre-of-mass energy of the colliding particles.
Since the dominant production mechanism in collisions at the LHC proceeds via the process, measurements of prompt-photon production are sensitive at leading order (LO) to the gluon density in the proton [7, 8, 9, 10, 11, 12, 13, 14, 15, 16]. Although prompt photon data were initially included in the determination of the proton parton distribution functions (PDFs), their use was abandoned some years ago. Since then, theoretical developments [13, 14] have shown ways to improve the description of the data in terms of pQCD, and a recent study quantified the impact of prompt-photon data from hadron colliders on the gluon density in the proton [15]. New measurements of prompt-photon production at higher centre-of-mass energies are expected to further constrain the gluon density in the proton when combined with previous data.
These measurements can also be used to tune the Monte Carlo (MC) models to improve the understanding of prompt-photon production. In addition, precise measurements of these processes aid those searches for which they are an important background, such as the search for new phenomena in final states with a photon and missing tranverse momentum.
Measurements of prompt-photon production at a hadron collider require isolated photons to avoid the large contribution of photons from decays of energetic and mesons inside jets. The production of inclusive isolated photons in collisions at centre-of-mass energies of and TeV was measured by the ATLAS [17, 18, 19, 20] and CMS [21, 22] collaborations.
This paper presents measurements of isolated-photon production in collisions at TeV with the ATLAS detector at the LHC using a data set with an integrated luminosity of fb*-1* collected during 2015. These measurements are performed in a phase-space region overlapping with that used in the previous ATLAS measurement at TeV [20]. Cross sections as functions of the photon transverse energy222 ATLAS uses a right-handed coordinate system with its origin at the nominal interaction point (IP) in the centre of the detector and the -axis along the beam pipe. The -axis points from the IP to the centre of the LHC ring, and the -axis points upwards. Cylindrical coordinates are used in the transverse plane, being the azimuthal angle around the -axis. The pseudorapidity is defined in terms of the polar angle as . Angular distance is measured in units of . The transverse energy is defined as , where is the energy. are measured in the range GeV for different regions of the photon pseudorapidity . The threshold in is chosen so as to avoid the low- region where both systematic and theoretical uncertainties increase. Next-to-leading-order (NLO) pQCD and MC event-generator predictions are compared to the measurements.
2 The ATLAS detector
The ATLAS detector [23] is a multi-purpose detector with a forward-backward symmetric cylindrical geometry. It consists of an inner tracking detector surrounded by a thin superconducting solenoid, electromagnetic and hadronic calorimeters, and a muon spectrometer incorporating three large superconducting toroid magnets. The inner-detector system is immersed in a T axial magnetic field and provides charged-particle tracking in the range . The high-granularity silicon pixel detector is closest to the interaction region and provides four measurements per track; the innermost layer, known as the insertable B-layer [24], was added in 2014 and provides high-resolution hits at small radius to improve the tracking performance. The pixel detector is followed by the silicon microstrip tracker, which typically provides four three-dimensional measurement points per track. These silicon detectors are complemented by the transition radiation tracker, which enables radially extended track reconstruction up to . The calorimeter system covers the range . Within the region , electromagnetic calorimetry is provided by barrel and endcap high-granularity lead/liquid-argon (LAr) electromagnetic calorimeters, with an additional thin LAr presampler covering to correct for energy loss in material upstream of the calorimeters; for the LAr calorimeters are divided into three layers in depth. Hadronic calorimetry is provided by a steel/scintillator-tile calorimeter, segmented into three barrel structures within , and two copper/LAr hadronic endcap calorimeters, which cover the region . The solid angle coverage is completed out to with forward copper/LAr and tungsten/LAr calorimeter modules, which are optimised for electromagnetic and hadronic measurements, respectively. Events are selected using a first-level trigger implemented in custom electronics, which reduces the maximum event rate of 40 MHz to a design value of 100 kHz using a subset of detector information. Software algorithms with access to the full detector information are then used in the high-level trigger to yield a recorded event rate of about 1 kHz [25].
3 Data selection
The data used in this analysis were collected with the ATLAS detector during the collision running period of 2015, when the LHC operated with a bunch spacing of ns and a centre-of-mass energy of TeV. Only events taken in stable beam conditions and satisfying detector and data-quality requirements are considered. The total integrated luminosity of the collected sample amounts to fb*-1* [26, 27]. Events were recorded using a single-photon trigger, with a transverse energy threshold of GeV. The trigger efficiency for isolated photons with GeV and , excluding , is higher than .
Events are required to have a reconstructed primary vertex. Primary vertices are formed from sets of two or more reconstructed tracks, each with MeV and , that are mutually consistent with having originated at the same three-dimensional point within the luminous region of the colliding proton beams. If multiple primary vertices are reconstructed, the one with the highest sum of the of the associated tracks is selected as the primary vertex.
Photon and electron candidates are reconstructed from clusters of energy deposited in the electromagnetic calorimeter. Candidates without a matching track or reconstructed conversion vertex333Conversion vertex candidates are reconstructed from pairs of oppositely charged tracks in the inner detector that are likely to be electrons [28]. in the inner detector are classified as unconverted photons [28]. Those with a matching reconstructed conversion vertex or a matching track consistent with originating from a photon conversion are classified as converted photons. Those matched to a track consistent with originating from an electron produced in the beam interaction region are classified as electrons.
The photon identification is based primarily on shower shapes in the calorimeter [28]. An initial selection is derived using the information from the hadronic calorimeter and the lateral shower shape in the second layer of the electromagnetic calorimeter, where most of the photon energy is contained. The final tight selection applies stringent criteria [28] to these variables, different for converted and unconverted photon candidates. It also places requirements on the shower shape in the finely segmented first calorimeter layer to ensure the compatibility of the measured shower profile with that originating from a single photon impacting the calorimeter. When applying the photon identification criteria to simulated events, corrections are made for small differences in the average values of the shower-shape variables between data and simulation. The efficiency of the photon identification varies in the range –% for GeV and –% for TeV, depending on and whether the photon candidate is classified as unconverted or converted [28, 29]. For GeV, the uncertainty in the photon identification efficiency varies between and , depending on and .
The photon energy measurement is made using calorimeter and tracking information. A dedicated energy calibration [30] is then applied to the candidates to account for upstream energy loss and both lateral and longitudinal leakage; a multivariate regression algorithm to calibrate electron and photon energy measurements was developed and optimised on simulated events. The calibration of the layer energies in the calorimeter is based on the measurement performed with 2012 data at TeV [30]. The overall energy scale in data and the difference in the energy resolution’s constant term444The relative energy resolution is parameterised as , where is the sampling term and is the constant term. between data and simulation are estimated with a sample of -boson decays to electrons recorded in 2012 and reprocessed using the same electron reconstruction and calibration scheme as used for the 2015 data taking and event processing. The energy scale and resolution corrections are checked using -boson decays to electrons recorded in the 2015 data set. Uncertainties in the measurements performed with this sample are estimated following a procedure similar to that discussed in Ref. [30]. The difference between the values measured with the 2015 data and those predicted from the reprocessed 2012 data is also taken into account in the uncertainties. The uncertainty in the photon energy scale at high is typically –%, depending on . Events with at least one photon candidate with calibrated GeV and are selected. Candidates in the region , which includes the transition region between the barrel and endcap calorimeters, are not considered.
The photon candidate is required to be isolated based on the amount of transverse energy inside a cone of size in the – plane around the photon candidate, excluding an area of size centred on the photon. The isolation transverse energy is computed from topological clusters of calorimeter cells [31] and is denoted by . The measured value of is corrected for leakage of the photon’s energy into the isolation cone and the estimated contributions from the underlying event (UE) and additional inelastic interactions (pile-up). The latter two corrections are computed simultaneously on an event-by-event basis [18] and the combined correction is typically GeV. The combined correction is computed using a method suggested in Refs. [32, 33]: the jet algorithm [34, 35] with jet radius is used to reconstruct all jets taking as input topological clusters of calorimeter cells; no explicit transverse momentum threshold is applied. The ambient-transverse energy density for the event (), from pile-up and the underlying event, is computed using the median of the distribution of the ratio between the jet transverse energy and its area. Finally, is multiplied by the area of the isolation cone to compute the correction to . In addition, for simulated events, data-driven corrections to are applied such that the peak position in the distribution coincides in data and simulation. After all these corrections, is required to be lower than [GeV] [GeV] [20]. The isolation requirement significantly reduces the main background, which consists of multi-jet events where one jet typically contains a or meson that carries most of the jet energy and is misidentified as a photon because it decays into an almost collinear photon pair.
A small fraction of the events contain more than one photon candidate satisfying the selection criteria. In such events, the highest- (leading) photon is considered for further study. The total number of data events selected by using the requirements discussed above amounts to . A summary of the kinematic requirements as well as the number of selected events in data in each region are included in Table 1. The selected sample of events is used to unfold the distribution in separately for each of the four regions in indicated in Table 1; the unfolding is performed using the samples of MC events described in Section 4.1 and the results are compared to the predictions from the Pythia and Sherpa generators as well as to the predictions from NLO pQCD (see Section 8).
4 Monte Carlo simulations and theoretical predictions
4.1 Monte Carlo simulations
Samples of MC events were generated to study the characteristics of signal events. The MC programs Pythia 8.186 [36] and Sherpa 2.1.1 [37] were used to generate the simulated events. In both generators, the partonic processes were simulated using tree-level matrix elements, with the inclusion of initial- and final-state parton showers. Fragmentation into hadrons was performed using the Lund string model [38] in the case of Pythia, and in Sherpa events by a modified version of the cluster model [39]. The LO NNPDF2.3 [40] PDFs were used for Pythia (NLO CT10 [41] for Sherpa) to parameterise the proton structure. Both samples include a simulation of the UE. The event-generator parameters were set according to the “A14” tune for Pythia [42] and the “CT10” tune for Sherpa. All the samples of generated events were passed through the Geant4-based [43] ATLAS detector- and trigger-simulation programs [44]. They were reconstructed and analysed by the same program chain as the data. Pile-up from additional collisions in the same and neighbouring bunch crossings was simulated by overlaying each MC event with a variable number of simulated inelastic collisions generated using Pythia8 with the A2 tune [45]. The MC events were weighted to reproduce the distribution of the average number of interactions per bunch crossing () observed in the data, referred to as “pile-up reweighting”; in this procedure, the value in the data is divided by a factor of , a rescaling which improves the agreement between the data and simulation for the observed number of primary vertices and recovers the fraction of visible cross-section of inelastic collisions as measured in the data [46].
The Pythia simulation of the signal includes LO photon-plus-jet events from both direct processes (the hard subprocesses and , called the “hard” component) and photon bremsstrahlung in QCD dijet events (called the “bremsstrahlung” component). The Sherpa samples were generated with LO matrix elements for photon-plus-jet final states with up to three additional partons ( processes with from to ); the matrix elements were merged with the Sherpa parton shower [47] using the ME+PS@LO prescription. While the bremsstrahlung component was modelled in Pythia by final-state QED radiation arising from calculations of all QCD processes, it was accounted for in Sherpa through the matrix elements of processes with ; in the generation of the Sherpa samples, a requirement on the photon isolation at the matrix-element level was imposed using the criterion defined in Ref. [48].555This criterion, commonly called Frixione’s criterion, requires the total transverse energy inside a cone of size around the generated final-state photon, excluding the photon itself, to be below a certain threshold, , for all . The parameters for the threshold were chosen to be , and .
The predictions of the MC generators at particle level are defined using those particles with a lifetime longer than ps; these particles are referred to as “stable”. The particles associated with the overlaid collisions (pile-up) are not considered. The particle-level isolation requirement on the photon was built summing the transverse energy of all stable particles, except for muons and neutrinos, in a cone of size around the photon direction after the contribution from the UE was subtracted; the same subtraction procedure used on data was applied at the particle level. Therefore, the cross sections quoted from MC simulations refer to photons that are isolated by requiring .
4.2 Next-to-leading-order pQCD predictions
The NLO pQCD predictions presented in this paper are computed using the program Jetphox 1.3.1_2 [49, 13]. This program includes a full NLO pQCD calculation of both the direct and fragmentation contributions to the cross section for the process.
The number of massless quark flavours is set to five. The renormalisation scale (at which the strong coupling is evaluated), factorisation scale (at which the proton PDFs are evaluated) and fragmentation scale (at which the fragmentation function is evaluated) are chosen to be . The calculations are performed using the MMHT2014 [50] parameterisations of the proton PDFs and the BFG set II of parton-to-photon fragmentation functions at NLO [51]. The strong coupling constant is calculated at two loops with . Predictions based on other proton PDF sets, namely CT14 [52] and NNPDF3.0 [53], are also computed. The calculations are performed using a parton-level isolation criterion which requires the total transverse energy from the partons inside a cone of size around the photon direction to be below .
The NLO pQCD predictions refer to the parton level while the measurements refer to the particle level. Since the data are corrected for pile-up and UE effects and the distributions are unfolded to a phase-space definition in which the requirement on at particle level is applied after subtraction of the UE, it is expected that parton-to-hadron corrections to the NLO pQCD predictions are small. This is confirmed by computing the ratio of the particle-level cross section for a Pythia sample with UE effects to the parton-level cross section without UE effects:666The effects of hadronisation and UE are also studied separately; the effects of including the UE do not cancel those of hadronisation and are dominant. the ratio is consistent with unity within over the measured range in . Therefore, no correction is applied to the NLO pQCD predictions and an uncertainty of is assigned.
5 Background estimation and signal extraction
A non-negligible background contribution remains in the selected sample, even after imposing the tight identification and isolation requirements on the photon. This background originates mainly from multi-jet processes in which a jet is misidentified as a photon.
The background subtraction relies on a data-driven method based on signal-suppressed control regions. The background contamination in the selected sample is estimated using the same two-dimensional sideband technique as in the previous analyses [17, 18, 54, 20, 55] and then subtracted bin-by-bin from the observed yield. In this method, the photon is classified as:
- •
“isolated”, if ;
- •
“non-isolated”, if and GeV;
- •
“tight”, if it satisfies the tight photon identification criteria;
- •
“non-tight”, if it fails at least one of four tight requirements on the shower-shape variables computed from the energy deposits in the first layer of the electromagnetic calorimeter, but satisfies the tight requirement on the total lateral shower width in the first layer and all the other tight identification criteria [28].
In the two-dimensional plane formed by and the photon identification variables, which are chosen because they are expected to be independent for the background, four regions are defined:
- •
: the “signal” region, containing tight isolated photon candidates;
- •
: the “non-isolated” background control region, containing tight non-isolated photon candidates;
- •
: the “non-tight” background control region, containing isolated non-tight photon candidates;
- •
: the background control region containing non-isolated non-tight photon candidates.
The signal yield in region is estimated by using the relation
[TABLE]
where , with , is the number of events in region and is the so-called background correlation and is taken as for the nominal results; with is the number of background events in each region. Equation (1) takes into account the expected number of signal events in the three background control regions () via the signal leakage fractions, with , which are estimated using the MC simulations of the signal. A systematic uncertainty is assigned to the modelling of the signal leakage fractions (see Section 7.1). The only assumption underlying Eq. (1) is that the isolation and identification variables are independent for background events, thus . This assumption is verified both in simulated background samples and in data in a background-dominated region [20]. A study of in background-dominated regions, accounting for signal leakage using either the Pythia or Sherpa simulations, shows deviations from unity which are then propagated through Equation (1) and taken as systematic uncertainties. The signal purity, defined as , is above for GeV in all regions and increases as increases. The signal purity is similar whether Pythia or Sherpa is used to extract the signal leakage fractions and the difference is taken as a systematic uncertainty.
There is an additional background from electrons misidentified as photons, mainly produced in Drell-Yan and processes. Such misidentified electrons are largely suppressed by the photon selection. The remaining electron background is estimated using MC techniques and found to be negligible in the phase-space region of the analysis presented here.
6 Unfolding
The isolated-photon cross section is measured as a function of in different regions of . The phase-space regions are listed in Table 1. The data distributions, after background subtraction, are unfolded to the particle level using bin-by-bin correction factors determined using the MC samples. These correction factors take into account the efficiency of the selection criteria and the purity and efficiency of the photon reconstruction. The data distributions are unfolded to the particle level via the formula
[TABLE]
where is the cross section as a function of the observable in bin , is the number of background-subtracted data events in bin , is the correction factor in bin , is the integrated luminosity and is the width of bin . The correction factors are computed using the MC samples of events as , where is the number of events which satisfy the kinematic constraints of the phase-space region at the particle level, and is the number of events which meet all the selection criteria at the reconstruction level.
The nominal cross sections are measured using the correction factors from Pythia and the deviations from these results when using Sherpa to unfold the data are taken to represent systematic uncertainties in how the parton-shower and hadronisation models affect the corrections. The correction factors increase as increases and vary between and depending on and . The results of the bin-by-bin unfolding procedure are checked with a Bayesian unfolding method [56], giving consistent results.
7 Experimental and theoretical uncertainties
7.1 Experimental uncertainties
The primary sources of systematic uncertainty that affect the measurements are investigated. These sources include photon identification, photon energy scale and resolution, background subtraction, modelling of the final state, pile-up, MC sample statistics, trigger and luminosity.
- •
Photon identification efficiency. The uncertainty in the photon identification efficiency is estimated from the effect of differences between shower-shape variable distributions in data and simulation. From the studies presented in Ref. [28], this procedure is found to provide a conservative estimate of the uncertainties.777The photon identification efficiencies from data-driven methods and MC simulations were compared in Ref. [28]. No significant difference is observed between the data-driven measurements and the nominal or corrected (for the small differences in the average values of the shower-shape variables between data and simulation) simulation for GeV. The resulting uncertainty in the measured cross sections increases from –% at GeV to –% at TeV.
- •
Photon energy scale and resolution. A detailed assessment of the uncertainties in the photon energy scale and resolution is made using the same method developed with TeV data [30]. The sources of uncertainty include: the uncertainty in the overall energy scale adjustment using ; the uncertainty in the non-linearity of the energy measurement at the cell level; the uncertainty in the relative calibration of the different calorimeter layers; the uncertainty in the amount of material in front of the calorimeter; the uncertainty in the modelling of the reconstruction of photon conversions; the uncertainty in the modelling of the lateral shower shape; the uncertainty in the modelling of the sampling term; the uncertainty in the measurement of the constant term in -boson decays. Additional systematic uncertainties are included to take into account the differences between the 2012 and 2015 configurations. These uncertainties are modelled using independent components to account for their dependence. All the components are propagated through the analysis separately to maintain the full information about the correlations.
The systematic uncertainties in the measured cross sections due to the effects mentioned above are estimated by varying by each individual source of uncertainty separately in the MC simulations and then added in quadrature. The resulting uncertainty increases from about at GeV to about at TeV except in the region, where it increases from about at GeV to about at TeV.
- •
Definition of the background control regions. The estimation of the background contamination in the signal region is affected by the choice of background control regions. The control regions and are defined by the lower and upper limits on and the choice of inverted photon identification variables used in the selection of non-tight photons. To study the dependence on the specific choices, these definitions are varied over a wide range. The lower limit on in regions and is varied by GeV, which is larger than any difference between data and simulations and still provides a sufficient sample to perform the data-driven subtraction. The upper limit on in regions and is removed. The resulting uncertainty in the measured cross sections is negligible.
Likewise, the choice of inverted photon identification variables is varied. The analysis is repeated using different sets of variables: tighter (looser) identification criteria are defined by applying tight requirements to an extended (restricted) set of shower-shape variables in the first calorimeter layer. The resulting uncertainty in the measured cross sections is typically smaller than .
- •
Photon identification and isolation correlation in the background. The photon isolation and identification variables used to define the plane in the two-dimensional sideband method to subtract the background are assumed to be independent for background events ( in Eq. (1)). Any correlation between these variables affects the estimation of the purity of the signal and leads to systematic uncertainties in the background-subtraction procedure. A range in is set to cover the deviations from unity observed for the estimations based on subtracting the signal leakage with either Pythia or Sherpa MC samples. The resulting range in , which is taken as the uncertainty, is for and ; for the region (), the range is () at low and increases to () at high . The resulting uncertainty in the measured cross sections is typically smaller than .
- •
Parton-shower and hadronisation model dependence. The effects due to the parton-shower and hadronisation models in the signal purity and correction factors are studied separately; the effects are estimated as the differences observed between the nominal results and those obtained using Sherpa MC samples either for the determination of the signal leakage fractions or the unfolding correction factors. The resulting uncertainties in the measured cross sections are typically smaller than .
- •
Photon isolation modelling. The differences between the nominal results and those obtained without applying the data-driven corrections to in simulated events are taken as systematic uncertainties in the measurements due to the modelling of in the MC simulation. The resulting uncertainty in the measured cross sections is smaller than .
- •
Signal modelling. The MC simulation of the signal is used to estimate the signal leakage fractions in the two-dimensional sideband method for background subtraction and to compute the bin-by-bin correction factors. The Pythia simulation is used with the mixture of the hard and bremsstrahlung components as predicted by the generator to yield the background-subtracted data distributions and to compute the correction factors; in the predicted mixture, the relative contribution of the bremsstrahlung component amounts to . The uncertainty related to the simulation of the hard and bremsstrahlung components is estimated by performing the background subtraction and the calculation of the correction factors using a mixture with either two or zero times the amount of the bremsstrahlung component. The resulting uncertainty in the measured cross sections is typically smaller than .
- •
Pile-up. The uncertainty is estimated by changing the nominal rescaling factor of from to and re-evaluating the reweighting factors. The resulting uncertainty in the measured cross sections is typically smaller than .
The total systematic uncertainty is computed by adding in quadrature the uncertainties from the sources listed above and the statistical uncertainty of the MC samples as well as the uncertainty in the trigger efficiency. The uncertainty in the integrated luminosity is [27]. This uncertainty is fully correlated in all bins of all the measured cross sections and is shown separately. The total systematic uncertainty is smaller than for . For (), it increases from at GeV to at the high end of the spectrum. For GeV, the systematic uncertainty dominates the total experimental uncertainty, while for higher values, the statistical uncertainty of the data limits the precision of the measurements.
7.2 Theoretical uncertainties
The following sources of uncertainty in the theoretical predictions are considered:
- •
The uncertainty in the NLO pQCD predictions due to terms beyond NLO is estimated by repeating the calculations using values of , and scaled by the factors and . The three scales are either varied simultaneously, individually or by fixing one and varying the other two. In all cases, the condition is imposed, where and . The final uncertainty is taken as the largest deviation from the nominal value among the 14 possible variations.
- •
The uncertainty in the NLO pQCD predictions due to imperfect knowledge of the proton PDFs is estimated by repeating the calculations using the sets from the MMHT2014 error analysis [50] and applying the Hessian method [57, 58] for evaluation of the PDF uncertainties.
- •
The uncertainty in the NLO pQCD predictions due to that in the value of is estimated by repeating the calculations using two additional sets of proton PDFs from the MMHT2014 analysis, for which different values of were assumed in the fits, namely and ; in this way, the correlation between and the PDFs is preserved.
- •
An uncertainty of is assigned due to the non-perturbative effects of hadronisation and UE (see Section 4.2).
The dominant theoretical uncertainty is that arising from the terms beyond NLO and amounts to –% for all regions. The uncertainty arising from those in the PDFs increases from at GeV to –% at high . The uncertainty arising from the value of is below . The total theoretical uncertainty is obtained by adding in quadrature the individual uncertainties listed above and amounts to –%.
8 Results
Figure 1 shows the isolated-photon cross section as a function of in four different regions of . The measured cross sections decrease by approximately five orders of magnitude in the measured range. Values of up to TeV are accessed. The cross-section distributions measured in the four different regions of have similar shapes.
The predictions of the Pythia and Sherpa MC models are compared to the measurements in Figure 1. These predictions are normalised to the measured integrated cross section in each region. The difference in normalisation between data and Pythia (Sherpa) is and attributed to the fact that these generators are based on tree-level matrix elements, which are affected by a large normalisation uncertainty due to missing higher-order terms. The predictions of both Pythia and Sherpa give a good description of the shape of the measured cross-section distributions for GeV in the range and in the whole measured range for .
Figure 2 shows the measured isolated-photon cross sections as functions of in four different regions of compared with the predictions of the NLO pQCD calculations of Jetphox based on the MMHT2014 proton PDF set. The ratios of the theoretical predictions based on different PDF sets to the measured cross sections are shown in Figure 3. The predictions based on MMHT2014, CT14 and NNPDF3.0 are very similar, the differences being much smaller than the theoretical scale uncertainties. For most of the points, the theoretical uncertainties are larger than those of experimental origin. Differences are observed between data and the predictions of up to –% depending on and ; since the theoretical uncertainties are –% and cover those differences, it is concluded that the NLO pQCD predictions provide an adequate description of the measurements.
The measured cross sections are larger than those at TeV [20] by approximately a factor of two at low ( GeV) and by approximately an order of magnitude at the high end of the spectrum in each region of . Such increases in the measured cross section are expected from the increase in the centre-of-mass energy. The experimental uncertainties of the measurements at and TeV are comparable. For both centre-of-mass energies the NLO theoretical uncertainties are of similar size and comparable to the differences between the predictions and the data; since, in addition, the experimental uncertainties are smaller than those differences, the inclusion of NNLO pQCD corrections might improve the description of the two sets of measurements.
The measured fiducial cross section for inclusive isolated-photon production in the phase-space region given by GeV and (excluding the region of ) and isolation is
[TABLE]
where “exp.” denotes the sum in quadrature of the statistical and systematic uncertainties and “lumi.” denotes the uncertainty due to that in the integrated luminosity, details of which are listed in Table 2.
The fiducial cross section predicted at NLO in pQCD by Jetphox using the MMHT2014 PDFs is
[TABLE]
which is lower than the measurement, but consistent within the experimental and theoretical uncertainties.
9 Summary
A measurement of the cross section for inclusive isolated-photon production in collisions at TeV with the ATLAS detector at the LHC is presented using a data set with an integrated luminosity of fb*-1*. Cross sections as functions of are measured in four different regions of for photons with GeV and , excluding the region . Selection of isolated photons is ensured by requiring that the transverse energy in a cone of size around the photon is smaller than [GeV]. Values of up to TeV are measured. The fiducial cross section is measured to be .
The experimental systematic uncertainties are evaluated such that the correlations with previous ATLAS measurements of prompt-photon production can be used in the fits of the proton parton distribution functions. A combined fit at NNLO pQCD of the measurements in collisions at centre-of-mass energies of and TeV which takes into account the correlated systematic uncertainties has the potential to constrain further the proton PDFs than either set of measurements alone.
The predictions of the Pythia and Sherpa Monte Carlo models give a good description of the shape of the measured cross-section distributions except for GeV in the regions and . The next-to-leading-order pQCD predictions, using Jetphox and based on different sets of proton PDFs, provide an adequate description of the data within the experimental and theoretical uncertainties. For most of the phase space the theoretical uncertainties are larger than those of experimental nature and dominated by the terms beyond NLO, from which it is concluded that NNLO pQCD corrections are needed to make an even more stringent test of the theory.
Acknowledgements
We thank CERN for the very successful operation of the LHC, as well as the support staff from our institutions without whom ATLAS could not be operated efficiently.
We acknowledge the support of ANPCyT, Argentina; YerPhI, Armenia; ARC, Australia; BMWFW and FWF, Austria; ANAS, Azerbaijan; SSTC, Belarus; CNPq and FAPESP, Brazil; NSERC, NRC and CFI, Canada; CERN; CONICYT, Chile; CAS, MOST and NSFC, China; COLCIENCIAS, Colombia; MSMT CR, MPO CR and VSC CR, Czech Republic; DNRF and DNSRC, Denmark; IN2P3-CNRS, CEA-DSM/IRFU, France; SRNSF, Georgia; BMBF, HGF, and MPG, Germany; GSRT, Greece; RGC, Hong Kong SAR, China; ISF, I-CORE and Benoziyo Center, Israel; INFN, Italy; MEXT and JSPS, Japan; CNRST, Morocco; NWO, Netherlands; RCN, Norway; MNiSW and NCN, Poland; FCT, Portugal; MNE/IFA, Romania; MES of Russia and NRC KI, Russian Federation; JINR; MESTD, Serbia; MSSR, Slovakia; ARRS and MIZŠ, Slovenia; DST/NRF, South Africa; MINECO, Spain; SRC and Wallenberg Foundation, Sweden; SERI, SNSF and Cantons of Bern and Geneva, Switzerland; MOST, Taiwan; TAEK, Turkey; STFC, United Kingdom; DOE and NSF, United States of America. In addition, individual groups and members have received support from BCKDF, the Canada Council, CANARIE, CRC, Compute Canada, FQRNT, and the Ontario Innovation Trust, Canada; EPLANET, ERC, ERDF, FP7, Horizon 2020 and Marie Skłodowska-Curie Actions, European Union; Investissements d’Avenir Labex and Idex, ANR, Région Auvergne and Fondation Partager le Savoir, France; DFG and AvH Foundation, Germany; Herakleitos, Thales and Aristeia programmes co-financed by EU-ESF and the Greek NSRF; BSF, GIF and Minerva, Israel; BRF, Norway; CERCA Programme Generalitat de Catalunya, Generalitat Valenciana, Spain; the Royal Society and Leverhulme Trust, United Kingdom.
The crucial computing support from all WLCG partners is acknowledged gratefully, in particular from CERN, the ATLAS Tier-1 facilities at TRIUMF (Canada), NDGF (Denmark, Norway, Sweden), CC-IN2P3 (France), KIT/GridKA (Germany), INFN-CNAF (Italy), NL-T1 (Netherlands), PIC (Spain), ASGC (Taiwan), RAL (UK) and BNL (USA), the Tier-2 facilities worldwide and large non-WLCG resource providers. Major contributors of computing resources are listed in Ref. [59].
The reference list from the paper itself. Each links out to its DOI / PubMed record.
- 1[1] T. Pietrycki and A. Szczurek “Photon-jet correlations in p p 𝑝 𝑝 pp and p p 𝑝 𝑝 pp collisions” In Phys. Rev. D 76 , 2007, pp. 034003 DOI: 10.1103/Phys Rev D.76.034003 · doi ↗
- 2[2] Z. Belghobsi et al. “Photon-jet correlations and constraints on fragmentation functions” In Phys. Rev. D 79 , 2009, pp. 114024 DOI: 10.1103/Phys Rev D.79.114024 · doi ↗
- 3[3] A.V. Lipatov and M.A. Malyshev “Reconsideration of the inclusive prompt photon production at the LHC with k T subscript 𝑘 𝑇 k_{T} -factorization” In Phys. Rev. D 94 , 2016, pp. 034020 DOI: 10.1103/Phys Rev D.94.034020 · doi ↗
- 4[4] M.D. Schwartz “Precision direct photon spectra at high energy and comparison to the 8 Te V ATLAS data” In JHEP 1609 , 2016, pp. 005 DOI: 10.1007/JHEP 09(2016)005 · doi ↗
- 5[5] J. Currie, E.W.N. Glover and J. Pires “NNLO QCD predictions for single jet inclusive production at the LHC” In Phys. Rev. Lett. 118 , 2017, pp. 072002 DOI: 10.1103/Phys Rev Lett.118.072002 · doi ↗
- 6[6] J.M. Campbell, R.K. Ellis and C. Williams “Direct photon production at next-to-next-to-leading order”, (2016), ar Xiv: 1612.04333 [hep-ph]
- 7[7] D.W. Duke and J.F. Owens “ Q 2 superscript 𝑄 2 Q^{2} Dependent Parametrizations of Parton Distribution Functions” In Phys. Rev. D 30 , 1984, pp. 49 DOI: 10.1103/Phys Rev D.30.49 · doi ↗
- 8[8] J.F. Owens “Large Momentum Transfer Production of Direct Photons, Jets, and Particles” In Rev. Mod. Phys. 59 , 1987, pp. 465 DOI: 10.1103/Rev Mod Phys.59.465 · doi ↗