Identification of X-ray lines in the spectrum of the arcsec-scale precessing jets of SS 433
Ildar Khabibullin, Sergey Sazonov

TL;DR
This study identifies the X-ray emission lines in SS 433's jets as Fe XXVI Lyα, resolving previous inconsistencies by considering time delays and jet reheating effects, thus clarifying the jet composition and dynamics.
Contribution
It demonstrates that the observed X-ray line positions are consistent with Fe XXVI Lyα emission from extended jet regions when accounting for time delays and jet reheating effects.
Findings
Observed line positions match Fe XXVI Lyα emission.
Reheating and deceleration of jets occur at large distances.
Time delays explain phase shifts in line positions.
Abstract
The extended X-ray emission observed at arcsec scales along the propagation trajectory of the precessing relativistic jets of the Galactic microquasar SS 433 features a broad emission line, with the position of the centroid being significantly different for the approaching and receding jets ( and keV, respectively). These observed line positions are at odds with the predictions of the kinematic model for any of the plausible bright spectral lines in this band, raising the question of their identification. Here we address this issue by taking into account time delays of the emission coming from the receding regions of the jets relative to that from the approaching ones, which cause a substantial phase shift and distortion of the predicted line positions for the extended ( cm) emission compared to the X-ray and optical lines observed from the…
Click any figure to enlarge with its caption.
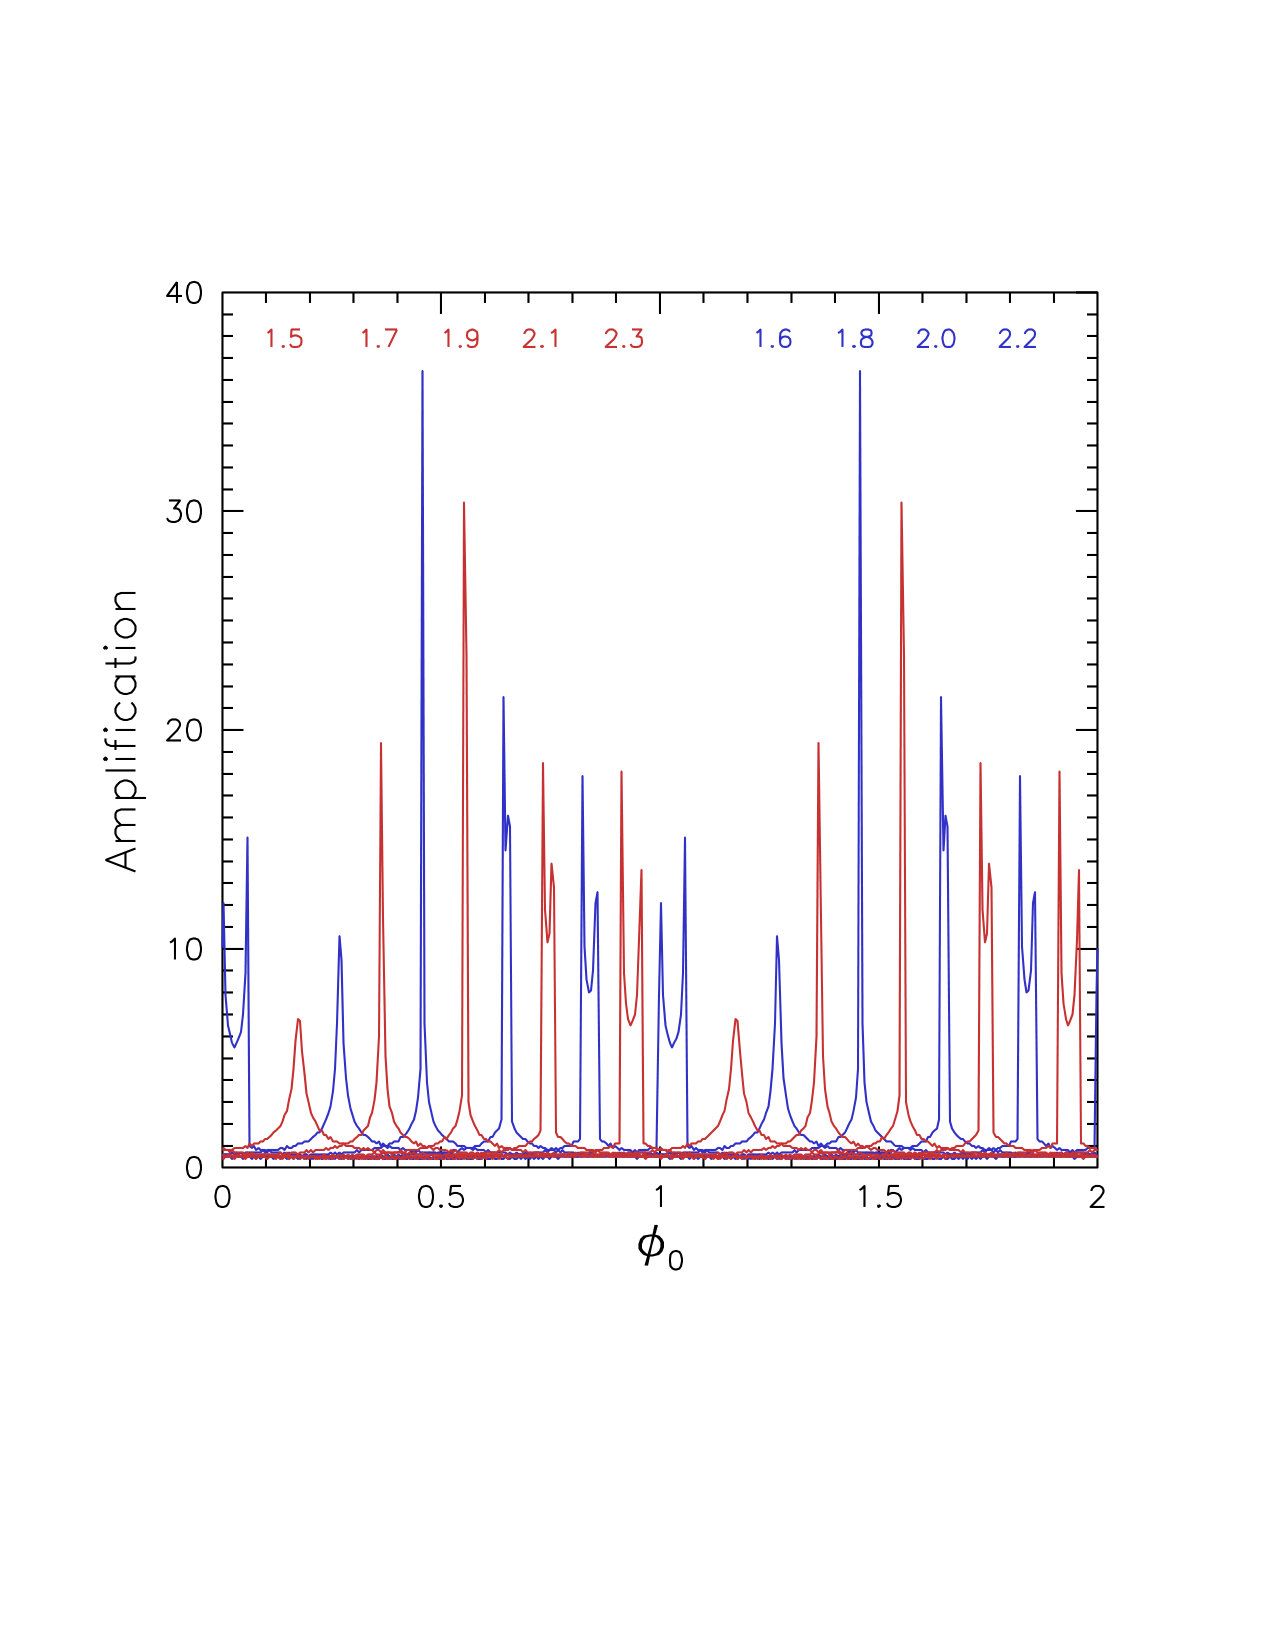 Figure 1
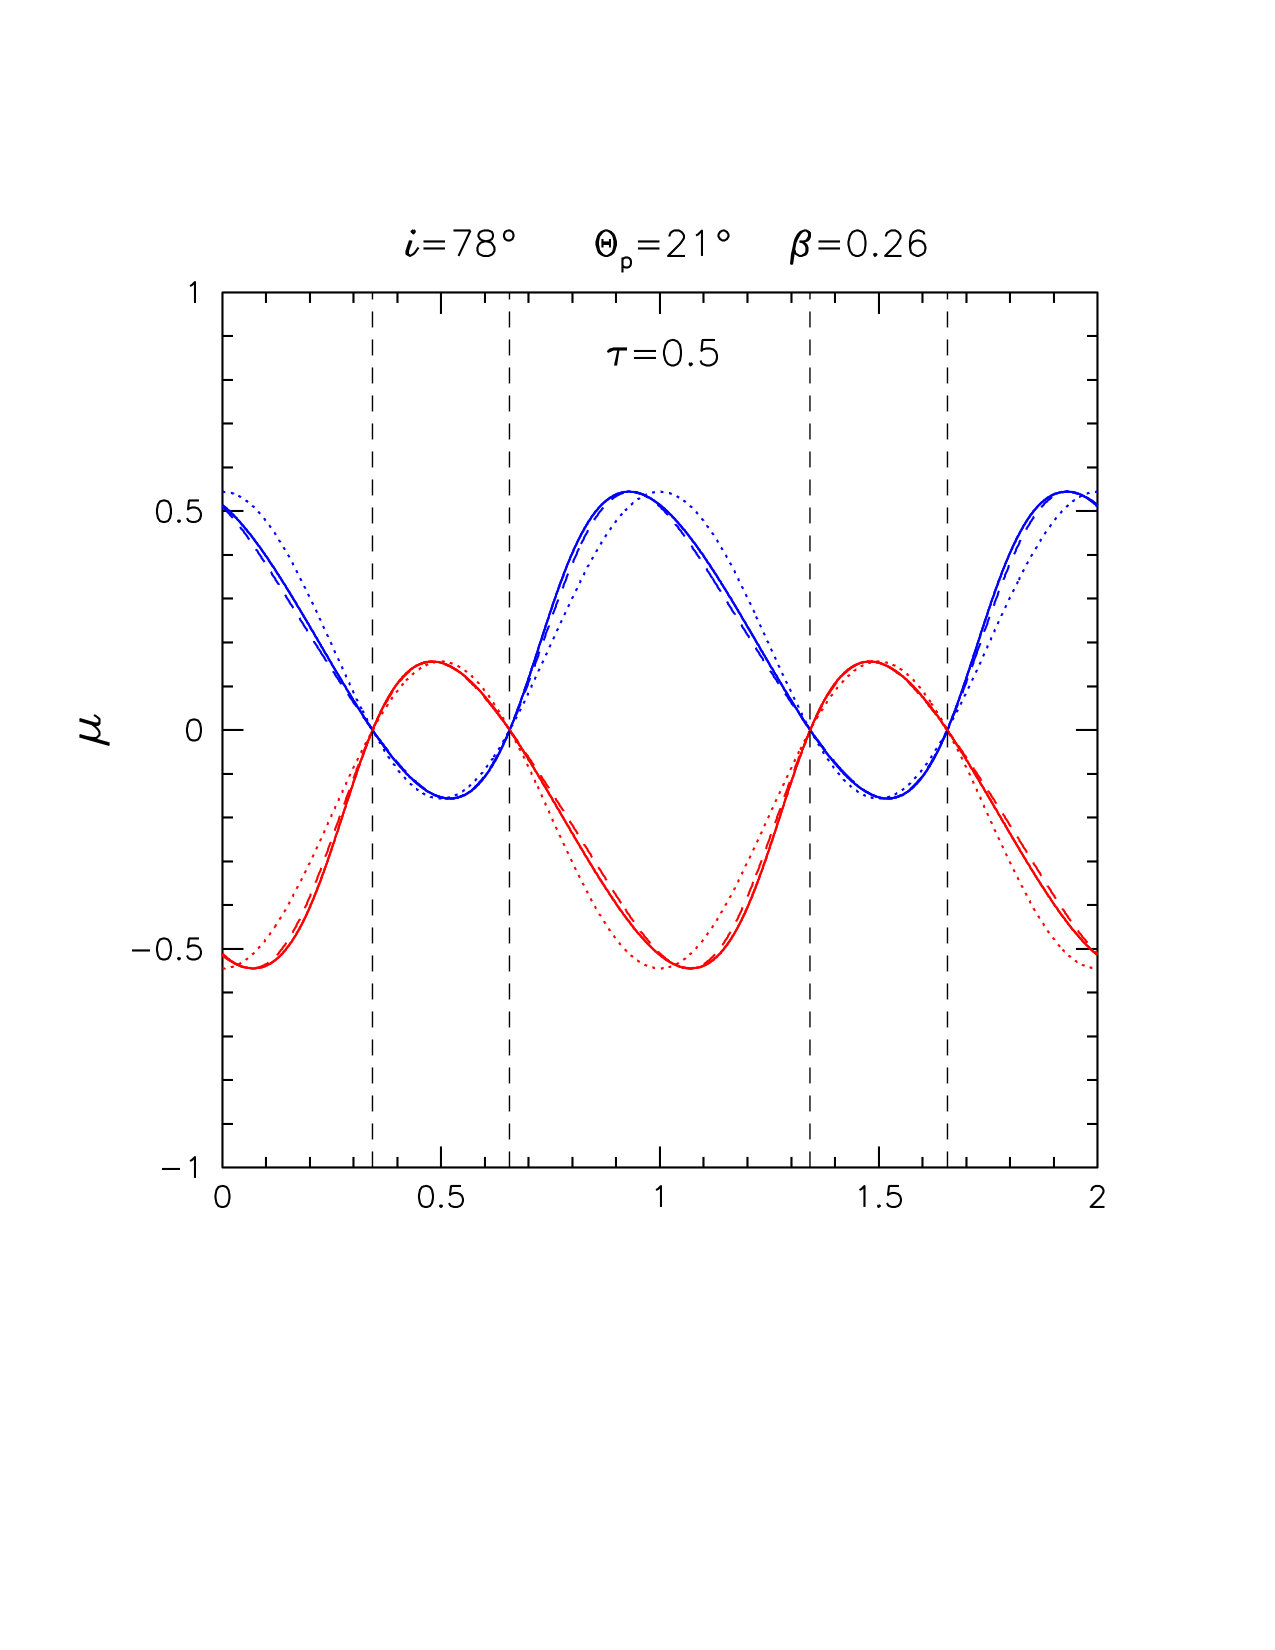 Figure 2
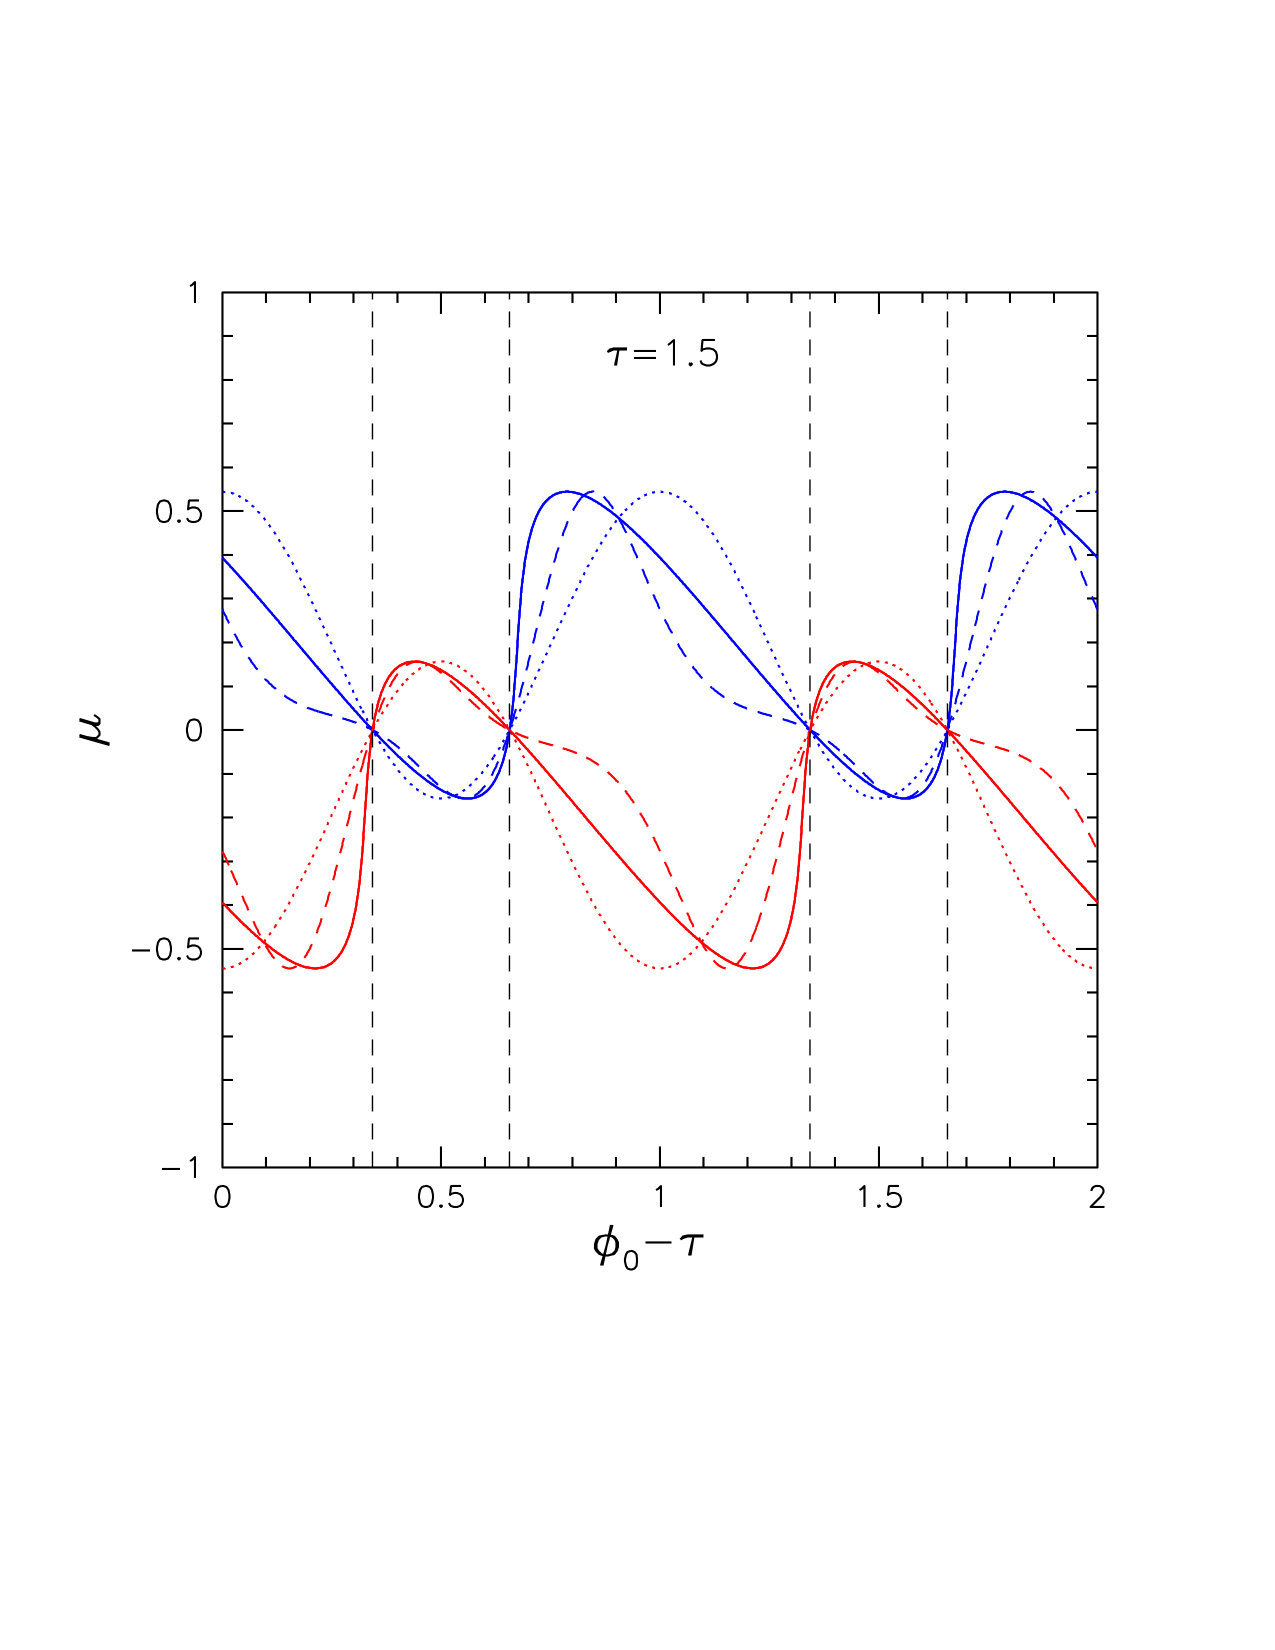 Figure 3
 Figure 4
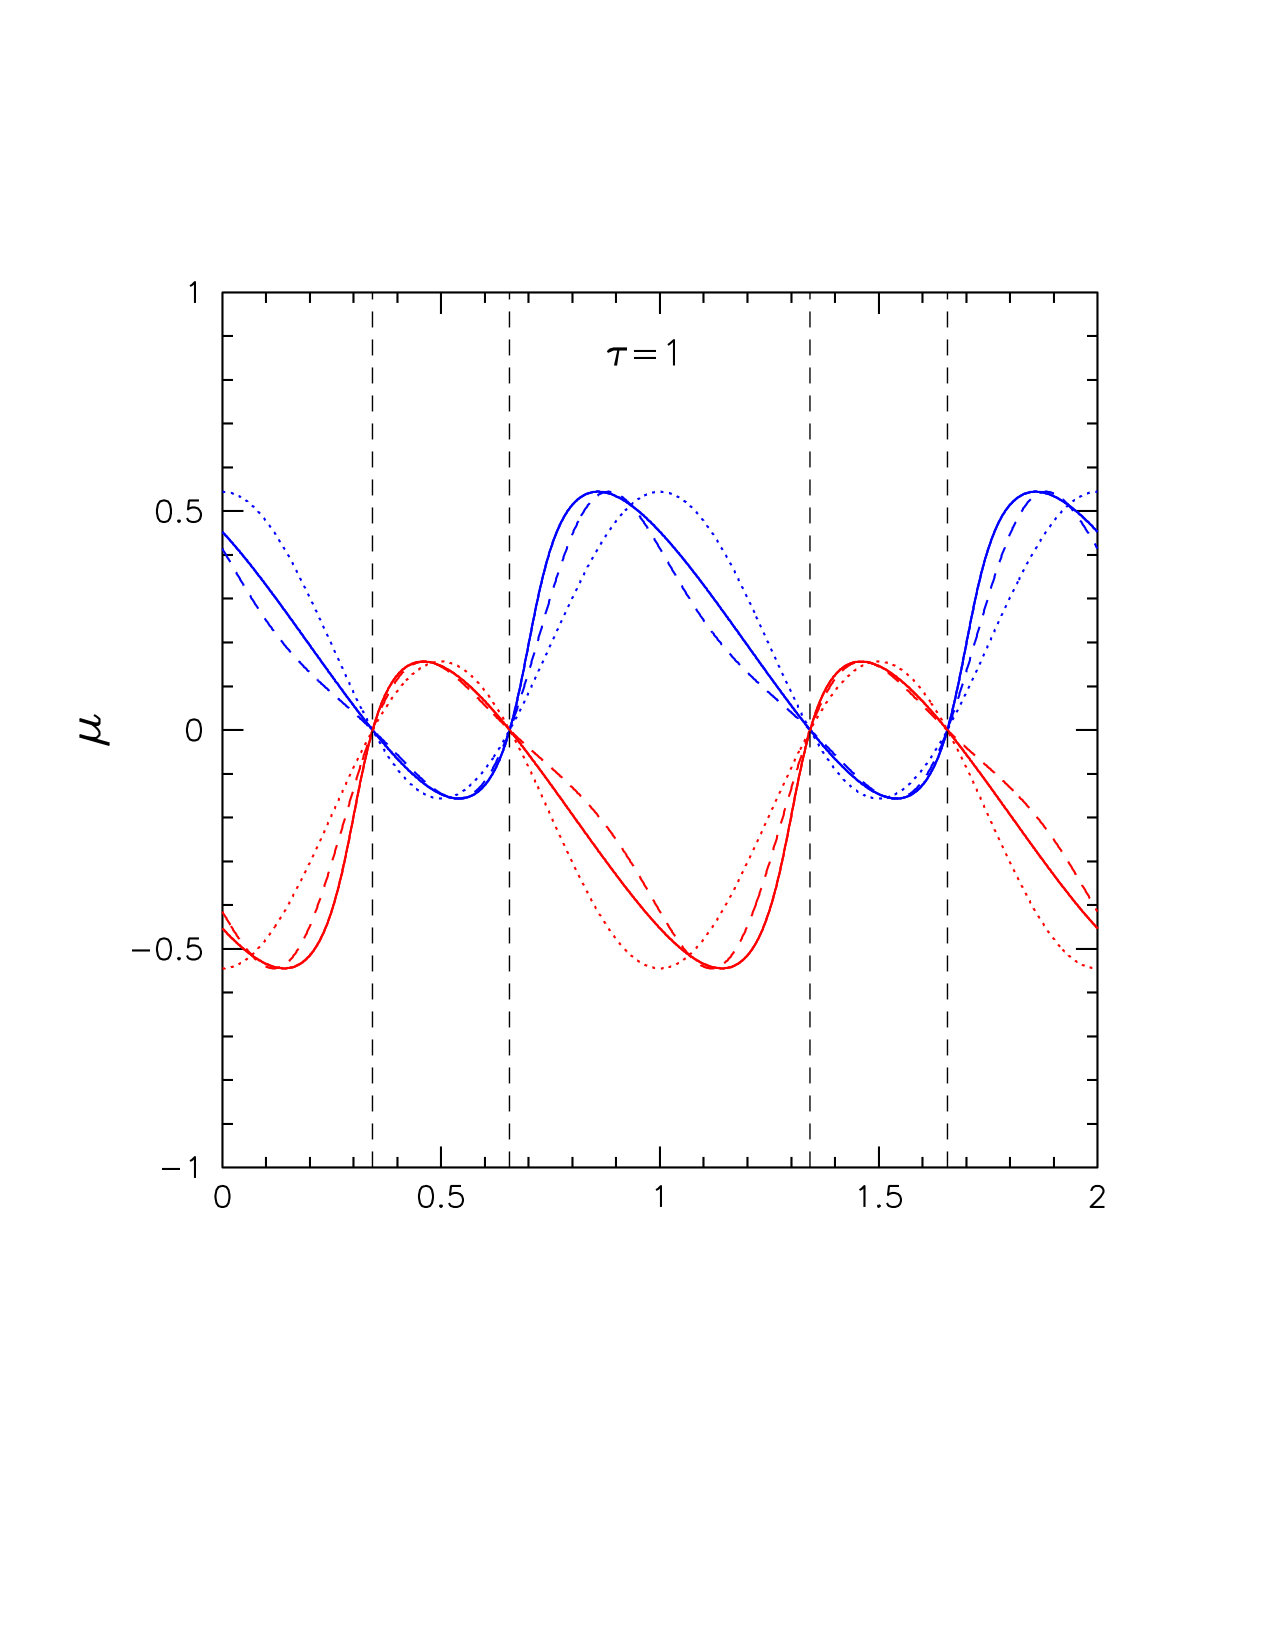 Figure 5
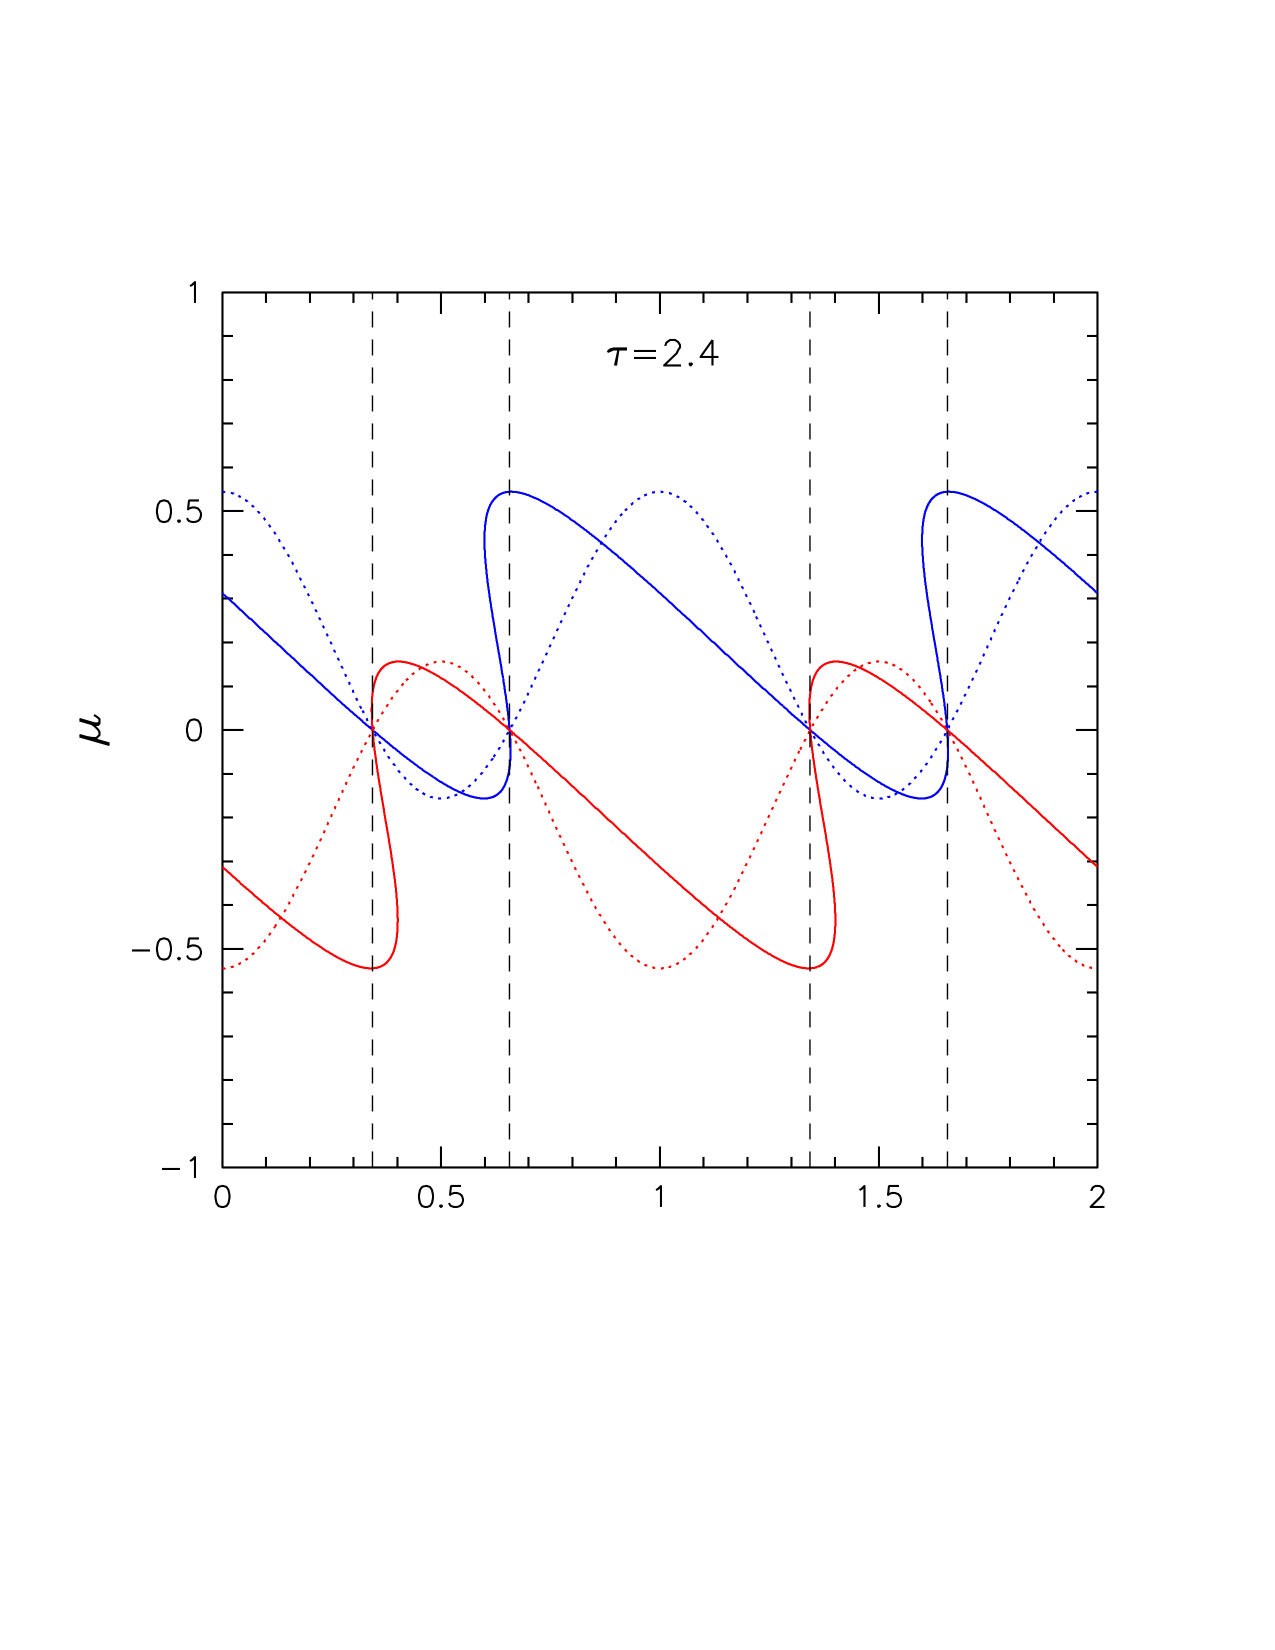 Figure 6
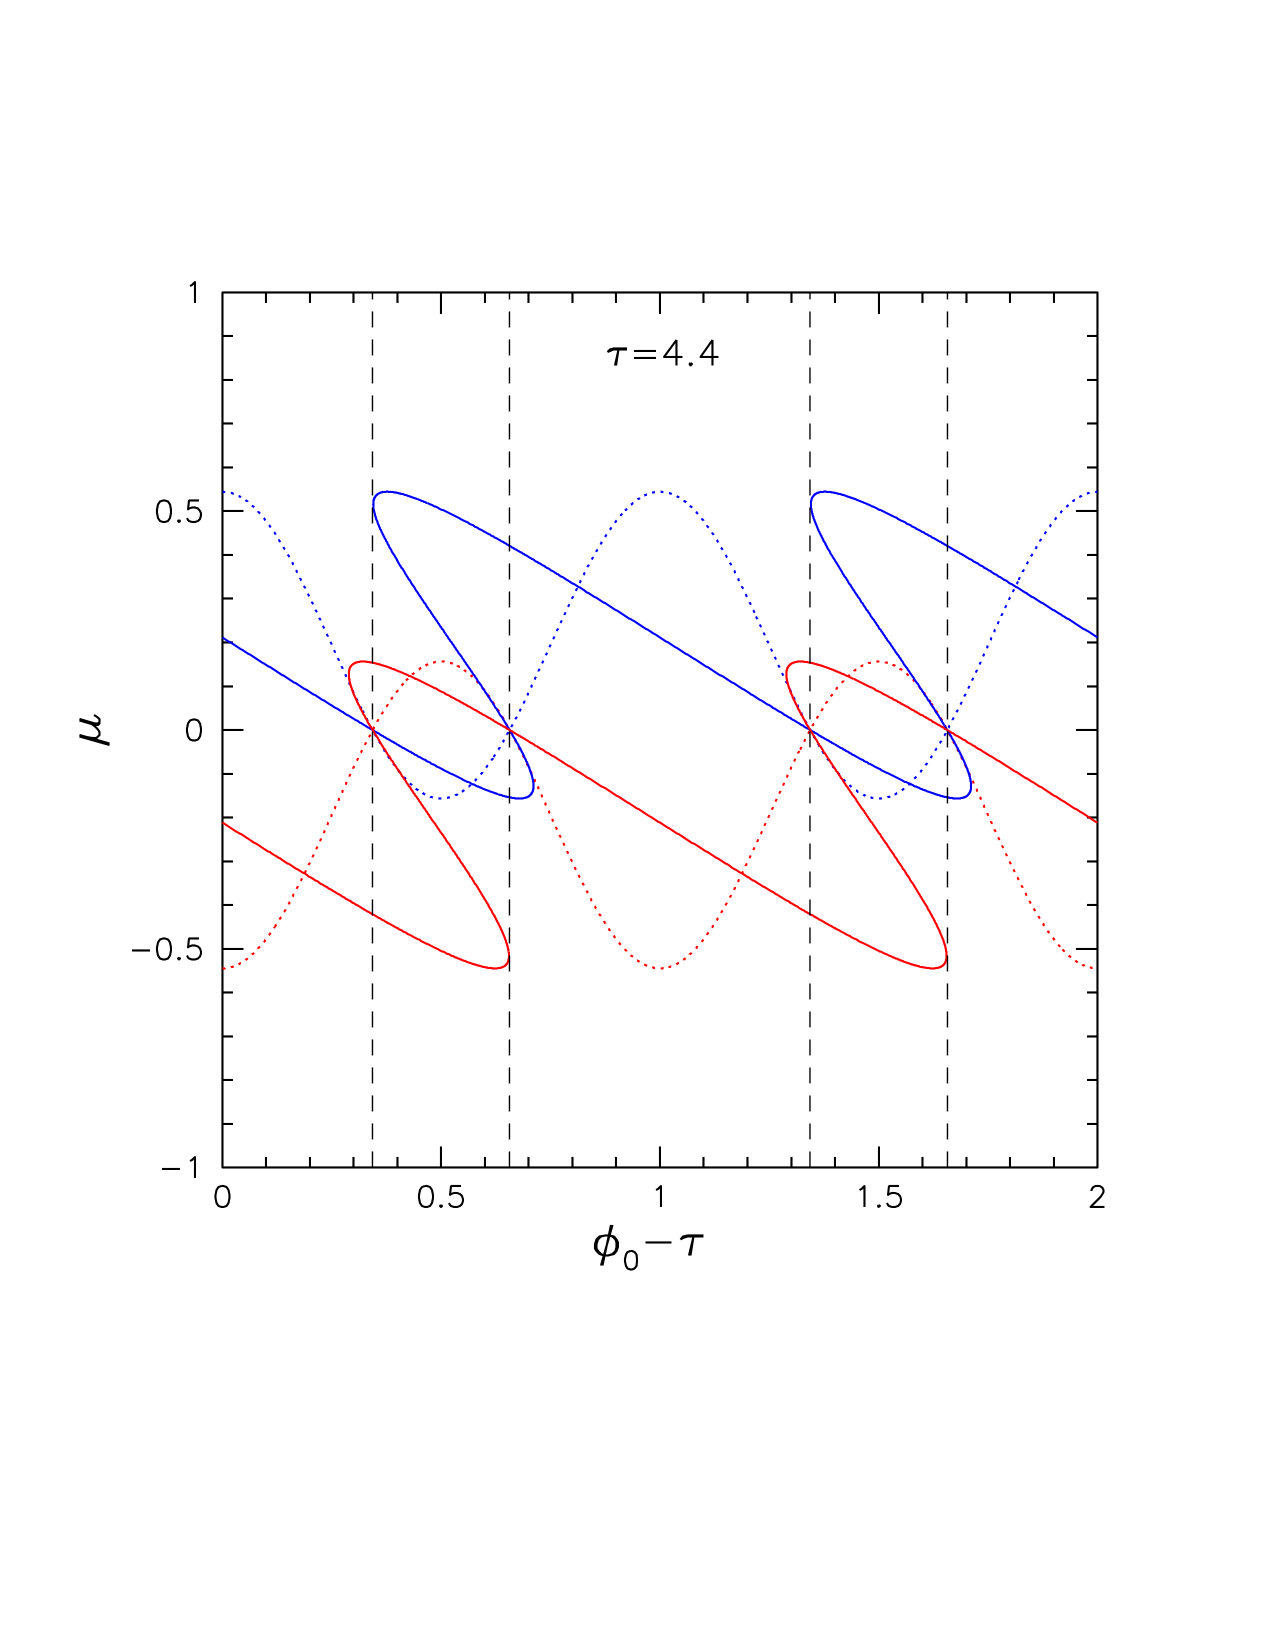 Figure 7
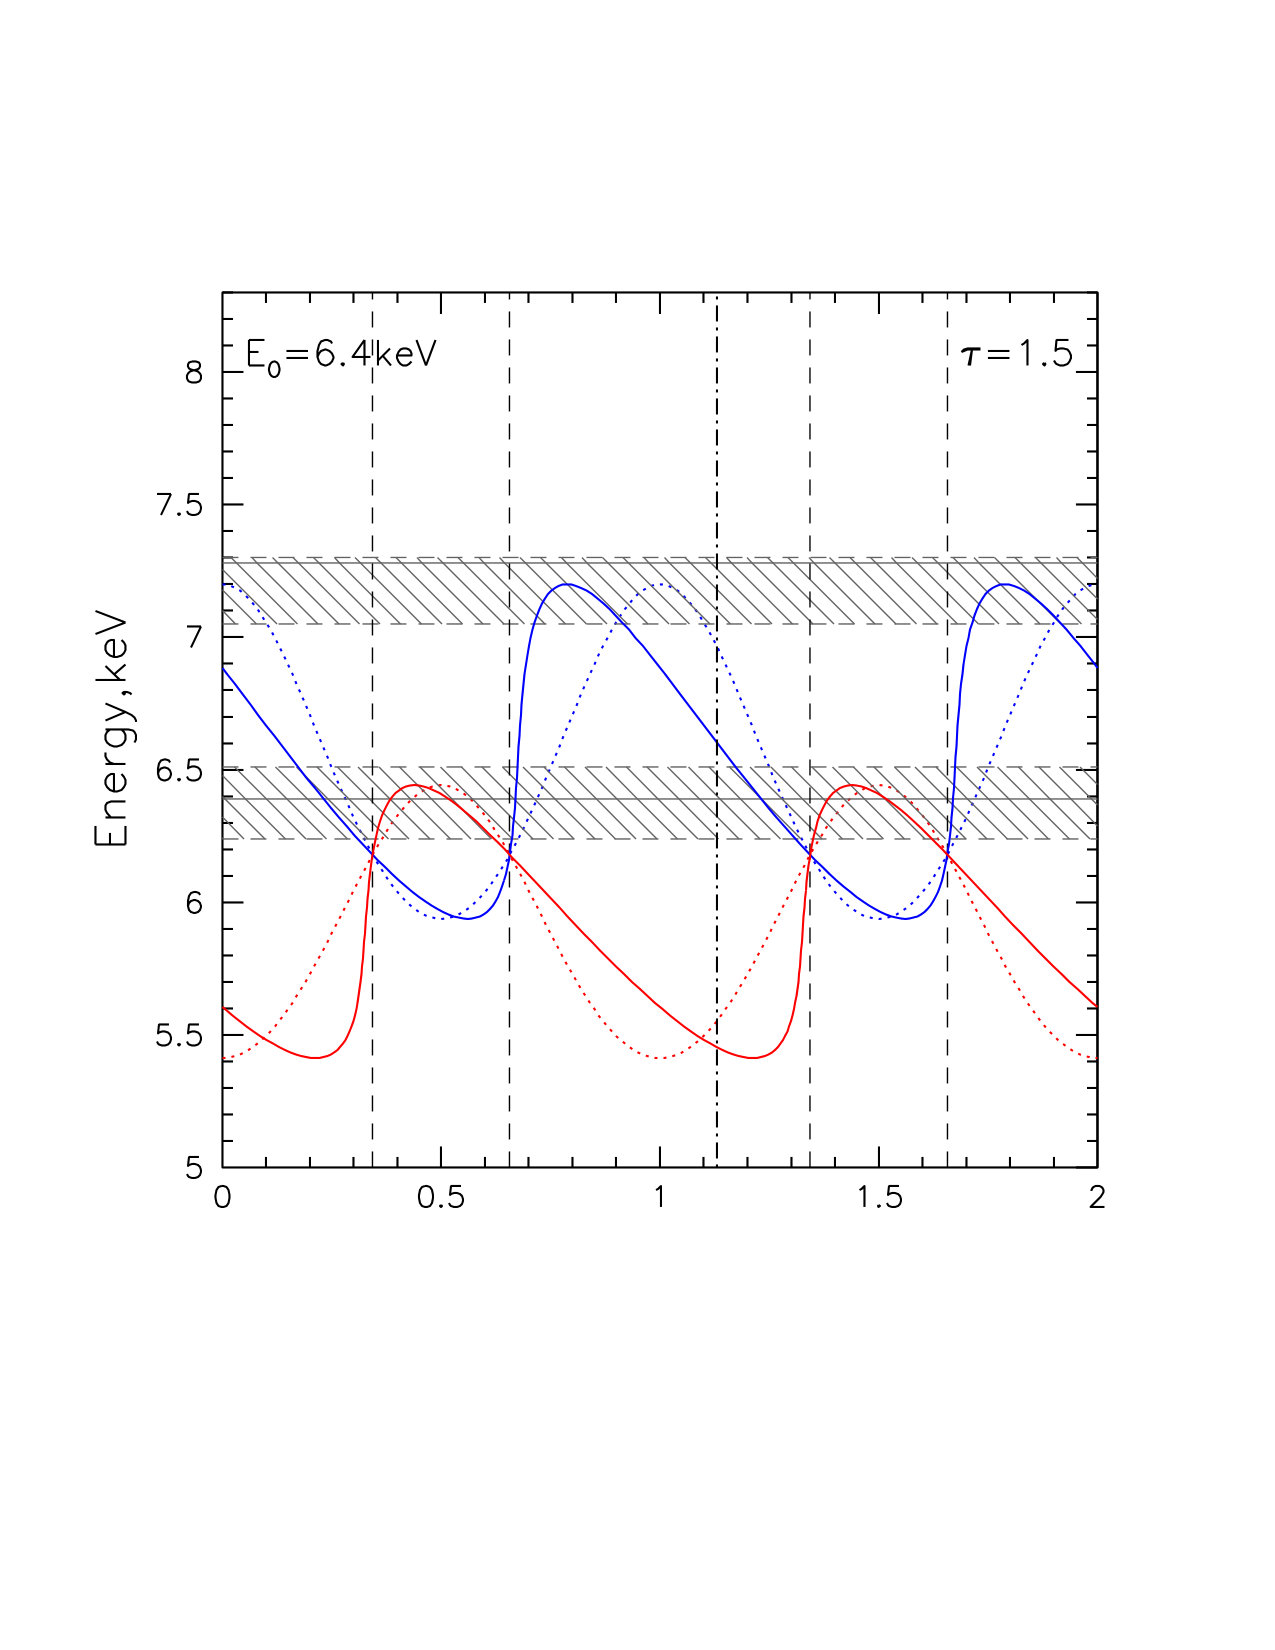 Figure 8
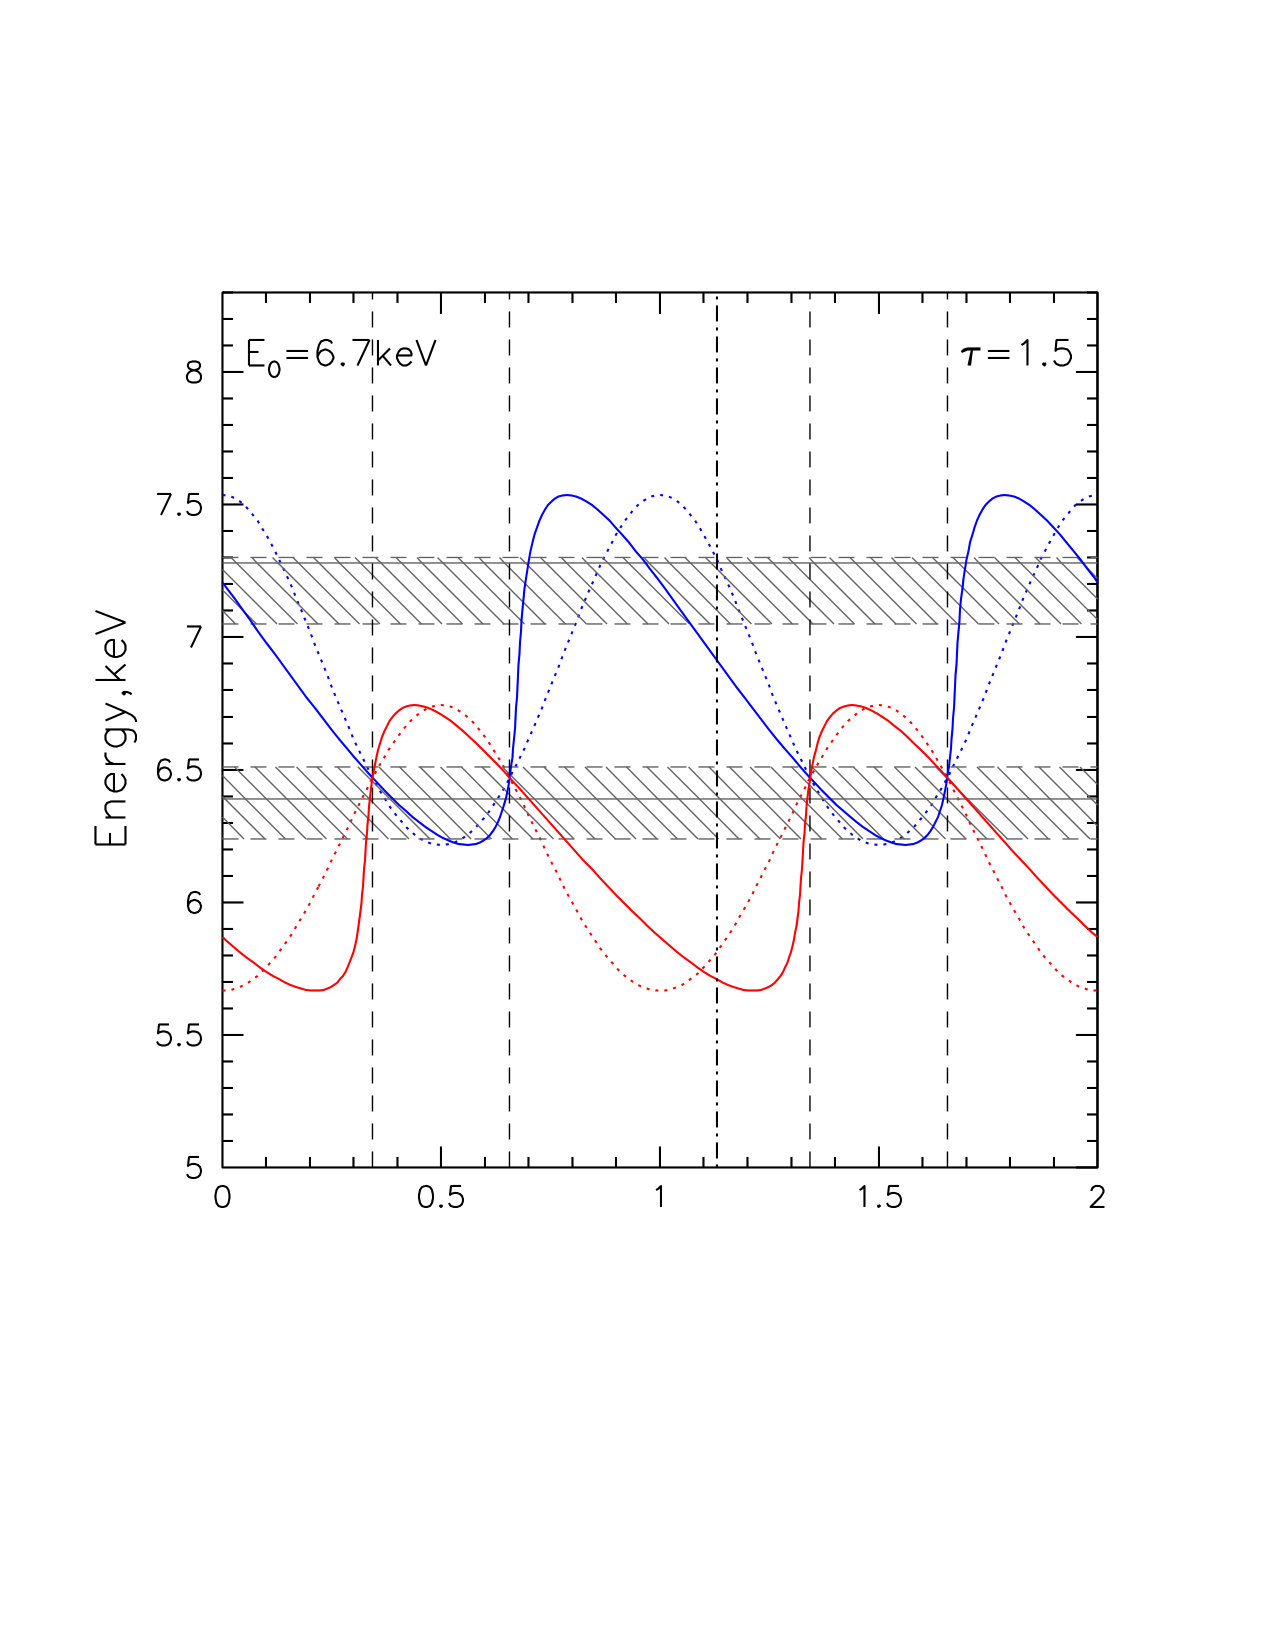 Figure 9
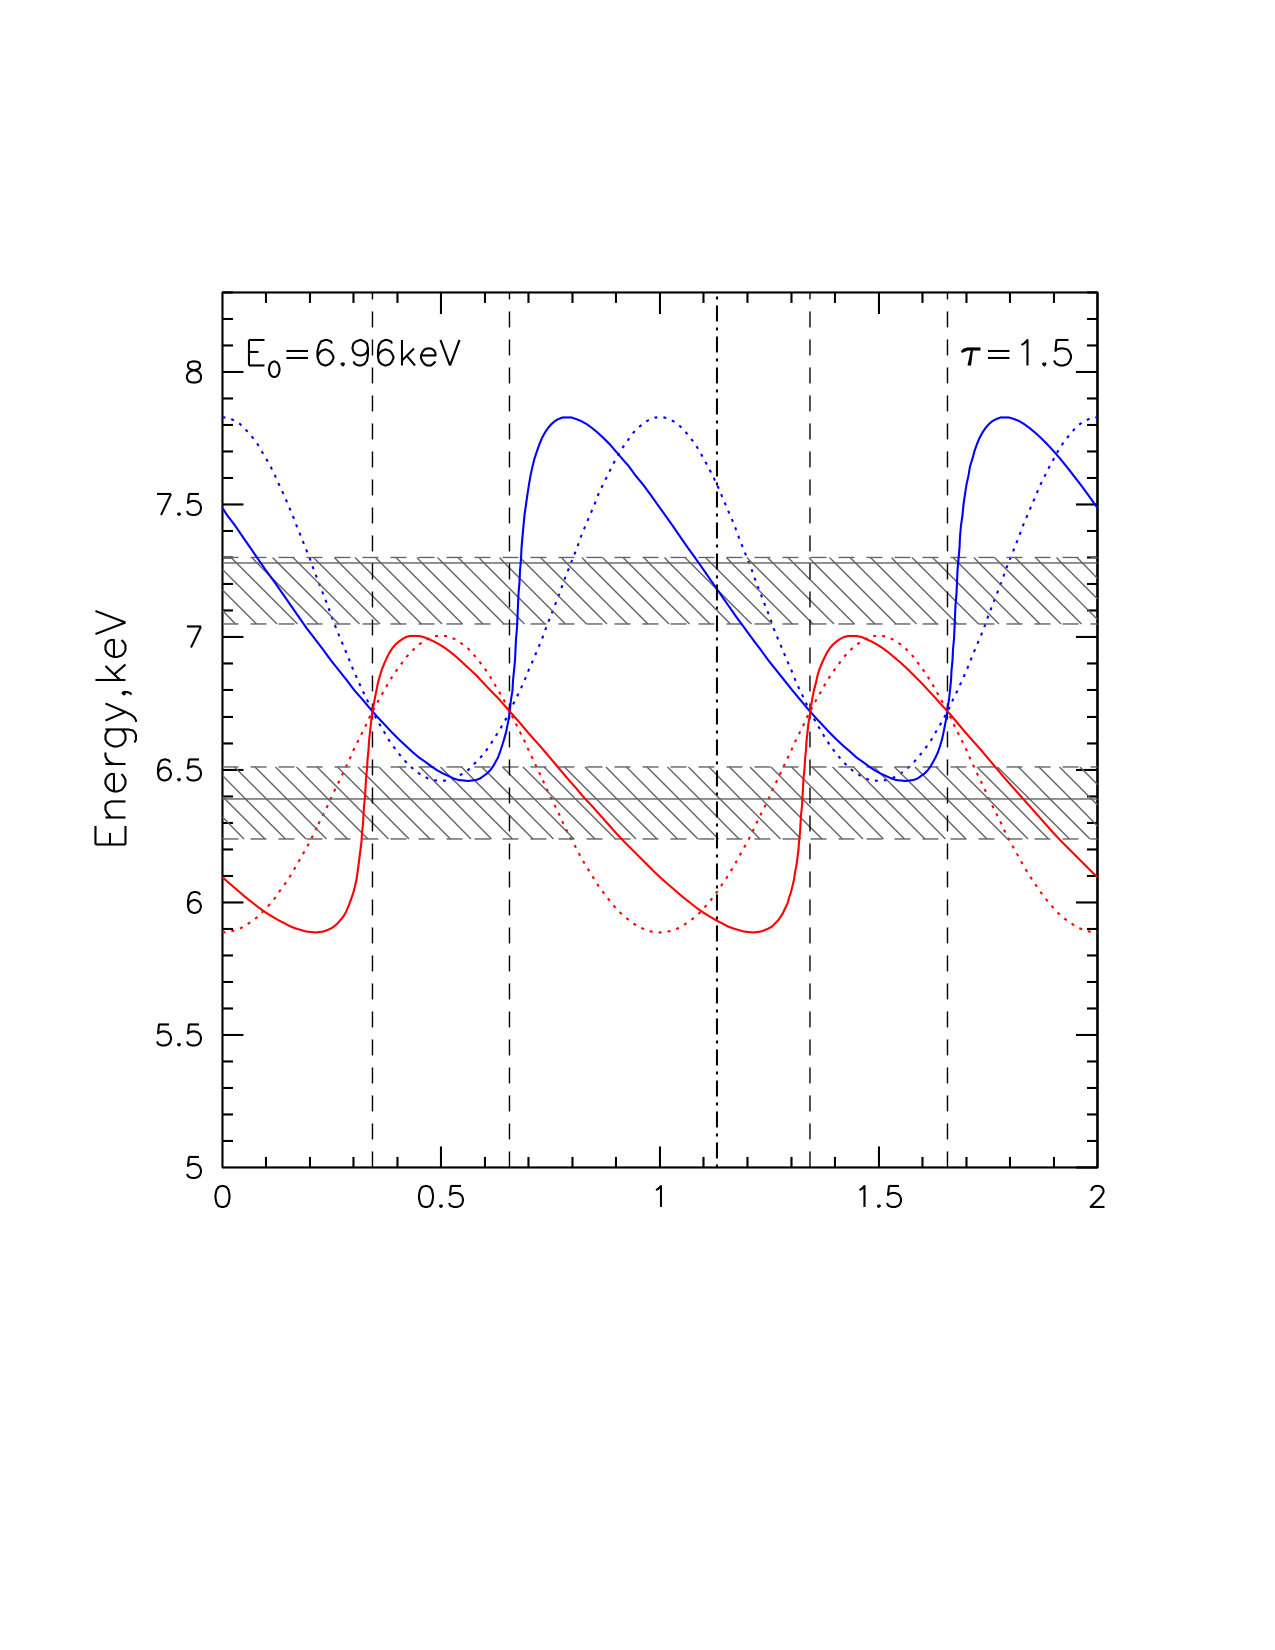 Figure 10
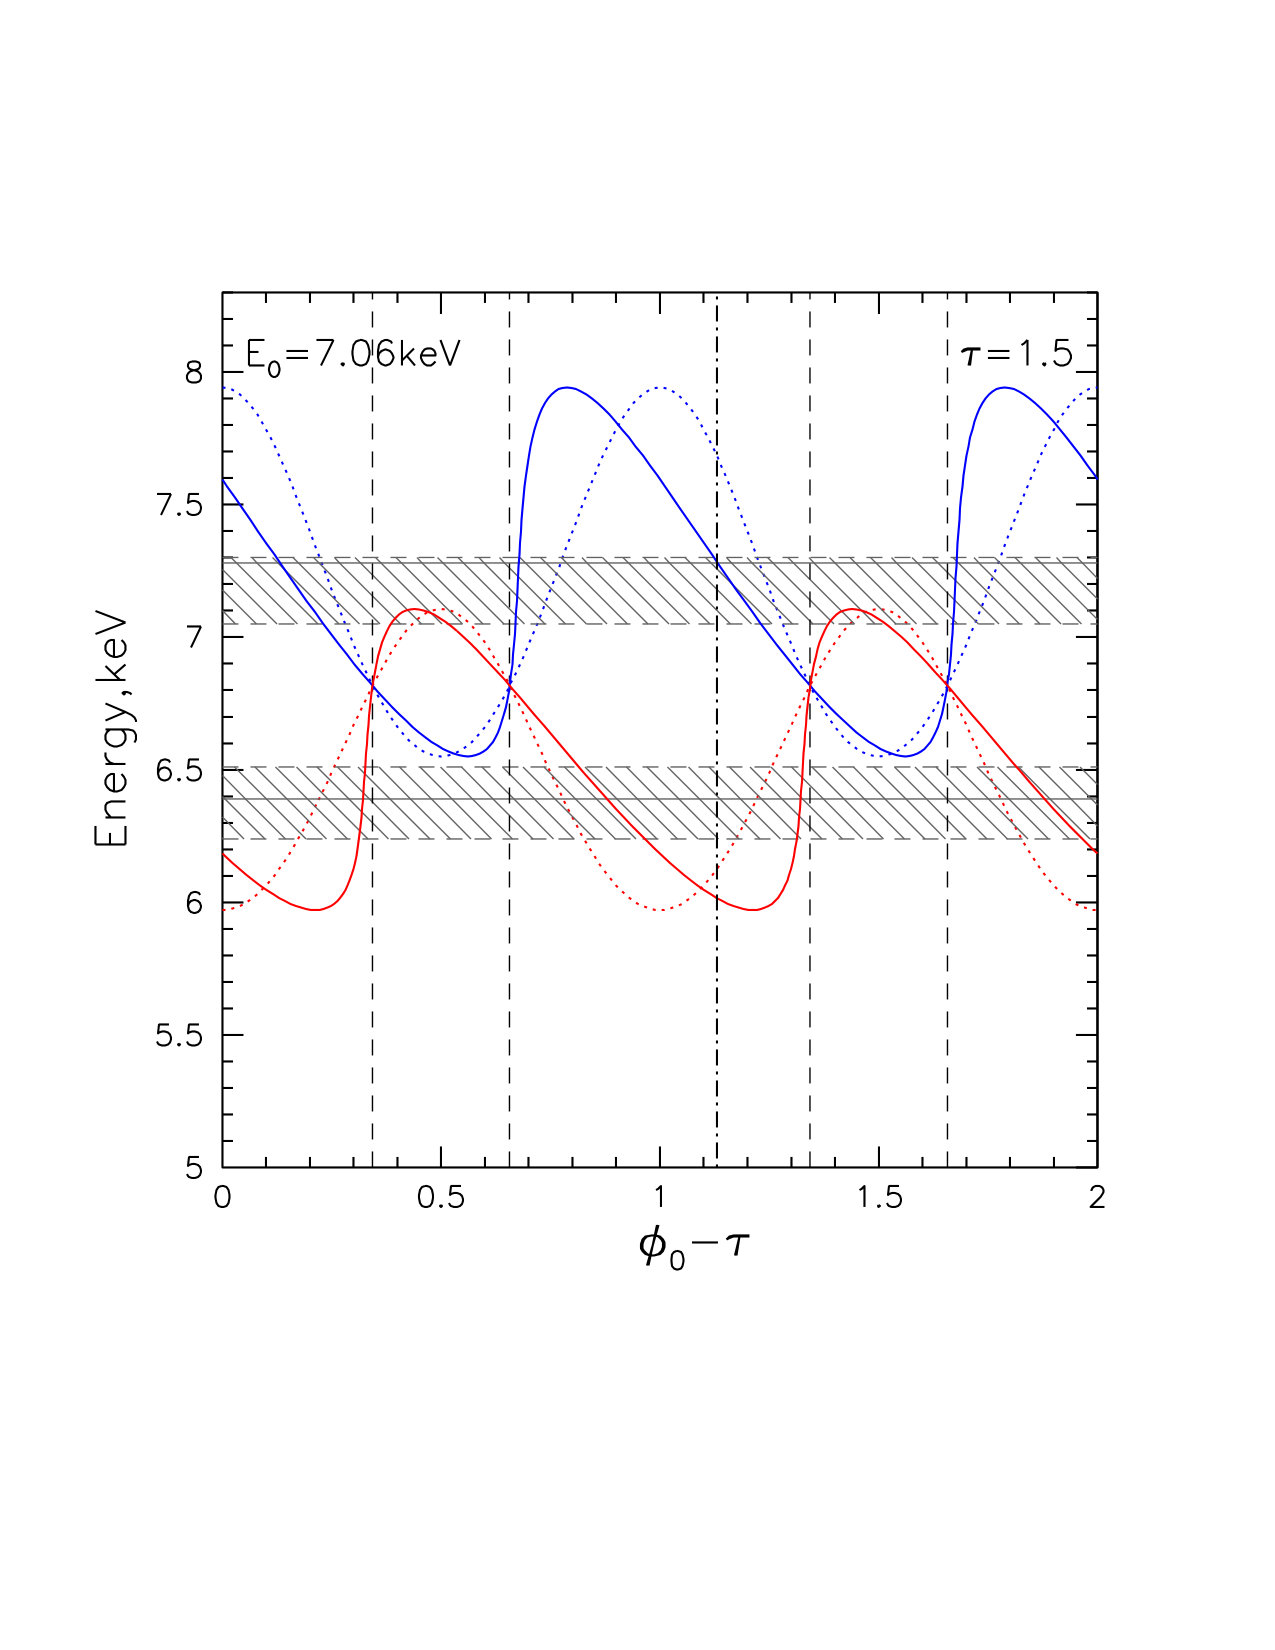 Figure 11
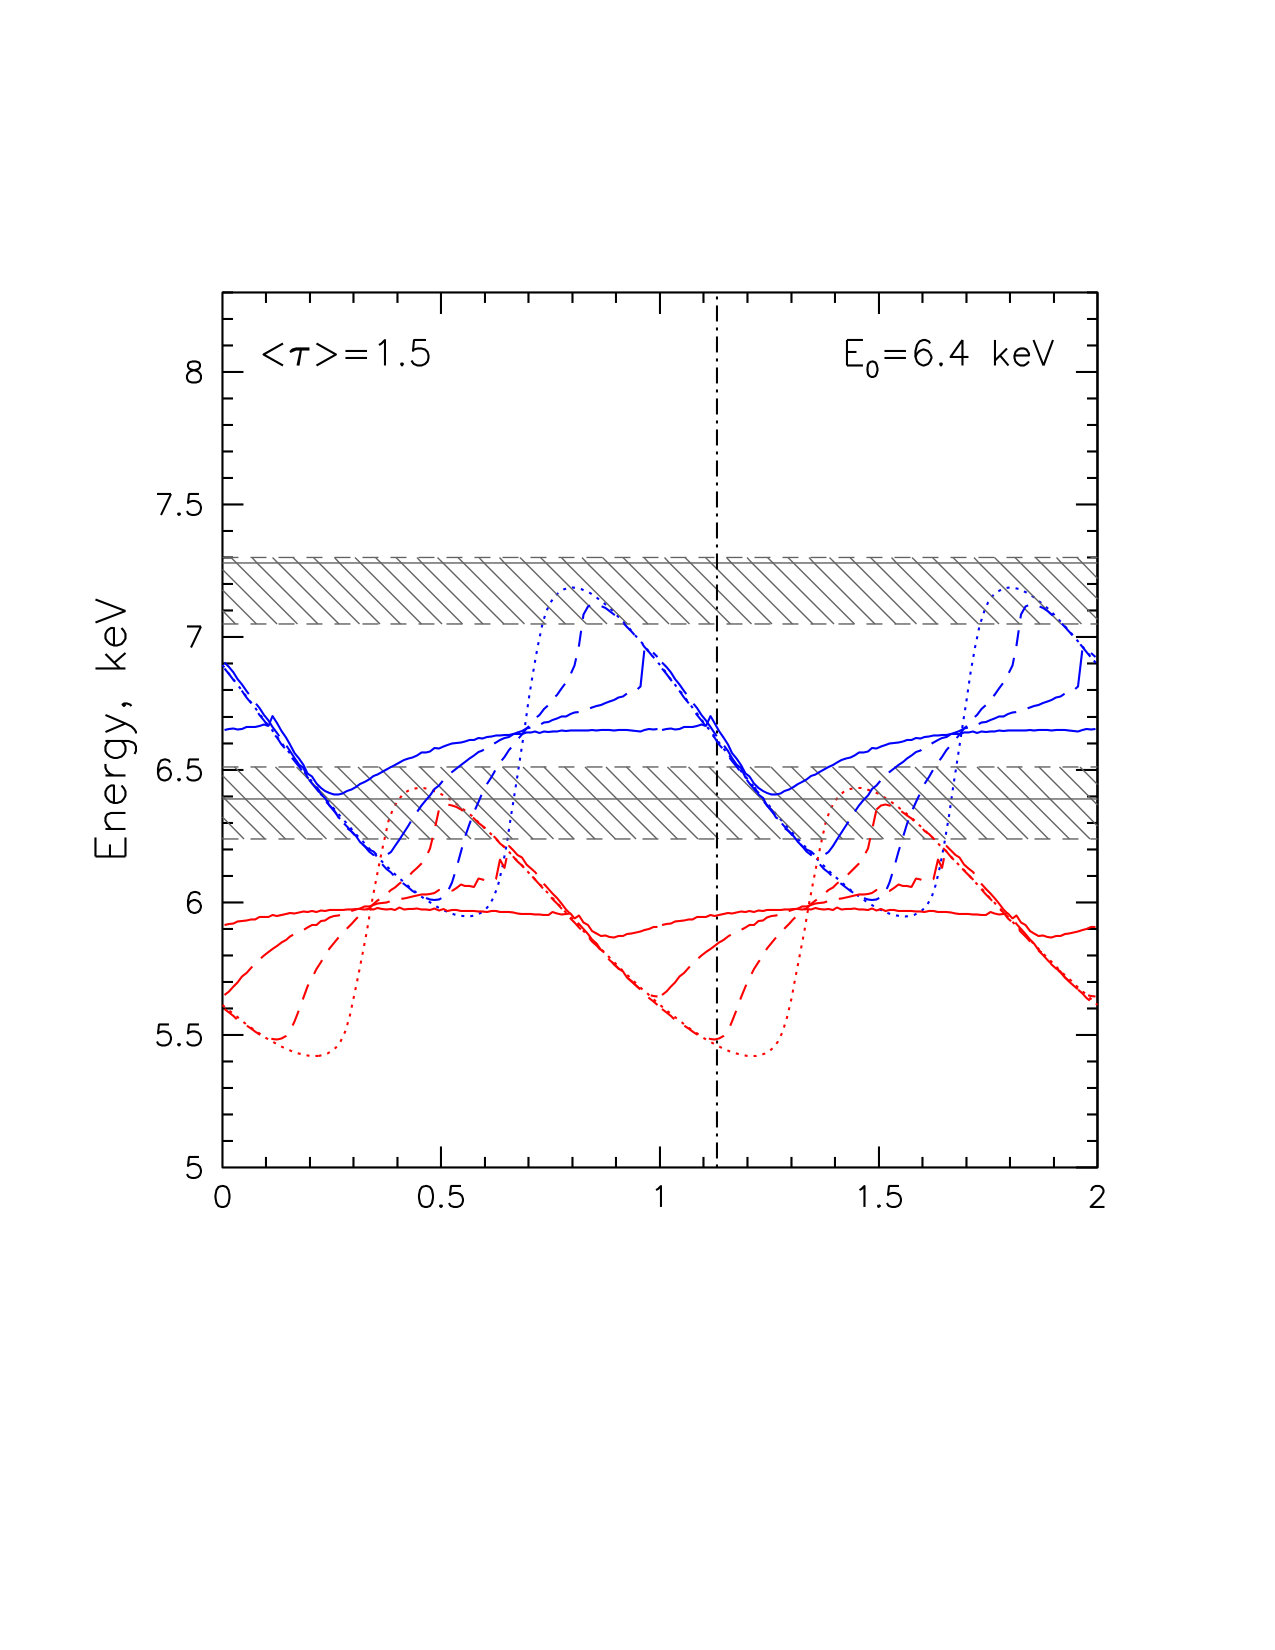 Figure 12
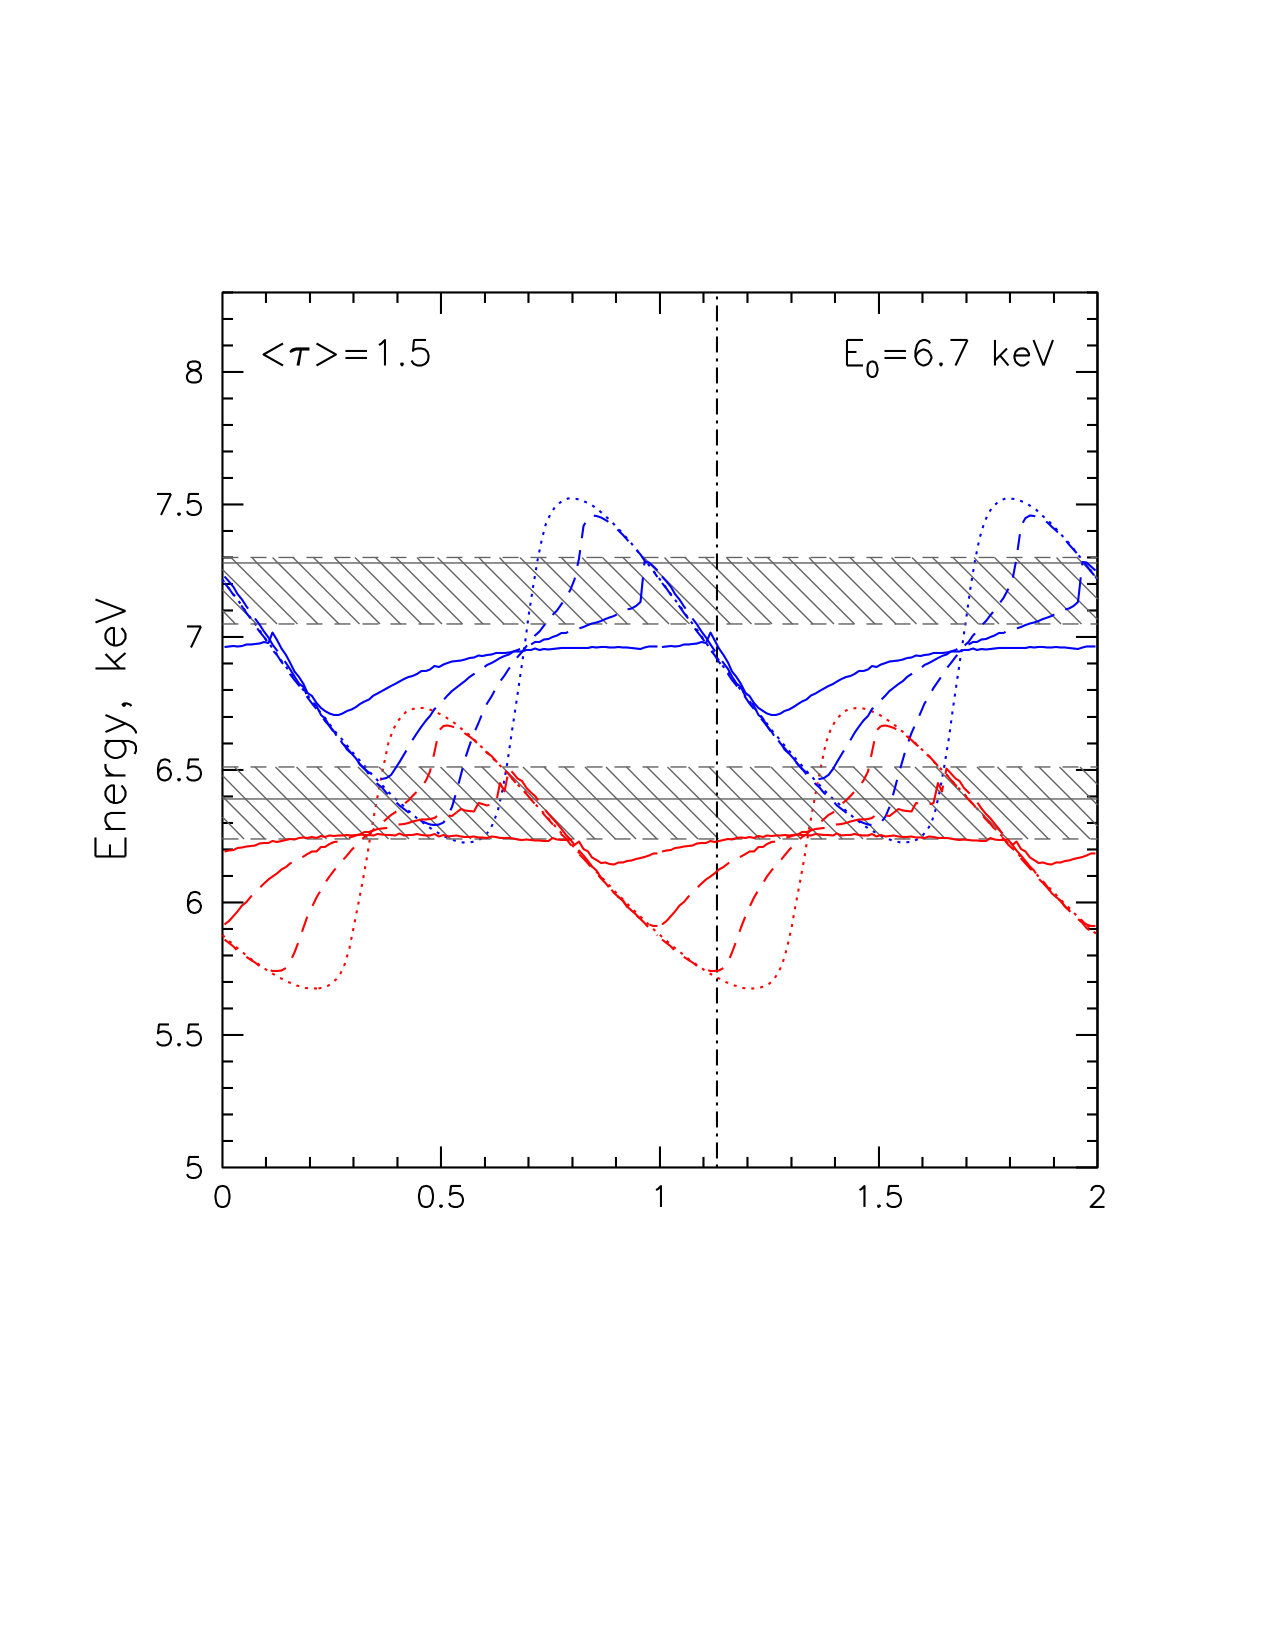 Figure 13
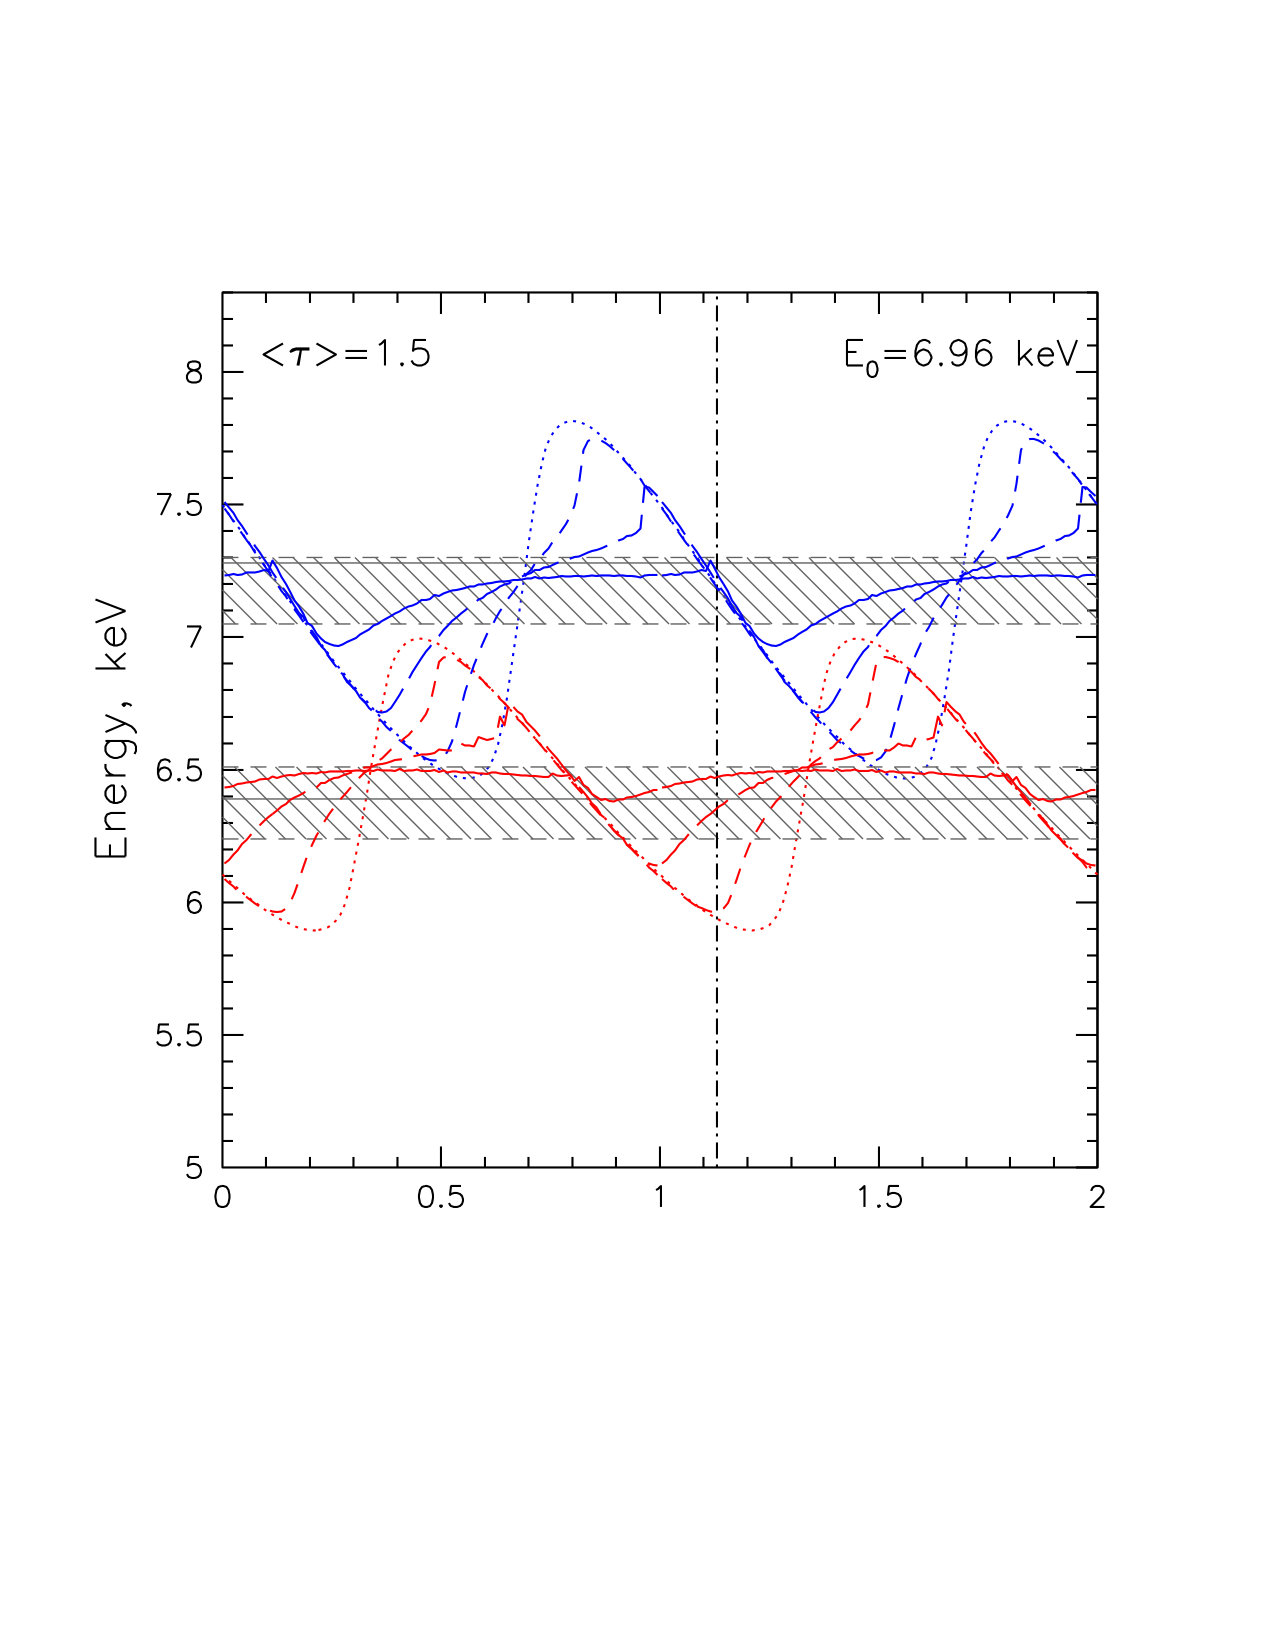 Figure 14
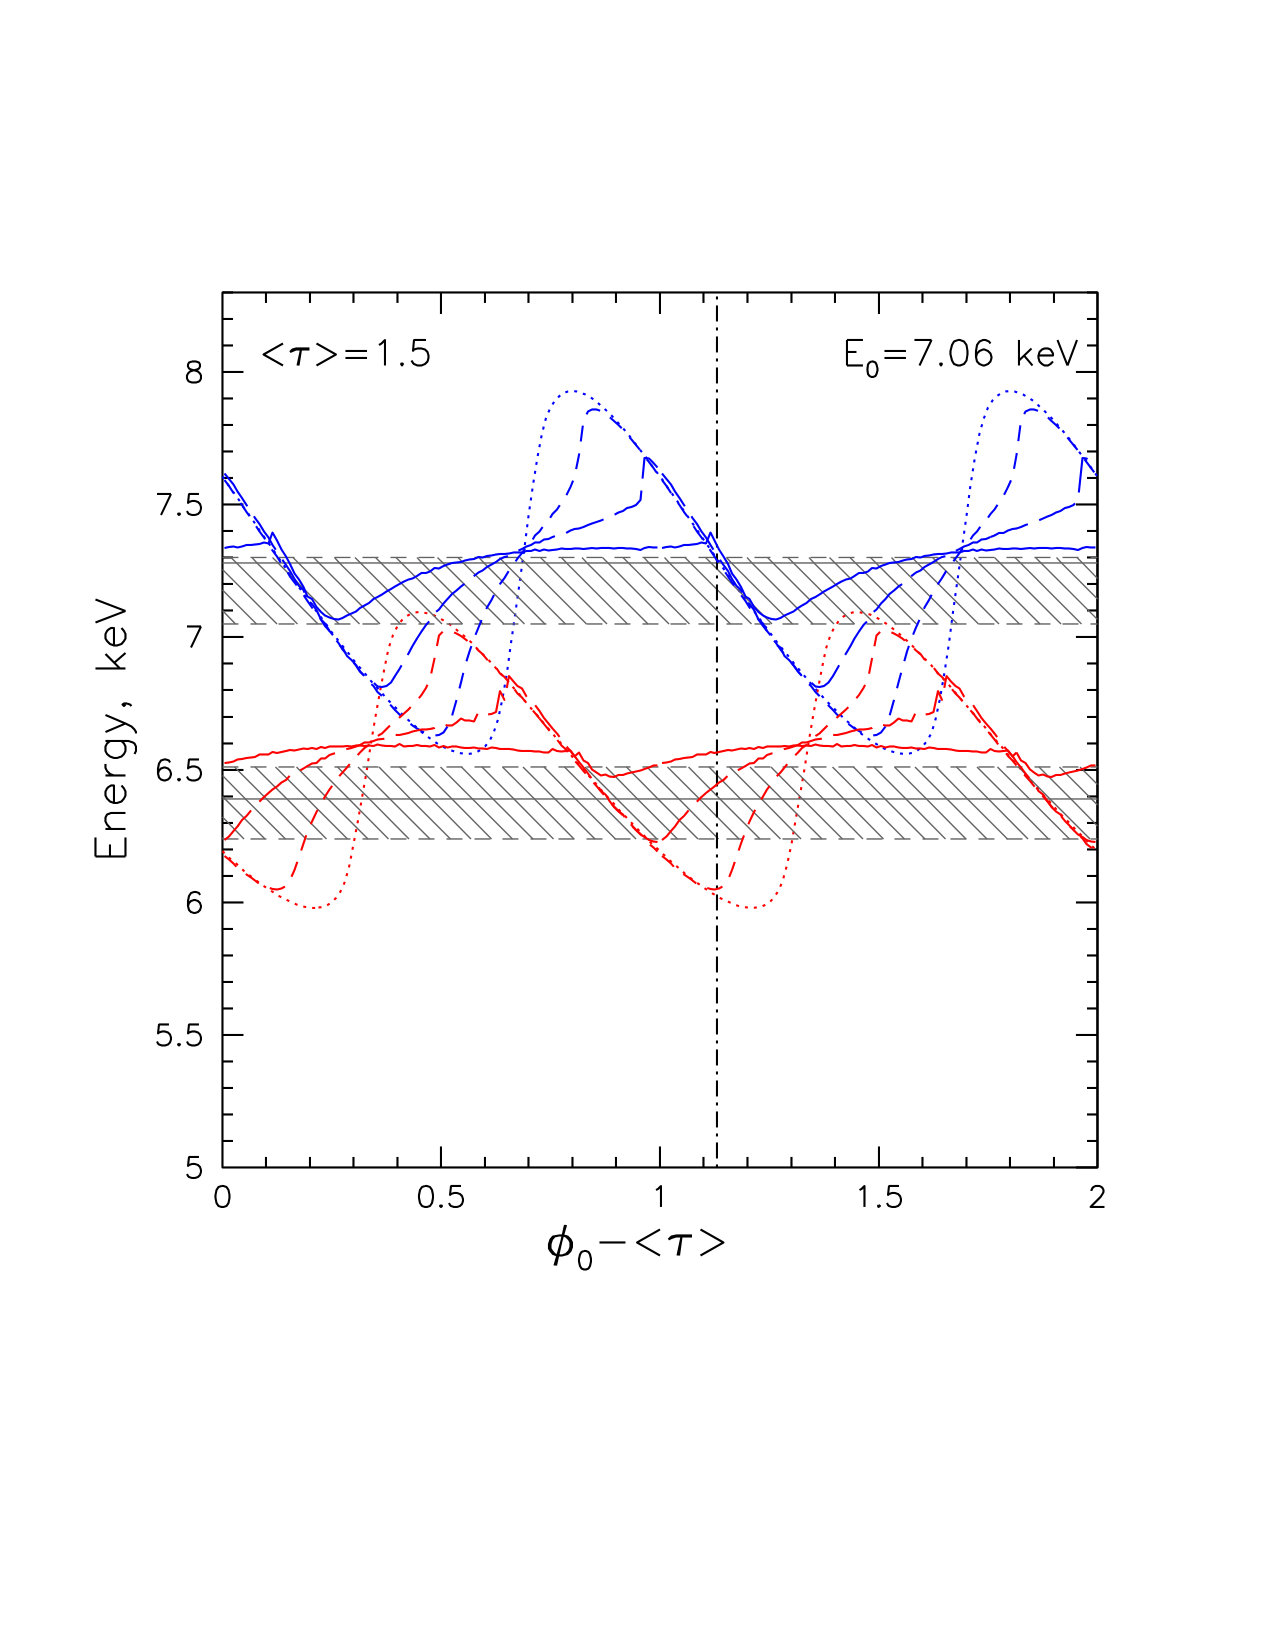 Figure 15
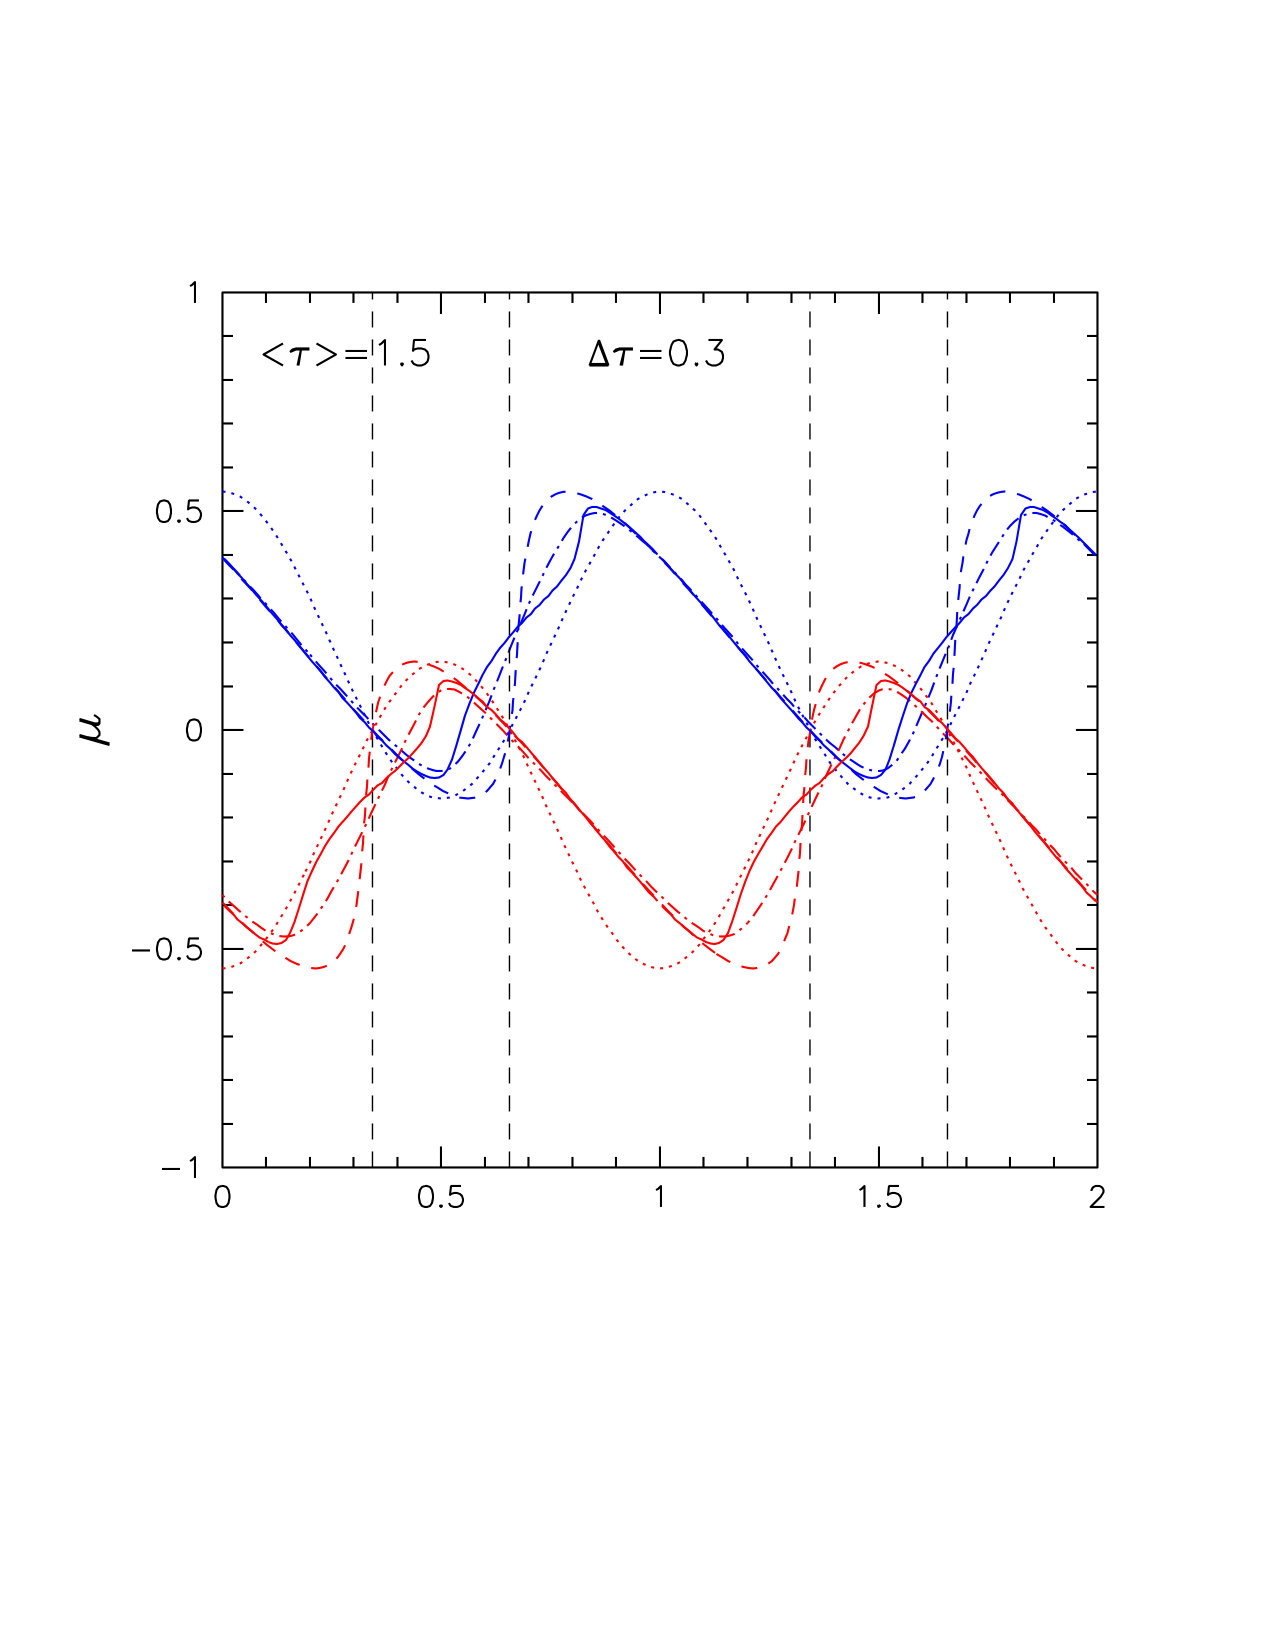 Figure 16
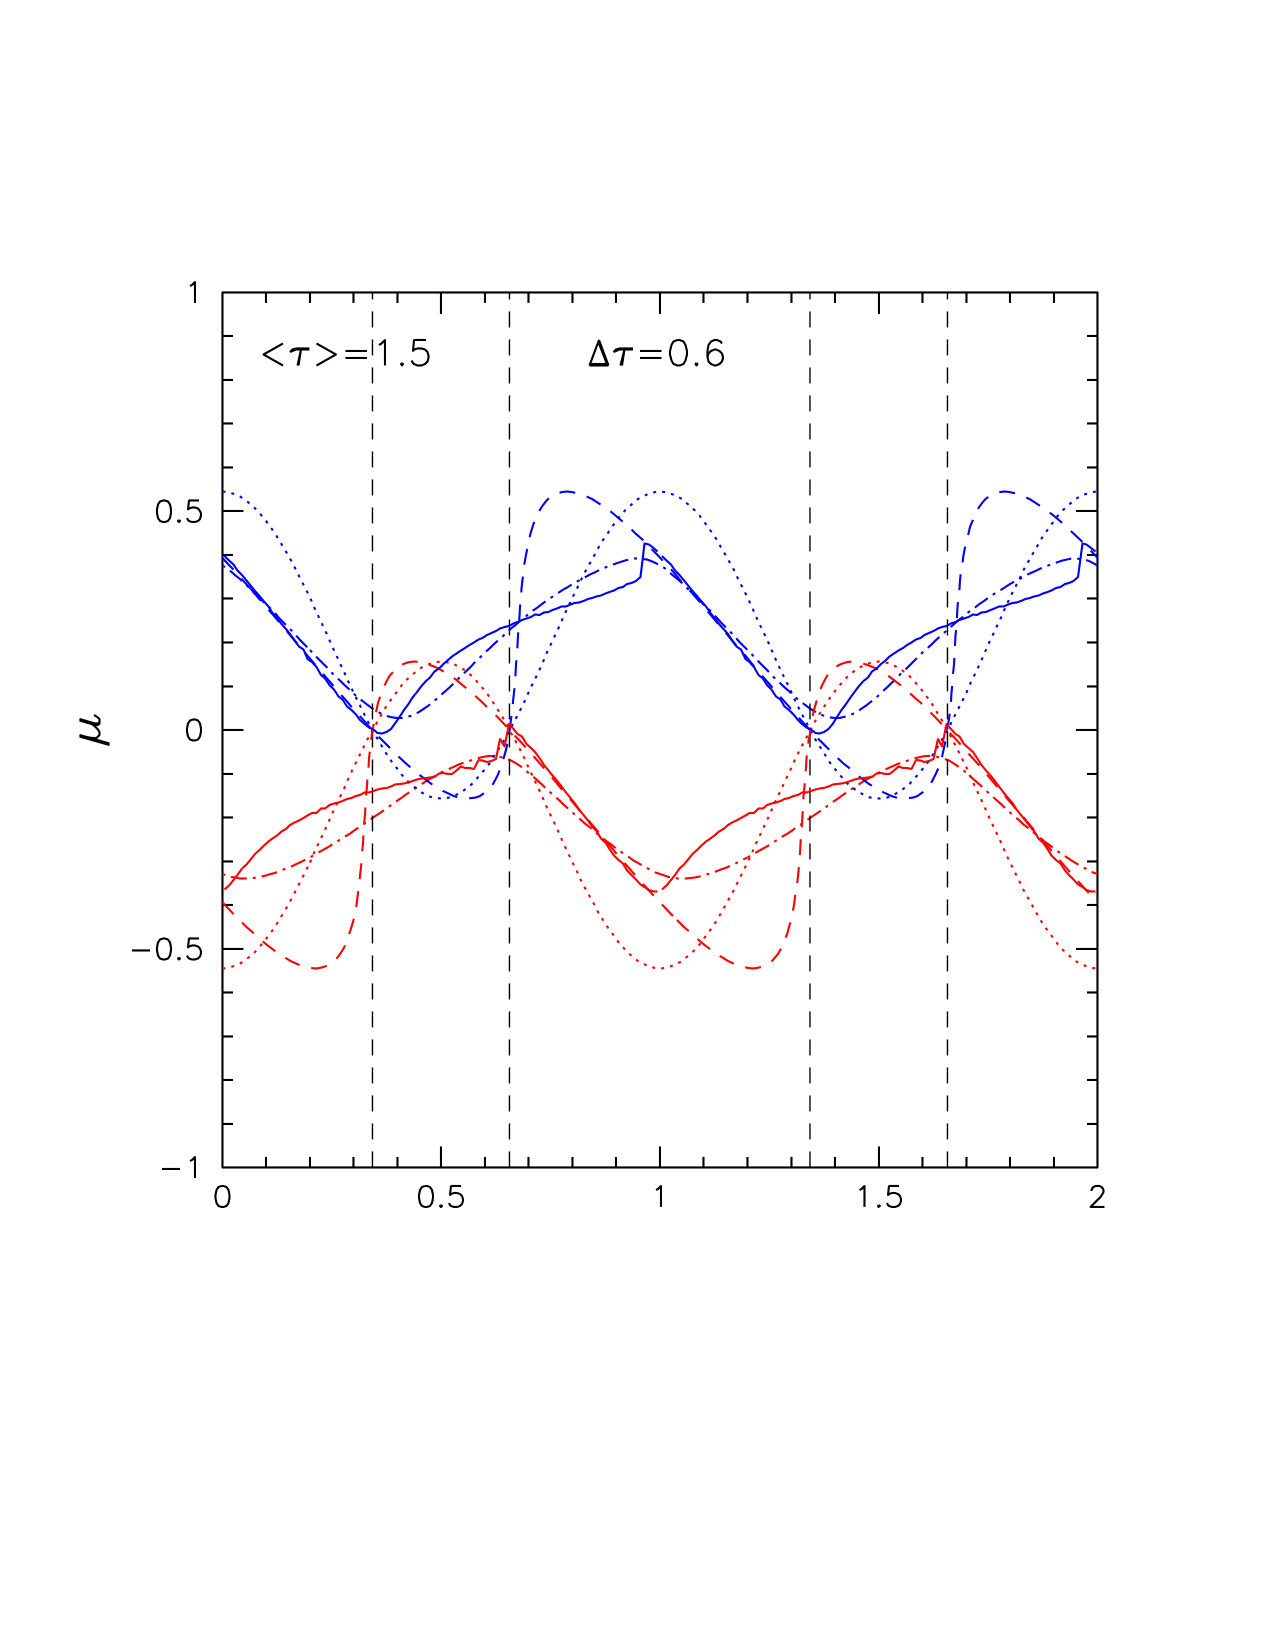 Figure 17
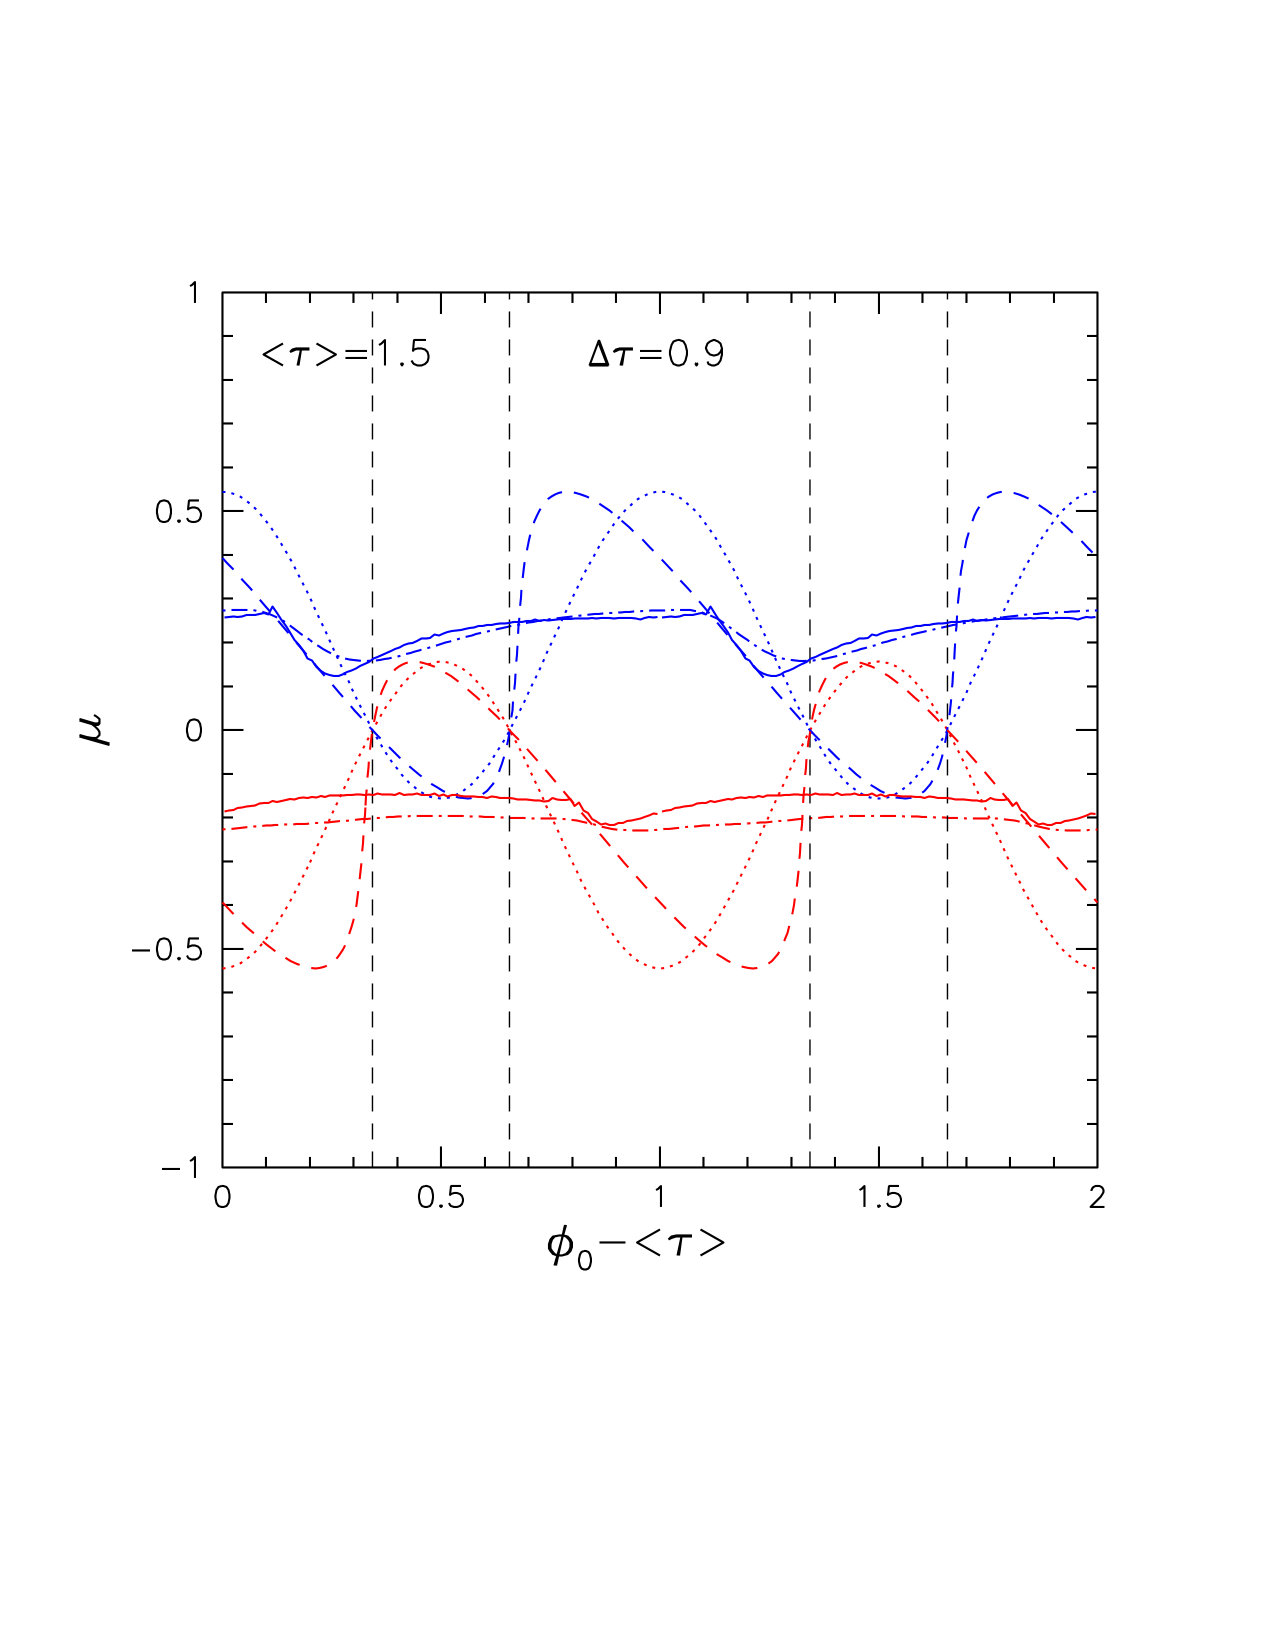 Figure 18
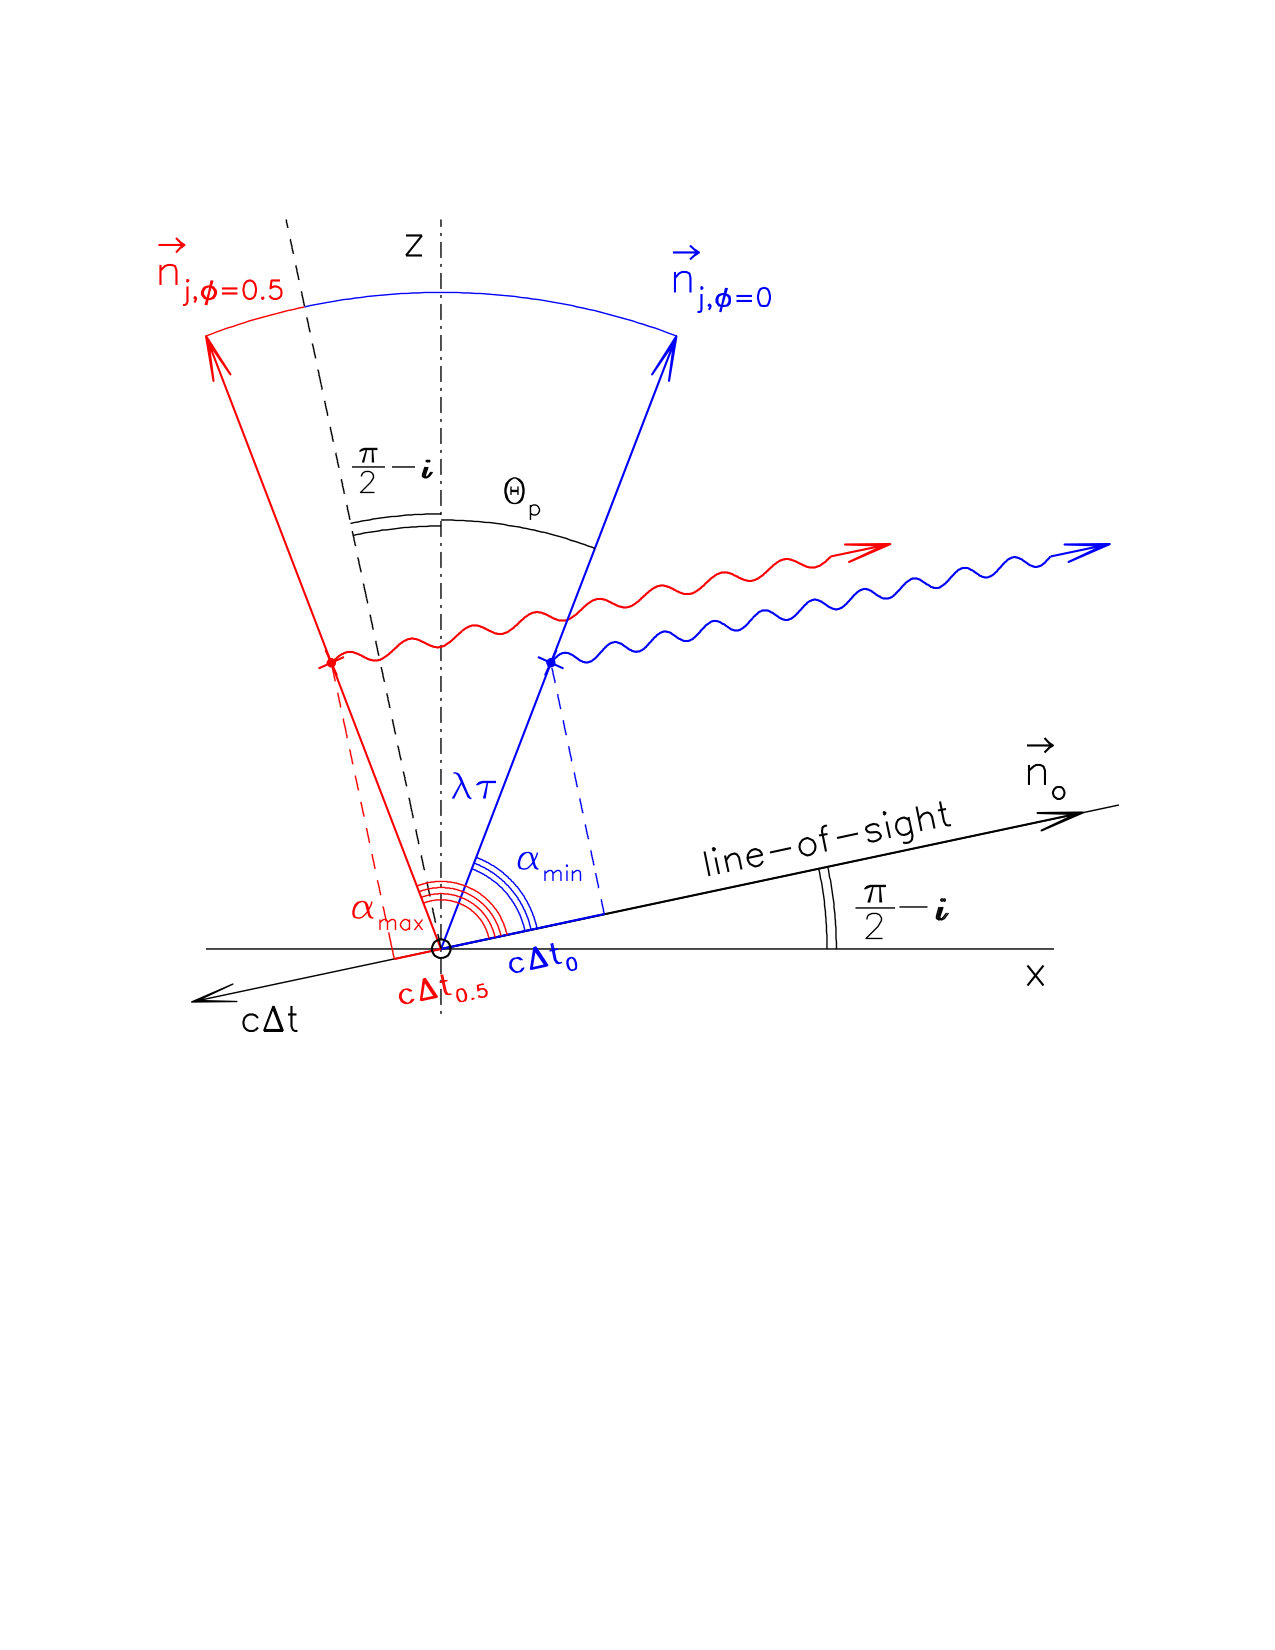 Figure 19
Peer Reviews
No public reviews on file for this paper yet. If you reviewed it on a platform where reviews are public (OpenReview, ICLR, NeurIPS, ICML), you can paste yours below so the community can read it here.
Videos
No videos yet. Explain this paper in a talk, walkthrough, or lecture? Add one.
Identification of X-ray lines in the spectrum of the arcsec-scale precessing jets of SS 433
**I. Khabibullin and S. Sazonov \addresstext1Space Research Institute, Russian Academy of Sciences, Moscow \addresstext2Max-Planck Institute for Astrophysics, Garching, Germany **
1,2
1
Аннотация
The extended X-ray emission observed at arcsec scales along the propagation trajectory of the precessing relativistic jets of the Galactic microquasar SS 433 features a broad emission line, with the position of the centroid being significantly different for the approaching and receding jets ( and keV, respectively). These observed line positions are at odds with the predictions of the kinematic model for any of the plausible bright spectral lines in this band, raising the question of their identification. Here we address this issue by taking into account time delays of the emission coming from the receding regions of the jets relative to that from the approaching ones, which cause a substantial phase shift and distortion of the predicted line positions for the extended ( cm) emission compared to the X-ray and optical lines observed from the central source (emitted at distances cm and cm, respectively). We demonstrate that the observed line positions are fully consistent with the Fe XXVI Ly ( keV) line emerging from a region of size cm along the jet. This supports the idea that intensive reheating of the jets up to temperatures keV takes place at these distances, probably as a result of partial deceleration of the jets due to interaction with the surrounding medium, which might cause collisions between discrete dense blobs inside the jets.
\englishkeywords
black holes, accretion, jets, SS 433
\submitted
November 7, 2016
1 Introduction
The most unique property of the Galactic microquasar SS 433 is continuous launching of the highly collimated (with the opening angle \Theta_{j}\approx 1.5$${}^{\circ}\leavevmode\nobreak\), mildly relativistic (with the bulk velocity ), baryonic (i.e. composed of atoms of hydrogen, helium and heavy elements with the relative proportion close to the solar one) jets, which reveal themselves via Doppler-shifted optical and X-ray emission lines detected in the spectrum of the unresolved core of the system (see Fabrika (2004) for a review). The Doppler shifts of the lines periodically vary with time in accord with the kinematic model (Abell & Margon, 1979; Fabian & Rees, 1979; Milgrom, 1979) postulating that the jets undergo precessional motion about an axis inclined at 78{}^{\circ}\leavevmode\nobreak\relative to the line of sight with half-amplitude 21{}^{\circ}\leavevmode\nobreak\and period days (Eikenberry et al. 2001).
Apart from the unresolved core, the presence of the jets is clearly traced by radio emission at distances from milliarcseconds (e.g. Marshall et al. (2013)) to a few arcseconds, where it forms a remarkable ’corkscrew’ pattern generally consistent with the prediction of the kinematic model (e.g. (Miller-Jones et al., 2008)), albeit with slight deflections that might be caused by the interaction of the jets with the surrounding medium (Panferov, 2014). Further away, however, the jets stay invisible up to arcminute scales, where extended X-ray emission, which probably has relation to their propagation through the interstellar medium (ISM), is observed (Brinkmann, Kotani, & Kawai, 2005), and then they appear to be terminated at the boundary of the surrounding radio nebula W50 (Dubner et al., 1998), giving rise to its severe deformation (Goodall, Alouani-Bibi, & Blundell, 2011) and bright X-ray emission from the supposed termination region (Brinkmann, Aschenbach, & Kawai, 1996).
Thanks to the excellent angular resolution of the Chandra X-ray observatory ( arcsec), Marshall, Canizares, & Schulz (2002) have discovered extended X-ray emission at a distance of the order of one arcsec from the central source, coming from regions coincident with the jets’ propagation trajectory as traced by the radio emission observed at the same angular scales. Moreover, in further observations, oppositely Doppler-shifted emission lines were detected in the spectra of the (on average) approaching (hereafter the ’blue’ jet) and receding (hereafter the ’red’ jet) jets, with the lines’ centroids at keV and keV, respectively (Migliari et al., 2002), which indicates that the lines originate in the material of the jets, still moving at a mildly relativistic speed.
However, the exact identification of these lines remains elusive: using simulations of the line emission of the extended jets averaged over a precession period, Migliari et al. (2002) argued that the rest-frame energy of the lines could be 7.06 keV. In such a case, however, the line should be identified with the Fe I line of neutral iron rather than with the Fe XXV line (7.89 keV) of highly ionized iron, as suggested by Migliari et al. (2002). While the presence of the Fe XXV line is a clear indication of hot ( few keV) plasma, the Fe I line arises as a result of fluorescence following inner shell ionization of neutral iron atoms by X-ray photons or by interaction with energetic particles. The ambiguity in the line identification leaves open the question about the mechanism of production of the extended X-ray emission at arcsec scales, corresponding to distances of order cm from the central source.
In this paper, we address the identification issue of the extended emission lines taking into account time delays between signals coming from different parts of the precessing jets due to finite light propagation speed, which prove to be important in predicting the line positions for radiation emitted at distances of order cm from the central source, in contrast to the well-known X-ray and optical lines emitted at cm and cm, respectively (see Fabrika (2004)). Indeed, at distances , the time delay between different regions of the jets can reach days, which corresponds to a significant precession phase shift of for the observed emission. This effect is also important and has previously been taken into account for modelling images and variability of the radio emission observed at the same angular scales (see e.g. Bell, Roberts, & Wardle (2011) and references therein).
As a simplest scenario, we may assume that the arcsec X-ray line emission is produced at some specific distance from the central source or, equivalently, at some specific instant after launch of the emitting blob from the jet’s core. As gets larger, the observed line positions will increasingly deviate from the ones predicted by the kinematic model without accounting for light-travel-time effects, eventually leading to ambiguity in the predicted line positions due to simultaneous arrival of emission from different parts of the jet. This will further lead to broadening and brightening of the observed emission line if the emission is unresolved spatially and spectrally.
In a more complicated scenario, the X-ray lines are radiated over a range of distances (or delays after launch) from the central source, and the observed line positions are determined by properly averaging over the whole emitting region. In this case, they will still manifest some modulation with the precession phase even for a brightening duration comparable to the period of precession, as a result of Doppler boosting of the emission from the approaching parts of the jets relative to the receding ones.
We demonstrate that the observed line positions are consistent either with the Fe XXV K ( keV) line of helium-like iron in the former scenario, or with the Fe XXVI Ly ( keV) line of hydrogen-like iron in the latter, hence with a hot gas origin of the lines in both cases. However, the required precession phase of the central source in the case of identification with Fe XXV K disagrees with the observed one, whereas there is good agreement in the case of the Fe XXVI Ly line.
Because quite high ( keV) temperature is needed for the Fe XXVI Ly line to dominate over the Fe XXV K line in the thermal spectrum of hot plasma, the inferred identification implies that the jets’ material experiences efficient heating at distances from the central source lasting a significant fraction () of the precession period. This may be caused by partial dissipation of the kinetic energy of the jets via the propagation of a shock in their matter as a result of their interaction with the surrounding medium (see, e.g. Heavens et al. (1990)), or by mutual collisions of discrete dense blobs within the jets due to more effecient deceleration of the leading blobs by the interstellar medium with respect to the trailing ones.
The paper is organised as follows: in the first section, we describe a model for the variation of the line positions as a function of the precession phase depending on location and size of their emission region along the jet. In the second section, we compare predictions of the model with the observed positions of the emission lines for the approaching and receding jets and draw a conclusion regarding their possible identification. The last section is devoted to the discussion of the results obtained and final conclusions of the present study.
2 Predicted line positions
Let us first consider the innermost regions of the precessing jets, whose observational appearance is not affected by light-travel-time effects. It is sufficient to consider just one of the jets, e.g. the blue one, since the results for the other one can be readily obtained by inversion of the jet’s direction vector.
Let the axis be aligned with the precession axis and the axis lie in the plane formed by the axis and the direction from the source to the observer. Then, the axis and the line in the plane normal to the line of sight form the picture plane (see Fig. 1). Hence, the line-of-sight and precession axis directions are given by vectors
[TABLE]
where is the inclination angle of the precession axis relative to the line of sight.
The direction of the blue jet varies periodically in time and depends on the precession phase as
[TABLE]
where is the amplitude of precession, i.e. the half-opening angle of the precession cone, is the precession period, and the zero precession phase is defined here as the moment corresponding to the minimum angle between the jet’s direction and the line of sight111Hereafter, the angle between the jet’s direction and the line of sight is measured in the rest frame of the observer, so it does not need to be corrected for relativistic aberration, as would be the case for the angle measured in the reference frame comoving with the jet’s matter. Time is also measured in the observer’s reference frame and is thus not affected by relativistic dilation.. The maximum angle then corresponds to , and since , the blue jet is actually receding at this moment (see Fig. 1).
[TABLE]
reaching the maximum at and minimum at .
The Doppler factor for the jet’s matter moving ballistically with the bulk velocity is given by
[TABLE]
with . Photons with energy emitted by the jet will be detected by the observer with the energy
[TABLE]
and this equation indeed provides an excellent fit to the observed line positions for the compact (unresolved) jets in SS 433 (with the line positions for the red jet obtained by substituting by ).
Suppose now that the jet’s matter becomes bright (e.g. after having been reheated) at some instant (expressed in units of the precession period through the dimensionless time-delay parameter ) after its launch from the central object. The corresponding distance covered by the jet by this time is , where is the distance covered by the jets over one precession period. Photons from the reheating region of the jets will reach the observer with a delay
[TABLE]
relative to photons emitted by the central source, where the component is caused by the finite light travel time.
Thus, if the observer cannot spatially separate the emission of the central source from the radiation produced at distance from it, the detected signal will contain both photons coming from the central source at its current precession phase and from blobs launched from the central source at an earlier phase , where
[TABLE]
and (cosine of the angle between the line of sight and the velocity direction of the matter emitting at distance ) is determined implicitly by the non-linear equation
[TABLE]
We see that the total phase shift is the sum of two components. It is the term that makes Eq. 8 implicit, while the component just shifts the observed precession phase backward. When is small, one can linearise Eq. 8 assuming that the non-linear phase shift is small, i.e. by substituting in the argument of by , so that
[TABLE]
This approximation works quite well up to (see Fig. 2).
The precession phases corresponding to blobs propagating in the picture plane (i.e. ), given by
[TABLE]
are obviously not affected by light-travel-time effects at all and can be considered stationary points for the considered transformation. Interestingly, if the blobs get re-brightened at a sufficiently long distance from the central source, it is possible that photons emitted by an approaching () blob will reach the observer before photons produced by a blob moving in the picture plane () despite the former having been launched later than the latter. This can cause ambiguity in the expected position of the observed X-ray line for time delays larger than a critical value that can be found by minimising the expression
[TABLE]
over in the range from [math] to . For the parameters of the SS 433 jets, we find at .
The distance for which photons emitted by a blob launched at the phase (and having the maximum ) begin to catch up with photons from a blob launched earlier at the phase is given by
[TABLE]
which yields for SS 433 parameters, and this marks the instant when half of all approaching blobs are involved in the ambiguity of the predicted line position.
Further, for which the arrival time of photons from the jet’s regions coincides with the arrival time of photons emitted by a blob launched at the phase of the preceding precession cycle equals
[TABLE]
after which more than half of all points of the initial precession curve are involved in the ambiguity of the predicted line position), and for SS 433. All these situations are illustrated in Fig. 3. Finally, full ’phase mixing’ takes place at .
The steepening of the curve at for close (and at for the red jet) means that significant brightening of the jet emission must occur at this phase (if the emission is spatially unresolved), since blobs that were launched over of the precession period will become bright at this moment simultaneously (see Fig. 3). The arising X-ray line will be significantly broadened. The same effect should also take place for other but the associated ’amplification factor’,
[TABLE]
is smaller (see Fig. 4).
In the regime when a set or range of values, , correspond to the same , one needs to perform summation (integration) over this set (range) with the weights of different determined by the square of the Doppler boosting factor (for the photon intensity from a blob with given ).
Thus, some property of the observed X-ray line can be calculated as
[TABLE]
where
[TABLE]
is the normalising factor.
Let us now consider a more general situation when the jet’s matter becomes X-ray bright not at one particular , but for ranging from to , and one cannot spatially resolve the signal corresponding to different and and measures some integral characteristics of the line (primarily, position and the total intensity) in the spectrum of such emission, which can be calculated as
[TABLE]
with the normalising coefficient
[TABLE]
Figure 5 shows the resulting effect for various intervals defined by their width and the central point .
As could be expected, the amplitude of the observed modulation with precession phase decreases with increasing width of the averaging window . However, the modulation remains noticeable even for , due to the Doppler boosting on the segment of the modulation curve with the steep variation in the predicted line centroid energy. For the receding jet, the situation is inverted, which results in a significantly smaller amplitude of the modulation of the line centroid with precession phase.
Since is given by integration over , one can change the integration order in Eq. (17), namely first average the amplification factor over and thus significantly weaken its influence on the net result. For the duration of the brightening period , the effect of the relative amplification is already quite small, so the exact solution is well approximated by the prediction that only includes Doppler boosting when integrating over the whole emitting region (see the dash-dotted line in Fig. 5).
Before comparing our predictions with the observed line positions, it is worth mentioning that since , is well approximated by the linear function , which implies that the predicted variation of the line position must closely follow the dependence of on the precession phase.
3 Comparison with the data
Migliari et al. (2002) reported the detection of X-ray emission lines at energies keV and keV, apparently associated with the blue and red jets, respectively, at distances cm (in projection) from the central source (see also Migliari et al. (2005)), which translates to depending on . Since the duration of the relevant (as well as subsequent ones) Chandra observation of the arcsec-scale X-ray emission is a few tens of kiloseconds (see Table 1 in Migliari et al. (2005)), i.e. less than % of the precession period, these observations can be considered instantaneous snaphots of the extended jets. The SS 433 precession phase for the Migliari et al. (2002) observation was (see Table 1 in Migliari et al. (2005), but note the 0.5 shift between the definition of the zero phase in their work and the one adopted here).
Below, we first check whether the observed X-ray line positions can be reconciled with the predictions of the kinematic model taking into account light-travel-time effects. We consider four possible line identifications: Fe XXV K (6.7 keV) and Fe XXVI Ly (6.96 keV) – the two brightest iron lines from hot optically thin plasma; and Fe I K (6.4 keV) and Fe I K (7.06 keV) – the brightest fluorescent lines of neutral iron.
Figure 6 shows the predicted variations of the positions of these four lines in the short brightening scenario. Evidently, for , the observed X-ray line positions are consistent only with the Fe XXV K line at a phase close to , i.e. . For Fe I K, agreement is possible only for , which, however, contradicts the observed location of the X-ray emission at . Similarly, for the Fe XXVI Ly and Fe I K lines, a match is possible for or , thus also inconsistent with the observations.
In order to quantify the quality of the model fit to the observed line positions, let us introduce the statistics
[TABLE]
where and are the model predictions for the blue and red jets, and and are the upper and lower uncertainties for the measured values.
Projection of the parameter space region encompassed by the contour on the axis with in the range from 1.1 to 1.8 gives keV, where the uncertainty is . Thus, in the short brightening scenario, the observed line positions are consistent with the prediction for the Fe XXV K line, whereas the other considered lines cannot provide fits of comparable quality. However, for keV, the best fitting phase is in disagreement with the precession phase of the central source for the Chandra observation. This motivates us to consider the more complicated long brightening scenario.
The predicted line positions in the long brightening scenario are shown in Fig. 7 for (i.e. cm from the central source) and and (corresponding to the emission region’s size of , and cm, respectively). We see that for , almost no dependence on is expected for the predicted line position for the blue jet at the precession phase corresponding to the observation discussed. This allows us to exclude both the keV and keV lines as possible identification candidates in this scenario. Our predictions for the keV and keV lines are broadly consistent with the observations for from 0.45 to 1 in the former case and from 0.4 to 0.75 in the latter. The best fitting is in both cases.
The predicted line widths calculated as the dispersion of the predicted line positions for emission coming from different blobs observed simultaneously equals keV for both the blue and red jets if . For , keV and keV for the blue and red jets, respectively. Our results are thus broadly consistent with the results of the simulation performed by Migliari et al. (2002), who found keV for the scenario, with the predicted line widths of few keV.
4 Discussion and conclusions
Migliari et al. (2002) proposed that the observed X-ray lines are associated with the 7.06 keV, i.e. Fe I K, line. However, such a line can arise as a result of fluorescence of cold gas irradiated by X-rays, rather than from a hot ionized plasma as was suggested by Migliari et al. (2002). Moreover, if the observed lines were indeed associated with Fe I K, there must also be times stronger Fe I K lines present in the spectrum, which are not observed. We have demonstrated that the observed line positions are in fact consistent with the Fe XXVI Ly (6.96 keV) line, with different Doppler shifts for the blue and red jets. Physically, this implies that the emitting plasma should be re-heated up to temperatures keV at cm from the central source in a region of size cm. If the temperature of the emitting plasma were somewhat lower, the centroids of the observed lines would be shifted to lower energies as a result of the contribution from the Fe XXV K (6.7 keV) line to the spectrally unresolved broad emission line.
Migliari et al. (2002) proposed that internal shocks arising due to variation in the speeds of blobs launched in approximately the same direction, i.e. with a time delay of , can provide a mechanism for the jets’ re-heating. Based on the detected short-term (on the time-scale of hours and days) variability, Migliari et al. (2005) further hypothesised the existence of an underlying outflow of highly energetic particles driving a fast shock wave. Another mechanism can be related to heating of the jet’s matter as a result of interaction with the surrounding cocoon, which causes an oblique shock propagation inside the jets (Heavens et al., 1990).
At distances of cm from the central source, the matter of the jets could in fact be composed of a large number of dense blobs, similarly to what is believed to occur in the region of SS 433 optical line emission (Fabrika, 2004). From the energetic considerations, the number density of the gas responsible for the extended X-ray emission needs to be quite high:
[TABLE]
where is the observed luminosity of the extended X-ray emission in units of erg/s (Migliari et al., 2002), is the plasma emissivity in the same spectral band for keV in units of erg/s cm3, and is the total number of hydrogen nuclei (divided by ) in the emitting region of size (along the jet) for the mass flux through the jet yr (Fabrika, 2004), and is the mass fraction of the emitting gas.
The mean density of a continuous jet at this distance would be cm*-3* (assuming the X-ray jets in the compact core are characterized by the size cm and number density cm*-3*, e.g. Marshall, Canizares, & Schulz 2002; Khabibullin, Medvedev, & Sazonov 2016), i.e. less than the required density by at least 4 orders of magnitude. If the length of the X-ray bright period is determined by the cooling time of the emitting matter , then it is easy to find that the required is , i.e. 3 % of the total mass of the jet’s matter in this region. This mass could be provided by a number of dense blobs experiencing collisions as a result of more efficient deceleration of leading blobs by the interstellar medium compared to trailing ones in a regime where the boundary of the jet becomes virtually perpendicular to the local gas velocity direction, i.e. at distances comparable with (Heavens et al., 1990).
The characteristic collision velocities are km/s, which should result in heating of the blobs up to temperatures keV, similar to the observed temperatures at the base of the X-ray jets near the central source (Marshall, Canizares, & Schulz, 2002). Blob collisions are possible only during the period until a complete lateral re-collimation of the precessing jet takes place and its shape becomes that of a band. After that, the X-ray emission should gradually cease at the cooling time-scale.
Based on the constraints on the origin of the observed lines obtained here, namely the requirements of high temperature of the emitting plasma and relatively long duration of the brightening episode , and taking into account the observed rapid (down to scales of several hours, Migliari et al. 2005) stochastic variability of the X-ray emission, we suggest that dissipation of the jets’ kinetic energy via collisions of their discrete dense blobs due to their deceleration by the medium of the jets’ cocoons, provides a natural explanation of the observed characteristics of the arcsec-scale X-ray emission.
5 acknowledgements
The research was supported by the Russian Science Foundation (grant 14-12-01315).
Список литературы
- (1)
- Abell & Margon (1979) Abell G. O., Margon B., 1979, Nature, 279, 701
- Bell, Roberts, & Wardle (2011) Bell M. R., Roberts D. H., Wardle J. F. C., 2011, ApJ, 736, 118
- Brinkmann, Aschenbach, & Kawai (1996) Brinkmann W., Aschenbach B., Kawai N., 1996, A&A, 312, 306
- Brinkmann, Kotani, & Kawai (2005) Brinkmann W., Kotani T., Kawai N., 2005, A&A, 431, 575
- Dubner et al. (1998) Dubner G. M., Holdaway M., Goss W. M., Mirabel I. F., 1998, AJ, 116, 1842
- Eikenberry et al. (2001) Eikenberry S. S., Cameron P. B., Fierce B. W., Kull D. M., Dror D. H., Houck J. R., Margon B., 2001, ApJ, 561, 1027
- Fabian & Rees (1979) Fabian A. C., Rees M. J., 1979, MNRAS, 187, 13P
- Fabrika (2004) Fabrika S., ASPRv, 12, 1, (2004)
- Goodall, Alouani-Bibi, & Blundell (2011) Goodall P. T., Alouani-Bibi F., Blundell K. M., 2011, MNRAS, 414, 2838
- Heavens et al. (1990) Heavens A., Ballard K., Kirk J., MNRAS, 244, 474, (1990)
- Khabibullin, Medvedev, & Sazonov (2016) Khabibullin I., Medvedev P., Sazonov S., 2016, MNRAS, 455, 1414
- Marshall, Canizares, & Schulz (2002) Marshall H. L., Canizares C. R., Schulz N. S., 2002, ApJ, 564, 941
- Marshall et al. (2013) Marshall H. L., Canizares C. R., Hillwig T., Mioduszewski A., Rupen M., Schulz N. S., Nowak M., Heinz S., 2013, ApJ, 775, 75
- Migliari et al. (2002) Migliari S., Fender R., Méndez M., Science, 297, 1673, (2002)
- Migliari et al. (2005) Migliari S., Fender R. P., Blundell K. M., Méndez M., van der Klis M., MNRAS, 358, 860, (2005)
- Milgrom (1979) Milgrom M., 1979, A&A, 76, L3
- Miller-Jones et al. (2008) Miller-Jones J. C. A., Migliari S., Fender R. P., Thompson T. W. J., van der Klis M., Méndez M., ApJ, 682, 1141,(2008)
- Panferov (2014) Panferov A., 2014, A&A, 562, A130
The reference list from the paper itself. Each links out to its DOI / PubMed record.
- 1(1)
- 2Abell & Margon (1979) Abell G. O., Margon B., 1979, Nature, 279, 701
- 3Bell, Roberts, & Wardle (2011) Bell M. R., Roberts D. H., Wardle J. F. C., 2011, Ap J, 736, 118
- 4Brinkmann, Aschenbach, & Kawai (1996) Brinkmann W., Aschenbach B., Kawai N., 1996, A&A, 312, 306
- 5Brinkmann, Kotani, & Kawai (2005) Brinkmann W., Kotani T., Kawai N., 2005, A&A, 431, 575
- 6Dubner et al. (1998) Dubner G. M., Holdaway M., Goss W. M., Mirabel I. F., 1998, AJ, 116, 1842
- 7Eikenberry et al. (2001) Eikenberry S. S., Cameron P. B., Fierce B. W., Kull D. M., Dror D. H., Houck J. R., Margon B., 2001, Ap J, 561, 1027
- 8Fabian & Rees (1979) Fabian A. C., Rees M. J., 1979, MNRAS, 187, 13P