Measurement of the $B^{\pm}$ production asymmetry and the $CP$ asymmetry in $B^{\pm} \to J/\psi K^{\pm}$ decays
LHCb collaboration: R. Aaij, B. Adeva, M. Adinolfi, Z. Ajaltouni, S., Akar, J. Albrecht, F. Alessio, M. Alexander, S. Ali, G. Alkhazov, P. Alvarez, Cartelle, A.A. Alves Jr, S. Amato, S. Amerio, Y. Amhis, L. An, L. Anderlini,, G. Andreassi, M. Andreotti, J.E. Andrews

TL;DR
This paper measures the production and CP asymmetries of B± mesons in proton-proton collisions at the LHC, providing precise results that test the Standard Model's predictions of matter-antimatter differences.
Contribution
The study presents the first measurements of B± production asymmetry at 7 and 8 TeV and uses these to accurately determine the CP asymmetry in B± decays.
Findings
Production asymmetries are consistent with zero within uncertainties.
CP asymmetry measured to be close to zero, aligning with Standard Model expectations.
Results improve precision of asymmetry measurements in B meson decays.
Abstract
The meson production asymmetry in collisions is measured using decays. The data were recorded by the LHCb experiment during Run 1 of the LHC at centre-of-mass energies of 7 and 8 TeV. The production asymmetries, integrated over transverse momenta in the range GeV/, and rapidities in the range , are measured to be \begin{align*} \mathcal{A}_{\rm prod}(B^+,\sqrt{s}=7~{\rm TeV}) &= (-0.41 \pm 0.49 \pm 0.10) \times 10^{-2},\\ \mathcal{A}_{\rm prod}(B^+,\sqrt{s}=8~{\rm TeV}) &= (-0.53 \pm 0.31 \pm 0.10) \times 10^{-2}, \end{align*} where the first uncertainties are statistical and the second are systematic. These production asymmetries are used to correct the raw asymmetries of decays, thus allowing a measurement of the asymmetry, \begin{equation*} \mathcal{A}_{CP}…
Click any figure to enlarge with its caption.
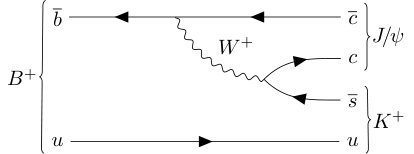 Figure 1
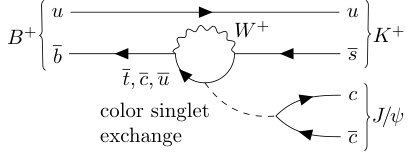 Figure 1
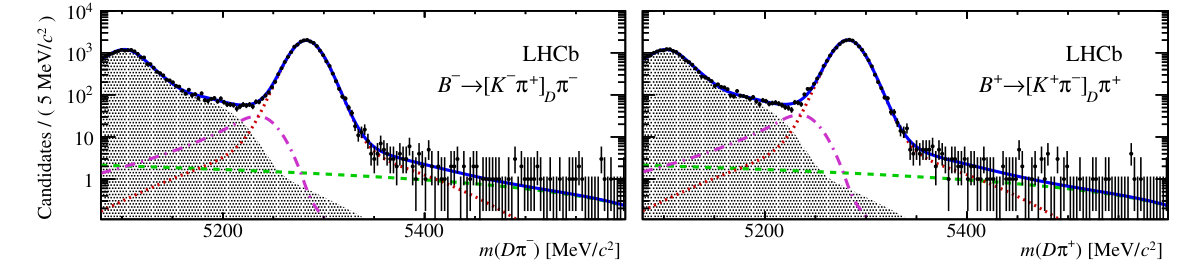 Figure 2
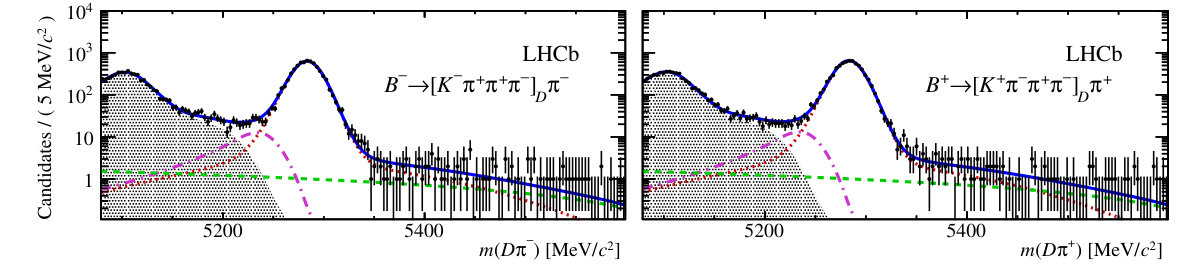 Figure 2
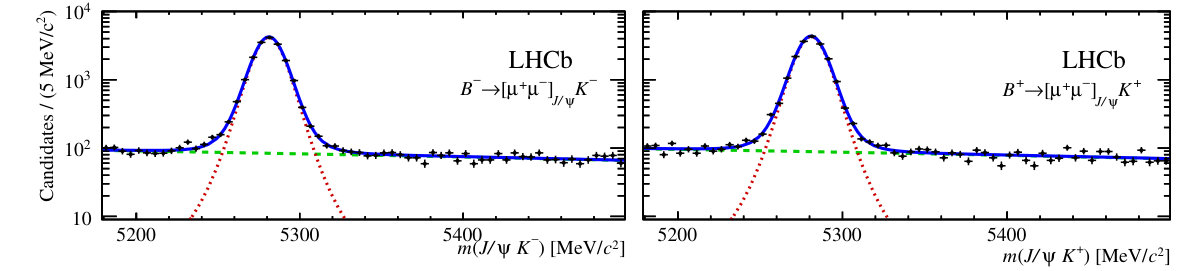 Figure 3
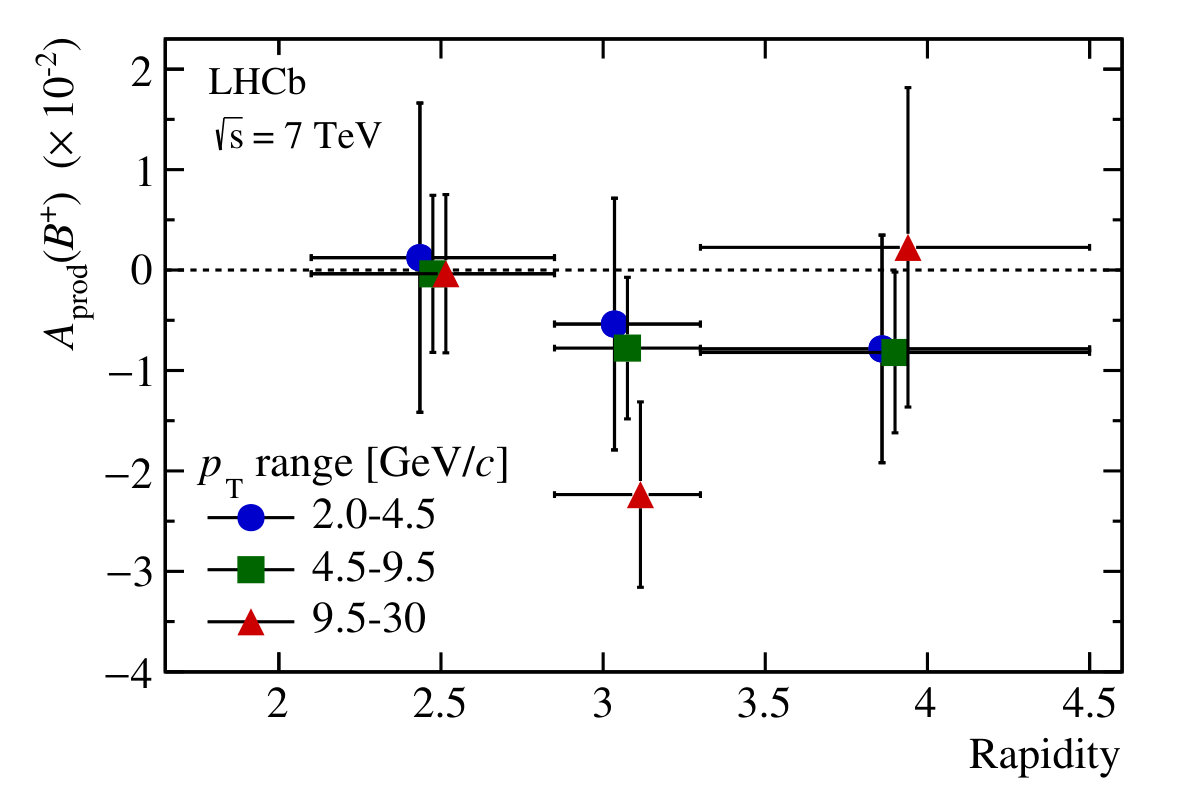 Figure 4
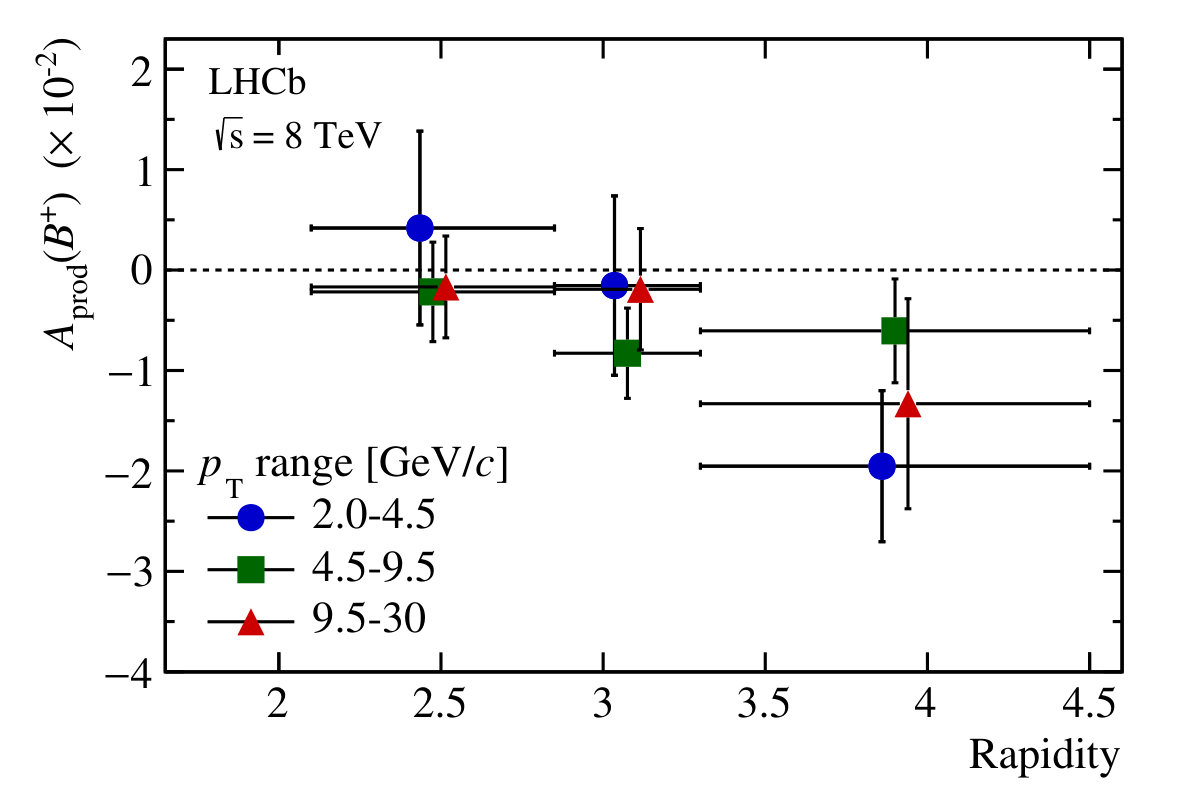 Figure 4
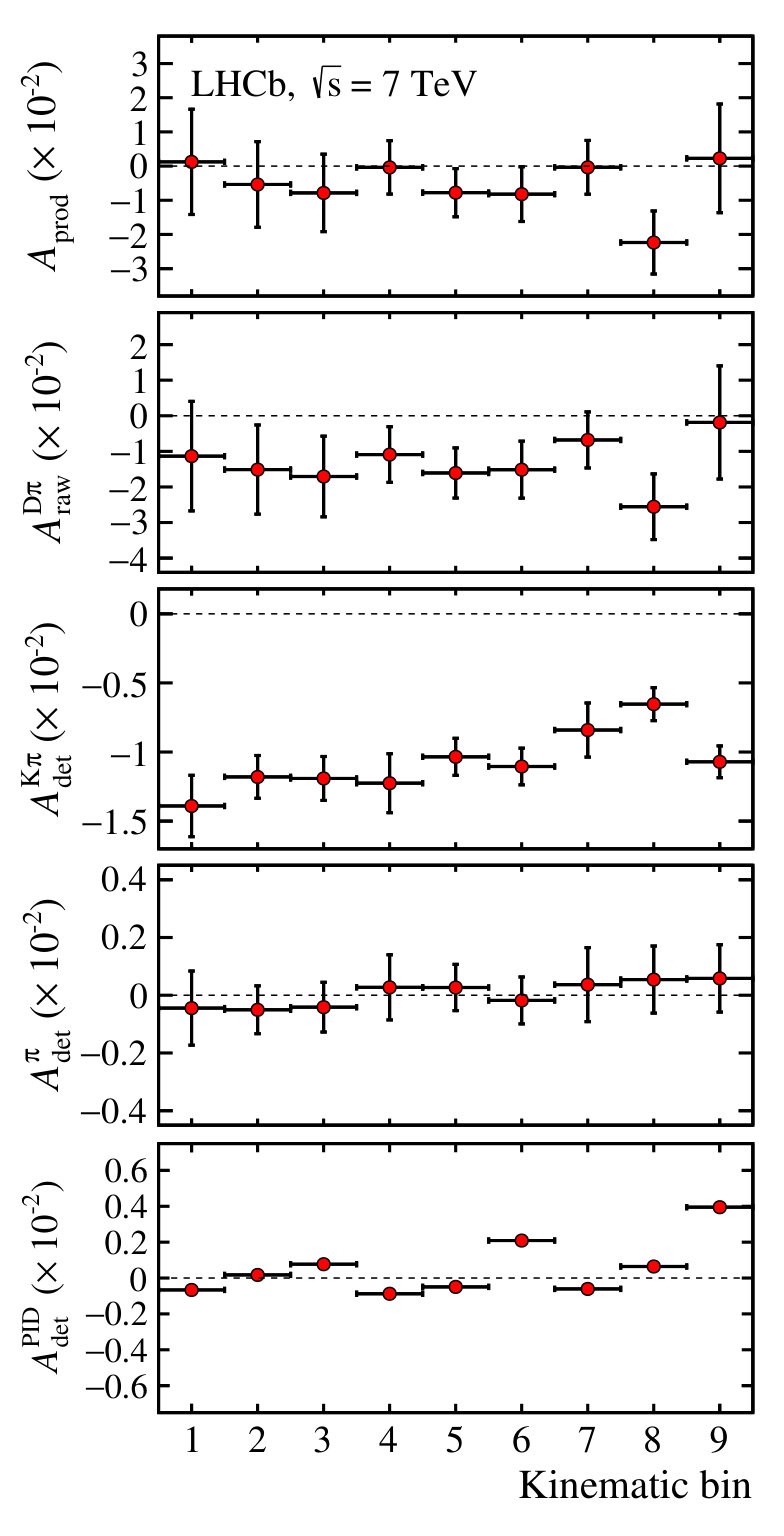 Figure 8
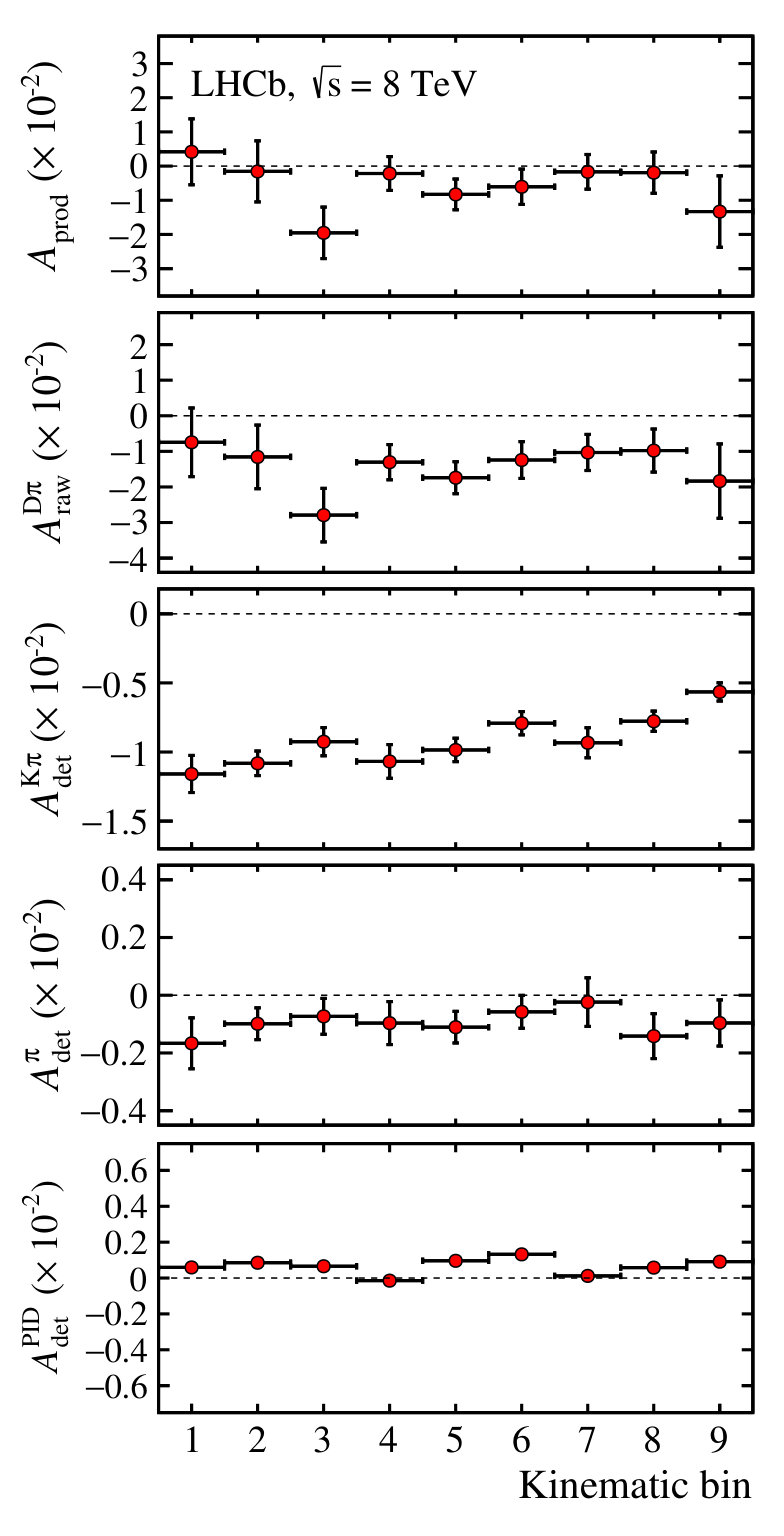 Figure 9
 Figure 11
| Bin | ||||||||||
|---|---|---|---|---|---|---|---|---|---|---|
| [ ] | ||||||||||
| 1 | 2.0– | 4.5 | 2.10– | 2.85 | 13604 | 118 | 1549 | 42 | 17319 | 194 |
| 2 | 2.0– | 4.5 | 2.85– | 3.3 | 18587 | 145 | 4022 | 66 | 26038 | 229 |
| 3 | 2.0– | 4.5 | 3.3– | 4.5 | 19946 | 151 | 6347 | 87 | 31110 | 260 |
| 4 | 4.5– | 9.5 | 2.10– | 2.85 | 44470 | 219 | 14209 | 131 | 34939 | 231 |
| 5 | 4.5– | 9.5 | 2.85– | 3.3 | 47597 | 240 | 23895 | 163 | 36682 | 230 |
| 6 | 4.5– | 9.5 | 3.3– | 4.5 | 31137 | 200 | 24014 | 170 | 31345 | 212 |
| 7 | 9.5– | 30 | 2.10– | 2.85 | 33516 | 195 | 23378 | 167 | 25174 | 189 |
| 8 | 9.5– | 30 | 2.85– | 3.3 | 20176 | 159 | 20332 | 151 | 15110 | 136 |
| 9 | 9.5– | 30 | 3.3– | 4.5 | 4767 | 73 | 8832 | 97 | 8602 | 191 |
| Integrated | 233390 | 537 | 126350 | 393 | 226319 | 632 | ||||
| Bin | () | () | () | () | () | |||||
|---|---|---|---|---|---|---|---|---|---|---|
| 1 | ||||||||||
| 2 | ||||||||||
| 3 | ||||||||||
| 4 | ||||||||||
| 5 | ||||||||||
| 6 | ||||||||||
| 7 | ||||||||||
| 8 | ||||||||||
| 9 | ||||||||||
| Bin | () | () | () | () | () | |||||
|---|---|---|---|---|---|---|---|---|---|---|
| 1 | ||||||||||
| 2 | ||||||||||
| 3 | ||||||||||
| 4 | ||||||||||
| 5 | ||||||||||
| 6 | ||||||||||
| 7 | ||||||||||
| 8 | ||||||||||
| 9 | ||||||||||
| Source | Size () |
|---|---|
| method | |
| method | |
| Pion nuclear interactions | |
| Bin | () | () | ||
|---|---|---|---|---|
| 1 | 0.182 | 0.174 | ||
| 2 | 0.092 | 0.088 | ||
| 3 | 0.156 | 0.156 | ||
| 4 | 0.208 | 0.202 | ||
| 5 | 0.094 | 0.095 | ||
| 6 | 0.144 | 0.151 | ||
| 7 | 0.064 | 0.068 | ||
| 8 | 0.028 | 0.030 | ||
| 9 | 0.032 | 0.038 | ||
| Integrated | ||||
| Bin | () |
|---|---|
| 1 | 0.15 0.04 |
| 2 | 0.22 0.03 |
| 3 | 0.24 0.05 |
| 4 | 0.26 0.02 |
| 5 | 0.29 0.02 |
| 6 | 0.21 0.02 |
| 7 | 0.27 0.02 |
| 8 | 0.23 0.01 |
| 9 | 0.05 0.02 |
Peer Reviews
No public reviews on file for this paper yet. If you reviewed it on a platform where reviews are public (OpenReview, ICLR, NeurIPS, ICML), you can paste yours below so the community can read it here.
Videos
No videos yet. Explain this paper in a talk, walkthrough, or lecture? Add one.
EUROPEAN ORGANIZATION FOR NUCLEAR RESEARCH (CERN)
CERN-EP-2016-325
LHCb-PAPER-2016-054
19 January 2017
Measurement of the production asymmetry and the asymmetry in decays
The LHCb collaboration†††Authors are listed at the end of this paper.
The meson production asymmetry in collisions is measured using decays. The data were recorded by the LHCb experiment during Run 1 of the LHC at centre-of-mass energies of 7 and 8. The production asymmetries, integrated over transverse momenta in the range 2<\mbox{p_{\mathrm{T}}}<30$${\mathrm{\,Ge\kern-1.00006ptV\!/}c}, and rapidities in the range , are measured to be
[TABLE]
where the first uncertainties are statistical and the second are systematic. These production asymmetries are used to correct the raw asymmetries of decays, thus allowing a measurement of the asymmetry,
[TABLE]
Submitted to Phys. Rev. D
© CERN on behalf of the LHCb collaboration, licence CC-BY-4.0.
1 Introduction
One of the primary goals of the LHCb experiment is to search for effects of physics beyond the Standard Model through measurements of -violating asymmetries in beauty- and charm-hadron decays. A challenge for such measurements in collisions is that the heavy flavour production rates differ between particles and antiparticles. These production asymmetries cannot be precisely predicted since they arise in the non perturbative or quark hadronisation process [1, 2, 3]. The effects of production asymmetries cancel in measurements of the difference between asymmetries of two different decays of the same hadron species.
The asymmetries of meson decay rates111The inclusion of charge-conjugate processes is implied throughout, except in the discussion of asymmetries. are often measured relative to that of the decay . The leading tree-level diagram for this decay, shown in Fig. 1 (left), is colour-suppressed and the total decay amplitude may receive a sizeable contribution from the gluonic loop diagram shown in Fig. 1 (right). Therefore, the decay can in principle exhibit a asymmetry due to the interference between these amplitudes. The current world average value of the asymmetry is [4] and the uncertainty represents a limitation in many meson asymmetry measurements that use this channel as a reference.
This analysis exploits the decay , which is dominated by a Cabibbo- and colour-favoured tree-level amplitude and is therefore expected to have a asymmetry with a smaller value and uncertainty than for the mode. The decay mode is used to measure the production asymmetry between the cross-sections for and mesons, defined as
[TABLE]
Since the production asymmetry is expected to be a function of the kinematics, the measurement is performed in nine bins of transverse momentum, , and rapidity, , within the fiducial region 2<\mbox{p_{\mathrm{T}}}<30$${\mathrm{\,Ge\kern-1.00006ptV\!/}c} and . Measurements are performed on two data sets corresponding to integrated luminosities of 1 and 2, recorded at centre-of-mass energies of 7 and 8 TeV in 2011 and 2012, respectively. These measurements complement the existing LHCb studies of heavy flavour production asymmetries [5, 6, 7, 8]. A combined analysis of and decays allows a measurement of the asymmetry in the latter mode. The raw charge asymmetry for a flavour-specific decay to the final state () accessible in decays of () mesons is defined as
[TABLE]
For the two decay modes under study, the asymmetries are well approximated by
[TABLE]
where is the detector-induced asymmetry resulting from differences in the detection efficiencies between particles and antiparticles. All contributions to are measured on independent control samples from the same data set. The high correlation of between the two decay modes implies a partial cancellation in their difference. This cancellation and the low level of violation in the decay mode enable a precise measurement of .
2 The LHCb detector
The LHCb detector [9, 10] is a single-arm forward spectrometer covering the pseudorapidity range , designed for the study of particles containing or quarks. The detector includes a high-precision tracking system consisting of a silicon-strip vertex detector surrounding the interaction region, a large-area silicon-strip detector located upstream of a dipole magnet with a bending power of about , and three stations of silicon-strip detectors and straw drift tubes placed downstream of the magnet. Data samples corresponding to roughly equal integrated luminosities were recorded with configurations in which the magnetic field was pointing vertically upwards and downwards. This largely cancels any charge asymmetries in the reconstruction efficiency for charged particles. The tracking system provides a measurement of momentum, , of charged particles with a relative uncertainty that varies from 0.5% at low momentum to 1.0% at 200. The minimum distance of a track to a primary vertex (PV), the impact parameter (IP), is measured with a resolution of (15+29/\mbox{p_{\mathrm{T}}}){\,\upmu\mathrm{m}}, where is the component of the momentum transverse to the beam, in . Different types of charged hadrons are distinguished using information from two ring-imaging Cherenkov detectors. Muons are identified by a system composed of alternating layers of iron and multiwire proportional chambers. The online event selection is performed by a trigger [11], which consists of a hardware stage, based on information from the calorimeter and muon systems, followed by a two-stage software trigger, which applies a full event reconstruction. This analysis makes use of inclusive dimuon and beauty selections at the software trigger stages.
3 Selection of decays
The selection of signal candidate decays closely follows a recent LHCb analysis involving the same decay channel [12]. Events are considered for the analysis if they contain a track with large enough and IP to satisfy the requirements of the first stage of the software trigger. An inclusive beauty selection is applied at the second stage of the software trigger. Candidate decays are constructed from the intersection of two (four) tracks that satisfy appropriate kaon or pion particle identification (PID) criteria, and that have a large and significant IP with respect to all primary vertices. These candidates must have a mass within \pm 25$${\mathrm{\,Me\kern-1.00006ptV\!/}c^{2}} of the mass [4]. Each candidate is combined with a high track that is identified as a pion to create a displaced vertex that is consistent with a decay of a meson. The candidates are required to have a mass within the range –5899$${\mathrm{\,Me\kern-1.00006ptV\!/}c^{2}}. To reduce to a negligible level the uncertainty related to L0 trigger asymmetries, it is explicitly required that a positive L0 trigger decision was caused by a particle that is distinct from any of the final-state particles that compose the signal candidate. This requirement is independent of whether or not the signal candidate itself also caused a positive L0 trigger decision and is therefore referred to as triggering independently of signal (TIS) [11].
For both the two- and four-body -mode selections, a pair of boosted decision tree (BDT) discriminators [13], implementing the gradient boost algorithm [14], is used to achieve further background suppression. The first of these BDTs is trained to reject candidates with fake decays, and the second to reject backgrounds with real decays. The BDTs are trained using simulated signal decays and a sample of decays from data with masses in the range –7200$${\mathrm{\,Me\kern-1.00006ptV\!/}c^{2}} to model the combinatorial background in the nominal mass range. For the training of the first BDT, a background sample is provided by candidates with masses that differ by more than \pm 30$${\mathrm{\,Me\kern-1.00006ptV\!/}c^{2}} from the known mass. The second BDT is trained using a background sample of candidates with masses within \pm 25$${\mathrm{\,Me\kern-1.00006ptV\!/}c^{2}} of the known mass. A loose cut on the classifier response of the first BDT is applied prior to training the second one. The inputs to the BDTs include properties of each particle (, , and the IP significance) and additional properties of the and composite particles (decay time, flight distance, decay vertex quality, radial distance between the decay vertex and the PV, and the angle between the reconstructed momentum vector and the line connecting the production and decay vertex). A further input to the BDTs is an isolation variable
[TABLE]
for which the sum is taken over tracks that are not part of the signal candidate but fall within a cone of half-angle radians, where , and and are the differences in polar and azimuthal angle of each track with respect to the candidate direction. Tracks are only considered in the isolation cone if they are associated, by smallest IP, to the same primary vertex as the signal candidate. Signal decays are expected to have larger values of I_{\mbox{p_{\mathrm{T}}}} than background.
The cut on the second BDT response is optimised by minimising the expected uncertainty on the asymmetry between the yields of and . No PID information is used in the BDT training, but the purity of the sample is further improved by requiring all kaon and pion candidates to satisfy PID criteria. Events containing more than one candidate amount to less than 1 %, and in these cases the candidate with the highest quality decay vertex is selected.
The raw asymmetries between the yields of and decays are determined by binned maximum likelihood fits to the mass distributions of selected and candidates, treating the two- and four-body modes separately. The fit function is built from a signal component and three background components. A sum of two Gaussian functions with asymmetric power-law tails and an additional Gaussian function are combined to model decays [12]. Misidentified decays have a distribution that is below the signal peak with a tail that extends to lower masses. They are modelled by the sum of two Gaussian functions with asymmetric power-law tail components. Partially reconstructed decays with an additional particle from a or meson decay form a background at masses lower than that of the signal peak. This component is described by a combination of analytical functions with shapes that depend on the spin-parity of the missing particle, following the method described in Ref. [12]. A linear function is adequate to describe the combinatorial background distribution. The yield of misidentified decays is constrained with an independent control sample of these decays, combined with the calibrated particle identification efficiencies and misidentification rates [15]. With the exception of the tail parameters, which are fixed to values obtained from simulation, all parameters are allowed to vary in the fit.
Figure 2 shows the fits to the mass distributions in the bin with 4.5<\mbox{p_{\mathrm{T}}}<9.5$${\mathrm{\,Ge\kern-1.00006ptV\!/}c} and . The subsequent analysis is based on separate fits for the nine kinematic bins and two centre-of-mass energies. The signal yields for each of the nine kinematic bins are listed in Table 1. The and intervals of each bin are defined in the second and third columns. The yields sum over meson charges and centre-of-mass energies. Integrated over the fiducial acceptance, 2<\mbox{p_{\mathrm{T}}}<30$${\mathrm{\,Ge\kern-1.00006ptV\!/}c} and , the fits return signal yields of around decays for the mode and around decays for the mode.
4 Selection of decays
The selection of decays with is based on events in which a muon or a generic track, with large and IP, satisfies the requirements of the first-stage software trigger. Events must be selected based on a dimuon signature by the second-level software trigger. Candidate decays are reconstructed from high- muon candidates with large IP with respect to all PVs. A mass interval of – is imposed on the candidates. These candidates are combined with a high- identified kaon with a significant IP with respect to all PVs, where the candidate invariant mass is constrained to its known value in the combination. The L0 trigger TIS requirement is applied in the same way as for the selection. A single BDT classifier is used to improve the purity of the sample. This classifier is trained on a similar set of variables as that for the selection, and exhibits very similar performance in terms of signal efficiency and background rejection. Events containing more than one candidate amount to less than 1 %, and in these cases the candidate with the highest quality decay vertex is selected.
A simultaneous fit of the mass distributions across the kinematic bins is performed, where the same value of is assumed for all bins. The signal peak is described using a Gaussian function with an additional asymmetric power-law tail component. The mean of the Gaussian is constrained to be the same in all kinematic bins, while its width and the tail parameters are allowed to vary between bins. A small background from misidentified decays is described by a similar function, with fixed shape parameters taken from simulation. The yield of this contribution is allowed to vary in each kinematic bin, but a single raw asymmetry is shared between all bins. The contribution from random particle combinations is described by a linear function. The yield of this component and the slope parameter are allowed to vary in each kinematic bin. The yield is also fitted separately for each charge.
Integrated over the full fiducial acceptance, a signal yield of about events is measured. Table 1 lists the yields of each signal decay mode in each of the kinematic bins summing over the two centre-of-mass energies. An example of the fit in the bin with 4.5<\mbox{p_{\mathrm{T}}}<9.5$${\mathrm{\,Ge\kern-1.00006ptV\!/}c} and is displayed in Fig. 3.
5 Measurement of the production asymmetry
The production asymmetry is determined in the nine bins of and according to
[TABLE]
where and are the raw charge asymmetry and asymmetry in the decay, respectively. The four terms correct for detector-induced asymmetries and will be described in the following. All terms other than are evaluated separately for the four disjoint data sets corresponding to the two centre-of-mass energies and the two magnet polarities. An average of the values for the two decay modes is computed with weights that are chosen to minimise the uncertainty. The same weights are used to compute averages over the two decay modes for all other terms in Eq. 5 apart from , which is independent of the decay. Tables 2 and 3 list the values of the first five terms in Eq. 5 for the 7 and 8 data sets, respectively. The overall detection asymmetry has two main contributions. The first arises because mesons have a larger nuclear interaction cross-section than mesons. This means that more mesons than mesons interact inelastically with the detector material before they leave enough hits to be reconstructed in the tracking stations. The resulting – detection asymmetry is around . The second cause of asymmetry is the different trajectories of positively and negatively charged particles, which therefore have different sensitivities to misalignments and inhomogeneities of the detector. This source contributes to all detection asymmetry terms. It is partially cancelled when averaging measurements over data recorded with the dipole magnet in the two polarities.
The detection asymmetry, , is measured using samples of mesons that are produced in the primary interactions and decay to the and final states. The mesons are reconstructed in their decay to . Within a small phase-space region in terms of the decay products, it is assumed that the detection asymmetry for a pair can be determined using
[TABLE]
with a small correction for the effects of violation in mixing and the different material interactions of and . For each of the candidates one of the two mesons is randomly labelled as being matched to the signal. A weight is assigned to each candidate such that the kinematic distributions of the and the matched agree with those from the signal decays. For the sample, the procedure is repeated for each of the two possible pions with opposite charge to the kaon, averaging over the two. Each candidate is assigned a weight, such that the kinematic distributions agree with those of the unmatched in the weighted sample, and the kinematic distributions are equalised between the two decay modes. This ensures cancellation of the production asymmetry, and means that any detection asymmetry associated with the unmatched is cancelled with a corresponding asymmetry affecting the sample. This weighting procedure is performed for each of the nine kinematic bins. The raw asymmetries that enter Eq. 6 are determined by fitting the weighted mass spectra for the four combinations of decay modes and charges.
Using a detailed description of the LHCb detector and cross-section measurements from fixed target experiments [4] the nuclear interaction contribution to the pion asymmetry is estimated to be negligibly small. The tracking asymmetry can therefore be assumed to be the same for pions and muons. The tracking asymmetry, , is therefore inferred from that of muons measured using a sample of decays in which one of the muons is reconstructed without requiring hits in all tracking stations [16]. Weights are assigned to the candidates such that the kinematic distributions of this muon match those of the in the sample.
The PID requirements on the decays can introduce asymmetries. Corrections are determined using a control sample of decays, with , in which no PID requirements are imposed on the or from the decay. The asymmetry associated with PID requirements on the decays is partially accounted for in the correction, since PID requirements are imposed on the final state kaons and pions in the control samples. The requirements are tighter in these control samples, and so a residual correction must still be applied. The sum of this correction, and a corresponding correction for the PID requirement on the from the decays, is denoted .
The asymmetry associated with the TIS trigger efficiency, , is determined using a sample of -hadron decays to the final state with . An unbiased probe of the TIS trigger efficiency is provided by the subset of these in which the muon prompted a positive decision by the L0 muon trigger. The corresponding asymmetries do not exhibit any kinematic dependence, and so a single correction is determined for each centre-of-mass energy, and is applied to all kinematic bins. The measured values are and for the 7 TeV and 8 TeV data sets, respectively.
The asymmetry, , is estimated from measurements of the CKM angle and the hadronic parameters of decays [17]. Different values are obtained for the and decay modes due to the smaller coherence factor from the competing hadronic resonances in the four-body mode. The asymmetries are
[TABLE]
with a 55% correlation between the uncertainties on these two quantities. The values reported in Tables 2 and 3 are averaged over the two- and four-body modes. These values vary between the kinematic bins due to the different weights of the two- and four-body modes.
Several sources of systematic uncertainty arise in the determination of the production asymmetries. Their contributions are listed in Table 4. Variations in the weighting procedures that are used to determine and yield uncertainties of and , respectively. An uncertainty of is assigned to a possible pion nuclear interaction asymmetry that is not accounted for in the tracking efficiency measurements with muons from decays. Finally, the uncertainties are included in the total systematic uncertainty, which is taken to be correlated between the kinematic bins.
The measured values for each kinematic bin are listed in Table 5 for both centre-of-mass energies. They are shown as a function of rapidity for the three ranges in Fig. 4. Samples of simulated decays are produced using Pythia 8 [18, 19] with a specific LHCb configuration [20], and are used to determine the weights that are assigned to each of the nine bins, such that the sum corresponds to the asymmetry integrated over the full fiducial region covering 2<\mbox{p_{\mathrm{T}}}<30 and . These weights are listed in Table 5. The integrated asymmetries, which are also reported in Table 5, are
[TABLE]
where the first uncertainty is statistical and includes contributions from and the detection asymmetry corrections which are inherently statistical in nature. The second uncertainty is systematic. Several cross-checks are performed. The measured value of is found to have no statistically significant dependence on the decay time or kaon momentum. Statistically compatible results are obtained for the two magnet polarities.
6 Measurement of
The value of is determined according to
[TABLE]
where is the raw asymmetry of decays and corrects for the different detection asymmetries of the two decay modes. The two final states differ by the transformation of a pair to a pair, where the only significant contribution to the difference between the overall detection asymmetries arises from the charged kaon asymmetry. The method used to determine , as described in the previous section, is applied to the final state by considering the muon with opposite charge to the kaon as a pion. The difference between this and the corresponding asymmetry for the mode is defined as . The uncertainties are cancelled to a large degree in this difference. Table 6 lists the values of for each kinematic bin. The values of are positive, since the kaons in the decays tend to have higher momenta than those in the decays. A further asymmetry could result from differences between the kinematic distributions of the pion in the decay compared to the in the decay, but this is estimated to be negligibly small.
The values of in each bin are corrected according to Eq. 7 using measurements of , and in order to extract . Gaussian constraints are applied to the values of and , such that the statistical uncertainty on these parameters is included in the overall statistical uncertainty for . A systematic uncertainty of is assigned for the use of fixed parameters in the mass fits, while a systematic uncertainty of is assigned for the method used to measure . The values contribute a systematic uncertainty of . The final result is
[TABLE]
where the first uncertainty is statistical and the second is systematic. By fixing all Gaussian constrained parameters to have zero uncertainty, the contribution from the finite statistics is found to be . This result is consistent with, and improves upon, the current world average value of [4].
7 Summary and conclusions
The meson production asymmetry is a crucial input in the measurement of asymmetries in decays. A sample of decays is used to measure the production asymmetry. The analysed data set corresponds to integrated luminosities of 1 and 2 recorded during 2011 and 2012 at proton-proton centre-of-mass energies of 7 and 8, respectively. The production asymmetries are measured in nine bins of transverse momenta and rapidity, covering the region 2<\mbox{p_{\mathrm{T}}}<30$${\mathrm{\,Ge\kern-1.00006ptV\!/}c} and , and separately for the two centre-of-mass energies. The measurements are generally consistent with zero asymmetry within typical uncertainties of roughly , which is in agreement with -quark hadronisation models [1, 2, 3]. Integrated over the full and ranges, the production asymmetries are measured to be
[TABLE]
where the first uncertainty accounts for all statistical sources, and the second accounts for all systematic sources. A simultaneous study of the decay allows a measurement of its asymmetry,
[TABLE]
Acknowledgements
We express our gratitude to our colleagues in the CERN accelerator departments for the excellent performance of the LHC. We thank the technical and administrative staff at the LHCb institutes. We acknowledge support from CERN and from the national agencies: CAPES, CNPq, FAPERJ and FINEP (Brazil); NSFC (China); CNRS/IN2P3 (France); BMBF, DFG and MPG (Germany); INFN (Italy); FOM and NWO (The Netherlands); MNiSW and NCN (Poland); MEN/IFA (Romania); MinES and FASO (Russia); MinECo (Spain); SNSF and SER (Switzerland); NASU (Ukraine); STFC (United Kingdom); NSF (USA). We acknowledge the computing resources that are provided by CERN, IN2P3 (France), KIT and DESY (Germany), INFN (Italy), SURF (The Netherlands), PIC (Spain), GridPP (United Kingdom), RRCKI and Yandex LLC (Russia), CSCS (Switzerland), IFIN-HH (Romania), CBPF (Brazil), PL-GRID (Poland) and OSC (USA). We are indebted to the communities behind the multiple open source software packages on which we depend. Individual groups or members have received support from AvH Foundation (Germany), EPLANET, Marie Skłodowska-Curie Actions and ERC (European Union), Conseil Général de Haute-Savoie, Labex ENIGMASS and OCEVU, Région Auvergne (France), RFBR and Yandex LLC (Russia), GVA, XuntaGal and GENCAT (Spain), Herchel Smith Fund, The Royal Society, Royal Commission for the Exhibition of 1851 and the Leverhulme Trust (United Kingdom).
The reference list from the paper itself. Each links out to its DOI / PubMed record.
- 1[1] E. Norrbin and T. Sjöstrand, Production and hadronization of heavy quarks , Eur. Phys. J. C 17 (2000) 137 , ar Xiv:hep-ph/0005110 · doi ↗
- 2[2] E. Norrbin and R. Vogt, Bottom production asymmetries at the LHC , ar Xiv:hep-ph/0003056
- 3[3] E. Norrbin, Heavy quark production asymmetries , ar Xiv:hep-ph/9909437
- 4[4] Particle Data Group, C. Patrignani et al. , Review of particle physics , Chin. Phys. C 40 (2016) 100001 · doi ↗
- 5[5] LH Cb collaboration, R. Aaij et al. , Measurement of the D s + − D s − subscript superscript 𝐷 𝑠 subscript superscript 𝐷 𝑠 {{D}^{+}_{s}}-{{D}^{-}_{s}} production asymmetry in 7 Te V p p 𝑝 𝑝 pp collisions , Phys. Lett. B 713 (2012) 186 , ar Xiv:1205.0897 · doi ↗
- 6[6] LH Cb collaboration, R. Aaij et al. , Measurement of the D ± superscript 𝐷 plus-or-minus D^{\pm} production asymmetry in 7 Te V p p 𝑝 𝑝 pp collisions , Phys. Lett. B 718 (2013) 902 , ar Xiv:1210.4112 · doi ↗
- 7[7] LH Cb collaboration, R. Aaij et al. , Measurement of the B s 0 − B ¯ s 0 {{B}^{0}_{s}}-{{\kern 1.79993 pt\overline{\kern-1.79993 pt B}{}}{}^{0}_{s}} and B 0 − B ¯ 0 {{B}^{0}}-{{\kern 1.79993 pt\overline{\kern-1.79993 pt B}{}}{}^{0}} production asymmetries in p p 𝑝 𝑝 pp collisions at s = 7 𝑠 7 \sqrt{s}=7 Te V , Phys. Lett. B 739 (2014) 218 , ar Xiv:1408.0275 · doi ↗
- 8[8] LH Cb collaboration, R. Aaij et al. , Measurement of the semileptonic C P 𝐶 𝑃 C\!P asymmetry in B 0 − B ¯ 0 {{B}^{0}}-{{\kern 1.79993 pt\overline{\kern-1.79993 pt B}{}}{}^{0}} mixing , Phys. Rev. Lett. 114 (2015) 041601 , ar Xiv:1409.8586 · doi ↗