Observation of the $\varXi^{-}_{b}\to J/\psi\varLambda K^{-}$ decay
LHCb collaboration: R. Aaij, B. Adeva, M. Adinolfi, Z. Ajaltouni, S., Akar, J. Albrecht, F. Alessio, M. Alexander, S. Ali, G. Alkhazov, P. Alvarez, Cartelle, A.A. Alves Jr, S. Amato, S. Amerio, Y. Amhis, L. An, L. Anderlini,, G. Andreassi, M. Andreotti, J.E. Andrews

TL;DR
This paper reports the first observation of the decay $ ext{Ξ}_b^- o J/\psi ext{Λ} K^-$, measures its production rate relative to $ ext{Λ}_b^0$, and determines the mass difference between these baryons using LHCb data.
Contribution
The study provides the first measurement of the decay $ ext{Ξ}_b^- o J/\psi ext{Λ} K^-$ and the mass difference between $ ext{Ξ}_b^-$ and $ ext{Λ}_b^0$ baryons, using data from the LHCb detector.
Findings
Measured the ratio of production rates: (4.19 ± 0.29 (stat) ± 0.15 (syst))×10^{-2}.
Determined the mass difference: 177.08 ± 0.47 (stat) ± 0.16 (syst) MeV/c^2.
First observation of the decay mode $ ext{Ξ}_b^- o J/\psi ext{Λ} K^-$.
Abstract
The observation of the decay is reported, using a data sample corresponding to an integrated luminosity of , collected by the LHCb detector in collisions at centre-of-mass energies of and . The production rate of baryons detected in the decay is measured relative to that of baryons using the decay . Integrated over the -baryon transverse momentum and rapidity , the measured ratio is \begin{equation*} \frac{f_{\varXi_{b}^{-}}}{f_{\varLambda_{b}^{0}}}\frac{\mathcal{B}(\varXi_{b}^{-}\to J/\psi\varLambda K^{-})}{\mathcal{B}(\varLambda_{b}^{0}\to J/\psi \varLambda)}=(4.19\pm 0.29~(\mathrm{stat})\pm0.15~(\mathrm{syst}))\times 10^{-2},…
Click any figure to enlarge with its caption.
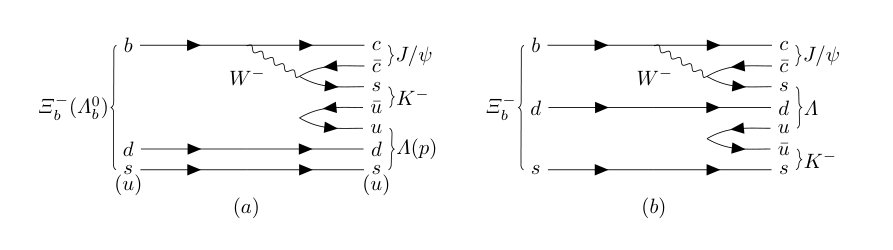 Figure 1
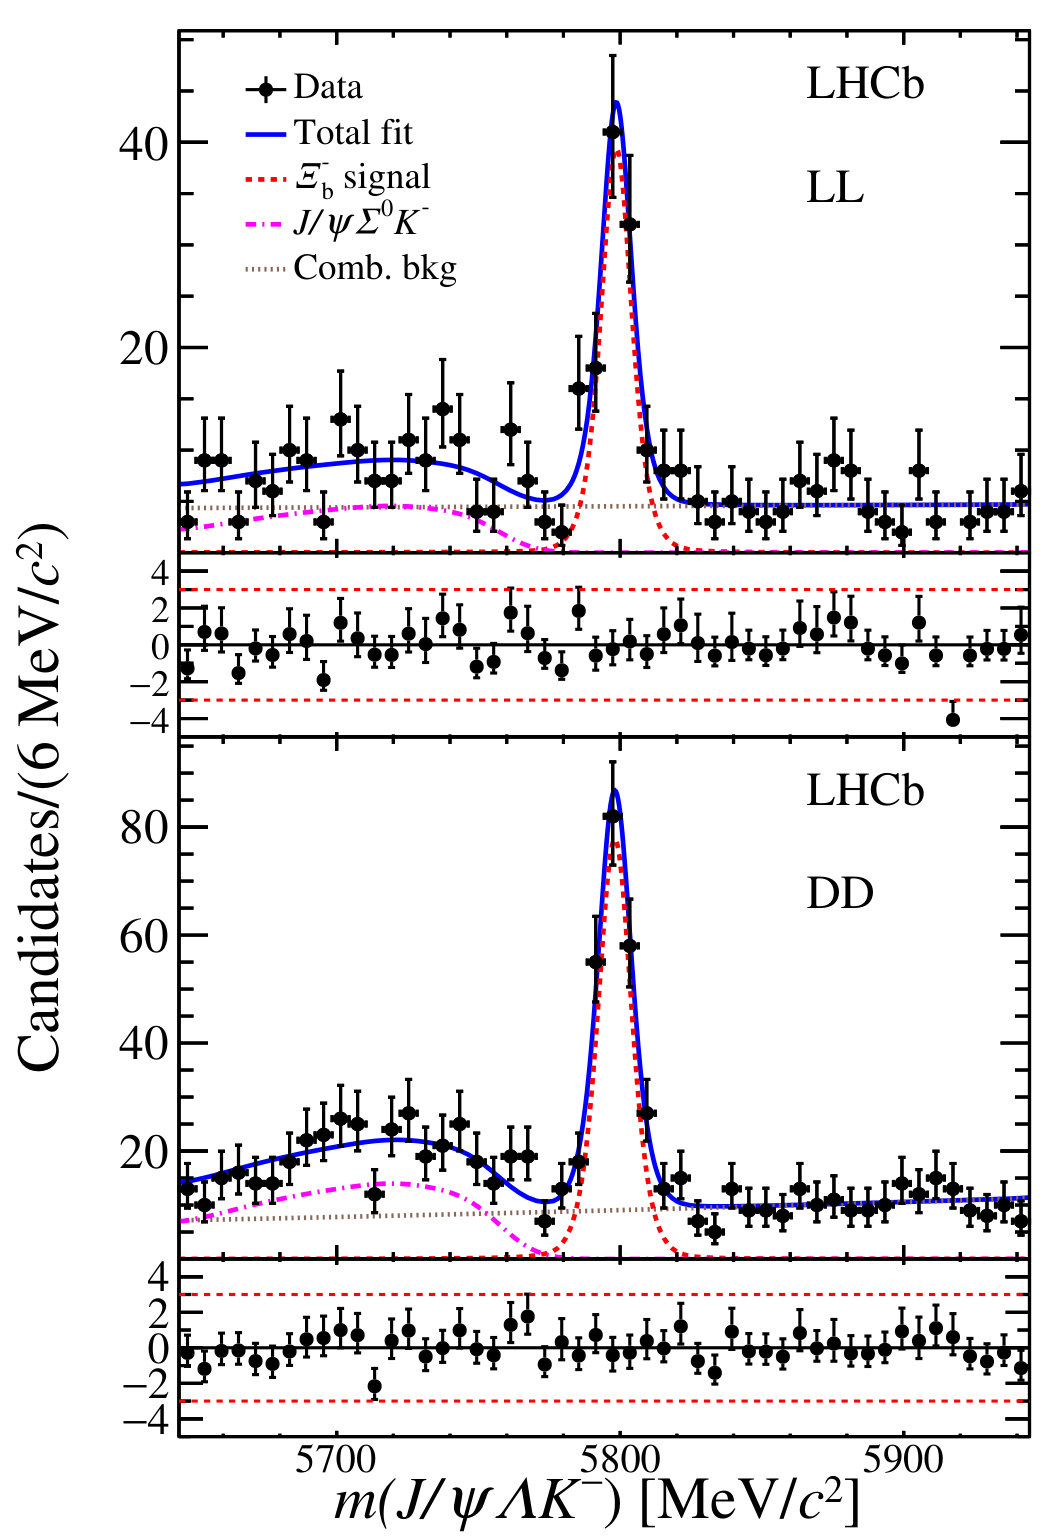 Figure 2
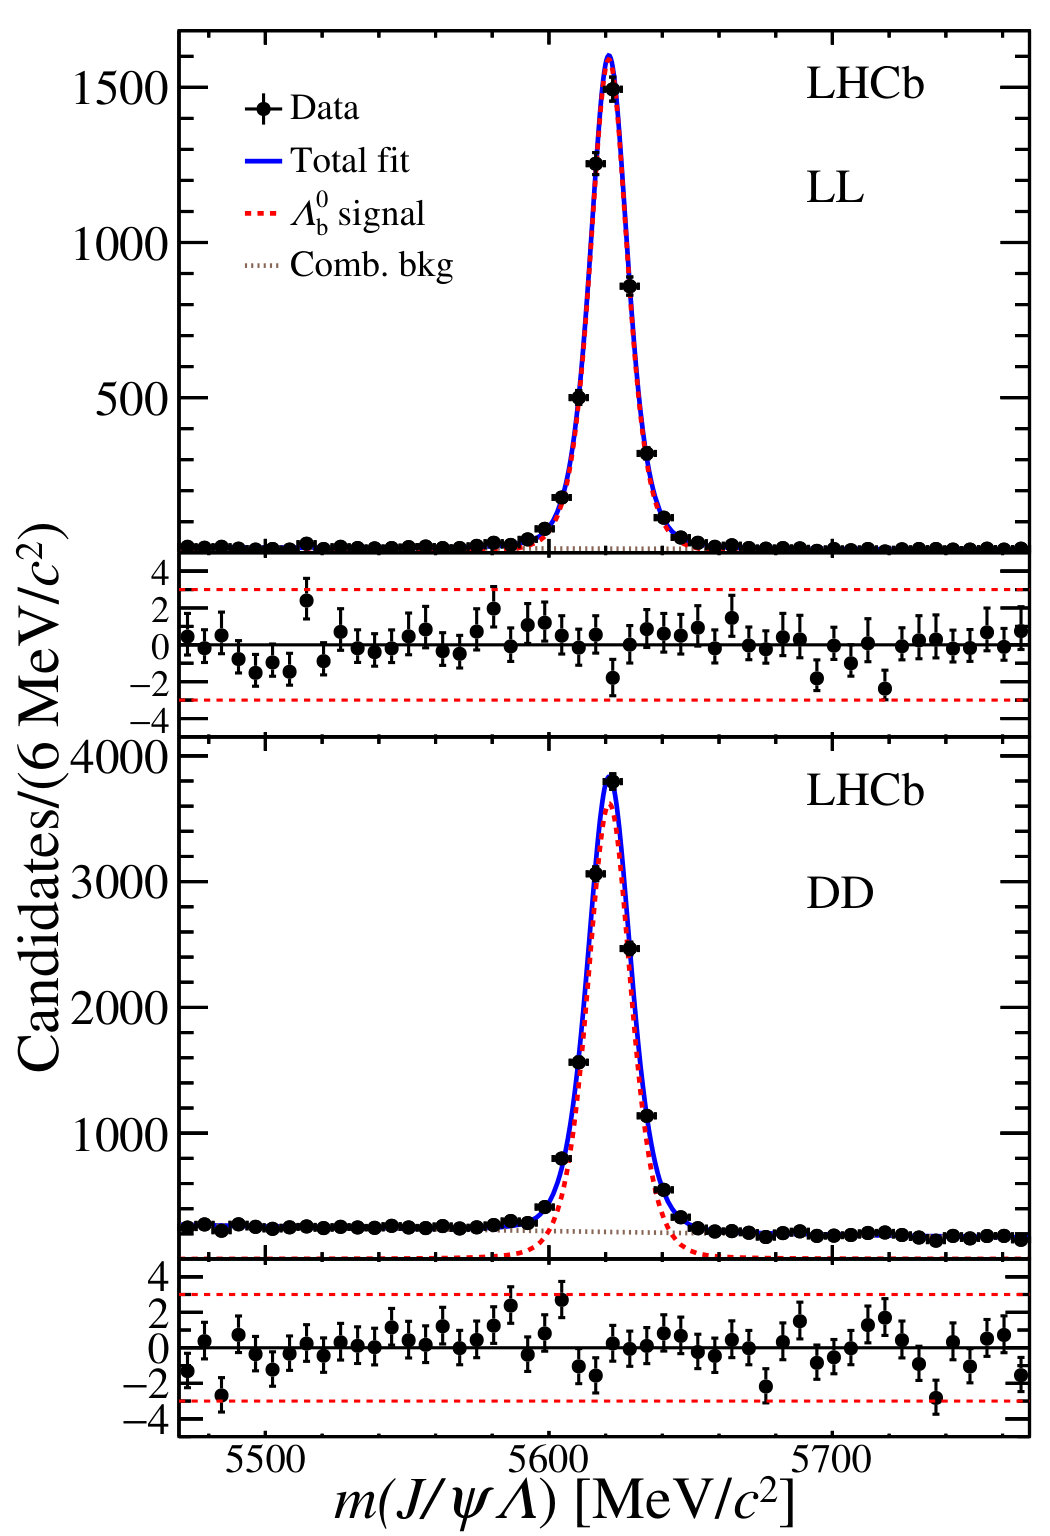 Figure 2
| Source | Uncertainty (%) |
|---|---|
| Signal model | 0.7 |
| Background model | 1.6 |
| BDTG efficiency | 0.1 |
| PID efficiency | 1.0 |
| Tracking efficiency | 1.2 |
| Phase space | 1.5 |
| -baryon kinematics | 1.5 |
| and lifetime | 1.1 |
| Simulation sample size | 0.7 |
| Fixed resolution ratio | 0.6 |
| Total | 3.5 |
Peer Reviews
No public reviews on file for this paper yet. If you reviewed it on a platform where reviews are public (OpenReview, ICLR, NeurIPS, ICML), you can paste yours below so the community can read it here.
Videos
No videos yet. Explain this paper in a talk, walkthrough, or lecture? Add one.
EUROPEAN ORGANIZATION FOR NUCLEAR RESEARCH (CERN)
CERN-EP-2016-318
LHCb-PAPER-2016-053
19 January 2017
Observation of the decay
The LHCb collaboration†††Authors are listed at the end of this Letter.
The observation of the decay is reported, using a data sample corresponding to an integrated luminosity of , collected by the LHCb detector in collisions at centre-of-mass energies of and . The production rate of baryons detected in the decay is measured relative to that of baryons using the decay . Integrated over the -baryon transverse momentum and rapidity , the measured ratio is
[TABLE]
where and are the fragmentation fractions of and transitions, and represents the branching fraction of the corresponding -baryon decay. The mass difference between and baryons is measured to be
[TABLE]
Published in Phys. Lett. B 772 (2017) 265-273
© CERN on behalf of the LHCb collaboration, licence CC-BY-4.0.
1 Introduction
Since the birth of the quark model, the possibility of forming baryonic states from combinations of quarks other than three valence quarks has been considered [1, 2]. For example, states with four quarks and an antiquark, referred to as pentaquarks [3], have been searched for experimentally for many years. As observed with the LHCb detector at the LHC, the distribution of invariant mass of the system in decays shows a narrow peak suggestive of pentaquark formation [4, 5, 6]. (The inclusion of charge conjugate processes is implied throughout the text.) From a six-dimensional amplitude model fit, two pentaquark resonances, decaying into , are observed with large significances [4].
As suggested in Ref. [7], a hidden-charm pentaquark with open strangeness () [8] could be observed as a state in the decay . The decay is similar to , and differs from the latter by exchanging one spectator quark with an spectator quark, as illustrated in Fig. 1 (a). An additional diagram can contribute to the decay, as illustrated in Fig. 1 (b), where the spectator quark forms the meson instead of the baryon.
In this Letter, we present the first observation of the decay. Using the decay as normalisation channel, the production rate of the observed decays relative to that of baryons is measured as
[TABLE]
where and are the and fragmentation fractions, represents the branching fraction of the corresponding -baryon decay, and are the signal yields, and is their relative efficiency. We also present a measurement of the mass difference between the and baryons. Measurements of the mass to date have been obtained using absolute mass measurements and a single measurement of the mass difference [9]. Earlier measurements from the Tevatron [10] are, however, in tension (2.1 standard deviations) with the recent and most precise value from the LHCb experiment [11], obtained from the measurement of . The present analysis offers an opportunity to provide a second precise measurement of using a data sample that is statistically independent of other measurements of the mass from LHCb.
2 Data sample and detector
The measurement is based on a data sample corresponding to 1 of integrated luminosity collected by the LHCb experiment in collisions at 7 centre-of-mass energy in 2011, and 2 at 8 in 2012. The LHCb detector [12, 13] is a single-arm forward spectrometer covering the pseudorapidity range , designed for the study of particles containing or quarks. The detector includes a high-precision tracking system consisting of a silicon-strip vertex detector (VELO) surrounding the interaction region, a large-area silicon-strip detector located upstream of a dipole magnet with a bending power of about , and three stations of silicon-strip detectors and straw drift tubes placed downstream of the magnet. The tracking system provides a measurement of momentum, , of charged particles with a relative uncertainty that varies from 0.5% at low momentum to 1.0% at 200. The minimum distance of a track to a primary vertex (PV), the impact parameter (IP), is measured with a resolution of (15+29/\mbox{p_{\mathrm{T}}}){\,\upmu\mathrm{m}}, where is the component of the momentum transverse to the beam, in . Different types of charged hadrons are distinguished using information from two ring-imaging Cherenkov (RICH) detectors. Photons, electrons and hadrons are identified by a calorimeter system consisting of scintillating-pad and preshower detectors, an electromagnetic calorimeter and a hadronic calorimeter. Muons are identified by a system composed of alternating layers of iron and multiwire proportional chambers.
The online event selection is performed by a trigger [14], which consists of a hardware stage, based on information from the calorimeter and muon systems, followed by a software stage. For this analysis, triggers that select candidates are used for both signal and normalisation channels. The hardware trigger requires at least one muon with \mbox{p_{\mathrm{T}}}>1.48 (), or two muons with \sqrt{\mbox{p_{\mathrm{T}}}(\mu_{1})\mbox{p_{\mathrm{T}}}(\mu_{2})}>1.3 (), in the 2011 (2012) data sample. The subsequent software trigger is composed of two stages, the first of which performs a partial reconstruction and requires either a pair of well-reconstructed, oppositely charged muons having an invariant mass above 2.7, or a single well-reconstructed muon with \mbox{p_{\mathrm{T}}}>1$${\mathrm{\,Ge\kern-1.00006ptV\!/}c} and high IP at all PVs of the event. The second stage of the software trigger requires a pair of oppositely charged muons to form a good-quality vertex that is well separated from all PVs, and which has an invariant mass within \pm 120$${\mathrm{\,Me\kern-1.00006ptV\!/}c^{2}} of the known mass [9].
In the simulation, collisions are generated using Pythia 8 [15, 16] with a specific LHCb configuration [17]. Decays of hadronic particles are described by EvtGen [18], in which final-state radiation is generated using Photos [19]. The interaction of the generated particles with the detector, and its response, are implemented using the Geant4 toolkit [20, *Agostinelli:2002hh] as described in Ref. [22]. The signal decays of and baryons are simulated according to a phase-space model.
3 Selection requirements
The and candidates are reconstructed using the decays and . An offline selection is applied after the trigger, based on a loose preselection, followed by a multivariate classifier based on a Gradient Boosted Decision Tree (BDTG) [23].
In the preselection, the candidates are formed from two oppositely charged particles with \mbox{p_{\mathrm{T}}}>500{\mathrm{\,Me\kern-1.00006ptV\!/}c}, identified as muons and consistent with originating from a common vertex but inconsistent with originating from any PV. The invariant mass of the pair is required to be within of the known mass [9].
The candidates are formed by combining candidate and particles with large , where is defined as the difference in the of the vertex fit for a given PV reconstructed with and without the considered particle. Given the long lifetime of the baryon, its decay vertex can be reconstructed either from a pair of tracks that include segments in the VELO, called long tracks (LL candidates), or from a pair of tracks reconstructed using only the tracking stations downstream of the VELO, called downstream tracks (DD candidates). The invariant mass of the pair is required to be within 4 (6) of the known mass [9] for the LL (DD) candidates. For the LL candidates, both the proton and the pion must have \mbox{p_{\mathrm{T}}}>250{\mathrm{\,Me\kern-1.00006ptV\!/}c}, and pass loose particle identification (PID) criteria based on information provided by the RICH detectors. For the DD candidates, the decay vertex must not be reconstructed in the first half of the VELO. To remove background from decays, the reconstructed mass for the LL (DD) candidate under the hypothesis is required to be more than 4 (10) away from the known mass [9].
The and candidates are formed from a and a candidate, combined with a kaon candidate for the baryon, where the kaon candidate must have \mbox{p_{\mathrm{T}}}>250$${\mathrm{\,Me\kern-1.00006ptV\!/}c} and large . Each reconstructed -baryon candidate is required to have with respect to at least one PV, and is associated to the one which the is smallest. The candidate decay vertex must also have a fit with good and a separation of at least 1.5 from the PV. The angle, , between the -baryon momentum and the vector from the associated PV to the decay vertex must satisfy . For both baryons fiducial cuts of \mbox{p_{\mathrm{T}}}<25$${\mathrm{\,Ge\kern-1.00006ptV\!/}c} and rapidity in the range are required to have a well-defined kinematic region in which the measurement is performed. There are only 0.2% events outside the fiducial kinematic region. A kinematic fit [24] is applied to the and candidates, with the and masses constrained to the known values [9], and the -baryon candidate constrained to point back to its PV. As a result, the mass resolution is improved by 60%, with most of the improvement coming from the constraints on the and masses.
The and candidates passing the preselection are filtered with a BDTG to further suppress the combinatorial background. For the decay, the following discriminating variables are used: the minimum DLLμπ (defined as the difference in the logarithms of the likelihood values from the particle identification systems [25] for the muon and pion hypotheses) and the minimum within the muon pair; the of all other final-state tracks and the baryon; the of the , , and candidates; the decay length and the vertex fit of the candidate; the of the kinematic fit, and the decay time of the baryon. The BDTG is trained on a simulated sample for the signal; data candidates with 5944<m({{J\mskip-3.0mu/\mskip-2.0mu\psi\mskip 2.0mu}}{\mathchar 28931\relax}{K})<6094$${\mathrm{\,Me\kern-1.00006ptV\!/}c^{2}} are used to model the background. The LL and DD samples are trained separately. The optimal working point on the BDTG response and the PID variable of the kaon is determined by maximising the significance of the expected signal, , where () is the expected signal (background) yield in a range corresponding to times the mass resolution at the known mass [9]. The value is calculated as the product of an initial signal yield determined from the data at , and the relative efficiency with respect to the BDTG selection obtained from the simulation. The value of is estimated from the data sidebands. The final BDTG working point has a signal efficiency of 90% (70%) and a background rejection rate of 97% (99%) for LL (DD) samples.
The normalisation channel uses a separate training for the BDTG, where the variables for the meson are excluded. The background training sample is taken from the invariant mass regions with 150<|m({{J\mskip-3.0mu/\mskip-2.0mu\psi\mskip 2.0mu}}{\mathchar 28931\relax})-m_{{{\mathchar 28931\relax}^{0}_{b}}}|<350$${\mathrm{\,Me\kern-1.00006ptV\!/}c^{2}}, where is the known mass [9]. The optimal requirement on the BDTG response for the normalisation mode is the same as for the signal channel. For both samples, in 0.3% of the cases multiple candidates are found, all of which are retained in the analysis.
4 Signal yields
In each of the two categories (LL and DD), a simultaneous extended unbinned maximum likelihood fit to the and candidates’ invariant mass distributions is performed to determine the respective and signal yields. The data, separated by category, and the results of the two fits are shown in Fig. 2.
In the fit of each sample, the signal shape is modelled by a Hypatia function [26]. The mean values and the resolutions of the functions are allowed to vary in the fit, with the ratio of the to mass resolution and the tail parameters fixed to the values obtained from simulation. The combinatorial background is modelled by an exponential function whose parameters are determined by the fit. A partially reconstructed background component, which comes from the decay with , is taken into account in the sample. The shape of this background is determined from simulation, and its yield is free to vary in the fit. In each category, the fit is simultaneously done for the signal and control channels. The fit procedure is validated by large sets of pseudo-experiments.
In the LL samples, the signal yields are found to be and . The corresponding values in the DD samples are and , respectively. The background yields are and in the LL and DD samples, respectively. A likelihood-ratio test is used to estimate the signal significance, where and stand for the likelihood values of the background-only hypothesis and the signal plus background hypothesis, respectively. A fit to the combined data samples of LL and DD categories is performed to estimate the total signal significance. The value of is 464.8. Accounting for two additional parameters associated with the signal component in the fit, this corresponds to a significance of 21 standard deviations [27].
5 Efficiency corrections
The total efficiency of each decay mode consists of the geometrical acceptance of the detector, the efficiencies of the trigger, the reconstruction and selection, and the hadron identification. The first three efficiency factors are determined from samples of simulated events generated within the kinematic region \mbox{p_{\mathrm{T}}}<25$${\mathrm{\,Ge\kern-1.00006ptV\!/}c} and for both baryons. The hadron PID efficiency is determined using calibration data of and decays. Events in the calibration samples are weighted to reproduce the momentum, pseudorapidity and event multiplicity distributions of the hadrons from and decays. The relative efficiency is estimated to be and for the LL and DD samples, respectively, where the uncertainties are statistical only.
Two correction factors are considered for the relative efficiency to account for differences between data and simulation. The LL and DD samples are combined to derive these factors. The first factor accounts for possible local structures in the data distribution due to intermediate states or nonresonant amplitudes that are generally present in multibody decays. An average efficiency is calculated over the two-dimensional phase space of the three-body decay,
[TABLE]
where is the efficiency as a function of the phase-space position obtained from simulation, the numerator represents the number of reconstructed signal candidates, and the denominator represents the efficiency-corrected number of signal candidates; in both cases the sum extends over all candidates in data. The event-by-event signal weight (), is obtained using the sPlot technique [28] to subtract the background contribution. The average efficiency is 98% relative to the efficiency obtained using the phase-space simulation.
The second factor accounts for possible differences in and rapidity spectra in -baryon production in data and simulation. The simulated samples are reweighted in bins of and rapidity, in order to reproduce the data distribution of decays, and the relative efficiency is recalculated. The correction factor of this source is . The value is consistent if separately correcting for the LL and DD samples. The product of the two correction factors for the average efficiency is . The uncertainties in the correction factors are taken as systematic uncertainties discussed below.
6 Results of and systematic uncertainties
Using the yields and efficiencies with corrections, the ratios of for the LL and DD data sets are measured to be and , respectively, where the uncertainties are statistical only. The two independent measurements are consistent with each other. Their weighted average yields . Whenever two uncertainties are quoted, the first is statistical and the second is systematic.
The sources of systematic uncertainties for the ratio are summarised in Table 1. The quoted values are averages over the LL and DD categories. The uncertainty on the relative yields is evaluated by using alternative functions to model each of the fit components. These include changing the signal model from the Hypatia function to a double-sided Crystal Ball function [29], changing the combinatorial background model from the exponential function to a second-order polynomial, and varying the parametrisation of the background. The effect of the latter is found to be negligible. To reduce the statistical fluctuations in the estimate of the systematic uncertainties, large numbers of pseudoexperiments are performed. The parameters of the alternative model are used to generate experiments, which are then fitted by both the alternative and the default models. A Gaussian function is fitted to the distribution of the difference for these pseudoexperiments and the mean value is assigned as a systematic uncertainty.
There are several sources of systematic uncertainty related to the evaluation of the relative efficiency. Most of them cancel in the ratio of efficiencies, except those related to the additional kaon in the decay. The BDTG input variables for background-subtracted data are compared to the corresponding simulated distributions, and all of the variables, except for the vertex-fit and for candidates in the DD category, are well modelled. The simulation is then smeared for these two variables to match the data, and the small change of 0.1% in the relative efficiency is taken as systematic uncertainty. The uncertainty due to the kaon PID efficiency is studied by changing the binning scheme in momentum, pseudorapidity and event multiplicity. The alternative binning gives a 1.0% difference in the signal efficiency, which is assigned as a systematic uncertainty. The tracking efficiency is estimated from simulation and calibrated with the data [30]; an uncertainty of 0.4% is assigned for the kaon track. An additional systematic uncertainty of 1.1% is assigned to the kaon tracking efficiency due to an imperfect knowledge of the material budget in the detector [5]. It is estimated from simulation by changing the used interaction length in the detector by 10%. The total tracking-efficiency related systematic uncertainty, adding the two contributions in quadrature, is 1.2%.
The systematic uncertainty of the average efficiency defined in Eq. (2) is 1.5%, calculated by propagating the statistical uncertainties for the efficiencies over the phase space. In reweighting the simulated and spectra to match the data, an uncertainty of 1.5% is estimated by varying the weights for each kinematic bin by its uncertainty. The uncertainties in the lifetime of 1.468\pm 0.012$${\mathrm{\,ps}} [31] and the lifetime of 1.57\pm 0.04$${\mathrm{\,ps}} [9], result in relative changes of and in the efficiencies, respectively. The limited size of the simulated samples gives rise to an uncertainty of 0.7%. Varying the mass resolution ratios of the to mass peaks, which are fixed in the nominal fit to the data, results in an uncertainty of 0.6%. The uncertainty due to the trigger efficiency is cancelled between the signal and control modes, as the trigger requirements are imposed only on the muon pairs. Finally, the total relative systematic uncertainty is 3.5%, obtained by adding all of the above contributions in quadrature.
7 Measurement of the mass difference
The mass difference, , is obtained from a single simultaneous fit to four mass distributions, consisting of the LL and DD samples for both the and candidates. The ratio is also a freely varying parameter in this second fit for . Compared to the fits described in the previous section, the new fit has two less free parameters: for each of the categories, is constrained to be the same value and is replaced by . The simultaneous fit gives the same result as the weighted average for the ratio , and the mass difference is measured to be
[TABLE]
This measurement is of similar precision to and consistent with the previous LHCb result \delta M=178.36\pm 0.46\pm 0.16$${\mathrm{\,Me\kern-1.00006ptV\!/}c^{2}} using and decays [11]. The two results are combined to obtain \delta M=177.73\pm 0.33\pm 0.14$${\mathrm{\,Me\kern-1.00006ptV\!/}c^{2}}, where the correlations between the systematic uncertainties described below are properly taken into account.
Various sources of systematic uncertainty are considered for the mass difference measurement. The effect of the momentum scale uncertainty of 0.03% [32] leads to an uncertainty of 0.13. Because the signal mode has one more particle than the normalisation channel, the correction for energy loss in the detector material leads to an additional uncertainty of 0.06 [32, 11]. The above two sources are fully correlated with the previous measurement using and decays [11]. Uncertainties due to the signal and background modelling are 0.06 and 0.02, respectively, estimated by considering alternative functions as discussed in Sec. 6.
8 Conclusion
In conclusion, we report the first observation of the decay with a data sample of collisions corresponding to an integrated luminosity of 3. The observed signal yield is . In the kinematic region of the -baryon transverse momentum \mbox{p_{\mathrm{T}}}<25$${\mathrm{\,Ge\kern-1.00006ptV\!/}c} and rapidity in the range , the production rate of with decays relative to that of decays is measured to be
[TABLE]
where is the ratio of the fragmentation fraction for and transitions. The mass difference between and baryons is measured to be
[TABLE]
A combination of this value with the previous LHCb measurement from and decays [11] leads to the most precise value of the mass difference
[TABLE]
With the full data sample accumulated before the long shutdown of the LHC in 2018, it should be possible to apply a full amplitude analysis to the decay to search for hidden-charm pentaquarks with open strangeness.
Acknowledgements
We express our gratitude to our colleagues in the CERN accelerator departments for the excellent performance of the LHC. We thank the technical and administrative staff at the LHCb institutes. We acknowledge support from CERN and from the national agencies: CAPES, CNPq, FAPERJ and FINEP (Brazil); NSFC (China); CNRS/IN2P3 (France); BMBF, DFG and MPG (Germany); INFN (Italy); FOM and NWO (The Netherlands); MNiSW and NCN (Poland); MEN/IFA (Romania); MinES and FASO (Russia); MinECo (Spain); SNSF and SER (Switzerland); NASU (Ukraine); STFC (United Kingdom); NSF (USA). We acknowledge the computing resources that are provided by CERN, IN2P3 (France), KIT and DESY (Germany), INFN (Italy), SURF (The Netherlands), PIC (Spain), GridPP (United Kingdom), RRCKI and Yandex LLC (Russia), CSCS (Switzerland), IFIN-HH (Romania), CBPF (Brazil), PL-GRID (Poland) and OSC (USA). We are indebted to the communities behind the multiple open source software packages on which we depend. Individual groups or members have received support from AvH Foundation (Germany), EPLANET, Marie Skłodowska-Curie Actions and ERC (European Union), Conseil Général de Haute-Savoie, Labex ENIGMASS and OCEVU, Région Auvergne (France), RFBR and Yandex LLC (Russia), GVA, XuntaGal and GENCAT (Spain), Herchel Smith Fund, The Royal Society, Royal Commission for the Exhibition of 1851 and the Leverhulme Trust (United Kingdom).
The reference list from the paper itself. Each links out to its DOI / PubMed record.
- 1[1] M. Gell-Mann, A schematic model of baryons and mesons , Phys. Lett. 8 (1964) 214 · doi ↗
- 2[2] G. Zweig, An SU 3 model for strong interaction symmetry and its breaking , CERN-TH-401, 1964
- 3[3] H. J. Lipkin, New possibilities for exotic hadrons - anticharmed strange baryons , Phys. Lett. B 195 (1987) 484 · doi ↗
- 4[4] LH Cb collaboration, R. Aaij et al. , Observation of J / ψ p 𝐽 𝜓 𝑝 {{J\mskip-3.0mu/\mskip-2.0mu\psi\mskip 2.0mu}}{p} resonances consistent with pentaquark states in Λ b 0 → J / ψ p K − → subscript superscript Λ 0 𝑏 𝐽 𝜓 𝑝 superscript 𝐾 {{\mathchar 28931\relax}^{0}_{b}}\rightarrow{{J\mskip-3.0mu/\mskip-2.0mu\psi\mskip 2.0mu}}{p}{{K}^{-}} decays , Phys. Rev. Lett. 115 (2015) 072001 , ar Xiv:1507.03414 · doi ↗
- 5[5] LH Cb collaboration, R. Aaij et al. , Study of the productions of Λ b 0 subscript superscript Λ 0 𝑏 {{\mathchar 28931\relax}^{0}_{b}} and B ¯ 0 {{\kern 1.79993 pt\overline{\kern-1.79993 pt B}{}}{}^{0}} hadrons in p p 𝑝 𝑝 {p}{p} collisions and first measurement of the Λ b 0 → J / ψ p K − → subscript superscript Λ 0 𝑏 𝐽 𝜓 𝑝 superscript 𝐾 {{\mathchar 28931\relax}^{0}_{b}}\rightarrow{{J\mskip-3.0mu/\mskip-2.0mu\psi\mskip 2.0mu}}{p}{{K}^{-}} branching fraction , Chin. Phys. C 40 · doi ↗
- 6[6] LH Cb collaboration, R. Aaij et al. , Model-independent evidence for J / ψ p 𝐽 𝜓 𝑝 {{J\mskip-3.0mu/\mskip-2.0mu\psi\mskip 2.0mu}}{p} contributions to Λ b 0 → J / ψ p K − → subscript superscript Λ 0 𝑏 𝐽 𝜓 𝑝 superscript 𝐾 {{\mathchar 28931\relax}^{0}_{b}}\rightarrow{{J\mskip-3.0mu/\mskip-2.0mu\psi\mskip 2.0mu}}{p}{{K}^{-}} decays , Phys. Rev. Lett. 117 (2016) 082002 , ar Xiv:1604.05708. · doi ↗
- 7[7] H.-X. Chen et al. , Looking for a hidden-charm pentaquark state with strangeness S=−1 from Ξ b − subscript superscript Ξ 𝑏 {{\mathchar 28932\relax}^{-}_{b}} decay into J / ψ K − Λ 𝐽 𝜓 superscript 𝐾 Λ {{J\mskip-3.0mu/\mskip-2.0mu\psi\mskip 2.0mu}}{{K}^{-}}{\mathchar 28931\relax} , Phys. Rev. C 93 (2016) 065203 , ar Xiv:1510.01803 · doi ↗
- 8[8] J.-J. Wu, R. Molina, E. Oset, and B. S. Zou, Prediction of narrow N ∗ superscript 𝑁 N^{*} and Λ ∗ superscript Λ \mathchar 28931\relax^{*} resonances with hidden charm above 4 Ge V , Phys. Rev. Lett. 105 (2010) 232001 , ar Xiv:1007.0573 · doi ↗